
Abstract
Accidents involving collisions of heavy-duty trucks with highway bridge piers occurred occasionally, in which the bridge piers might be subjected to severe damage, and cause the collapse of the superstructure due to the loss of axial loading capacity. The existing researches are mostly concentrated on the light- or medium-duty trucks. This article mainly concerns about the collisions between the heavy-duty trucks (e.g. tractor-trailer) and bridge piers as well as the evaluation of the impact force. First, by modifying the finite element model of Ford F800 single-unit truck, which was developed by National Crash Analysis Center, the finite element model of a tractor-trailer is established. Then, the full-scale tractor-trailer crash test on concrete-filled steel pier jointly conducted by Texas Transportation Institute, Federal Highway Administration, and Texas Department of Transportation is numerically simulated. The impact process is well reproduced and the established model is validated by comparison of the impact force. It indicates that the tractor-trailer impact force time history consists of two or three peaks and the corresponding causes are revealed. Furthermore, the parametric influences on the impact force are discussed, including the diameter and cross section shape of the pier, cargo weight, impact velocity, relative impact position, and vehicle type. Finally, the finite element model of an actual reinforced concrete highway bridge pier is established, and the impact force and lateral displacement of the pier subjected to the impact of the tractor-trailer are numerically derived and discussed.
Introduction
Bridge is an important part of transportation, and the accidental truck collision is a significant threat to bridge safety. Harik et al. (1990) classified 114 bridge failures occurred in the United States from 1951 to 1988, and 15% of them were caused by truck collisions. Wardhana and Hadipriono (2003) studied 503 failures of bridge structures from 1989 through 2000, and 12% of them resulted from the vehicular impact. Under the vehicle collisions, since the bridge pier is one of the most vulnerable parts of bridge structures, it might suffer severe damage and then cause the collapse of the superstructure due to the loss of axial loading capacity. For example, in the accident that took place in May 2003 on highway I-80 in Nebraska, a semitrailer crashed into the median support of a bridge crossing, causing the collapse of the overpass and the driver was killed on the spot (El-Tawil et al., 2005). Another two collision accidents occurred, respectively, in May 2004 on highway IH-37 in Texas (Buth et al., 2010) and August 2007 on highway I-70 in Colorado (Gallegos and McPhee, 2016), in which the bridge piers were severely damaged. Figure 1 shows the photos from the scene of above three accidents.
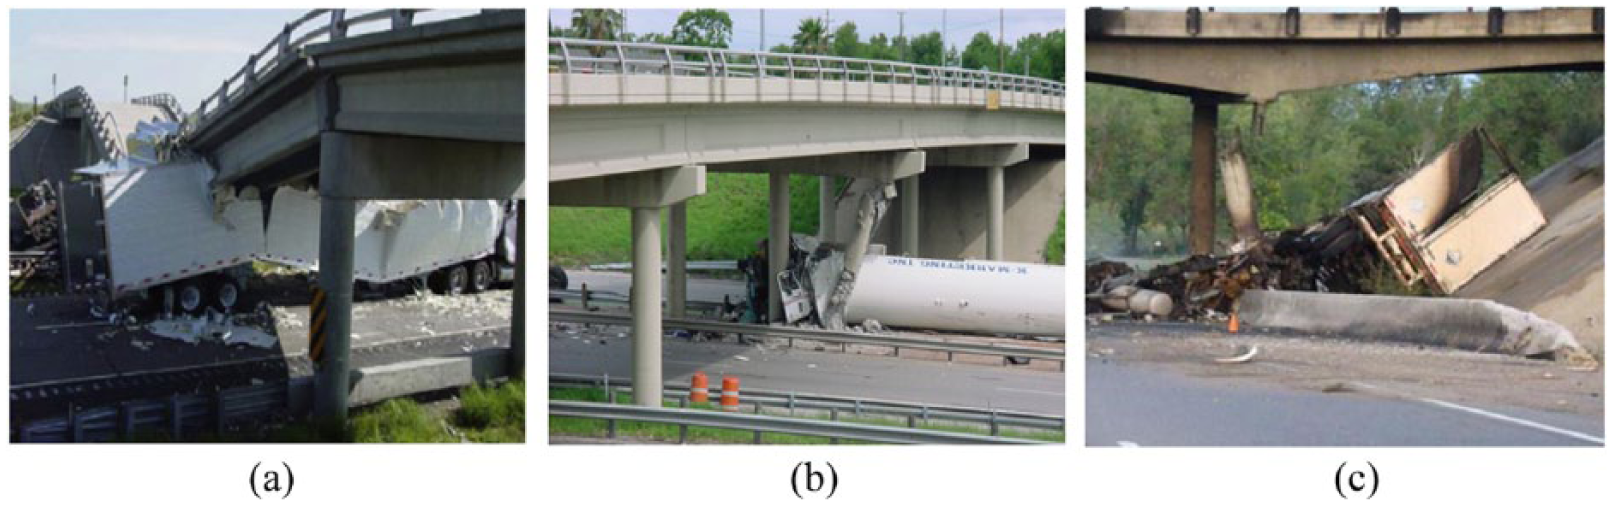
Truck collision accidents: (a) I-80 in Nebraska (El-Tawil et al., 2005), (b) IH-37 in Texas (Buth et al., 2010), and (c) I-70 in Colorado (Gallegos and McPhee, 2016).
Therefore, it is necessary to consider the effect of vehicle collision during the design of bridge piers, which is commonly involved in the design guidelines for bridges in different countries. For instance, provisions regarding vehicle collision in European Committee for Standardization (CEN) BS EN1991-1-7:2006 (2006) specify that the impact force acting on bridge piers should be designed according to the road type and multiplied by an adjustment coefficient determined by risk assessment. The AASHTO-LRFD (American Association of State Highway and Transportation Officials (AASHTO), 2012) vehicle collision provisions recommend that the design of bridge piers should take vehicle collision into consideration if the piers are located within a distance of 9.14 m to the edge of roadway. The equivalent static impact force should be designed as 2668.93 kN, which acts at a distance of 1.52 m above ground and in a direction of 0°–15° with the edge of the pavement in a horizontal plane. The Chinese code Ministry of Communications of PRC JTG D60-2015 (2015) specifies that the design vehicular impact force should be set as 1000 and 500 kN parallel and perpendicular to the driving direction, and the above forces in the two directions are not allowed to be considered simultaneously.
As for the vehicle collision test, Popp (1961) carried out 13 full-scale truck collision tests on steel and reinforced concrete columns, in which the gross weight of the experimental trucks varied within 8.7–24.0 t, and the impact velocity ranged from 50.0 to 84.3 km/h. It was found that the peak dynamic impact force could reach 2.7 times the static loads at failure. Buth et al. (2011) conducted two full-scale crash tests between a 36-t tractor-trailer and an instrumented concrete-filled steel bridge pier, the dynamic impact force was measured and a calculation method for deriving the equivalent static design force was recommended accordingly. Chen et al. (2016) designed an equivalent truck frame, which was made of steel elements and blocks, to simulate the collision between a medium-duty truck and a RC bridge pier. Drop-weight impact test of the above equivalent steel frame on RC beam was conducted and the corresponding numerical simulations were performed to validate the overall similarity between the frame and the reference medium-duty truck.
Comparably, finite element (FE) analysis is an economical and effective method to study the complex vehicle collision process. El-Tawil et al. (2005) conducted numerical simulations of the collisions between two trucks and reinforced concrete columns. The two truck models included a 1.4-t Chevy truck and a 6.7-t Ford truck, which represented the typical light- and medium-duty truck, respectively. By analyzing the peak dynamic impact force (PDF) and the corresponding equivalent static force (ESF), it was concluded that the impact force specified in AASHTO-LRFD bridge design provisions could be non-conservative for potential crash scenarios. Buth et al. (2010) performed FE analyses involving two truck models (a tractor-trailer and a modified single-unit truck) impacting on rigid piers, and a parametric study was then performed to analyze the effects of pier diameter, cargo, and impact velocity on the impact force. Abdelkarim and ElGawady (2016, 2017) numerically studied the medium-duty truck collisions with the reinforced concrete bridge columns and hollow-core fiber-reinforced polymer-concrete-steel columns, respectively. The PDF and ESF were evaluated through the extensive parametric studies, and it was found that the recommended ESF of the AASHTO-LRFD could be non-conservative for heavy or high-speed vehicle collisions. Sharma et al. (2012) introduced two heavy-duty truck models to numerically study the dynamic shear force capacity of RC columns under truck collisions. Compared with the test tractor-trailer in Buth et al. (2011), the above two heavy-duty truck models have shorter length and lower height. For example, the length and height of the heavy-duty truck FIAT IVECO F180NC in Sharma et al. (2012) are 8.38 and 2.68 m, while those of the test tractor-trailer in Buth et al. (2011) are 19.8 and 3.89 m, respectively.
Besides, several works were concentrated into the simplified calculation approaches. Al-Thairy and Wang (2014) used a simplified numerical model to simulate vehicular frontal collisions with steel columns. The vehicle was regarded as a spring-mass system, and collisions between three steel columns and the full-scale and simplified vehicle models are numerically studied. By comparing the load–deformation relationship of the vehicle and axial load ratio-critical velocity dependence of the steel columns, the simplified vehicle model was validated. Chen et al. (2015, 2017) proposed and validated a reduced CMSD (coupled mass-spring-damper) model for vehicular collision, and the response spectra for the peak impact forces caused by the engine and cargo was further developed.
Compared with the light- and medium-duty trucks, heavy-duty trucks usually have larger vehicle length, width and height, size and weight of the engine and the cargo, wheel base, and so on, which would induce higher impact force and cause the greater damage to the structures. For instance, weights of the engine and the cargo will affect the peak values of the impact force, and wheel base has an effect on the time interval between the peak impact forces. It is improper to study the heavy-duty truck collisions through using the medium-duty truck models with the changed cargo weight. Therefore, it is strongly necessary to design the bridge piers considering the heavy-duty truck collisions. However, due to the lack of systematic crash test and the validated publicly available heavy-duty truck model, the related studies on the impact force are limited.
In this article, the impact force between a heavy-duty truck and bridge pier is numerically studied. First, in section “Tractor-trailer collision test,” the full-scale tractor-trailer crash test jointly conducted by TTI (Texas Transportation Institute), FHWA (Federal Highway Administration), and TxDOT (Texas Department of Transportation) is introduced. Second, in section “FE model,” the FE model of the tractor-trailer is established based on the FE model of Ford F800 single-unit truck, which was developed by FHWA in National Crash Analysis Center (NCAC). Then, in section “Model validations,” the impact process of the tractor-trailer on a concrete-filled steel pier is numerically reproduced using FE program LS-DYNA (2007), and the established FE model is validated through comparisons with the experimental impact force. Furthermore, in section “Parametric study,” the parametric influences including the diameter and cross section shape of the pier, cargo weight, impact velocity, relative impact position, and vehicle type on the impact force are discussed. Finally, by establishing the FE model of an actual reinforced concrete highway bridge pier, the impact force and lateral displacement of the pier against the tractor-trailer impact are numerically derived and discussed.
Tractor-trailer collision test
In 2010, TTI, FHWA, and TxDOT collaborated to conduct two full-scale collision tests (I and II), in which a 36-t heavy-duty tractor-trailer loaded with the pocketed sand (the curb weight of the unladen tractor-trailer is 16.4 t) collided with an instrumental concrete-filled steel bridge pier with a diameter of 0.91 m and a height of 4.27 m (Buth et al., 2011). The two tests were originally intended to align the centerline of the tractor-trailer with that of the pier, while the tractor-trailer veered the desired line for 0.6 m prior to the collision in test I. Thus, the frontal normal collision test II is adopted at present. The tractor-trailer and the instrumented bridge pier used in test II are shown in Figure 2(a). Aiming to derive the impact force, two load cells were connected to the pier and supported by a steel frame which was anchored into a concrete foundation. After the collision, the tractor-trailer was badly damaged and the pier sustained little damage, as illustrated in Figure 2(b).
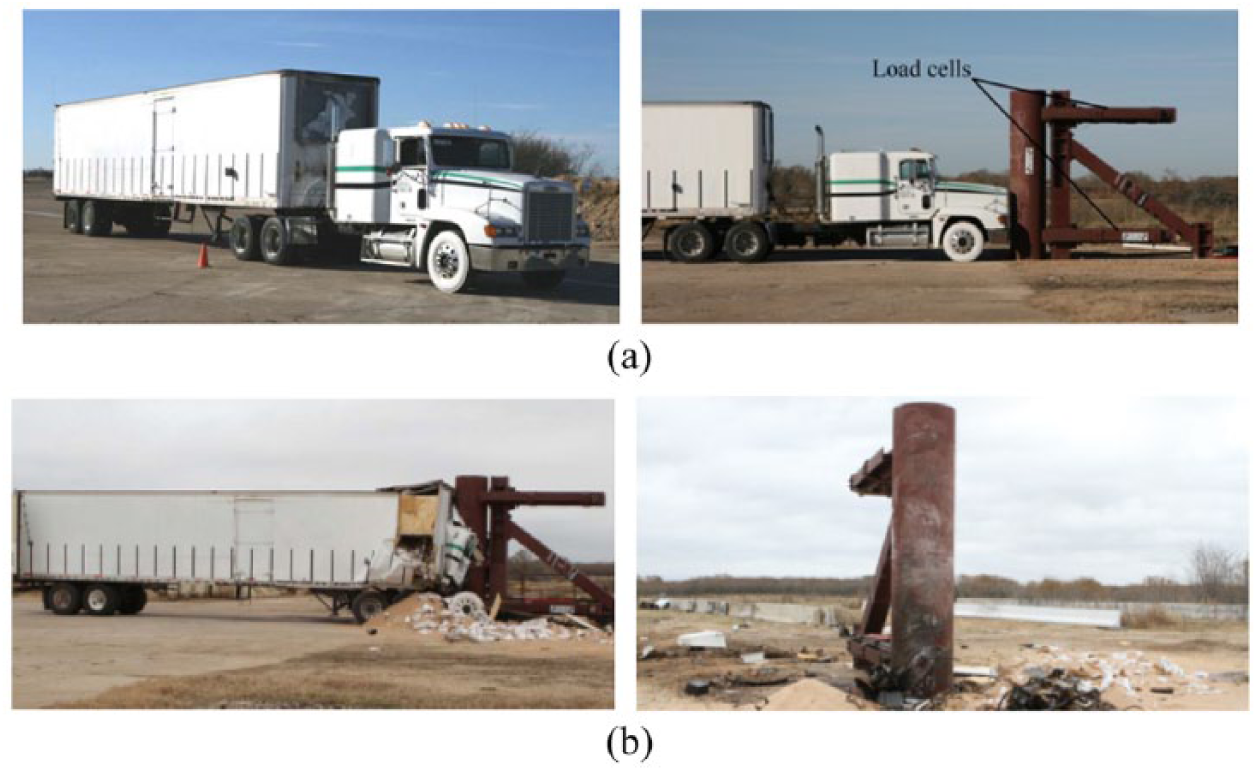
Tractor-trailer and bridge pier (a) before and (b) after the test II (Buth et al., 2011).
FE model
FE model of tractor-trailer
Figure 3 shows the FE model of the Ford F800 single-unit truck downloaded from the NCAC website. It is 8.5 m in length, 8 t in gross weight, and 5.3 m in wheelbase. The whole model consists of 886 solid elements, 33,863 shell elements, and 548 beam elements. The cargo loaded on the pallets and the engine part (engine, bell housing, and transmission) are all modeled by elastic material. The densities of the cargo, engine, bell housing, and transmission are 313.6, 4120, 3200, and 2200 kg/m3 and the corresponding elastic modulus are 2000 MPa, 110 GPa, 200 GPa, and 200 GPa, respectively. The main frame of the chassis system is made of merchant steel with an elastic modulus of 205 GPa and a yield stress of 385 MPa, which is modeled using shell elements.
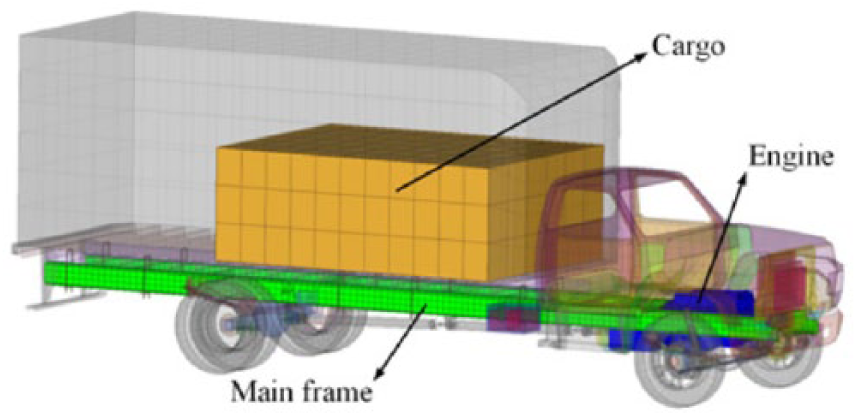
Ford F800 single-unit truck model (version 0.2, 2008; NCAC, 2012).
Based on the information provided by the crash test (Buth et al., 2011) and by utilizing the FE pre-processor HyperMesh, the above F800 model is modified to establish an FE model of the tractor-trailer in the crash test.
Tractor part
Considering the relatively large element size of the original model, the elements of the tractor are split into one-quarter the size of the original size after adding a compartment behind the cab according to the test tractor-trailer. Then, the HyperMorph function is used to adjust the shape of the cab and the bonnet. Elements with large distortion and the connections between different components are checked and improved. In addition to the fully integrated solid elements of the engine, the vast majority of the remaining components are shell elements. Figure 4 shows the comparison of the FE models of the tractor part between the prototype and modified model. It should be noted that information of the engine, for example, shape and size, is very limited in the test report (Buth et al., 2011). From Buth et al. (2010), it can be seen that the engines of the test tractor-trailer and the F800 are similar in shape and different in size. Therefore, the engine shape of the tractor-trailer FE model remains unchanged. The 2001 Freightliner FLD tractor was used in the present test and the 12.7L Detroit Diesel (1.2 t) is commonly used in the 2000/2001/2002 Freightliner FLD120 tractor, thus the engine weight of the present tractor-trailer model is correspondingly increased up to 1.2 t.
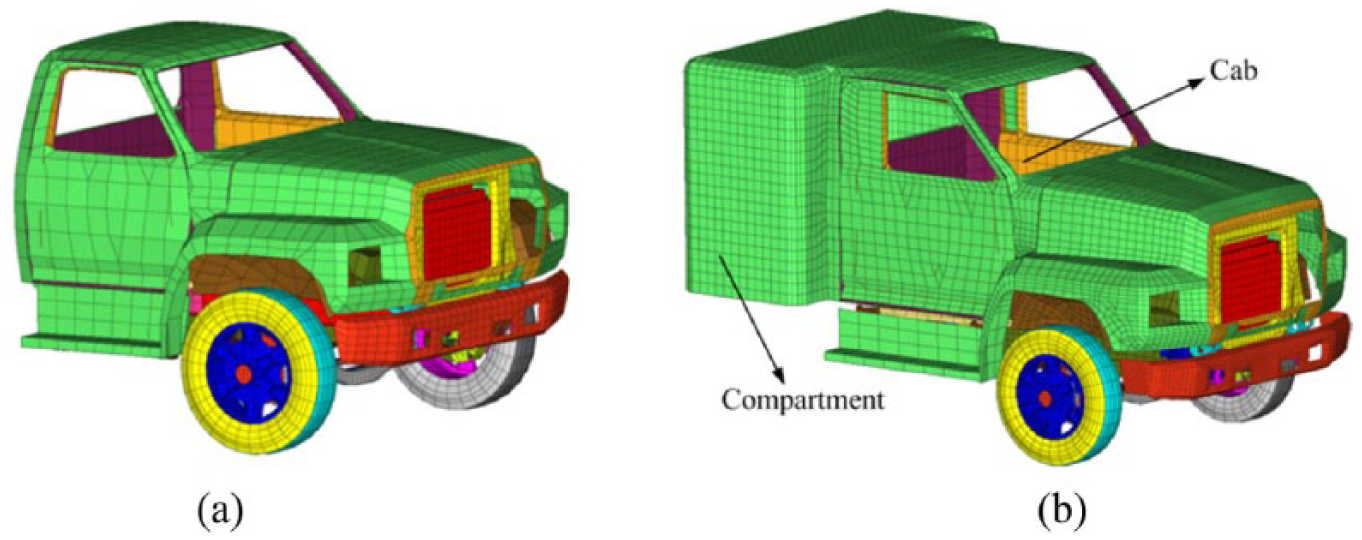
Comparison of the tractors: (a) F800 and (b) tractor-trailer.
Trailer part
The prototype is a medium-duty truck model, the truck bed of which is quite different from the present trailer. Therefore, the original truck bed is deleted and a new trailer model is added, which includes truck bed, frame, tires, and so on. The original frame of chassis system is shortened and linked with the trailer through the Z-shape steel beams. Apart from the constant stress solid elements of the cargo, the rest of the components are all shell elements. Figure 5 shows the comparison of the FE models of the trailer part between the prototype and modified model.

Comparison of the trailers: (a) F800 and (b) tractor-trailer.
Figure 6 illustrates the established FE model of the tractor-trailer. The complete tractor-trailer model has a total length of 19.8 m and a gross weight of 36 t, and it consists of 13,737 solid elements, 65,895 shell elements, and 368 beam elements. The unladen weight of the test tractor-trailer is 16.4 t while that of the present FE model is 17 t, and the deviation is 3.7%. The graphical representation of the test vehicle is given in Figure 7. The exterior dimensions of the test tractor-trailer, as well as the FE models of tractor-trailer and Ford F800, are listed in Table 1, from which rather good consistence between the actual vehicle and FE model of tractor-trailer can be observed.
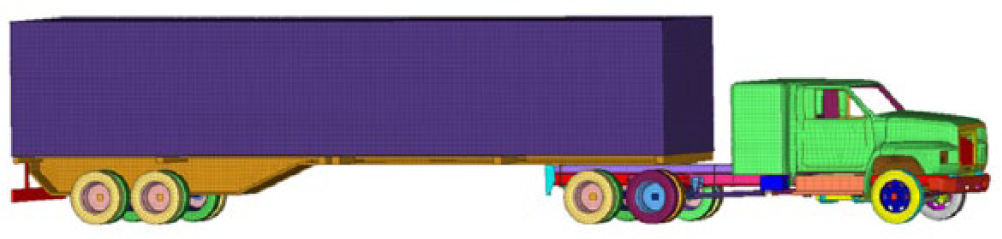
FE model of the tractor-trailer.
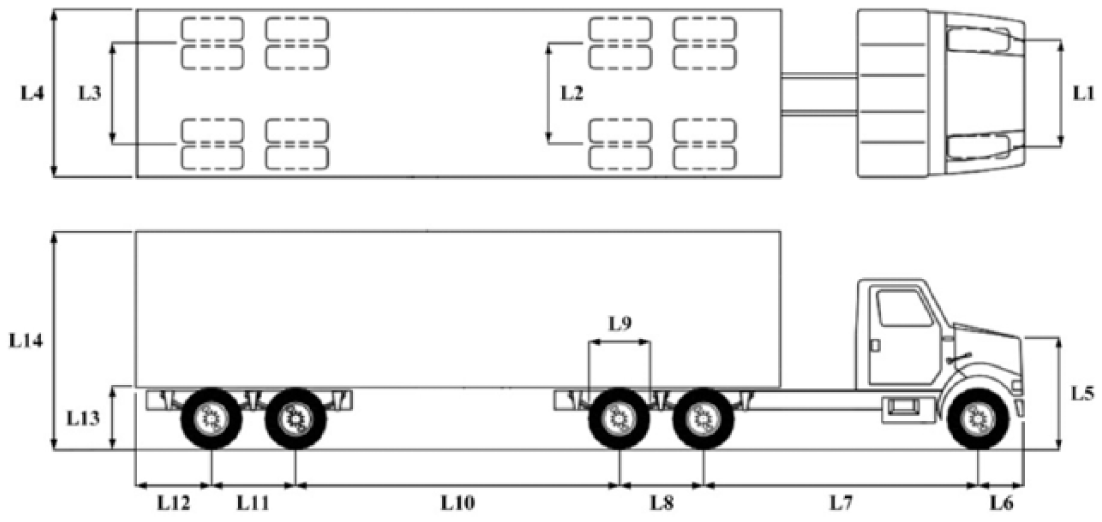
Exterior dimensions of the tractor-trailer (Buth et al., 2011).
Comparisons of dimensions between the test tractor-trailer and FE models (unit: mm).
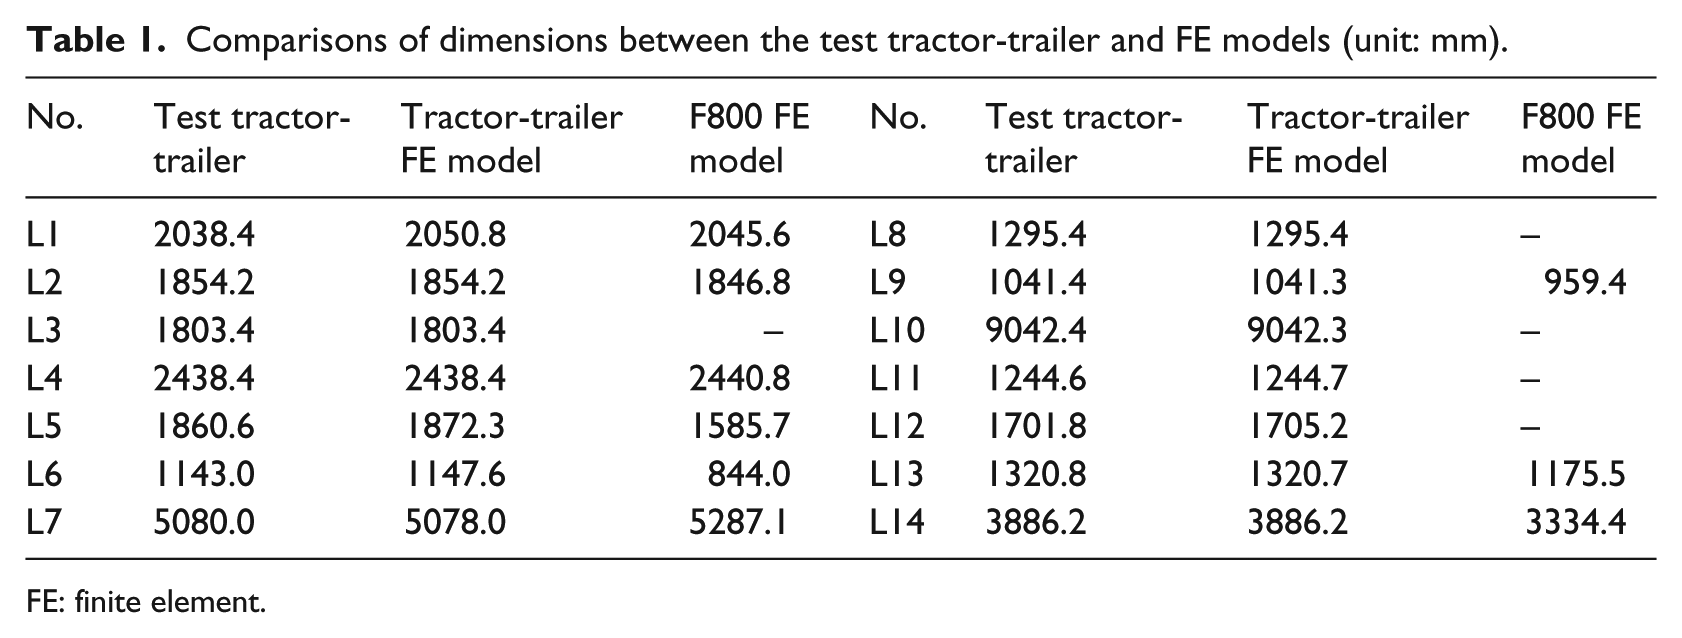
FE: finite element.
FE model of concrete-filled steel pier
FE model of the experimental bridge pier is shown in Figure 8, in which the infilled concrete is not displayed to illustrate the reinforcing details. The pier is 4.27 m in height and 0.91 m in outer diameter. The tube is fabricated from 25.4-mm-thick A53 Grade B steel, and another 120° 25.4-mm-thick A53 Grade B steel arch of tube is welded to the inner surface of the pier for strengthening. To support the compression arms, two rib plates with 38.1 mm thick are welded vertically inside the pier. The concrete and steel tube/plate are modeled by constant stress solid element and Belytschko-Tsay shell element, respectively. The 18 longitudinal reinforcements with a diameter of 8 mm are equally distributed within the enclosed transverse reinforcements, and the diameter and spacing of the stirrup are 4 and 152.4 mm, respectively. Hughes-Liu beam element is adopted to model the reinforcements. The pier model has 4300 solid elements, 2400 shell elements, and 954 beam elements in total.

FE model of the concrete-filled steel pier.
Constitutive models
Most of the steel in the tractor-trailer model and the steel tube are described by the MAT_PIECEWISE_LINEAR_PLASTICITY (MAT#24) model. The density, Young’s modulus, Poisson’s ratio, yield stress, and tangent modulus of the steel tube material model are 7850 kg/m3, 200 GPa, 0.3, 245 MPa and 1.2 GPa, respectively. The engine, which is a major factor affecting the impact force, has a high rigidity and suffers minor damage after the collision test. Thus, it is treated as elastic material and the constitutive model of MAT_ELASTIC (MAT#1) is adopted, and the corresponding material parameters are identical with those used in F800 model, as mentioned in section “FE model of tractor-trailer.” The MAT_CONCRETE_DAMAGE_REL3 (MAT#72R3) model involving damage and strain-rate effects is adopted to describe the infilled concrete material, with the density and Poisson’s ratio are 2400 kg/m3 and 0.19, respectively. Based on the compressive strength of 34.47 MPa, the other model parameters are generated automatically by the embeded algorithm in program LS-DYNA (2007). Under the impact loadings, the compressive and tensile strain-rate effects are considered to obey the Comité Euro-Internationale du Béton (CEB, 1990) recommendations.
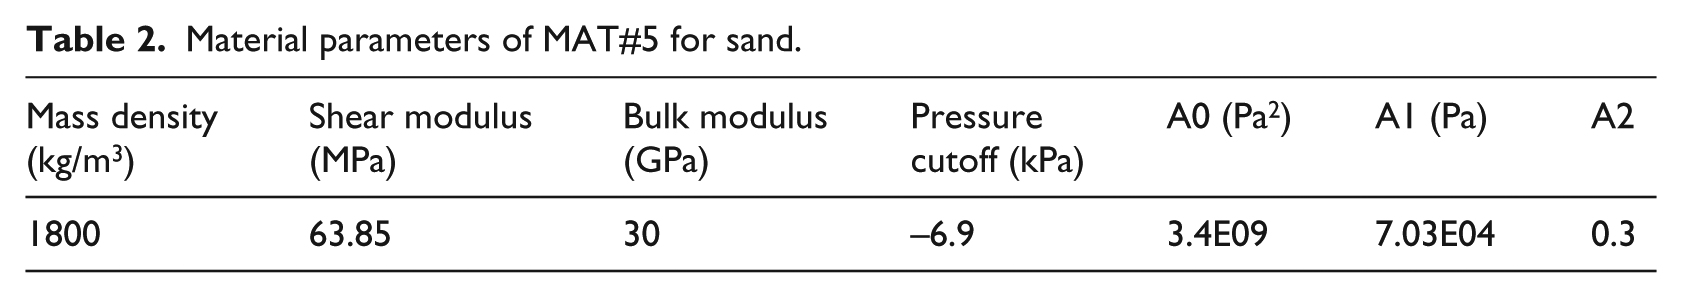
The cargo on pallets is pocketed sand which is modeled by the MAT_SOIL_AND_FOAM (MAT#5) model. The corresponding parameters are listed in Table 2, in which A0, A1, and A2 represent the yield function constants.
Material parameters of MAT#5 for sand.
Contact algorithm and boundary condition
The CONSTRAINED_LAGRANGE_IN_SOLID command is used to describe the coupling effect between the concrete and the steel reinforcement, thus they can be modeled separately. The contact between the truck and the pier is defined by the CONTACT_AUTOMATIC_SURFACE_TO_SURFACE option, in which the static and dynamic coefficients of friction are set as 0.4 and 0.3, respectively. The CONTACT_AUTOMATIC_SINGLE _SURFACE contact algorithm is used to describe the contact between the majority parts within the truck body, which are included in one part set. Considering the differences between the sand and other steel components in material characteristics, there will be many distorted elements if the sand contacts with these components directly. At present, a new component consisting of enclosed shell elements with larger stiffness, which are extracted from the face of the solid sand elements, is used to contact with steel components directly instead of the sand.
The load frame and data acquisition system behind the pier are not modeled in the simulations for simplification. Therefore, translation and rotation of nodes in the contact region between the pier and the compression arms are constrained using the BoundSPC command. Gravity is applied to the entire model through the keyword LOAD_BODY with a gravitational acceleration of 9.8 m/s2. The dynamic relaxation is used to achieve a preloaded state of the concrete core in the pier under gravity. Furthermore, the impact velocity of the tractor-trailer is set as 77.89 km/h, which is consistent with that in the test.
Model validations
The numerical simulation is performed using FE program LS-DYNA (2007), and the results are viewed and outputted through LS-PrePost. The output time and increment are fixed as 1.0 and 0.001 s, respectively. Furthermore, the corresponding impact force–time histories are filtered using Society of Automotive Engineers (SAE) Class 60 Filter embed in LS-PrePost, which is defined in SAE Standard J211-1:1995 (1995) and commonly used in vehicle collision field. Using the personal computer with the Intel® CoreTM i7 Processor, the calculation time for one case is about 12 h.
Impact process
Figure 9 shows the comparison of the impact process between the test and the simulation, which indicates that the actual impact process is numerically reproduced successfully. During the collision, the bumper first contacts with the pier and the frame of the truck begins interacting with the pier afterward. The engine collides with the pier at 0.03 s, following which the relative sliding between the frame and the trailer begins. At 0.21 s, the trailer contacts with the tractor and the tractor body is then crushed gradually. Finally, the tractor is severely damaged and large deformation occurs at the front of the trailer, while no obvious structural damage is found on the pier. It should be pointed out that, in Figure 9(c) and (d), the lift of the tractor front in the simulation maybe attributed to the difference of the cab bottom structure between the FE model and the actual test truck.
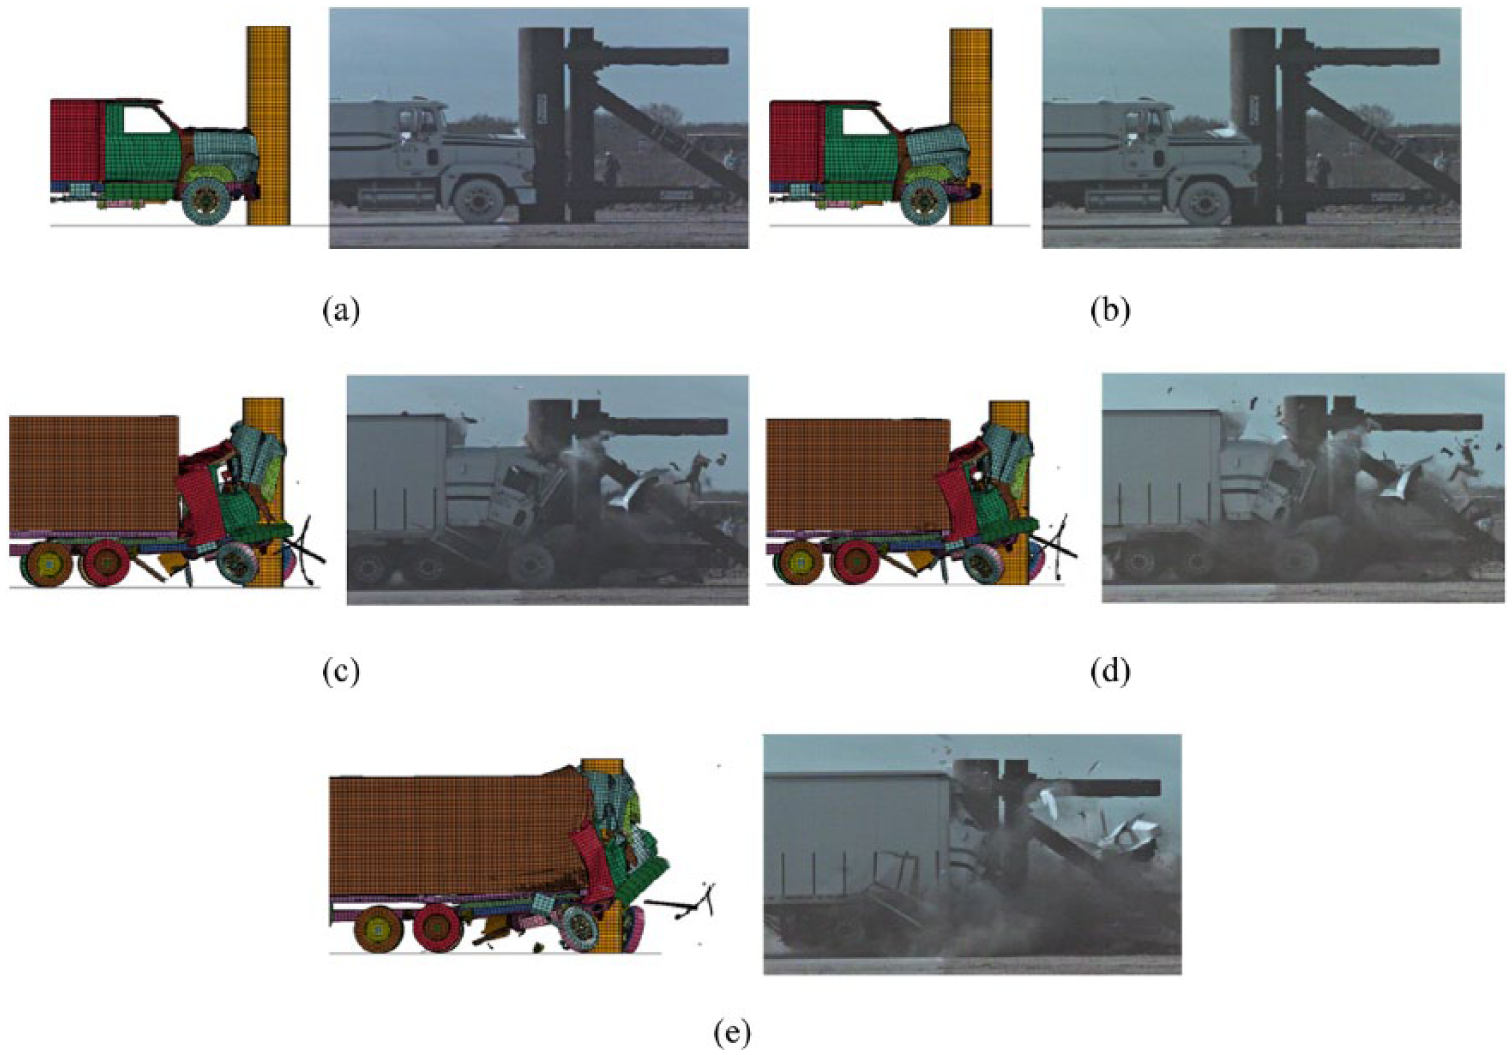
Comparison of impact process between the test and the simulation at the times of (a) 0.016 s, (b) 0.030 s, (c) 0.232 s, (d) 0.260 s, and (e) 0.380 s.
The collision is also a process of energy conversion, in which the initial kinetic energy of the truck is tranformed into the residual kinetic energy, internal energy of the truck and the pier, as well as the hourglass energy. Hourglass energy is attributed to the use of the reduced integration elements, which can improve the calculative efficiency but also can lead to the appearance of spurious deformation modes simultaneously. To make sure the accuracy of simulations, the hourglass energy must be monitored during the simulation and kept at a low level. The evolution of various energy quantities for the simulation is shown in Figure 10. It can be seen that most of the kinetic energy is transformed into the plastic deformation work of the tractor-trailer during the first 0.8 s. The ratio of hourglass energy to total energy remains below 5% during the impact process, which is a quite low value that can guarantee the computational accuracy. Therefore, the simulation results can be considered acceptable from the view of energy conversion.

Evolution of various energy quantities.
Impact force
The impact force obtained from numerical simulation is the resultant force on the contacting face of the truck and the pier. Figure 11 illustrates the experimental and simulated impact force-time histories. As can be seen, the two curves both have three main peaks. The first peak is corresponding to the contact of the engine and the pier, and the simulated occurrence time (0.03 s) and magnitude (4.64 mN) of the first peak agrees well with that of the test results (4.24 mN at 0.03 s). Then, the engine slides back along the longitudinal frame rails of the chassis system after interacting with the pier, the force is transmitted to the pier when the trailer floor structure contacts with the engine and the second peak impact force appears in this way. Afterward, the engine slips off to the ground, which leads to the indirect contact of the trailer floor structure and the pier through the crashed cab. Thus, the third peak impact force generates. It should be noted that, in the case that the engine does not slip off to the ground, the third peak would not occur, for example, Figure 14(a) to (d).
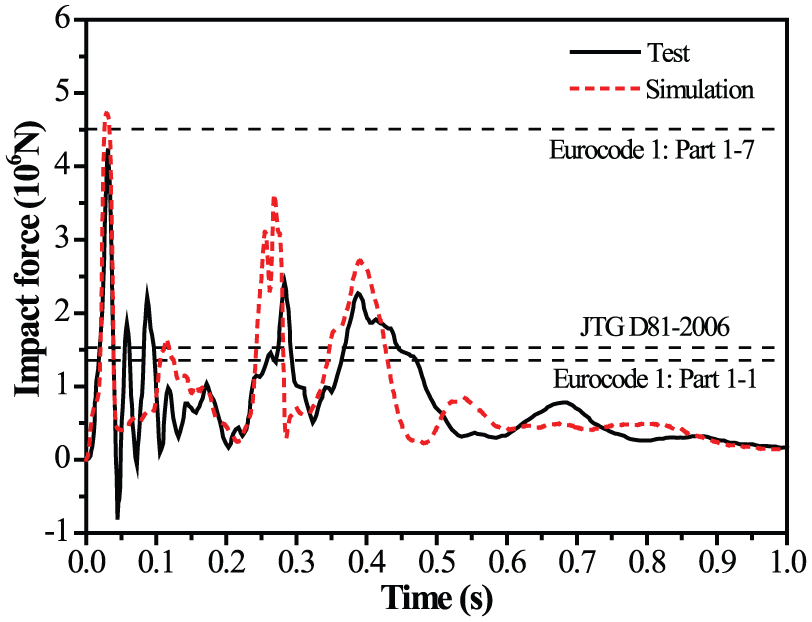
Impact force–time histories and the predicted maximum impact force.
The second and third peak impact forces of the test curve are 2.42 mN at 0.28 s and 2.27 mN at 0.39 s, while those of the simulation curve are 3.62 mN at 0.27 s and 2.70 mN at 0.39 s, respectively. The relative errors of three peak values between the two curves are 9.4%, 49.6%, and 18.9%, respectively. The reason for the above deviations mainly lies in that the established FE model of the tractor-trailer could not reflect the complex inner structures as well as the material properties of each component. Generally, by comparisons of the impact process (Figure 9) and the impact force-time histories (Figure 11), the simulation results are considered coinciding well with the test data, and the established FE model of the present tractor-trailer is validated.
Simplified calculation of the maximum impact force is also involved in the existing design specifications. In Annex B of Eurocode 1: Part 1-1 (European Committee for Standardization (CEN) BS EN 1991-1-1:2002, 2002), the design horizontal force is calculated by the following formula

where F is the maximum impact force, m is the gross mass of the vehicle, v is the impact velocity, δc is the vehicle deformation, and δb is the barrier deformation.
Chinese code (Ministry of Transport of the People’s Republic of China (MOT) JTG D81-2006, 2006) idealizes the stiffness of the vehicle and barrier as a linear spring, and the maximum lateral force applied to the barrier is given by

where θ is the impact angle, C is the distance from vehicle’s center of gravity to front bumper, and b is the vehicle width.
Annex C of Eurocode 1: Part 1-7 (European Committee for Standardization (CEN) BS EN 1991-1-7:2006, 2006) classifies the impact into two categories: hard impact and soft impact. The impact energy is mainly dissipated by the colliding object in the hard impact, while the structure is assumed to absorb the impact energy for the soft impact. Impact discussed herein is close to the hard impact and the impact force is specified as

where k is the equivalent elastic stiffness of the vehicle. The value of k is adopted as 1200 kN/m according to Hu and Li (2016) and Al-Thairy and Wang (2013).
The predicted maximum impact forces are also given in Figure 11. As can be seen, the value calculated by equation (3) (4.51 mN) is much larger than the other two values calculated by equation (1) (1.35 mN) and equation (2) (1.53 mN), while it is much closer to the first peak values of two curves. The reason lies in that most of the impact energy is dissipated by the deformation of the tractor-trailer during the collisions and it is close to a “hard impact.” Equations (1) and (2) are mainly used to calculate the impact force applied on the barriers, in which the deformations of barriers and vehicle are both taken into consideration.
Parametric study
In this section, based on the above validated FE model of the tractor-trailer, the influences of diameter and section shape of the pier, cargo weight, impact velocity, relative impact position, and vehicle type on the impact force are numerically discussed. The emphasis of the present parametric study is on the deformation of the tractor-trailer, as well as the amplitude and variation law of the impact force time history. Thus, the construction and material of the piers used in parametric study are the same as that introduced in section “FE model of concrete-filled steel pier.” Figure 14 shows the impact force-time histories under different scenarios and the corresponding vehicle deformations at 1 s after the collision initiated.
The impact force-time histories and corresponding impact images at 1.0 s for the parametric study of the pier diameter and section shape are illustrated in Figure 14(a) and (b). Since the piers are nearly rigid, minor influences of pier diameter and section shape on the impact force are confirmed. It should be noted that smaller pier diameter would lead to longer penetration distance of the tractor since the components could bypass the sides of the pier more easily, and the deformation of the tractor is more severe at the corner of square piers.
By increasing or decreasing the volume of the cargo, the gross weight of the tractor-trailer is adjusted to 17 t (unladen case), 36 t, and 56 t, separately. The impact force-time histories are shown in Figure 14(c). The first peaks and corresponding occurrence time of the three curves are similar because they are caused mainly by the impact of the engines and the cargo weight has little effect on the deformation of the tractor. Thus, the cargo weight has negligible effect on the amplitudes and corresponding occurrence time of first peak impact force. Besides, since the second peak impact force is attributed to the collision of the trailer floor structure with the pier, with the increase in the cargo weight, the corresponding inertia force increases, thus the second peak impact force increases and the vehicle deformations also become more severe.
Figure 14(d) shows the time history curves of the impact force with the tractor-trailer impacts the pier at three different speeds (i.e. 60, 90, and 120 km/h). The initial kinetic energy is higher as the impact velocity increases, and more energy is transformed into the plastic deformation work of the tractor-trailer. Therefore, as can be seen, each curve has two peaks and the peak values increase and appear earlier with the increase in the impact velocity.
When the centerline of the tractor-trailer does not line up with that of the pier, the impact force will come to be different. As shown in Figure 12, three impact positions P1, P2, and P3, corresponding to the off-center distances are 1/3, 2/3, and 3/3 of half of the vehicle width, are taken into consideration, respectively. The impact force-time histories and damage of the tractor-trailer are shown in Figure 14(e). It indicates that (1) since the off-center distance P1 is relatively small and partial engine collides with the pier, a much higher peak value occurs at 0.03 s for P1; (2) three peak impact forces of the three curves (3.58 mN at 0.26 s, 3.70 mN at 0.28 s, and 4.55 mN at 0.28 s) are caused by the collisions between the trailers and the piers; and (3) since more energy is transformed into the internal energy of the vehicle during the central collisions, the peak impact forces of the present three cases are lower than those of the central collisions.
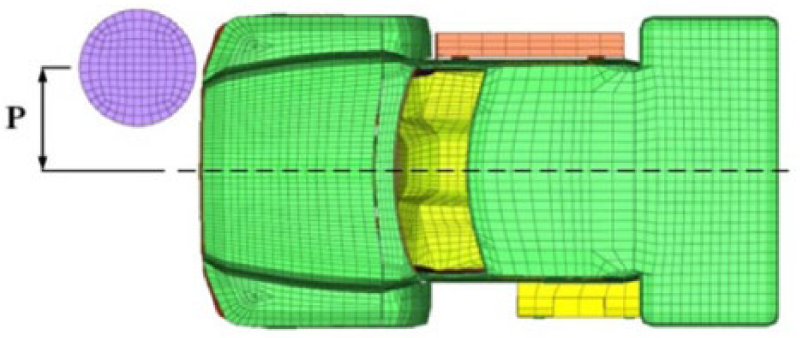
Truck collision with an off-center distance.
Three vehicle models involving a 36-t tractor-trailer, an 8-t Ford F800, and a 1.2-t Ford Taurus are adopted for the study of the vehicle type influences. Ford F800 and Ford Taurus are typical medium-duty and sedan vehicles, the FE model of which are also downloaded from the NCAC website (2012). As shown in Figure 13, Ford Taurus model consists of 66,523 solid elements and 784,333 shell elements. Collisions between the above three vehicles and circular piers with a diameter of 914.4 mm are simulated, and the impact velocity is 90 km/h. Figure 14(f) shows the corresponding impact force-time histories and damage of the vehicles. Since the smaller vehicle is lighter in gross weight and shorter in length, which will lead to the smaller initial kinetic energy and shorter time duration of energy dissipation, the larger vehicle will result in higher impact force and longer time duration.
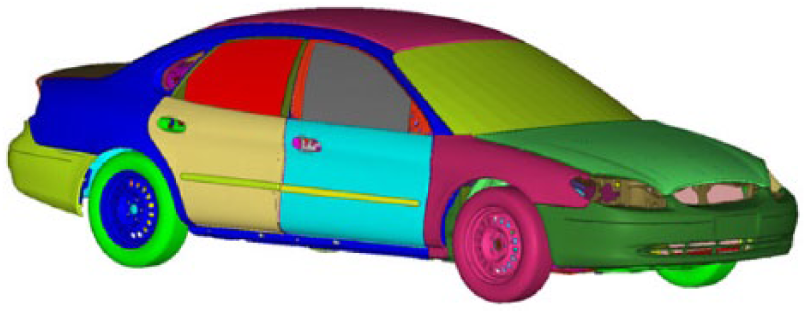
FE model of Ford Taurus (NCAC, 2012).
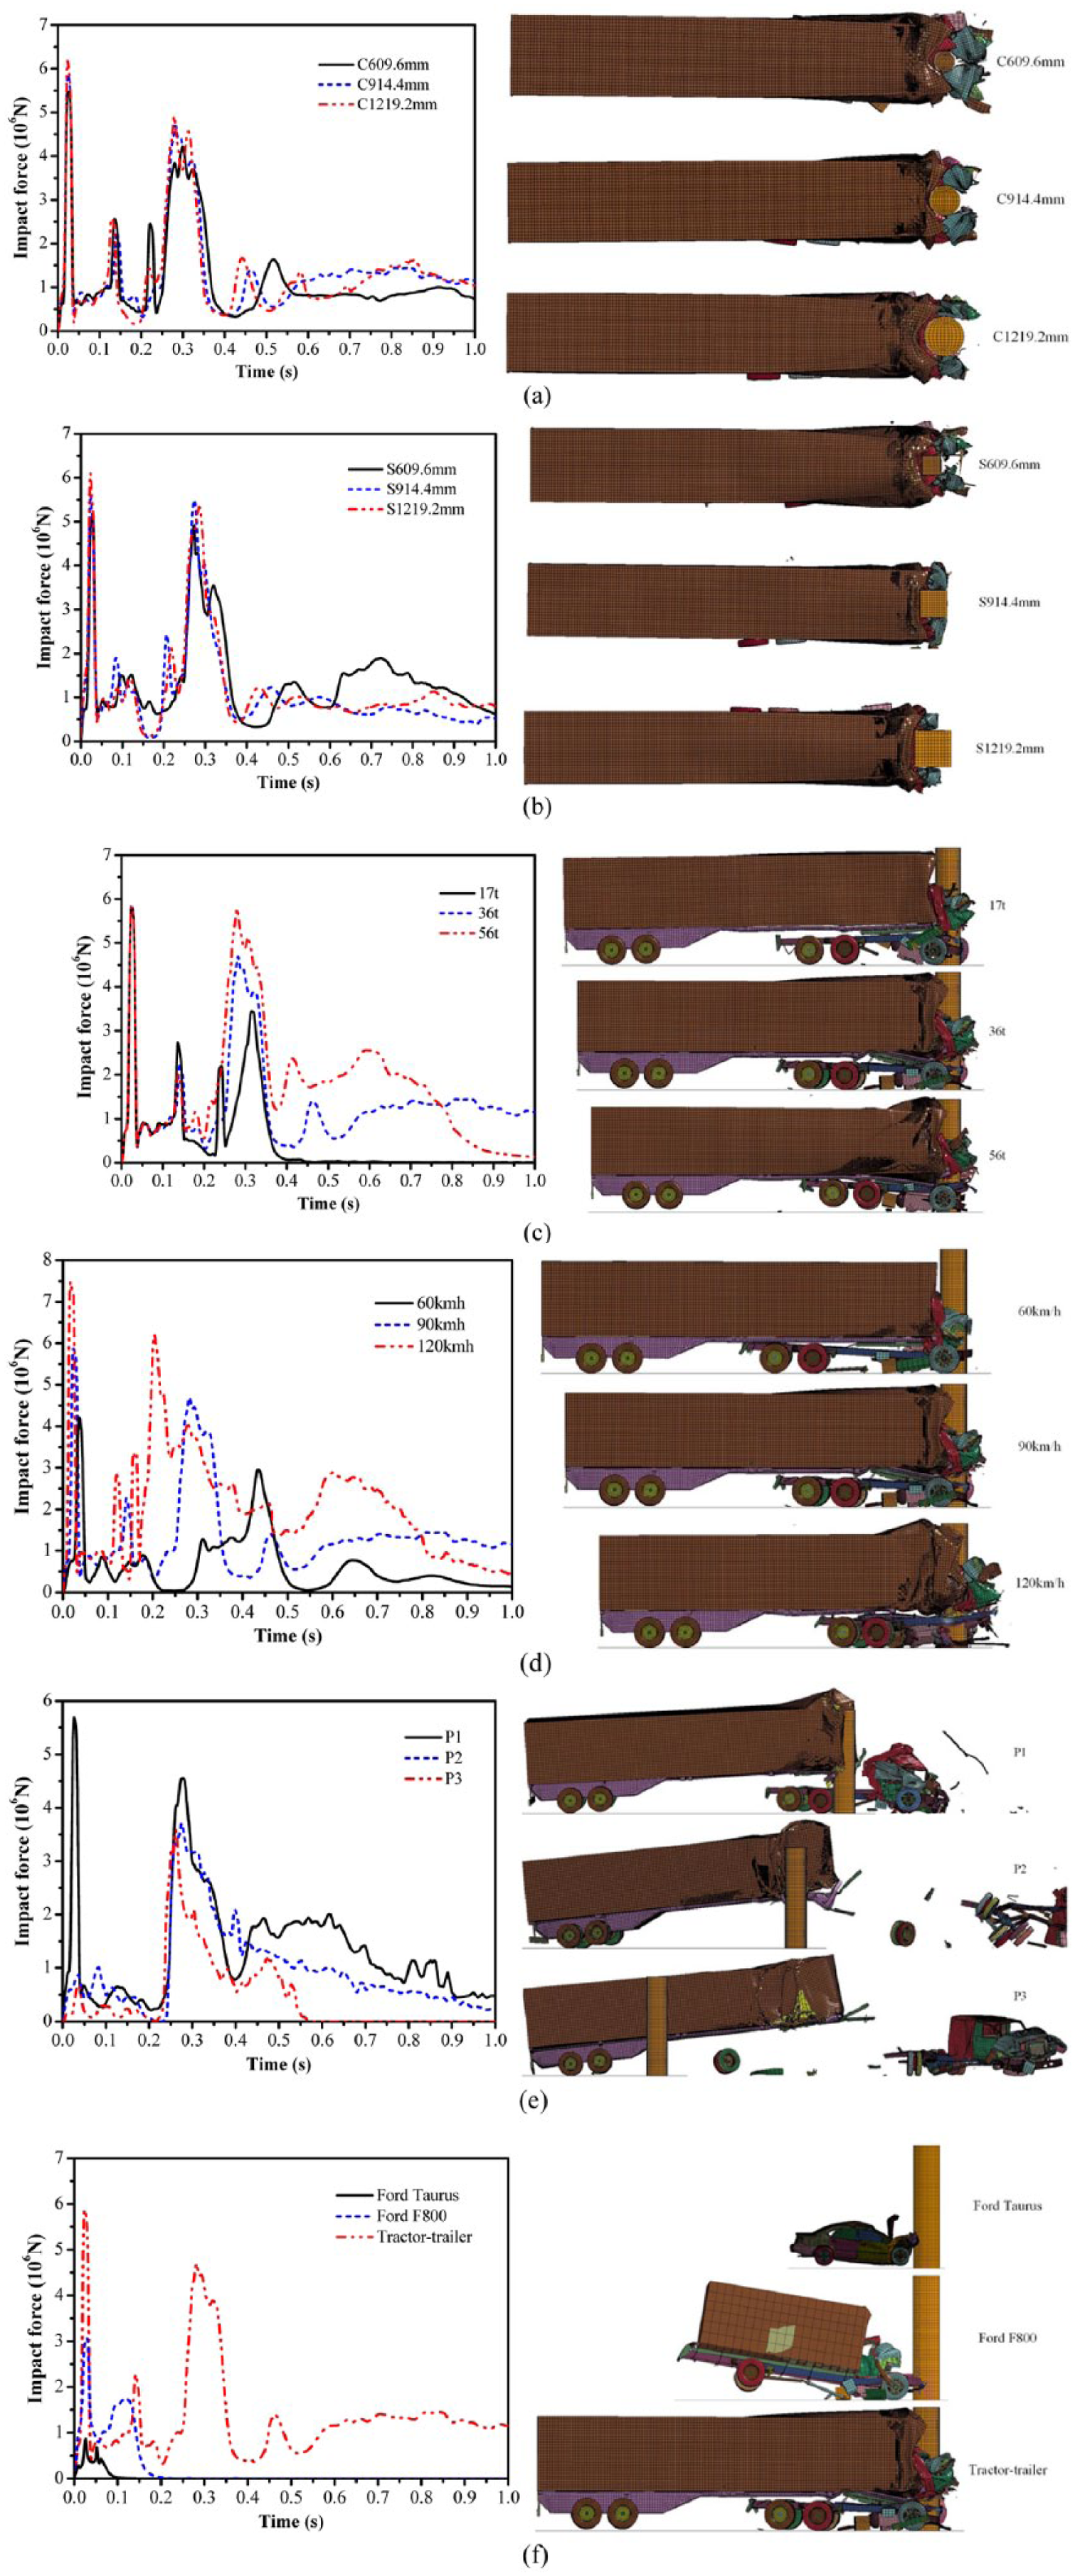
Impact force–time histories under different parameter conditions: (a) pier diameter, (b) section shape, (c) cargo weight, (d) impact velocity, (e) off-center distance, and (f) vehicle type.
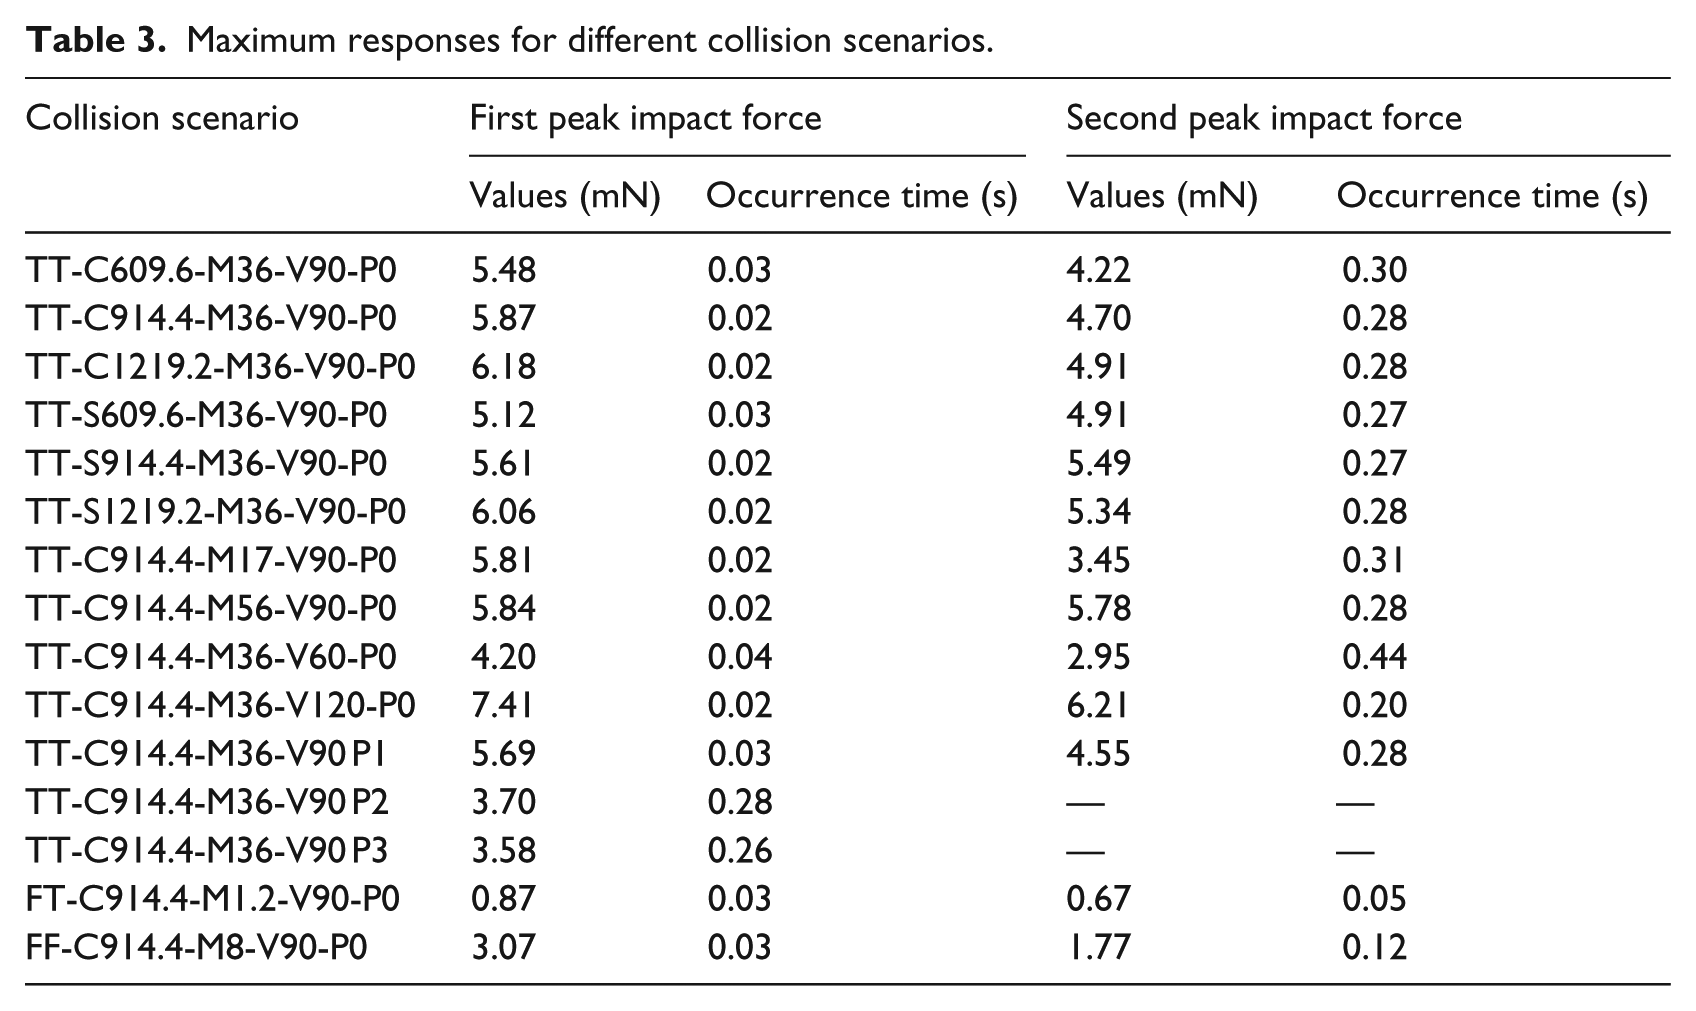
According to the impact force-time histories in Figure 14, the peak values and corresponding occurrence time of each collision scenario are listed in Table 3, in which “–” denotes that the corresponding peak impact force does not appear. For the denomination of the collision scenario, TT, FF, and FT refer to the tractor-trailer, Ford F800, and Ford Taurus, respectively. Furthermore, C and S represent the circular and square piers, M and V denote the mass and impact velocity of the vehicle, and P represents the off-center distance. For instance, TT-C914.4-M36-V90P1 denotes a collision between a circular pier with a diameter of 914.4 mm and a tractor-trailer with a gross weight of 36 t, the impact velocity is 90 km/h, and the off-center distance is 1/3 of half width of the truck.
Maximum responses for different collision scenarios.
Highway bridge pier collisions
Considering the bridge pier in test II is nearly rigid, which is different from the actual bridge pier. In this section, aiming to study the dynamic response of actual highway bridge piers subjected to heavy-duty truck collisions, a numerical model of an actual reinforced concrete highway bridge pier in Changsha, China, is established. Numerical simulations of the above tractor-trailer impacting on the highway bridge pier are further conducted, and the impact force and lateral displacement of the pier are derived and analyzed.
FE model of highway bridge pier
The highway bridge pier is 10 m high and made of C40 concrete. Figure 15(a) presents the detailed geometric dimensions of the pier. The cross-sections A-A and B-B are magnified, and the sectional arrangement of transverse reinforcements in the column and beam are also shown. The hoop spacing at the beam and the middle of the column is 200 mm, which is decreased to 100 mm in the top and bottom areas of the column. The longitudinal reinforcements used in the column are HRB400 steel bars, which are arranged into a single-row layout.
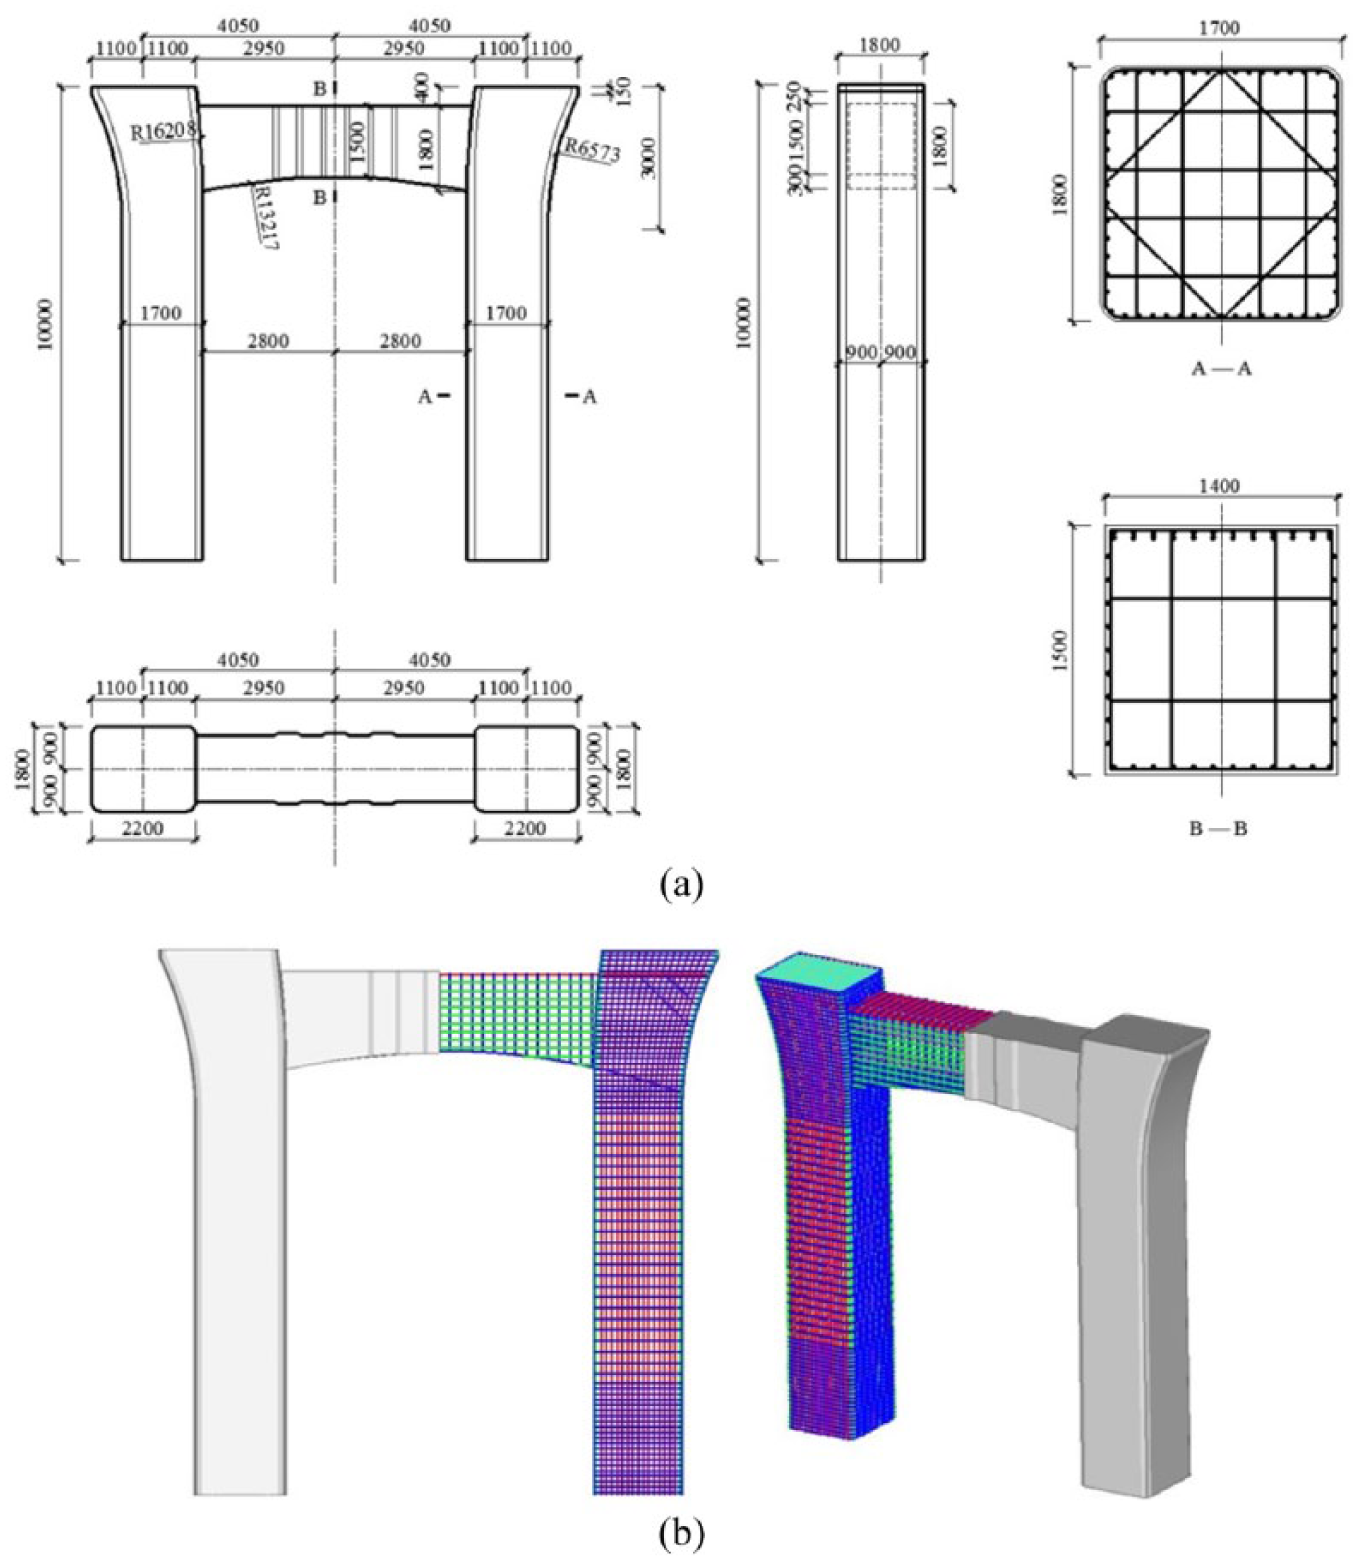
Highway bridge pier (a) geometric dimensions and transverse reinforcements arrangement (unit: mm) and (b) FE model.
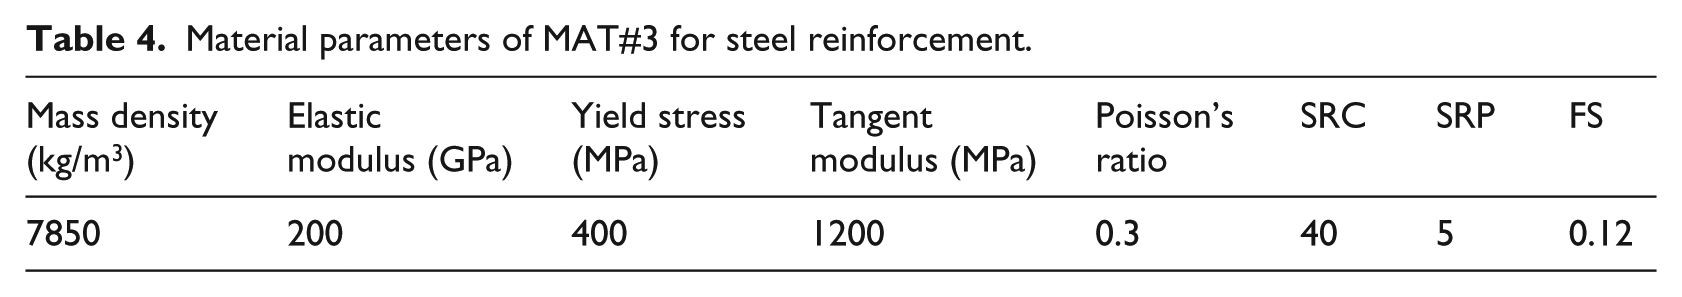
FE model of the pier is established accordingly and shown in Figure 15(b). The constitutive model of MAT_CONCRETE_DAMAGE_REL3 (MAT#72R3) and constant stress solid element are adopted for the concrete. The steel reinforcement is described by the MAT_PLASTIC_KINEMATIC (MAT#3) material model and the default element formulation in LS-DYNA (2007) (i.e. Hughes-Liu with cross section integration). The related material parameters are listed in Table 4, in which SRC and SRP represent the strain rate parameters for Cowper Symonds strain rate model and FS indicates the effective plastic strain for eroding elements.
Material parameters of MAT#3 for steel reinforcement.
As for the connection between reinforcements, the transverse reinforcement elements in the same section share the same nodes with each other. Beam elements with small cross-section diameter are used to describe the binding wire, which is the connection between the longitudinal reinforcements and the transverse reinforcements. The reinforcements and concrete are modeled separately and coupled by the keyword CONSTRAINED_LAGRANGE_IN_SOLID. The pier is regarded as a propped cantilever column (i.e. a fixed bottom and a free top). The loadings from the superstructure, including the dead weight of the box girder, secondary dead load, and lane loading, are considered. The calculated resultant force of the dead load is 19,764 kN, which is applied by an equivalent mass block placed on the top of pier.
Simulation results
Considering the most unfavorable scenario, the impact direction is set to be perpendicular to the beam and aligned to the centerline of the pier bottom, as shown in Figure 16(a). The gross weight of the tractor-trailer is added to 100 t by increasing the volume of the sand and the impact velocity is set as 120 km/h.

Simulation results: (a) schematic view of the collision, (b) damage of the tractor-trailer and the pier, and (c) time histories of the impact force and lateral displacement of the pier.
Figure 16(b) illustrates the damage of the tractor-trailer and the bridge pier after collision. The deformation process of the tractor is similar to that in the case of model validation as in section “Impact process,” and the trailer is severely damaged. Figure 16(c) shows the time history of impact force and the corresponding peak value reaches 15.5 mN. It should be noted that the second peak impact force is larger than the first one. The reason lies in that the present cargo weight is about 83 t and the impact velocity is 120 km/h, which indicates a large initial kinetic energy. The kinetic energy consumption through the tractor deformation is limited, and most of the residual kinetic energy is transformed into the plastic deformation work of the trailer and the pier. The time histories of the lateral displacement of the pier are also given. The lateral displacements at the pier top and the impact point are the maximum displacements of Areas a and b shown in Figure 16(b), and the corresponding maximum values are 159.6 and 97.9 mm, respectively. It should be noted that the deformation of Area b is mainly unrecoverable and that of Area a will rebound to a certain value eventually.
Conclusion
The impact force of the heavy-duty truck on bridge piers is numerically analyzed in this article, and the main works and conclusions are as follows:
The FE model of a tractor-trailer is established, and the full-scale tractor-trailer crash test on concrete-filled steel pier is numerically simulated. The collision process and the impact force-time history are well reproduced, and the established model is validated.
The maximum impact force of the tractor-trailer can reach the level of 10 mN, and the time duration of the impact force is about 1 s. The tractor-trailer impact force-time history contains two or three peaks, in which the first peak is attributed by the interaction between the engine and the pier, the second and third peaks are related to the indirect collisions between the trailer floor structure and the pier through the engine and the crashed cab, respectively.
The parametric study on collisions between tractor-trailer and rigid piers indicates that the pier diameter and cross-section shape have slight influence on the impact force; the peak values of the impact force increase and appear earlier with the increasing of the impact velocity; the first peaks and corresponding occurrence time are similar for the tractor-trailer with different cargo weights, while the second peak impact force increases with the cargo weight increasing; central collision will generate the highest impact force; larger vehicle will result in higher impact force and longer collision time duration. Moreover, the corresponding variation laws of actual reinforced concrete piers, which might differ from those of rigid piers, need to be further investigated.
The FE model of an actual reinforced concrete highway bridge pier is established, and the impact force and lateral displacement of the pier against the most unfavorable tractor-trailer collision (100 t and 120 km/h) are numerically derived and discussed.
Footnotes
Declaration of Conflicting Interests
The author(s) declared no potential conflicts of interest with respect to the research, authorship, and/or publication of this article.
Funding
The author(s) disclosed receipt of the following financial support for the research, authorship, and/or publication of this article: This study was supported by the National Natural Science Foundations of China (51522813).