
Abstract
The penetration of projectiles into semi-infinite targets helps in the understanding and modelling of terminal ballistics. The article describes field test results of 5.56×45 mm F1 Ball and 7.62×51 mm M80 Ball ammunition. The targets were 25-mm-thick mild and high strength steel plates of Grade 250 MPa and 350 MPa, respectively. The tests recorded penetration depth, muzzle and impact velocities, and bullet mass. Despite its smaller calibre, the 5.56 mm × 45 mm F1 Ball ammunition recorded deeper penetrations than the larger calibre 7.62 mm × 51 mm M80 Ball ammunition. This is due to the 5.56 mm ammunition comprising a hardened steel penetrator and lead core, whereas the 7.62 mm ammunition comprised only a lead core. Multiple shots were fired for each type of munition. The coefficient of variation of steel penetration is approximately 0.10 and 0.03 for 5.56 mm and 7.62 mm rounds, respectively. The article also presents predictive models of steel penetration depth and compares these to the field test results.
Introduction
Steel targets are usually in the form of plates, either as armour or forming part of a structure such as beams or columns. The target may be perforated, or it is thick enough to stop the projectile near the rear surface of the plate. In this article, penetration is defined as the distance the projectile has penetrated into the target. The article considers the target (or steel plate) to be semi-infinite, defined as ‘large enough so that its lateral and back surfaces do not influence the penetration process’ (Rosenberg and Dekel, 2016). Knowledge about penetration depth of semi-infinite targets helps with understanding the physics of the penetration process and acts as a ‘tutorial role in the penetration mechanics’ (Rosenberg and Dekel, 2016). More specifically, the depth of penetration provides one of the few tangible parameters that can be compared with analytical and numerical modelling. Armour and protective design is more concerned about perforation of a target, defined as complete penetration through the target.
Smith and Hetherington (1994) state that ‘a ballistic event repeated several times can yield a number of different results’. For this reason, the ballistic limit velocity is defined as the velocity at which the projectile has a 50% chance of just perforating the target (i.e. the projectile emerges from the target with zero velocity). However, ballistic design is essentially deterministic, such as the minimum wall thickness needed to stop perforation. It is recognised that deterministic approaches do not quantify the level of safety for a given design and that probabilistic methods are well suited to determining the level of safety and risk by considering uncertainty and variability of projectile mass, velocity, and dimensions and material properties of the target (e.g. Trasborg et al., 2017). There is thus a need for repetitive ballistic testing to reveal the variability of projectile penetration and perforation. This then allows for reliability-based design, where, for example, the wall thickness with 90% reliability (i.e. 1 in 10 shots will penetrate the wall) can be estimated knowing the probabilistic distribution of perforation depths (e.g. Twisdale et al., 1994). The same approach can also be applied to airblast, ground shock and other damaging effects of military munitions (e.g. Netherton and Stewart, 2016; Stewart and Netherton, 2015). Understanding the penetration and impact of bullets is also important for the design of escalator bullet traps at indoor shooting ranges (e.g. Golley and Hughes, 2004, 2005). In this case, thousands of rounds can be fired at a steel impact plate which will ultimately lead to impact plate failure due to excessive buckling or partial perforation causing splashback towards the firer or catastrophic, full perforation.
The penetration of projectiles into semi-infinite targets helps in the understanding and modelling of terminal ballistics. Hence, the article describes field test results of Australian 5.56 mm × 45 mm F1 Ball and United States 7.62 mm × 51 mm M80 Ball ammunition fired at an outdoor range in Australia. The targets were 25-mm-thick mild and high strength steel plates of Grade 250 MPa and 350 MPa, respectively. The tests recorded penetration depth, muzzle and impact velocities, and bullet mass. The article also presents predictive models of steel penetration depth and compares these to the ballistic test results.
Ballistic field tests
The ballistics testing procedure was developed to suit the facilities and procedures in place at the outdoor rifle range where the testing was undertaken.
Weapons and ammunition
The weapons had barrel lengths of 17.5 inch (445 mm) for 5.56 mm ammunition and 16 inch (405 mm) for 7.62 mm ammunition. Note that due to security concerns the type of weapons used cannot be disclosed. Two different ammunitions commonly used by the Australian Defence Force were selected:
Australian 5.56 mm × 45 mm F1 ball;
United States 7.62 mm × 51 mm M80 ammunition.
The 5.56 mm × 45 mm F1 ball ammunition is manufactured by Australia Munitions (Australian Munitions, 2017a) for use in EF88 individual weapons and F89 Minimi light support weapons. The projectile comprises a ‘hardened penetrator and a lead slug enclosed in a gliding metal jacket’ (Australian Munitions, 2017a). The nomenclature 5.56 mm × 45 mm indicates that the diameter of the projectile is 5.56 mm and the case length is 45 mm. Nominal characteristics of this ammunition are given in Table 1. The projectile comprises 53% lead, 0.5% antimony and 46.5% steel penetrator (Martin et al., 2017). Note that this ammunition has essentially the same design parameters as the NATO SS109 and the United States M855 ball cartridges. Surprisingly, schematics are not widely available for this munition, and they are not provided by the ammunition manufacturer. Hence, Figures 1 and 2 show a schematic and a photo of a NATO SS109 projectile.
Nominal specifications for ammunition.
Measured 24 m from muzzle.
Schematic of a 5.56 mm × 45 mm SS109 projectile (Pach et al., 2017).
Photos of (a) 5.56 mm × 45 mm SS109 and (b) 7.62 mm × 51 mm M80 projectiles (Adams, 2006).
The 7.62 mm × 51 mm M80 ball ammunition is manufactured by Orbital ATK (Orbital ATK, 2017) for use in general purpose and light machine guns. The projectile comprises ‘a lead core enclosed in a gliding metal jacket’ (Orbital ATK, 2017), see Figure 2. Nominal characteristics of this ammunition are also given in Table 1. The projectile comprises 99% lead and 1% antimony (Martin et al., 2017). Note that this ammunition is very similar to the Australian 7.62 mm F4 ball ammunition (Australian Munitions, 2017b).
A key difference between the 5.56 mm and 7.62 mm ammunition is that the small calibre ammunition has a steel penetrator which is also referred to as a ‘cored’ round (Grouch, 2017). As a result, the ‘steel penetrator in the front end of the M855 provides increased hard-target performance’ when compared to a lead core penetrator (Woods, 2010). Similar observations have been made for the NATO SS109 ammunition that also has a steel penetrator (NATO, 2008). Note that the 5.56 mm × 45 mm M193 ball ammunition has a lead core, which is equivalent, in terms of projectile material properties, to 7.62 mm × 51 mm M80 ball ammunition. For these reasons, the 7.62 mm × 51 mm M80 ball and 5.56 mm × 45 mm F1 ball rounds are described as Level 3 and Level 3+ threats, respectively (Grouch, 2017).
Target selection
As discussed earlier, depth of penetration is selected as the preferred measure of ballistic impact. It is critical that the plates are thick enough to prevent perforation, because, by definition, if the bullet passes through the plate, it would have gone beyond the phenomenon of penetration, and there would be no measurable result.
The minimum plate thickness required to prevent perforation is estimated from UFC 4-023-07 (2017) and NATO (2008) guidelines as 14–19 mm for mild steel plates. To be conservative, 25-mm-thick plates were selected to ensure that the plate is thick enough to ensure that there is no deformation on the rear surface after ballistic impact. Commercially available steel plates for two different grades of steel, 250 MPa and 350 MPa, were selected to provide variation in yield strength and hardness of the target. To allow for a greater number of samples, two plates of each type were prepared.
The steel plate supplier assessed the Brinell Hardness Number (BHN) for all plates according to AS1816.1 (2007). A summary of results is shown in Table 2. The ‘typical’ hardness for Grade 250 and 350 steels is 120–160 BHN and 140–180 BHN, respectively (Bluescope Steel Ltd, 2015a, 2015b). Table 2 shows that the measured hardness for these steels conforms to these typical ranges.
Test plate material properties.
The size of the plates was 300 mm square, to suit the bracing system used at the rifle range. Four studs, welded to the back of the plates, allowed the plates to be bolted to the frame. A typical drawing of the test plates is shown in Figure 3.
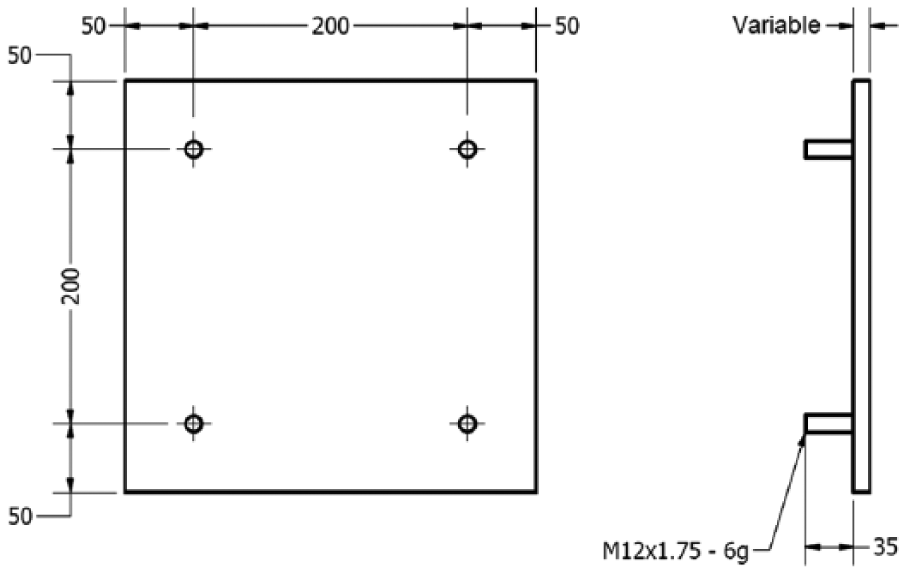
Ballistic test plate design.
Prior to testing, the plates were painted white and the target locations were marked out using a permanent marker. The zone of influence surrounding the location of the bullet impact is approximately 2–3 diameters from the centre of impact (Carlucci and Jacobson, 2014). This was doubled to get the centre-to-centre spacing, plus a margin of error was allowed to account for accuracy of each round. The resulting spacing between rounds was 50 and 60 mm, centre-to-centre, for 5.56 and 7.62 mm calibre ammunition, respectively.
A portion of the plate was set aside so that a sample could later be machined from each plate to test the yield strength, see shaded zone in Figure 4. The mean strengths of each plate are listed in Table 2 and stress–strain relationships shown in Figures 5 and 6. Therefore, 10 rounds of the 5.56 mm calibre ammunition and 12 rounds of the 7.62 mm ammunition were tested per plate. The target layout used for each plate is shown in Figure 4.
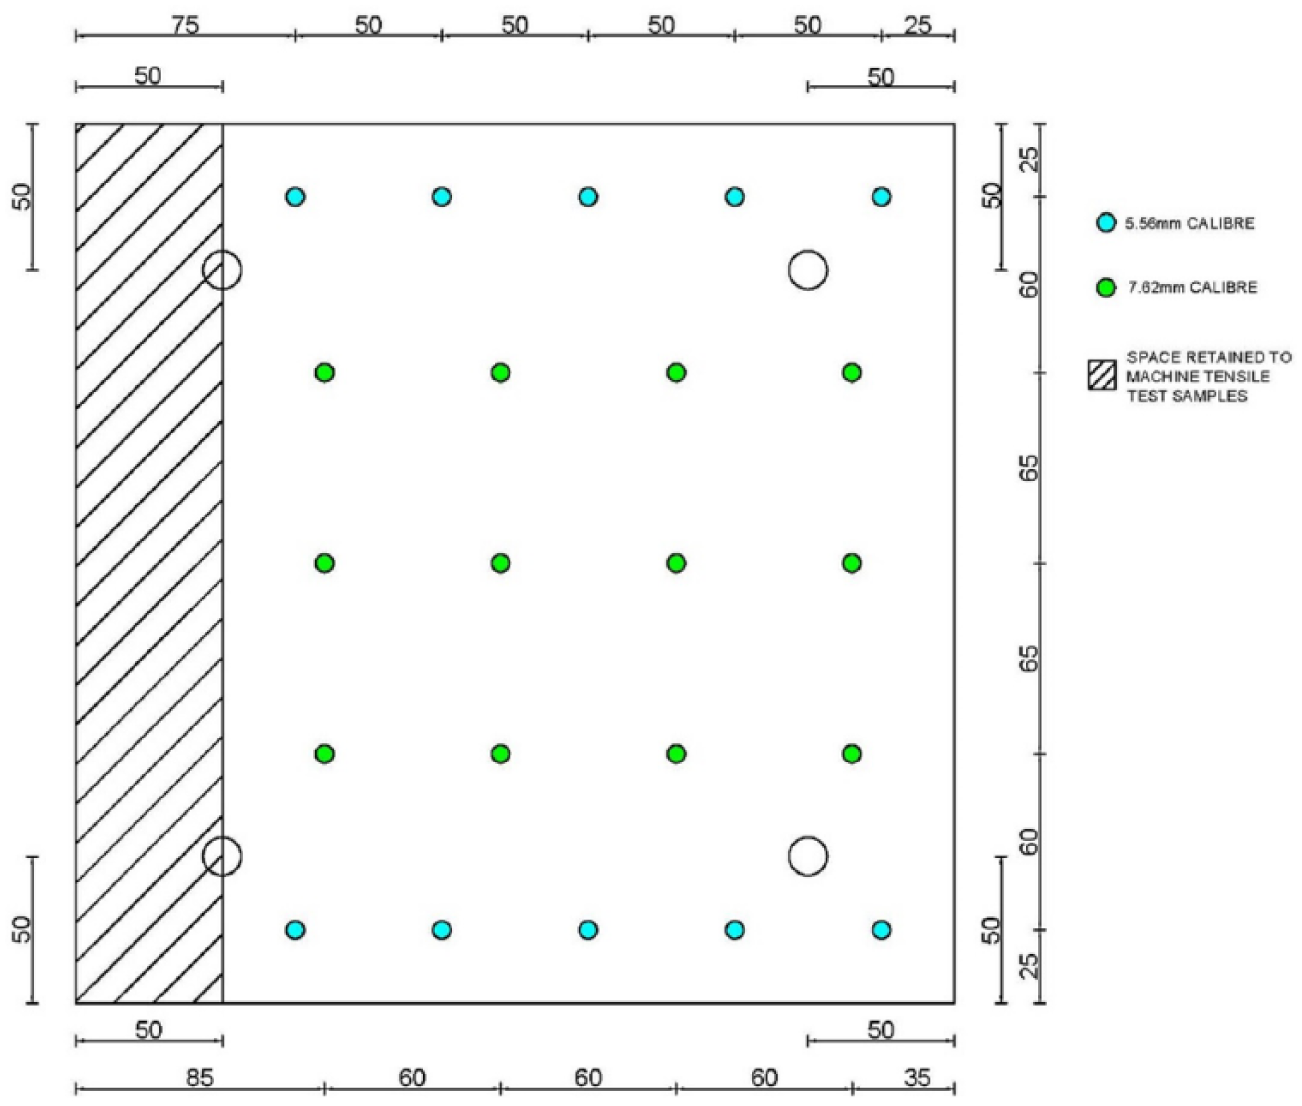
Test plate target layout.
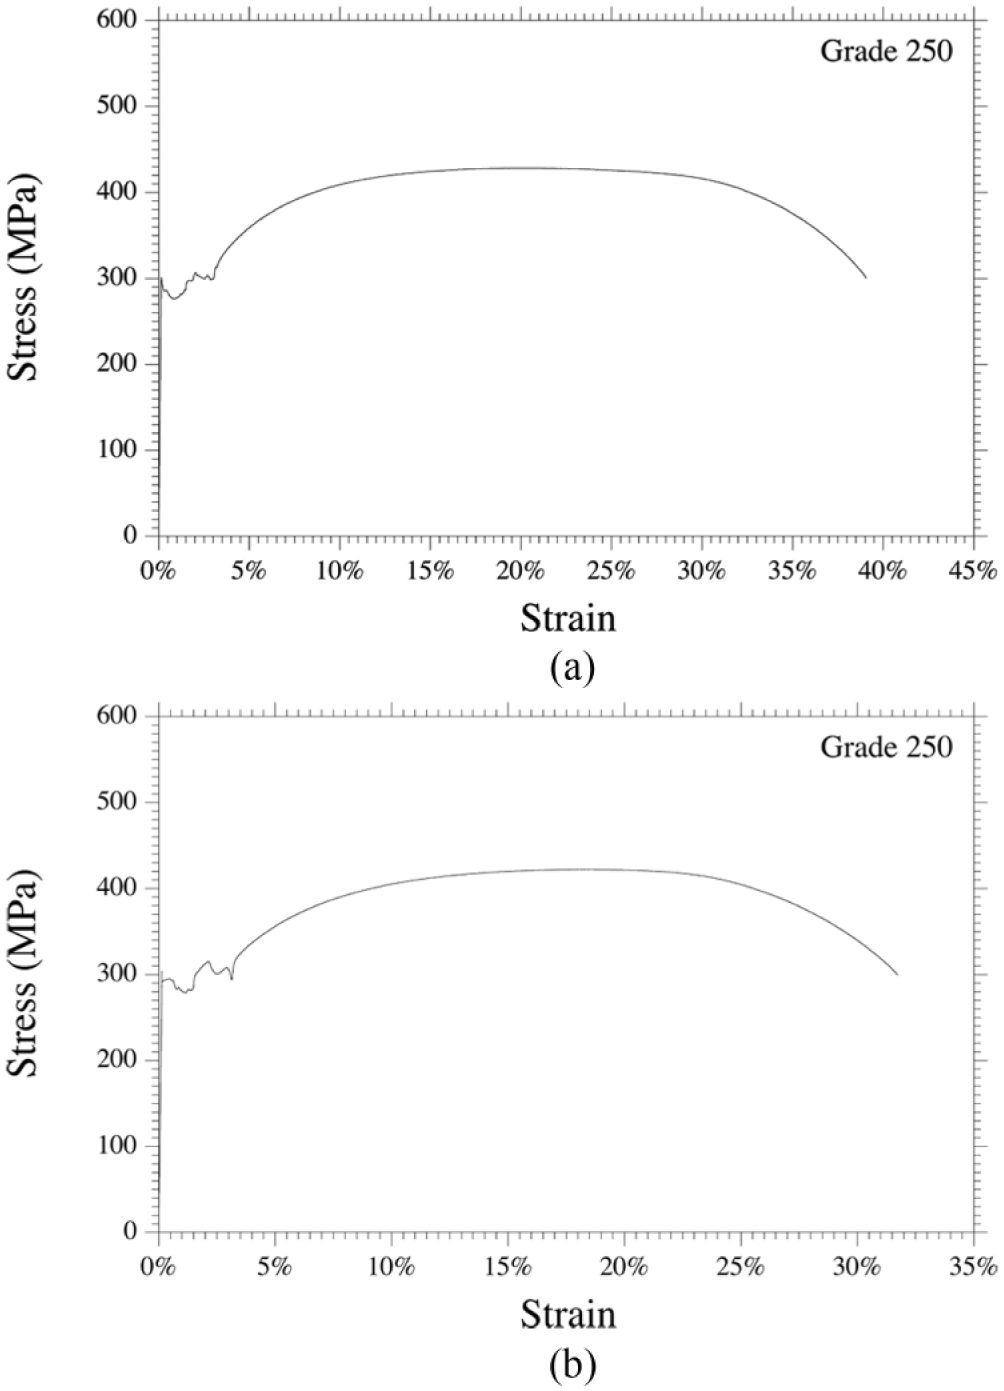
Stress–strain relationship for Grade 250 steel plates.
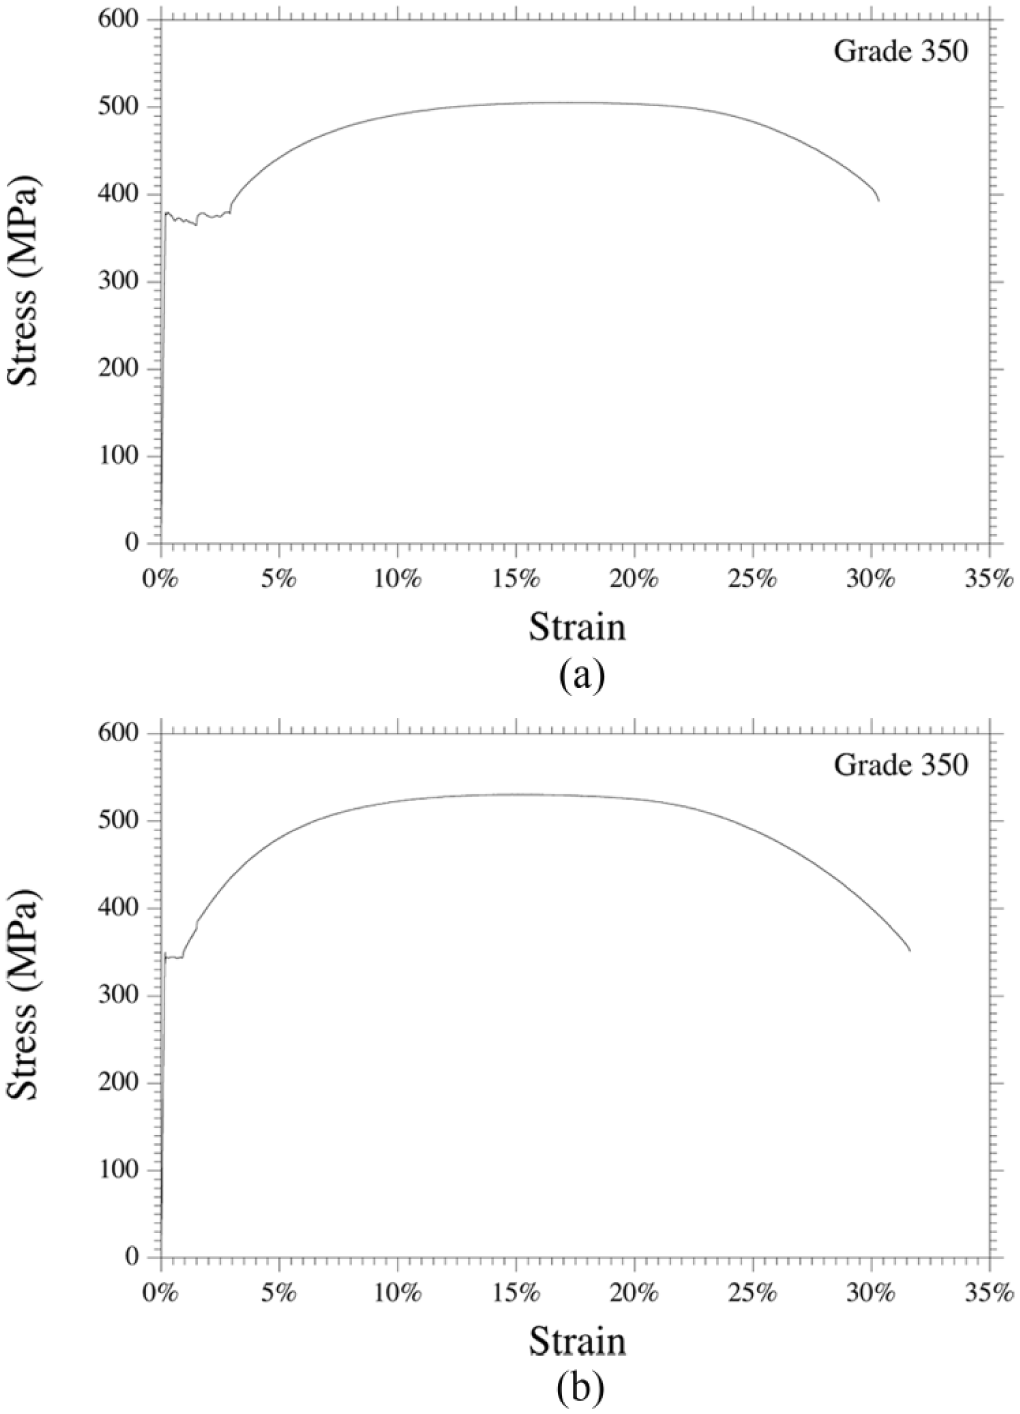
Stress–strain relationship for Grade 350 steel plates.
Ballistic tests
The terminal ballistic field testing was undertaken at a specialist outdoor rifle range. The test plates were fixed to a frame at the far end of the rifle range. The testing was undertaken at a range of 50 m as this was deemed by the range control officer to be the distance required to be outside the trajectory of any fragments that may ricochet off the target. The experimental set up is shown in Figure 7, with the location of the target emphasised by the black circle. A ballistic chronograph was set up (approximately 5 m from the muzzle of the rifle) to record the velocity of each projectile.
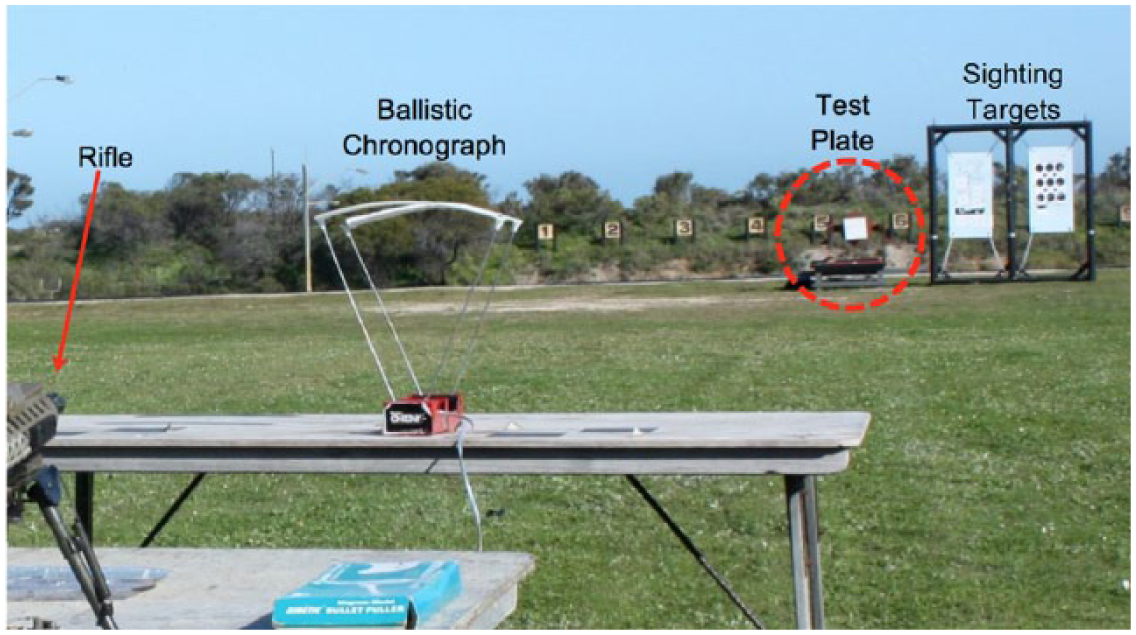
Ballistic field test set up.
The weather on the day of testing was fine with clear sky throughout the day. There was a consistent, gentle breeze from the east (which, on this range, meant the wind was blowing from the shooter towards the target), estimated to be approximately 5–10 km per hour (1.4–2.8 m/s).
The steel plates were manufactured to suit – and bolted to – the frame at the range. Additional targets were set up to the right-hand side of the steel plates and these were used by the shooter to calibrate the sights on the rifles prior to testing.
The required number of rounds was fired at the steel plate and the muzzle velocities were recorded from the chronograph. Before switching the plates, each round was numbered, as shown in Figure 8 so that it could be matched to the corresponding velocity measurement.
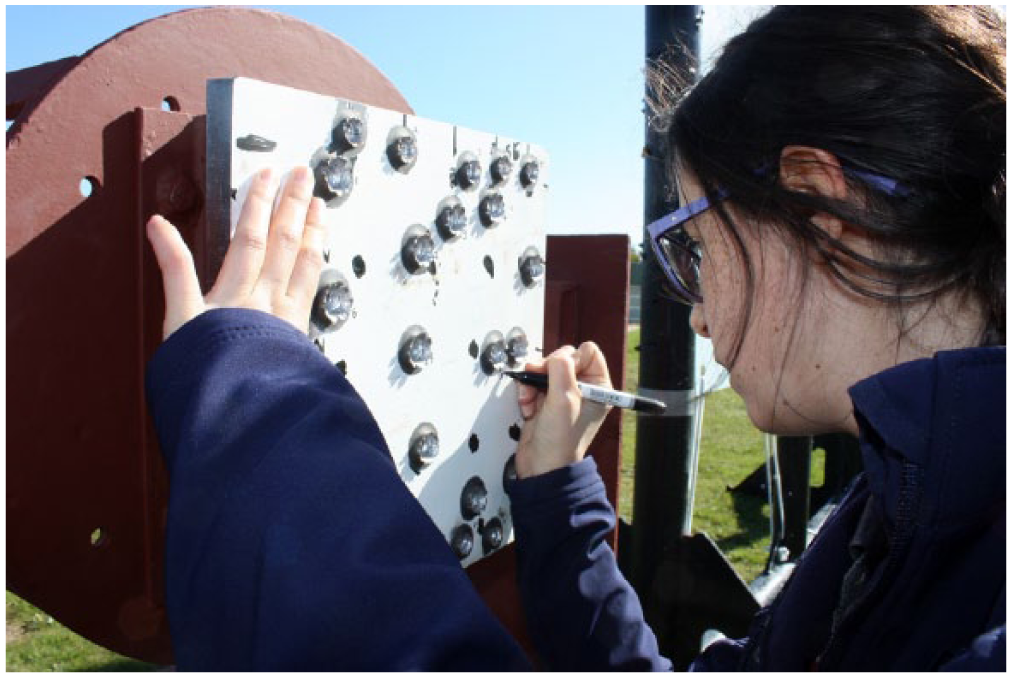
Numbering each penetration during terminal ballistic field testing.
During the field testing, the accuracy of the projectile impact was an issue so there was often a large disparity between the target and actual location of the resulting penetration. This is illustrated in Figure 9. The target locations were marked as a black circle on the plate and it is clear that the distances between the target location and penetration are significant. In some cases, this meant that the total number of rounds per plate had to be reduced or that penetrations intersected. Accuracy was particularly an issue with the 7.62 mm × 51 mm M80 ammunition as this round is typically used as machine gun ammunition, where a higher spread of impacts is advantageous.
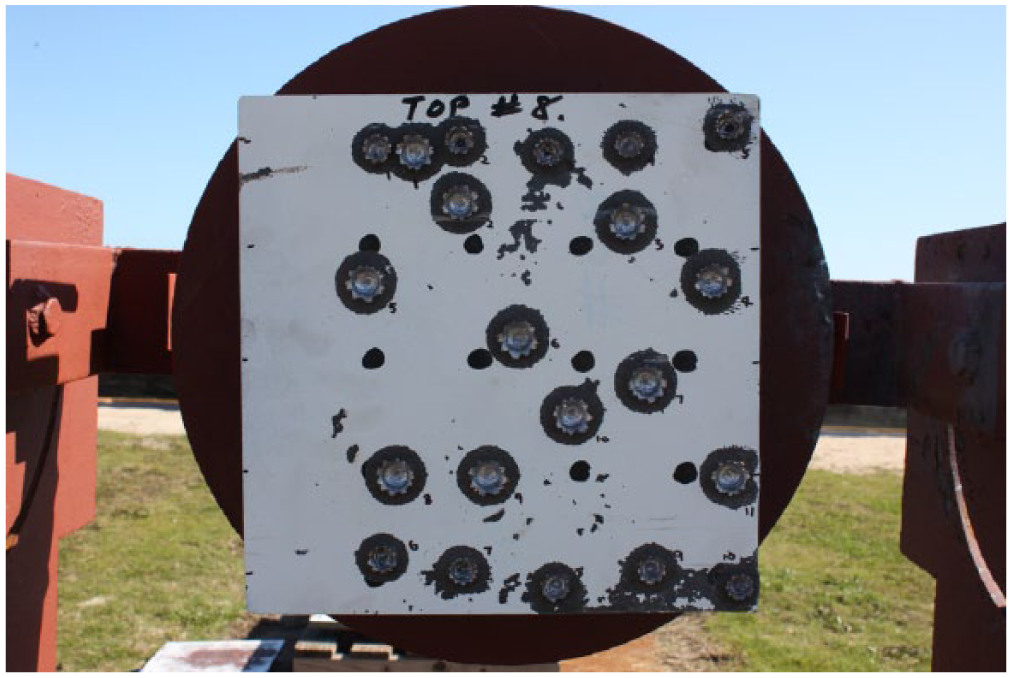
Example of the accuracy of the ballistic field test ammunition.
Measurement of velocity
The muzzle velocity of each round of ammunition was measured during the ballistic testing using a ballistic chronograph (Shooting Chrony, 2017) supplied by the rifle range. The chronograph was set up at a distance of approximately 5 m from the muzzle of the rifle. The chronograph used was photoelectric, so as each round of ammunition was fired through the chronograph, the momentary change in light intensity as the bullet passed over the detectors sent a signal to the timer. The timer was shut off when the bullet passed through the second photo sensor, and the velocity was calculated based on the time taken to travel the set distance between the two sensors. The velocity was then output to a LCD screen in feet per second and was manually recorded. The velocity measurements according to the chronograph manufacturer are accurate to 0.5% (Shooting Chrony, 2017). The statistical parameters for muzzle velocity for both the 5.56 mm and 7.62 mm ammunitions are shown in Table 3. It is observed that the velocities vary by no more than ±3%.
Statistical parameters for muzzle and impact velocities.
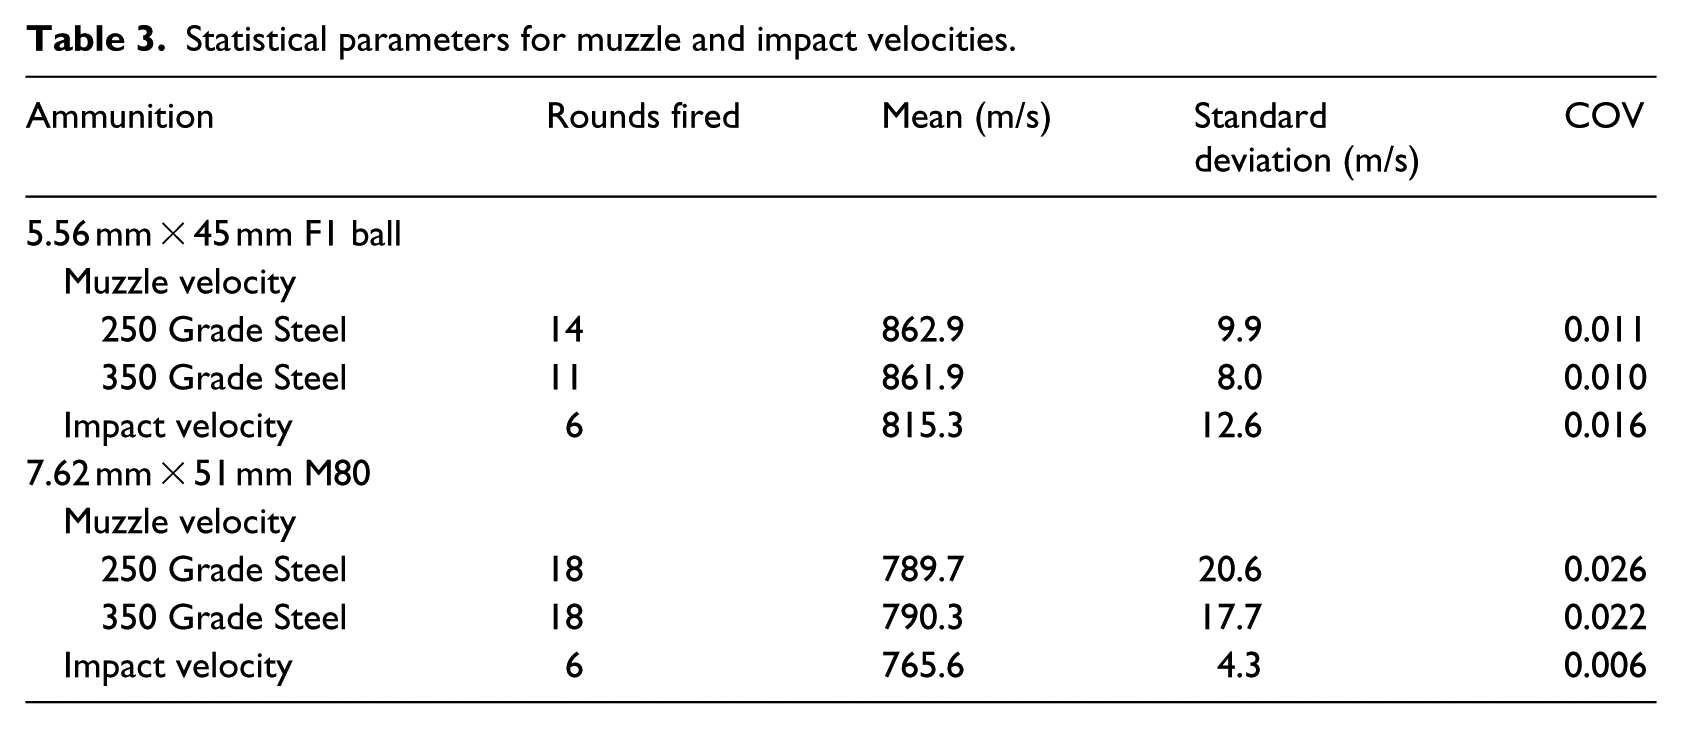
Once testing of the steel plates had been completed, the chronograph was relocated to a distance of 50 m from the rifle, equal to the range of the steel targets. Six rounds of each ammunition were fired through the chronograph and the velocities were recorded (see Table 3). The mean muzzle velocity was then compared to the mean velocity at a range of 50 m to work out the average loss of velocity over that distance. For the 5.56 mm ammunition, the average loss of velocity is 47.1 m/s, while for the 7.62 mm ammunition this is reduced to 24.4 m/s.
Measurement of bullet mass
During the terminal ballistic field testing, a number of bullets were separated from the cartridges using a kinetic bullet puller. Two of the 5.56 mm × 45 mm F1 ball bullets and two of the 7.62 mm × 51 mm M80 bullets were obtained. The bullets were then measured to a precision of four decimal places. These measurements are compared to the nominal weight in Table 4.
Projectile weight measurements.
As only two of each type of ammunition were measured, these data could not be used to define the projectile mass probabilistically. Instead, as the measured weight equalled the nominal weight, the nominal weight was adopted as the mean. Magee et al. (2012) determined the mean and standard deviation of bullet weights for a range of ammunition. They studied two types of 5.56 mm ammunition, manufactured by Orbital ATK, who also produce the 7.62 mm × 51 mm rounds used during the ballistic field testing. The average coefficient of variation for these two ammunitions was 0.30%. This equates to standard deviations of 0.012 g and 0.029 g for 5.56 mm and 7.62 mm rounds, respectively.
Penetration mechanism
The crater formed by the impact of each projectile was round and fairly uniform, and petalling on the front face of the plate was observed in all instances (see Figure 10). Petalling on the front plate indicates that the penetration mechanism is a combination of ductile failure and spalling (Backman and Goldsmith, 1978).
Front face impact showing petalling.
The back of the plates showed very little sign of damage, deformation or bulging. The bulging on the rear plate was no more than 0.3 mm for Grade 250 Steel. There was no damage to the rear of the plate for Grade 350 Steel. This suggests that the ballistic tests replicated the penetration of semi-infinite plates.
Measurement of penetration depth
Following the ballistic field testing, the depth of penetration of each round of ammunition was measured. While scanning the deformed target would have been preferable, this was not available. Hence, these measurements were made using a digital depth gauge. The depth of penetration for some of the rounds of ammunition could not be measured, reducing the size of the final data set. The reasons for this were either because of:
The location of the penetration relative to surrounding penetrations, or
The amount of residual lead from the bullet remaining in the penetration.
Due to petalling, a steel washer was used to measure the depth of penetration relative to the flat surface of the plate. Where a penetration was too close to an adjacent penetration the steel washer was not able to sit flat against the plate and the depth of penetration could not be accurately measured using the depth gauge.
As a result of the high velocities at which the bullets impact the target, residual amounts of the projectile jacket and lead core were present in the penetrations. Unlike armour piercing rounds, there was no ‘damage’ to the jacket or core to observe for lead ball ammunition. Hence, the remainder of the jacket and projectile fractured into minute debris – hence, it was not possible to observe damage to the bullet as the debris was too small to capture. In order to remove the lead, the residual material in one of the penetrations was heated to above the melting point of lead (327.5°C) using a blow torch; however, this did not cause the residual material to melt. The ammunition used for the ballistic field testing actually consists of an alloyed lead/antimony core or steel penetrator. The melting points of these metals are higher than that of lead which makes it difficult to separate the lead alloy from the steel as the melting points are closer together.
As the use of heat to remove the residual material failed, a number of the penetrations were cut in half in order to determine if the thickness of the residual bullet jacket and core could be measured visually. The plates were cut with a band saw and then sanded with a linisher and wet and dry sandpaper. However, the difference between the steel, jacket and core was not visible to the naked eye. The penetrations were viewed under a microscope; however, due to the roughness of the surface finish, the delineation between the materials was not visible. The specification for the ESR International Digital Pit Gauge states that the ‘permissible error’ is equal to ±0.03 mm. However, due to uncertainty about depth of residual material in the penetration, the bias in depth penetration measurement is in the region of 0.0–0.2 mm. Hence, penetration depths are increased by 0.1 mm from those observed to allow for residual projectile material in the crater.
Ballistic test results
The histograms of measured penetration depths are shown in Figure 11, and statistical parameters for depth of penetration are shown in Table 5. As expected, penetration is higher for the lower grade 250 MPa mild steel. Despite its smaller calibre, the 5.56 mm × 45 mm F1 ball ammunition recorded deeper penetrations than the larger calibre 7.62 mm × 51 mm M80 ammunition. The penetration of the 5.56 mm ammunition is approximately 1.5 mm deeper for both mild strength and high strength steel plates when compared to 7.62 mm rounds. This appears to be a somewhat unexpected result as 7.62 mm × 51 mm M80 ammunition has a much higher mass and higher nose shape (performance) coefficient
Histograms of observed ballistic penetration.
Statistical parameters for steel penetration from ballistic tests.
The coefficient of variation (COV) of steel penetration is approximately 0.10 and 0.03 for 5.56 mm and 7.62 mm rounds, respectively. It is unclear why there is a higher COV for 5.56 mm ammunition. However, the variability of the smaller calibre projectile may be higher due to the interaction of the steel penetrator and the lead core on impact. For the 7.62 ammunition, the projectile is 100% lead so perhaps less uncertainty about the penetrating mechanism. Moreover, both rounds are ‘yaw dependent’ which can result in varying performance ‘depending upon where in the yaw/pitch cycle the bullet strikes its target’ (Woods, 2010).
Comparison of test results with predictive models
Predictive models
The interaction between the target rear surface and the projectile lowers the resisting stress on the projectile as it approaches the rear surface of the target. It can also induce failure mechanisms at the back of the target, such as scabbing or spalling, further reducing resistance. This means that the thickness required to prevent the perforation of a given projectile is larger than the corresponding depth of penetration in a semi-infinite target, and the two are not equivalent (Rosenberg and Dekel, 2016; UFC 3-340-02, 2008). In our case, the predictive models assume that the plate thickness is thick enough so that deformation of the rear surface can be neglected (e.g. Yarin et al., 1995).
A range of models, both empirical and analytically derived, are available (e.g. Anderson and Riegal, 2015; Ben-Dor et al., 2006; Rosenberg and Dekel, 2016; Zukas, 1990). However, many are not applicable to the characteristics of this ballistic test. For example, many models relate to penetration of a projectile into a target of finite thickness, that the projectile is perfectly rigid (i.e. armour piercing), or that the calibre is large (e.g. Chen et al., 2013). Moreover, most models are based on curve fits of experimental data (Anderson and Riegal, 2015). And nearly all models are analytical, are based on hard projectiles with idealised geometries and homogeneous materials, and require many material properties and constants that are difficult to measure or infer (e.g. Ben-Dor et al., 2013; Wen, 2002). Design guidelines from the US Department of Defence’s Design to Resist Direct Fire Weapons Effects (UFC 4-023-07, 2017), Design and Analysis of Hardened Structures to Conventional Weapon Effects (UFC 3-340-01, 2002) and NATO’s Design Threat Levels and Handover Procedures for Temporary Protective Structures (NATO, 2008) provide empirical equations or design tables for the perforation of steel plates which is often of most relevance to protective design. However, no guidance is given for penetration. Numerical methods using finite element analysis, such as Kilic et al. (2015), Senthil et al. (2017) and others, are now routinely used to predict the penetration ability of projectiles.
The United States design guidelines Structures to Resist the Effects of Accidental Explosions (UFC 3-340-02, 2008, which superseded TM5-1300, 1990) provides empirical equations for the penetration of fragments in a mild steel plate. A standard fragment shape is assumed as shown in Figure 12. The equations apply to the penetration of mild steel so are conservative for plates with a Brinell hardness number over 150. The detonation of cased explosives results in the formation of fragments, of equivalent size and velocity to a bullet fired from a rifle, so the empirical model presented is potentially suitable for developing a probabilistic model for ballistic penetration. Moreover, UFC 3-340-02 (2008) states that ‘for design purposes, the normal penetrations defined for a bullet-shaped fragment can usually be assumed as critical’. It is important to highlight that the UFC 3-340-02 (2008) model is suitable for predicting depth of penetration in thick plates, whereas other empirical approaches (e.g. UFC 3-340-01, 2002; UFC 4-023-07, 2017) models plate perforation. The UFC 3-340-02 (2008) model is the only empirical model the authors could find for predicting the penetration of semi-infinite steel plates.
Shape of standard primary fragment (UFC 3-340-02, 2008).
The depth of penetration, in inches, for a fragment penetrating a mild steel plate is (UFC 3-340-02, 2008)

where x is the depth of penetration of a mild steel plate in inches, Wf is the fragment weight in ounces, Vs is the impact velocity in thousands of feet per second (kfps) and k is a relative penetrability constant depending on the casing metal given as
where pf and ps are the densities of the fragment material and the plate, respectively (Marchand et al., 1994); BHNf is the Brinell hardness of the fragment material, and typical values of k are given in Table 6. The source for equations (1) and (2) seems to be from Drake et al. (1989) and is based on projectile material properties given in Table 6. While the model is based on penetrations from indirect fire, it is also broadly applicable to direct fire situations. The model is included in the widely used software ConWep (1991).
Material properties and relative penetrability constant (Marchand et al., 1994; UFC 3-340-02, 2008).
There is some consensus that the penetration depth for steels is inversely proportional to the cube root of Brinell hardness (BHN; for example, Backman and Goldsmith, 1978). In this case, the penetration depth for high strength steel plates may be given as
where BHNMS is the BHN for mild steel, and BHN is the hardness of high strength steels.
Ballistic test data from Kilic et al. (2015) is used to help validate equations (1) and (3). In this test, a 7.62 × 54 B32 API (armour piercing) round impacted Secure 500 Armour steel at 854 m/s. Several tests were conducted, and the measured penetrations were 12.3–12.9 mm. The projectile has a mass of 10 g, and the armour steel has a Brinell hardness of 480–530. UFC 4-023-07 (2017) specifies the BHN for mild steel is 110–160. Hence, in this case, mean BHNMS = 135 for mild steel. Equation (1) gives a penetration into mild steel of xMS = 19.0 mm when k = 1 and then corrected for hardened steel (BHN = 500), equation (3) yields 12.3 mm. The predicted penetration depth is consistent with the test results and provides some validation of equations (1) and (3).
Comparison with test results
The Australian 5.56 mm × 45 mm F1 projectile comprises a ‘hardened penetrator and a lead slug enclosed in a gliding metal jacket’ (Australian Munitions, 2017a) and is equivalent to American M855 and NATO SS109 ammunition. However, it is not clear what type of steel ‘hardened’ refers to. Sherrill et al. (2012) state that the M855 bullet ‘may be considered armor piercing due to the steel penetrator in the front’. However, other sources quote the SS109 and M855 rounds as having a mild steel penetrator (Barnes, 2016), or simply a ‘steel penetrator’ (BAE Systems, 2017; Orbital ATK, 2017). Coghe et al. (2010) refers to SS109 and M855 projectiles comprising of a ‘high-hardness steel penetrator’, and in their numerical modelling specify Steel 4340 as the material for the penetrator, which has a BHN of 250–400 (Interlloy, 2017).
The UFC 3-340-02 (2008) penetration model given by equation (1) assumes a homogeneous projectile, not one comprised of two components: steel penetrator and lead core. The steel penetrator is not armour piercing (AP) as AP rounds generally have a high hardness in excess of 800 BHN. The steel penetrator is ‘hardened’ with a BHN of approximately 250–400, which is well in excess of the hardness of mild steel (110–160 BHN). However, the bulk of the projectile is lead with a lower hardness than mild steel. The penetration depth from an Australian 5.56 mm × 45 mm F1 projectile is bounded by assuming the projectile is homogeneous comprising (1) armour piercing steel (k = 1) or (2) lead (k = 0.5). In this case, BHNMS = 126 and BHN = 149 for Grade 250 and Grade 350 plates, respectively (see Table 2). Table 7 shows that the predicted penetration depths for a mild strength steel plate vary significantly, but the variation is around the mean test results given in Table 5. If a mild steel projectile is assumed (k = 0.7), predicted penetration depths are 9.3 and 8.8 mm for mild steel and high strength steel plates, respectively.
Comparison of ballistic test results and UFC 3-340-02 (2008) model predictions.
To be sure, the predictions might be improved if the mass of the steel penetrator is known. However, the UFC 3-340-02 (2008) penetration model given by equation (1) is unable to model Australian 5.56 mm × 45 mm F1, U.S. M855 or NATO SS109 projectiles as the steel penetrator and lead core are non-homogeneous, whereas UFC 3-340-02 (2008) assumes a homogeneous projectile material.
The 7.62 mm × 51 mm M80 projectile comprises a lead core. In this case, the UFC 3-340-02 (2008) penetration model given by equation (1) is appropriate for k = 0.5 (see Table 6). Table 7 shows that the predicted penetration depth for a mild steel plate is thus 8.2 mm, or 1.5 mm higher than the mean test results. The model error, defined as test result divided by predictive model, is 0.82. For 350 Grade steel, BHN is 149 (see Table 2). In this case, Table 7 shows that the predicted penetration depth for a high strength steel plate is 7.7 mm, or 1.5 mm more than the mean test results. The model error is 0.81. This suggests that the UFC 3-340-02 (2008) penetration model over-predicts penetration depths and so is conservative. This may be due to the ‘yaw dependent’ nature of the ammunition (Woods, 2010), or it may be that the design model is deliberately conservative for design situations.
Conclusion
The article describes ballistic field test results of 5.56 mm × 45 mm F1 Ball and 7.62 mm × 51 mm M80 Ball ammunition. The targets were 25-mm-thick mild and high strength steel plates of Grade 250 MPa and 350 MPa, respectively. The tests recorded penetration depth, muzzle and impact velocities, and bullet mass. Despite its smaller calibre, the 5.56 mm × 45 mm F1 Ball ammunition recorded deeper penetrations than the larger calibre 7.62 mm × 51 mm M80 Ball ammunition. This is due to the 5.56 mm ammunition comprising a hardened steel penetrator and lead core, whereas the 7.62 mm ammunition comprised only a lead core. Up to 21 shots were fired for each type of munition. The coefficient of variation (COV) of steel penetration into semi-infinite steel plates is approximately 0.10 and 0.03 for 5.56 and 7.62 mm rounds, respectively. The article also presented predictive models of steel penetration depth and compares these to the ballistic test results. The United States Department of Defense penetration model over-predicts penetration depths, and so the model error, defined as test result divided by predictive model, is approximately 0.8 for 7.62 mm ammunition. This level of conservatism is to be expected from a design model.
Footnotes
Acknowledgements
The authors appreciate the laboratory assistance of Goran Simundic, Michael Goodwin and Dr Igor Chaves for assistance with measurement of the field test results.
Declaration of conflicting interests
The author(s) declared no potential conflicts of interest with respect to the research, authorship and/or publication of this article.
Funding
The author(s) received no financial support for the research, authorship and/or publication of this article.