
Abstract
Precast concrete segmental column has attracted many attentions for the past decades due to its unique features especially in improving the construction quality and efficiency. However, the performance of precast segmental column under lateral impact loading has been less studied. Our previous studies performed laboratory pendulum impact tests on scaled segmental columns to investigate their behaviours when impacted at mid-span of the column. This article studies the response of segmental column when impacted near the column base, which generates different response modes and failure mechanisms compared to the columns subjected to the mid-span impact. Lateral impacts are applied either to segmental joint between the two bottom segments or directly onto the centre of the base concrete segment. A detailed three-dimensional numerical model is created and validated with laboratory impact testing results on scaled segmental columns. A full-scale 3-m tall segmental column is then numerically built to study the behaviour under near base impact. The column damage and failure modes are analysed. The influences of prestress level in the post-tensioning tendon and concrete strength on the performance of segmental column subjected to near base impacts are investigated through numerical simulations.
Introduction
Prefabricated structures have been popularly used in construction industry in recent years because of its many advantages such as enhancing the construction quality, minimizing traffic disruption around construction site, improving work zone safety and reducing environmental impact. Apart from the above-mentioned features, one of the most luring advantages of employing prefabricated structures is the improvement in construction efficiency. Some studies (Shahawy, 2003) found that up to half of the construction time can be effectively reduced using precast segmental elements in construction. Precast segmental column is one of the most important structural elements for prefabricated structures. Segmental column, as literally defined, is composed of multiple segments for the ease of transportation and erection in the initial concept. Its application can go back to hundreds or even thousands of years when many iconic structures such as Greece Tempo utilized segmented stone pillars. A number of modern constructions such as Lavaca Bay Causeway, the USA have successfully employed precast segmental concrete columns (Ou, 2007; Sprinkel, 1985). In modern construction, segmental column normally employs post-tension prestress tendon which ties the erected concrete segments together to enhance column integrity. According to the type of bonding, a segmental column can be categorized as having bonded or unbonded prestressing tendon/bar. In a bonded post-tensioning system, the corrugated ducts embedded in concrete are grouted with cementitious materials after the prestress tendon is stressed. The bonded post-tensioning system can increase the lateral strength of the column. Yielding of the bonded tendon can also absorb some imposed energy. However, the bonded prestress tendon reduces the self-centring capacity of the column (Arai et al., 2000; Chang et al., 2002). Unbonded post-tensioning system is less vulnerable to tendon yielding, thus preserving the necessary clamping force needed to hold the column segments together. The system has better self-centring capacity to bring the column back to its original position. But in the meanwhile, the unbonded tendon is more vulnerable to corrosion damage (Billington and Yoon, 2004; Chou and Chen, 2006; Hewes and Priestley, 2002).
To widen the application of segmental column and apt to high seismic areas, many researches have been performed over the past decades on cyclic loading capacities of segmental columns, focusing on the evaluation and improvement of their seismic performance (Dawood et al., 2011; ElGawady and Dawood, 2012; Kim et al., 2010; Li et al., 2018; Ou et al., 2007; Shim et al., 2008; Zhang et al., 2018b). Different laboratory tests and numerical simulations have been performed. It is found that segmental column exhibits unique features with typical flag-shape hysteric behaviour under cyclic loading. Comparing with conventional monolithic reinforced concrete (RC) column, segmental column can undergo much larger lateral displacement (Ou et al., 2007). The failure of a segmental column is mostly flexural failure with plastic hinge formed around the base of the column. Since the shear force generated by ground movement is relatively small, friction between adjacent concrete segments is sufficient to resist the shear force. Shear dominated failure such as shear slip between two adjacent segments is commonly not found (Kim et al., 2010; Shim et al., 2008). The influences of different column specifications such as the prestress level and the number of segments/joints have been investigated. It was found that higher level of prestress in the post-tensioning tendon helps to improve column lateral stiffness. But the number of segmental joints has very limited effect on the ductile behaviour when the location of joint is far from the column base (where plastic hinge is formed) (Shim et al., 2008). Therefore, focus is recommended on the base connection between the segment and column footing in seismic resistance design.
During its service, a segmental column, for example, a bridge pier or a building column, could experience other types of extreme dynamic loads such as blast load from accidental explosion and deliberated terrorist bombing, and impact load from falling rock and vehicle collision. It is therefore often imperative to consider the multi-hazards in analysis and design of segmental columns (Zhang et al., 2018b). Unlike the studies of the performances of segmental columns under seismic loading, the study of the responses of segmental columns under impact loading is very limited, and its impact responses are not adequately understood yet. Zhang et al. (2016a; 2018a) experimentally investigated the response of segmental column under impact loading. In these studies, the columns were impacted at the mid-span, which generated the maximum flexural deformation of the column. Through comparing with the reference monolithic RC column, it was found that segmental column exhibits good resistant capacity to lateral impact loading with excellent flexural deformation capability. As the prestress tendon provides restoring force to the deformed column, segmental column shows outstanding self-centring capacity. Nevertheless, since longitudinal reinforcement does not continue through adjacent concrete segments, the shear resistance of segmental column without shear key, which is common in the current studies of segmental columns to resist seismic loading, purely relies on the friction between adjacent segments. When the lateral impact force is large, shear slip could be developed between adjacent segments. To improve the shear resistance, prism-shape concrete shear key was introduced to segmental column, which was found effective to increase the shear resistance capacity and hence reduce the slip between segments. However, prism-shape shear key was found leading to more severe concrete damage around the shear key upon impact due to stress concentration (Zhang et al., 2016b). Optimized dome-shape shear key was subsequently introduced and tested, which was found effective in mitigating stress concentration-induced concrete damage while providing shear resistance at the segment joints (Hao et al., 2017).
The response of segmental column under lateral impact loading near column base has not been properly studied yet. In a recent study, Chung et al. (2014) carried out numerical modelling to investigate the behaviour of segmented bridge pier under vehicle impact near the base. The impact load onto the pier and lateral displacement of the pier were evaluated. Because a very large bridge pier and a small vehicle were considered, the segmented bridge pier only experienced localized and surface damage. The global response of the entire segmental column was not investigated. Do et al. (2018) developed a numerical model to predict the behaviour of segmented bridge pier under vehicle impact. The performance of a segmented bridge pier under a Chevrolet pickup impacting at the second concrete segment with different velocities was numerically simulated. It is worth noting that due to the unique feature of segmental column which comprises a series of concrete segments and segmental joints, the behaviours of column impacted at different locations along the column are very different. There has been no systematic study of the response modes and damage mechanisms of segmental columns impact at different locations yet.
This study extends the previous investigations by the authors on the response and damage of segmental columns subjected to the impact at mid-span of the column. The response mode and damage mechanism of segmental column subjected to lateral impact at segmental joint between the two bottom segments and directly onto the centre of the bottom concrete segment are studied. A scaled numerical model of segmental column is built and validated with laboratory impact tests. A full-scale numerical model of segmental column is then generated and simulated to help understand in detail the behaviour of segmental columns, and to study the influential factors including prestress level and concrete strength on the impact resistance capacity of the column.
Previous laboratory tests
Test details
Two quarter-scale segmental columns of 800 mm tall with 100 mm × 100 mm cross-section were tested. Each column is composed of five RC segments. The segmental columns were connected to the footing using two 6 mm diameter starter bars. Concrete shear key with dome-shape mortise and tenon (107 mm radius spherical shape) were used for the concrete segments to improve the shear resistance between adjacent segments at segmental joints. 9.3-mm-diameter seven-wire strands were post-tensioned to 30 kN in the centre of the segmental column as prestress tendons (Figure 1). A 300 kg steel impactor was used, which was launched at gradually increased velocity (0.23, 0.64, 1.37, 2.71 and 3.58 m/s) in each test to strike the column. They correspond to the column minor damage, moderate damage, major damage and ultimate failure. More details about test setup can be found in Zhang et al. (2018c).
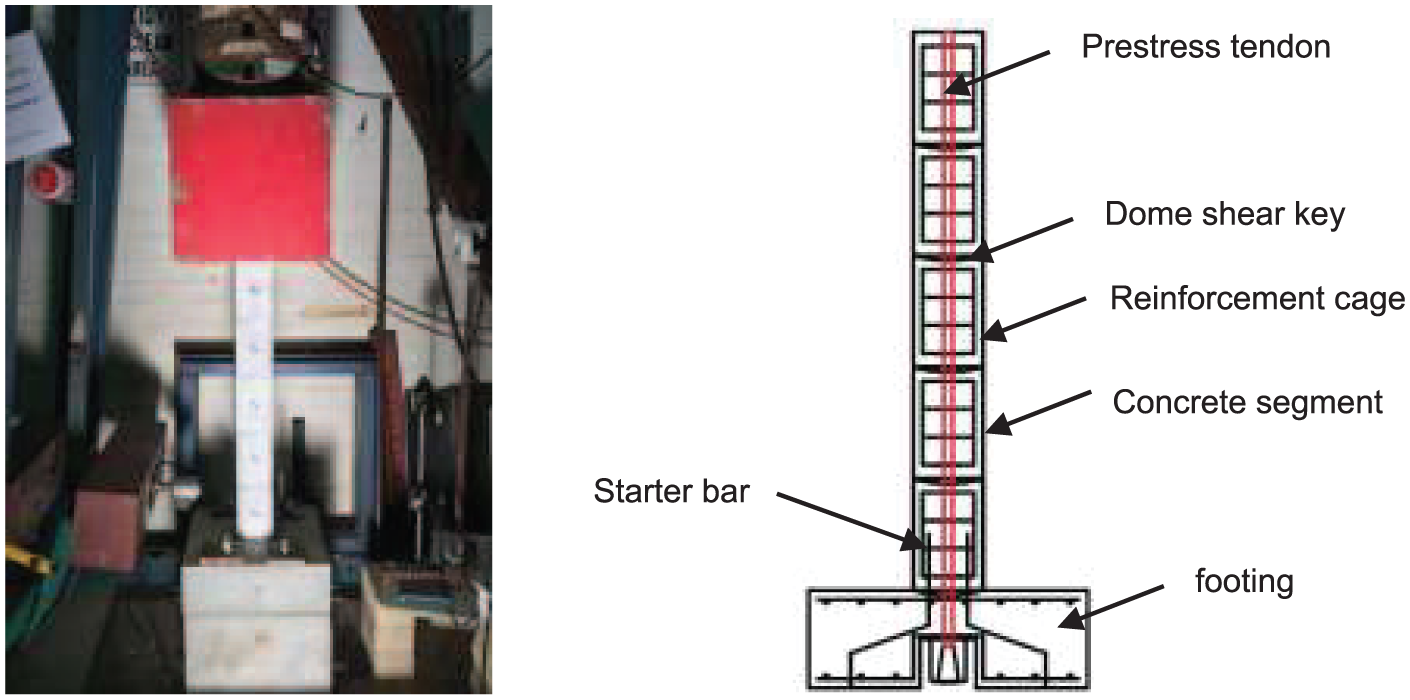
Illustration of testing system and segmental column.
Testing result
Figure 2 shows the failure patterns of the columns. As shown, when subjected to impact at segmental joint, the two adjacent segments suffer severe concrete crushing damage at the joint due to the combination of direct impact force and the flexural induced compressive force. Shear damage is also induced in the bottom segment with apparent diagonal shear cracks across the concrete segment, which is induced because the bottom segment was fixed to the concrete footing. This observation is different from the damages induced on concrete segments when impacted at the mid-span of the column, in which less severe concrete crushing damage is observed, but no diagonal shear is induced (Zhang et al., 2016a). The failure pattern of column when subjected to direct impact on the bottom segment is completely different. Damage is mainly limited to the concrete crushing of the bottom segment, where little flexural bending–induced damage is found. The large lateral impact causes direct shear failure of the column and pushes the bottom segment away from its original position due to the complete failure of the shear key and anchoring starter bars that connect the base segment to the concrete footing. Like the case of impacting the bottom joint presented above, the top segment also experiences significant damage due to the large shear force and bending moment induced from the inertial force of the weight supported by the column.
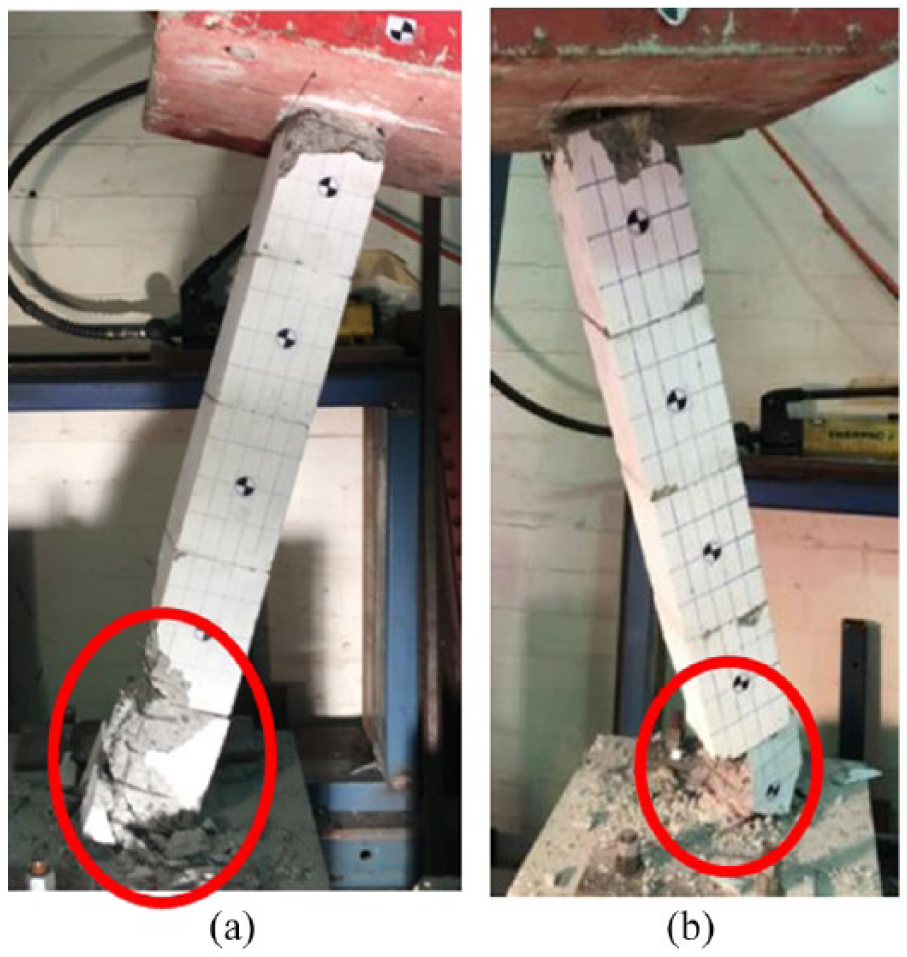
Ultimate failure of the segmental columns: (a) segmental joint impact and (b) base segment impact.
Figure 3 presents the load time histories. When the column is subjected to impact at segmental joint, the load time history is featured with two-peak impact load which becomes more and more apparent as the impact velocity increases. For instance, in Impact 02, a first peak of 20.6 kN was measured which quickly reduced and then rebounded to about 16.8 kN before it gradually reduced to zero. The peak impact loads increase as the impactor velocity increases. When the column is subjected to impact directly on the bottom segment, the interaction between the impactor and the column is less significant. Upon the impactor struck, the impact loads increase sharply to a maximum, which gradually decays to zero. There is not necessarily a second peak associated with the column rebound because the column suffers brittle direct shear failure. This is more obvious when the impact load is large. This pattern of impact load time histories is quite similar to those measured on a monolithic RC column (Zhang et al., 2016a), because the segmental column resists the impact load primarily through shear deformation of the bottom segment rather than flexural bending deformation with segmental joint opening.
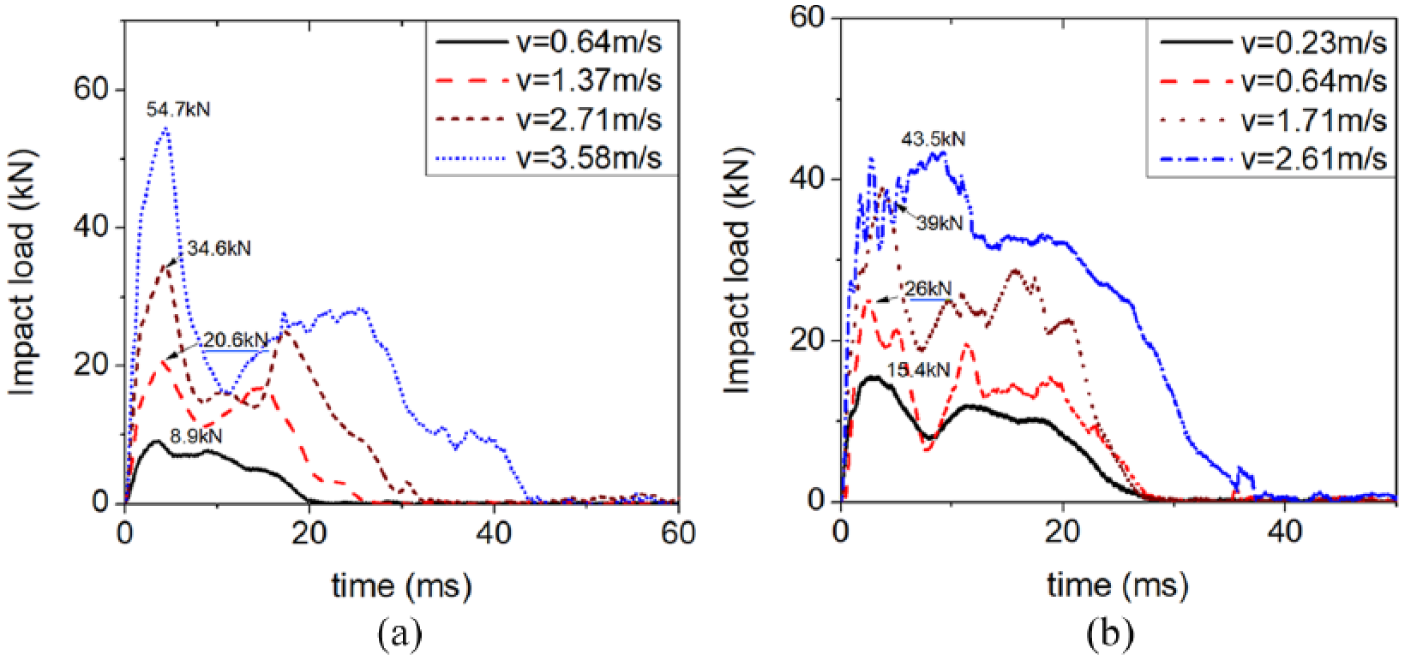
Recorded impact load time histories of the tested columns: (a) impact at bottom segmental joint and (b) impact at base concrete segment.
Figure 4(a) shows the lateral displacement time histories. When the segmental column is impacted at the segmental joint, the deflection time histories are featured with an initial peak deflection which quickly rebound and followed by free vibration of the column. Because of the different vibration modes and the relatively low damage level, the vibration period of this segmental column during free vibration phase is shorter. When the segmental column is impacted directly on the bottom concrete segment, the vibration of the column becomes less significant. The impact forces result in peak deflections on the bottom segment in each impact, which rapidly rebound and damp out. This is because the response of the segmental column under bottom segment impact is dominated by shear deformation mode.
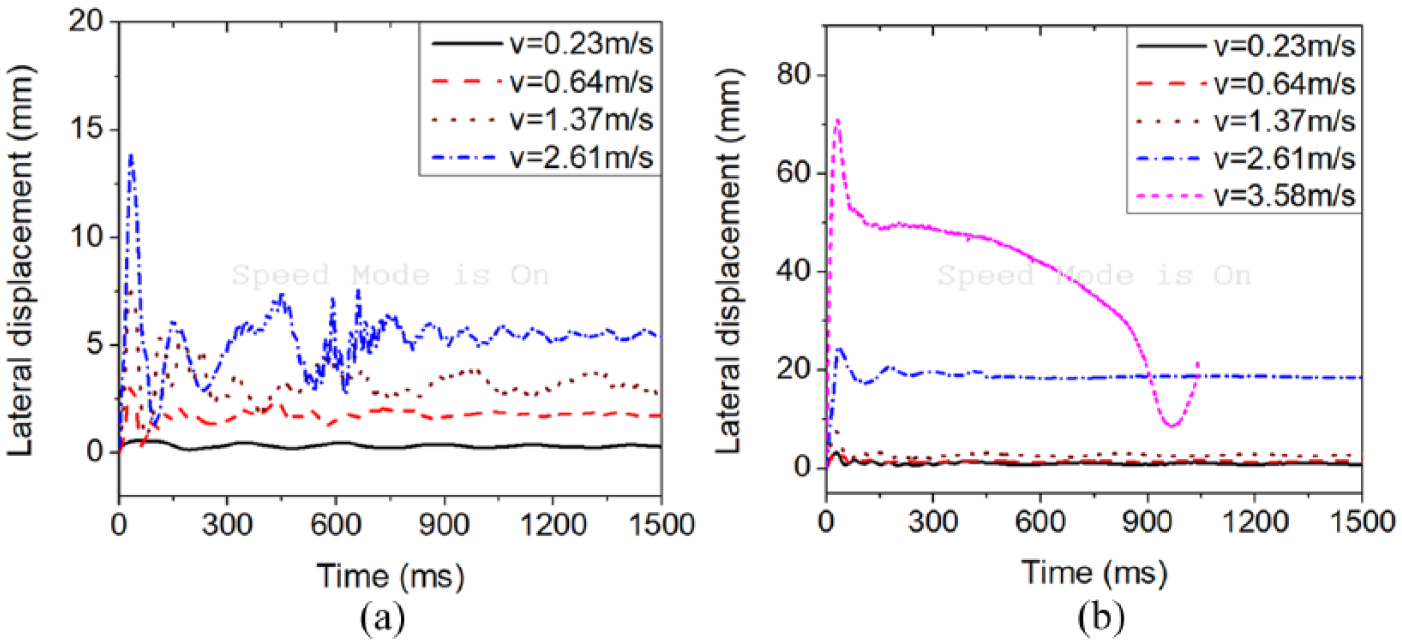
Lateral displacement time histories: (a) impacted at the bottom segmental joint and (b) impacted at the base concrete segment.
Numerical modelling and validation
The above-mentioned laboratory tests are numerically modelled to verify the accuracy of the numerical model. The verified model is used to investigate the response of segmental column under lateral impact loading at segmental joint and directly on the bottom segment. The detailed three-dimensional model of segmental column is introduced here.
Model details
Numerical model
Numerical modeling was carried out using hydro-code LS-DYNA (2007). Figure 5 shows the numerical model generated which replicates the tested segmental column as shown in section ‘Previous laboratory tests’. SOLID_164 solid element (eight-node constant stress) with single integration point is used for concrete and prestress tendon, and BEAM_161 beam element (three-node) with 2 by 2 Gauss integration for steel reinforcement. To ensure conservation of mass and energy, no erosion is used in the numerical calculations; 5 mm mesh is used after mesh sensitivity analysis.
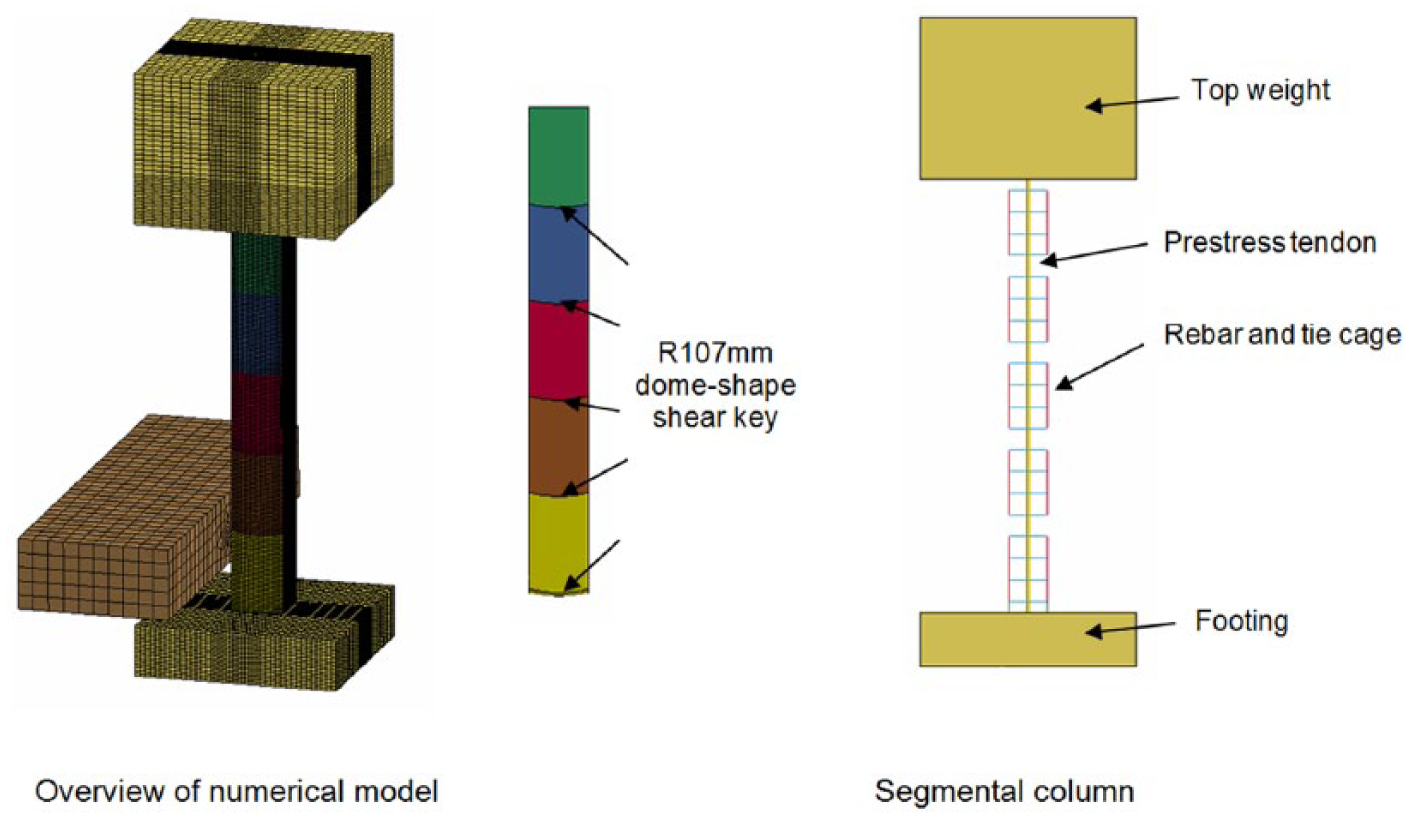
Numerical model of segmental column under impact.
The contact between concrete segments is modelled by Automatic_Surface_To_Surface contact element with empirical static and dynamic friction coefficient of 0.6 and 0.5, respectively. The contact between the unbounded prestress tendon and the concrete segments is also modelled with Automatic_Surface_To_Surface contact element but without consideration of the friction effect. The common nodes between reinforcement and concrete are merged. The post-tensioning force in the tendon is initiated through dynamic relaxation with implicit analysis prior to the explicit dynamic analysis. The top mass is supported by column and is not constrained for lateral and rotational movement. The footing is assumed to be fully fixed to the ground by fixing all the degrees of freedom of the bottom face. It is worth noting that this boundary condition in the numerical model simplifies the bolt tensioning boundary condition in the laboratory test to avoid complex modelling and to improve computation efficiency. Numerical validation in section ‘Model validation’ demonstrates this simplification leads to acceptable results as compared to the lab testing data.
Material models
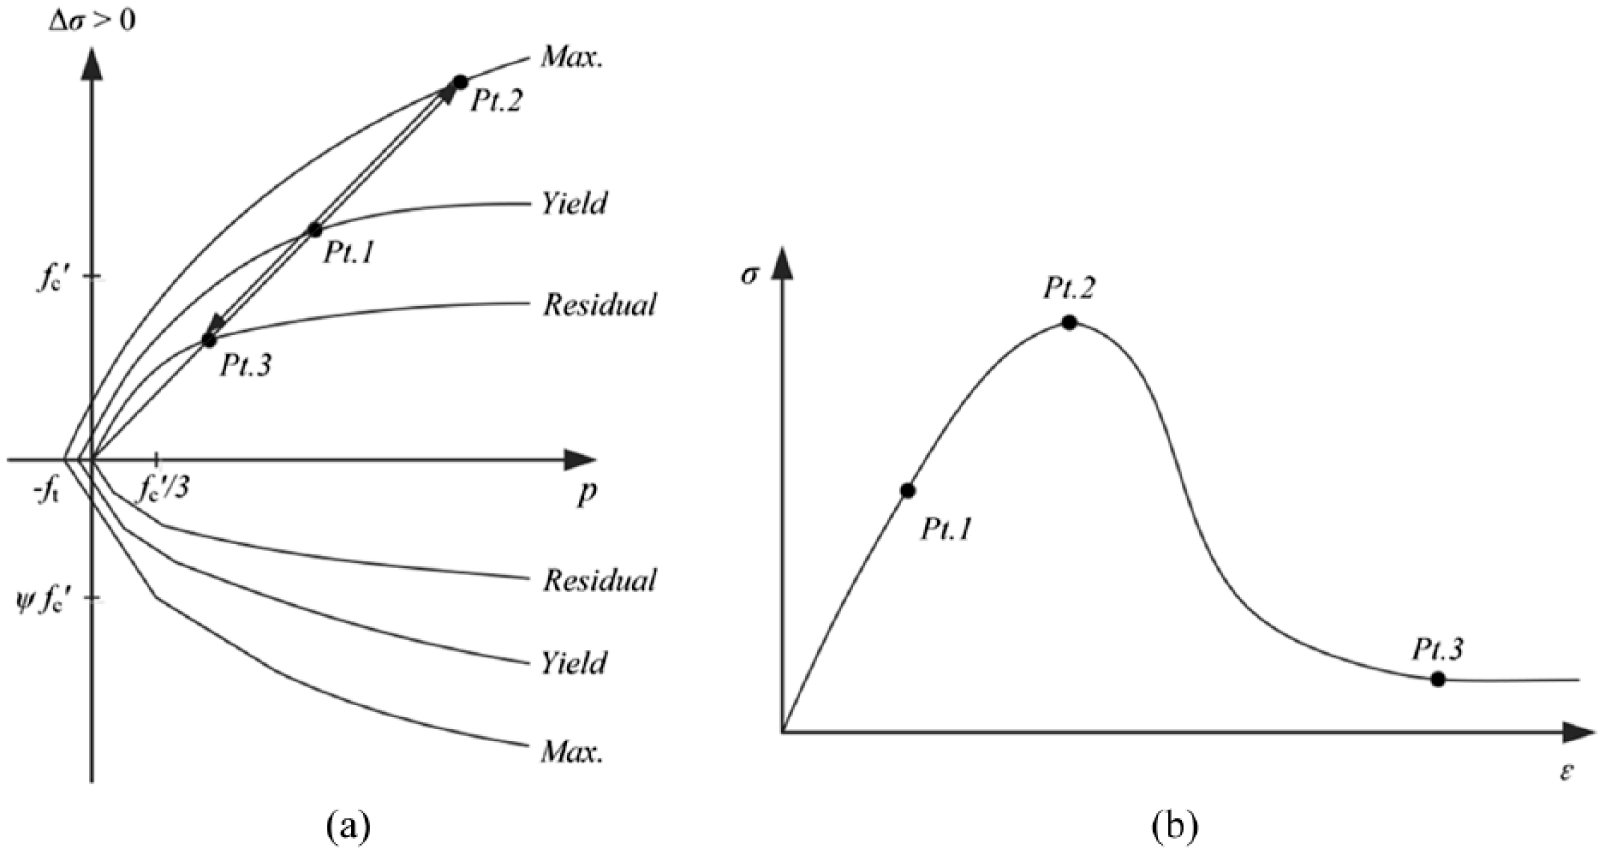
Concrete_Damage_REL3 (MAT_72) model is used to model concrete material. MAT_72 model is a popular concrete material model for dynamic analysis, which is a plasticity-based model that considers concrete damage, confining pressure and strain rate effect. It employs three shear failure surfaces. The primary advantage of MAT_72 model is that only a single-user input, that is, the confined compressive strength, is required, while the remaining material constants are automatically generated by the model itself. In MAT_72 model, the stress tensor is expressed as the sum of the hydrostatic stress and the deviatoric stress. The hydrostatic stress varies with concrete volume, and the deviatoric stress controls the shape deformation. The EOS_TABULATED_COMPACTION model in LS-DYNA is employed to correlate the pressure as a function of the volumetric strain. The strength model as illustrated in Figure 6 is used to depict the intact, yield and residual strength curves of concrete material. During initial loading or reloading, the deviatoric stress remains elastic until the stress reaches the initial yield surface. The deviatoric stress then increases until the maximum strength surface is reached. Beyond this stage, the response can be perfectly plastic or soften to the residual strength surface. A damage scaler is adopted to depict concrete damage level. The damage scaler ranges from 0 to 1.0 for a material that is experiencing strain hardening, and from 1.0 to 2.0 to describe material softening stage.
(a) Strength model and (b) hydrostatic model of MAT_72 model.
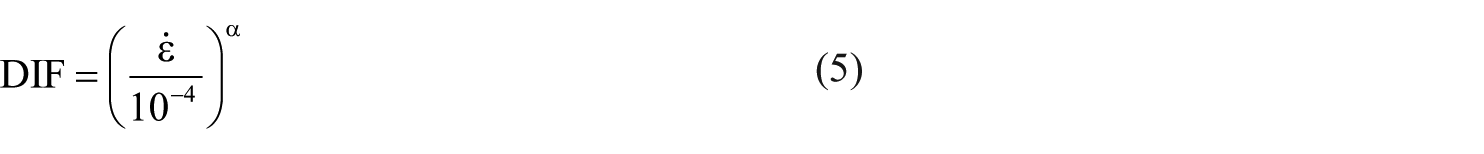
Dynamic increase effect has been widely recognized to influence material dynamic properties. With experimental and numerical studies, relation of dynamic increase factor (differential item functioning (DIF)) with respect to strain rate is available for concrete (Hao et al., 2012, 2016; Malvar and Crawford, 1998). Equations for the DIF of concrete material for both the compressive and tensile strength are defined as


where fcd and ftd are the dynamic compressive and tensile strengths at the strain rate
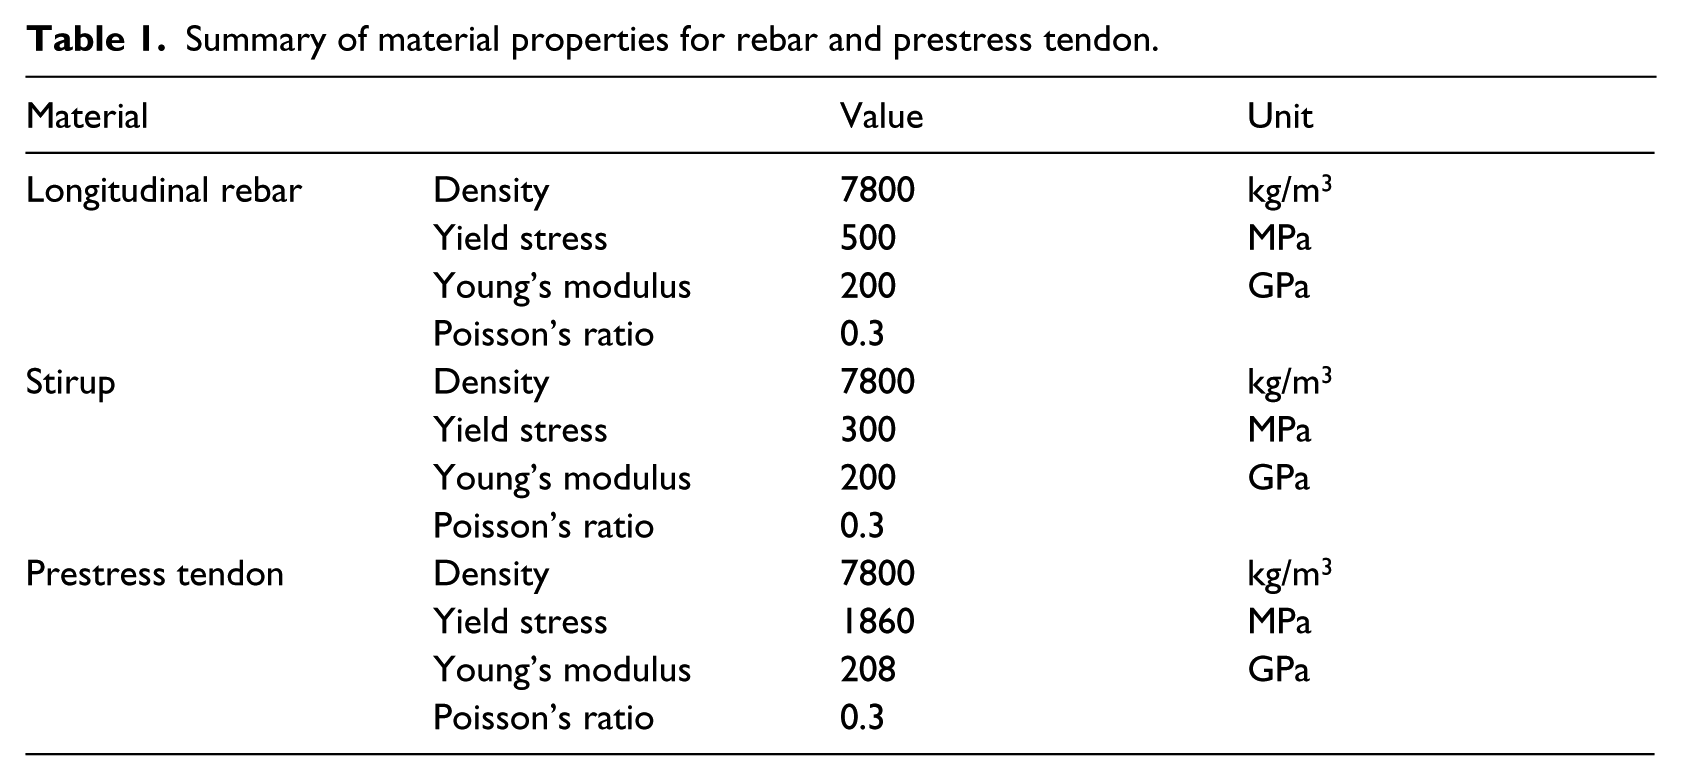
The prestress tendon and reinforcement including both the longitudinal rebar and tie are modelled with Piecewise_Linear_Plasticity model (MAT_24) with a bi-linear relationship. The yield strength, ultimate strength, Young’s modulus and tangential modulus follow the material properties of those used in the experiment. Table 1 summarizes the parameters of material models in the current study. The DIF equation for reinforcement used in the study is defined as (Malvar and Crawford, 1998)
Summary of material properties for rebar and prestress tendon.
where for the yield stress α= αfy = 0.074 – 0.04fy/414; and for the ultimate stress, α = αfu = 0.019 – 0.009fy/414, in which fy is the yield strength of the reinforcement.
For the steel impactor, a linear elastic material model (MAT_001) is used with density of 7800 kg/m3 and Young’s modulus of 200 GPa.
Model validation
Validation of the numerical model is made by comparing the numerical predictions with the laboratory tests. The column subjected to segmental joint impact is chosen to be compared. Since the impact velocity in Impact 01 was small (0.32 m/s) which caused only the elastic response of the segmental column, it is therefore not modelled and compared herein. The following impacts with impactor velocity of 0.64, 1.37 and 2.61 m/s which resulted in column minor damage, medium damage and major damage are modelled. The accumulated damage in the column due to repeated impacts is accounted by re-starting the numerical simulation after the column vibration in the previous impact stops. The column deflection of the bottom (first) segment and the impact load onto the column are used for comparison to quantitatively demonstrate the accuracy of the numerical model.
Figure 7 compares the damages of the columns from the numerical simulation and the laboratory tests. As shown in Figure 7(a), the numerical model captures minor concrete damage in the second concrete segment near the impacted location when the impact velocity is low. Similar concrete damages are found from the numerical model and the lab-tested column, where concrete crash failure is formed around the bottom segmental joint due to the impact loading (Figure 7(b)). Under the substantial impact loading, damage around the segmental joint extends and diagonal crack in the bottom segment is also captured by the numerical model. It can be concluded that the numerical model could reasonably predict the damage of the segmental column.
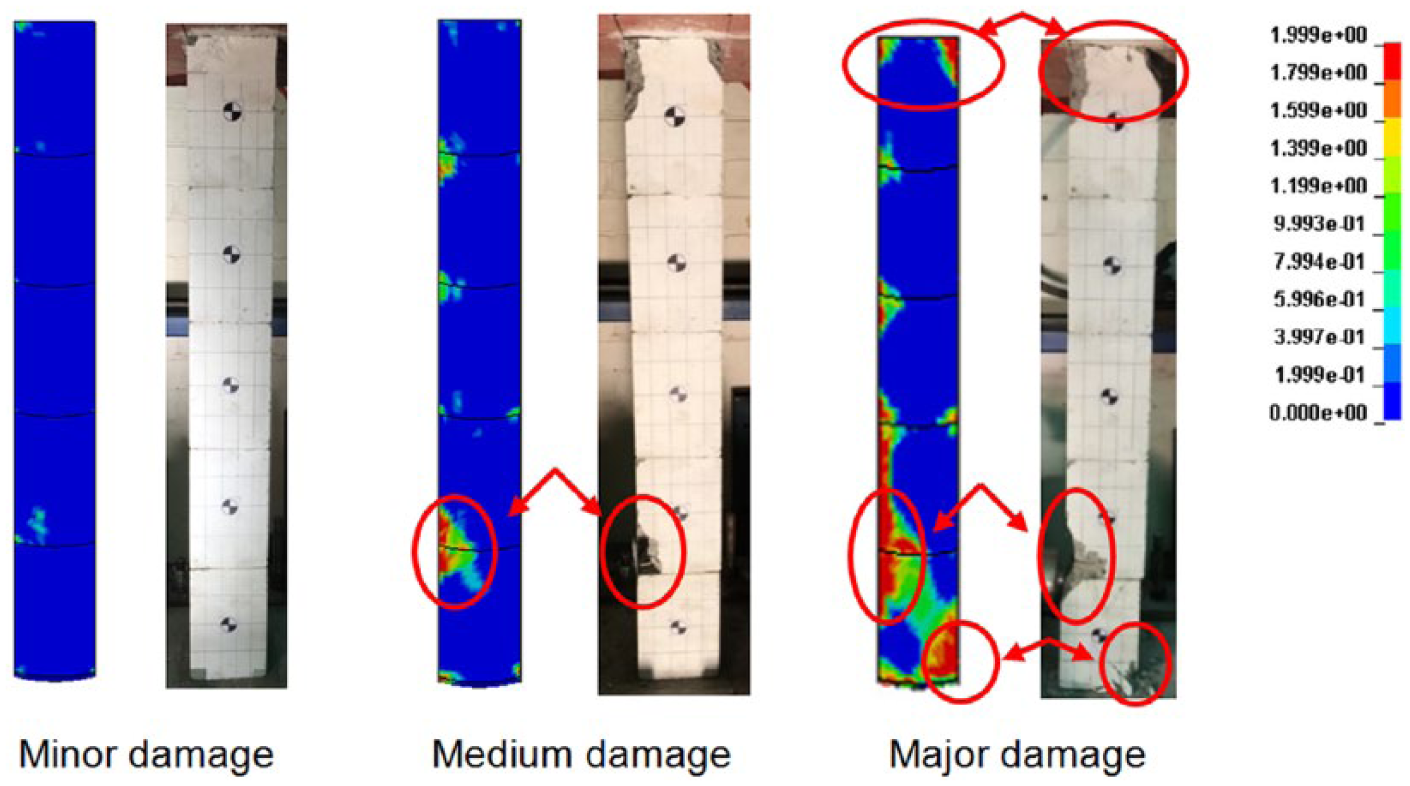
Comparisons of column damage from numerical model and laboratory test.
Figure 8(a)–(c) shows the deflection time histories from the numerical simulations and those recorded in the laboratory tests. As can be observed, when the column is subjected to low-level impact, the numerically predicted deflection time history of the bottom segment closely matches that recorded in the laboratory test. When medium-level damage is resulted to the column, the peak deflections from the numerical model and the laboratory test are very close. The magnitude of deflection during free vibration in the numerical model is slightly smaller than that in the test, which is probably because the response of the concrete footing (pinned to solid ground in the lab test) is idealized to be perfectly fixed in the numerical simulation, while in test some deformation and damage of footing were observed. When major damage to the column occurs, the predicted peak deflection is also close to that recorded in the test. However, the numerical simulation predicts a smaller residual displacement as compared to that recorded in the test. This is again because of the damage of footing, which is observed in the test but not modelled in numerical simulation. Figure 8(d) compares the impact load time histories for 2.61 m/s impact velocity. Slightly higher peak impact load (59.2 kN) is predicted by the numerical model than that in the lab test (54.4 kN). The difference of impulse between the numerical model and the lab test is also small (928 kN ms vs 940 kN ms). Through the above comparisons, it can be concluded that the numerical model can reasonably predict the behaviour of the segmental column under lateral impact at the bottom segmental joint.
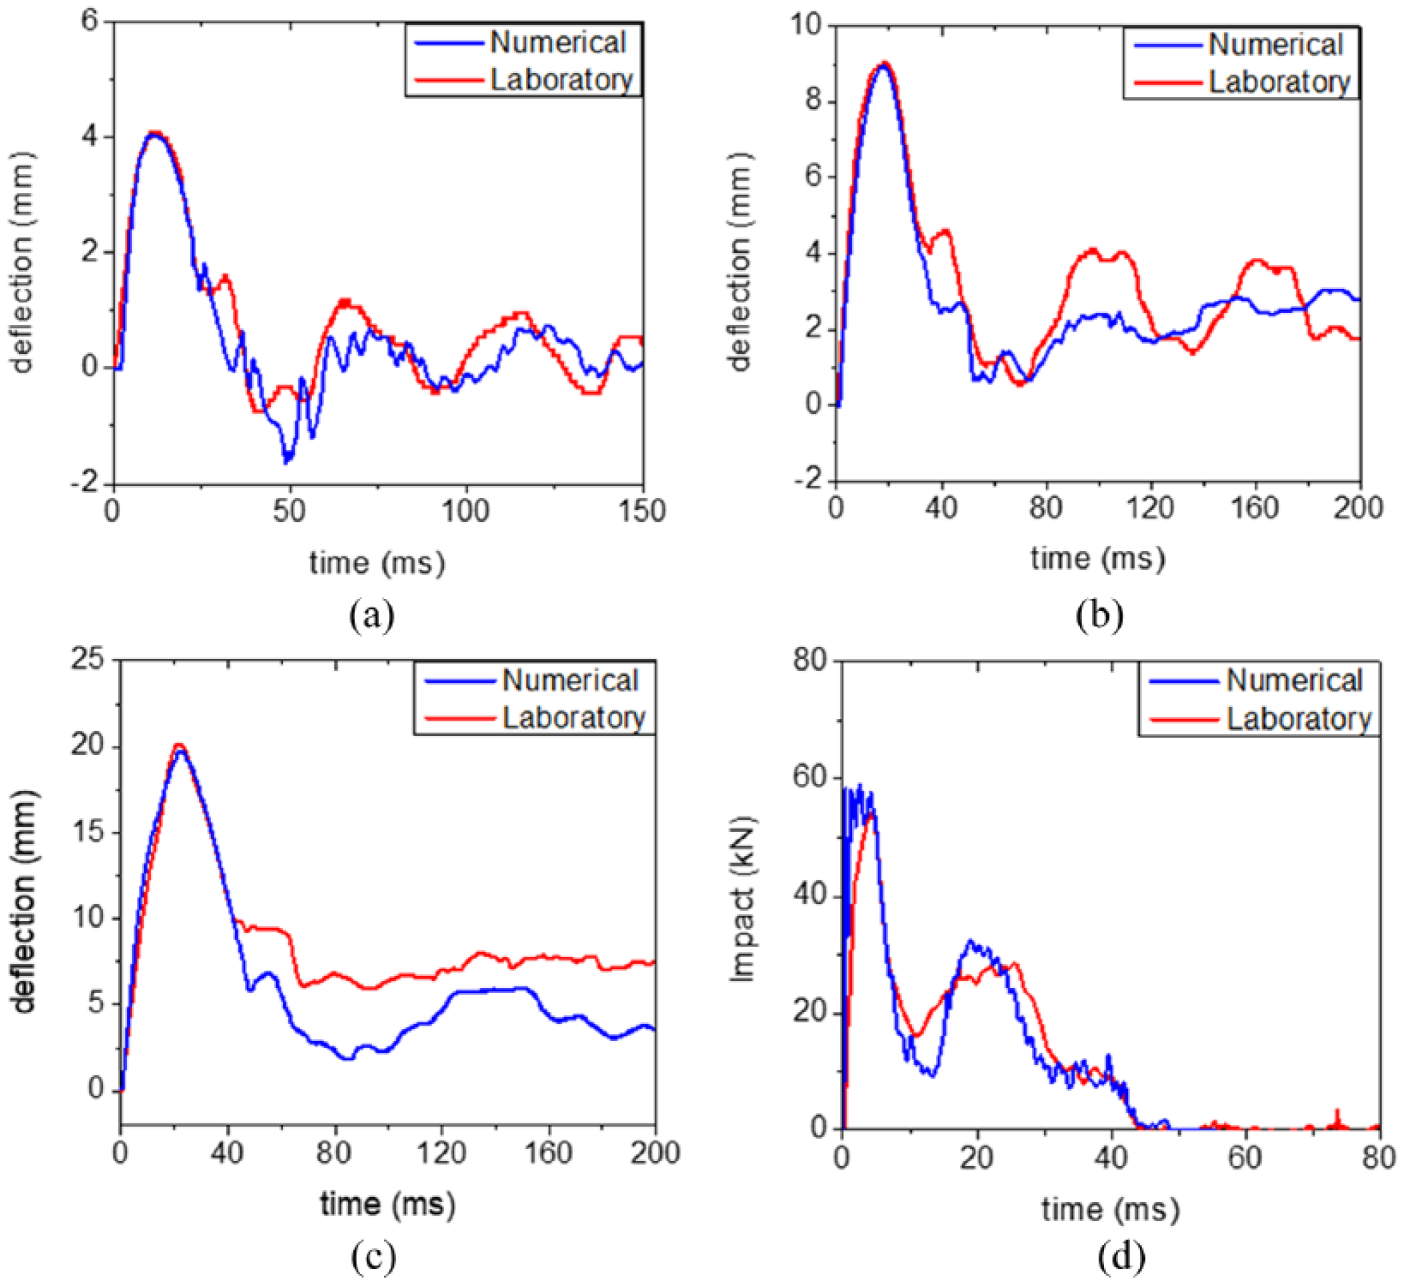
Comparison of deflection time histories at centre of bottom segment and impact load time histories: (a) minor damage (v = 0.64 m/s), (b) medium damage (v = 1.37 m/s), (c) major damage (v = 2.61 m/s) and (d) load time history (v = 2.61 m/s).
Parametric study
To fully understand the behaviour of a segmental column under near base impact, and to study the influences of different design factors to the impact performance of the segmental column, parametric study is performed. The above laboratory tests and numerical simulations presented in sections ‘Previous laboratory tests’ and ‘Numerical modelling and validation’ are performed on quarter-scale columns. In the parametric study, a full-scale 3-m tall column with 300 mm by 300 mm cross-section column is generated with the above verified modelling method.
As illustrated in Figure 9, each segmental column comprises five segments (600 mm tall each) and with dome-shape shear key (500 mm radius). Four 24 mm diameter longitudinal reinforcements and five pieces of 12 mm diameter stirrups are cast in each segment as reinforcement cage. Concrete footings are introduced at the bottom of the column to fully fix its movement as well as the top of the column to model the restraint from the beam and slab. 50 mm diameter prestress tendon is post-tensioned through the 60 mm diameter duct in the centre of the segmental column. The model represents columns commonly used in residential and commercial buildings in lieu of bridge piers. A preload equivalent to 10% of the design axial compressive capacity of the column (0.1fc′Ag) is applied to the top of the column to model the dead weight, where fc′ is the concrete compressive strength and Ag is the net cross-sectional area. A 11.2t steel impactor with 300 mm diameter probe is used to generate the impact load. The impactor weight is selected to replicate the weight of small pickup vehicles. The impact velocity is varied as 1, 4 and 8 m/s which are designed to result in minor damage, medium damage and severe damage of the column. To concentrate on investigating the behaviour of segmental column, the steel impactor is made of solid steel which would lead to hard impact against the column instead of resulting in substantial deformation in the impactor. Therefore, the interaction between impactor and column does not represent a realistic vehicle impact case, where significant deformation of vehicle model is expected to occur, which absorbs significant amount of impact energy. Similar to the laboratory test, the columns are impacted at the segmental joint between the two bottom segments, and at the centre of the bottom segment. The response and failure modes of the full-scale column at different impact velocities are studied. The influence of two important design parameters, that is, prestress level and concrete strength, is evaluated.
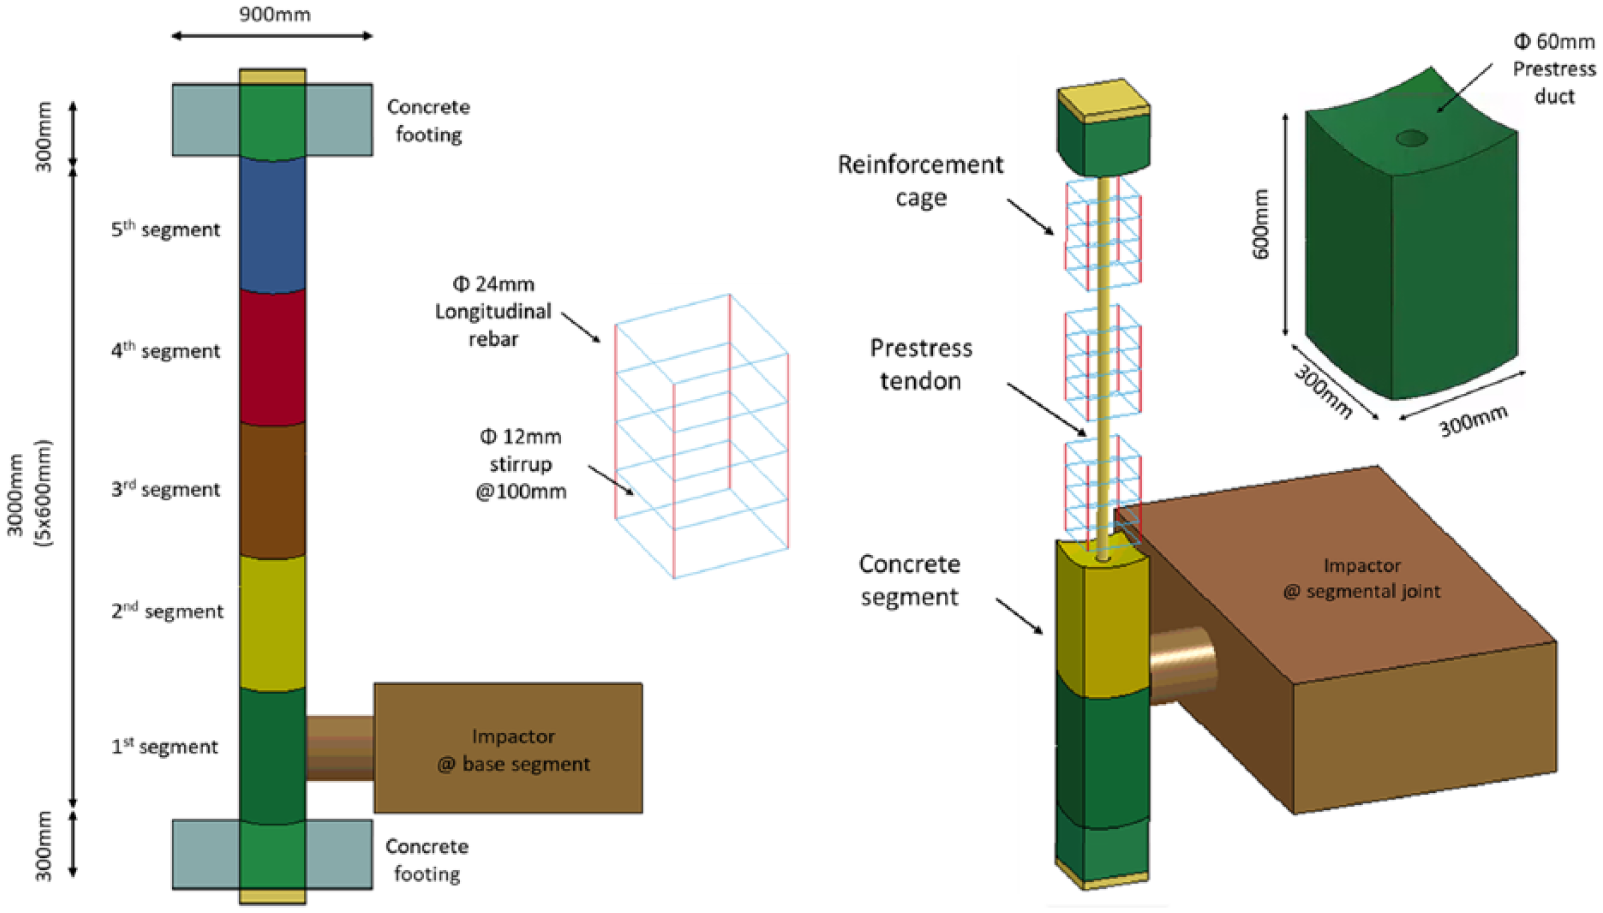
Configuration of the full-scale segmental column.
Failure mode
Figure 10 depicts the deformation-to-failure modes of the full-scale segmental column under near base impacts. The column is made of fc′= 50 MPa concrete and has a post-tension force equivalent to 10% of the column compressive capacity applied to the prestress tendon. The 11.2t weight impactor is launched at 4 m/s. As shown, when the column is subjected to impact at segmental joint between the two bottom segments, the impactor forces the column to deform sideways. Concrete damage initiates at the segmental joints between the first segment and the concrete footing, the first and second segments, and also between the second and third segments (t = 5 ms). Joint opening is observed between the two bottom segments as the impactor continues to force the column to deform, which results in more severe concrete damage at the segmental joint between the first and second segments (t = 30 ms). As the bottom segment rotates against the footing, corner crushing is also developed (t = 50 ms).
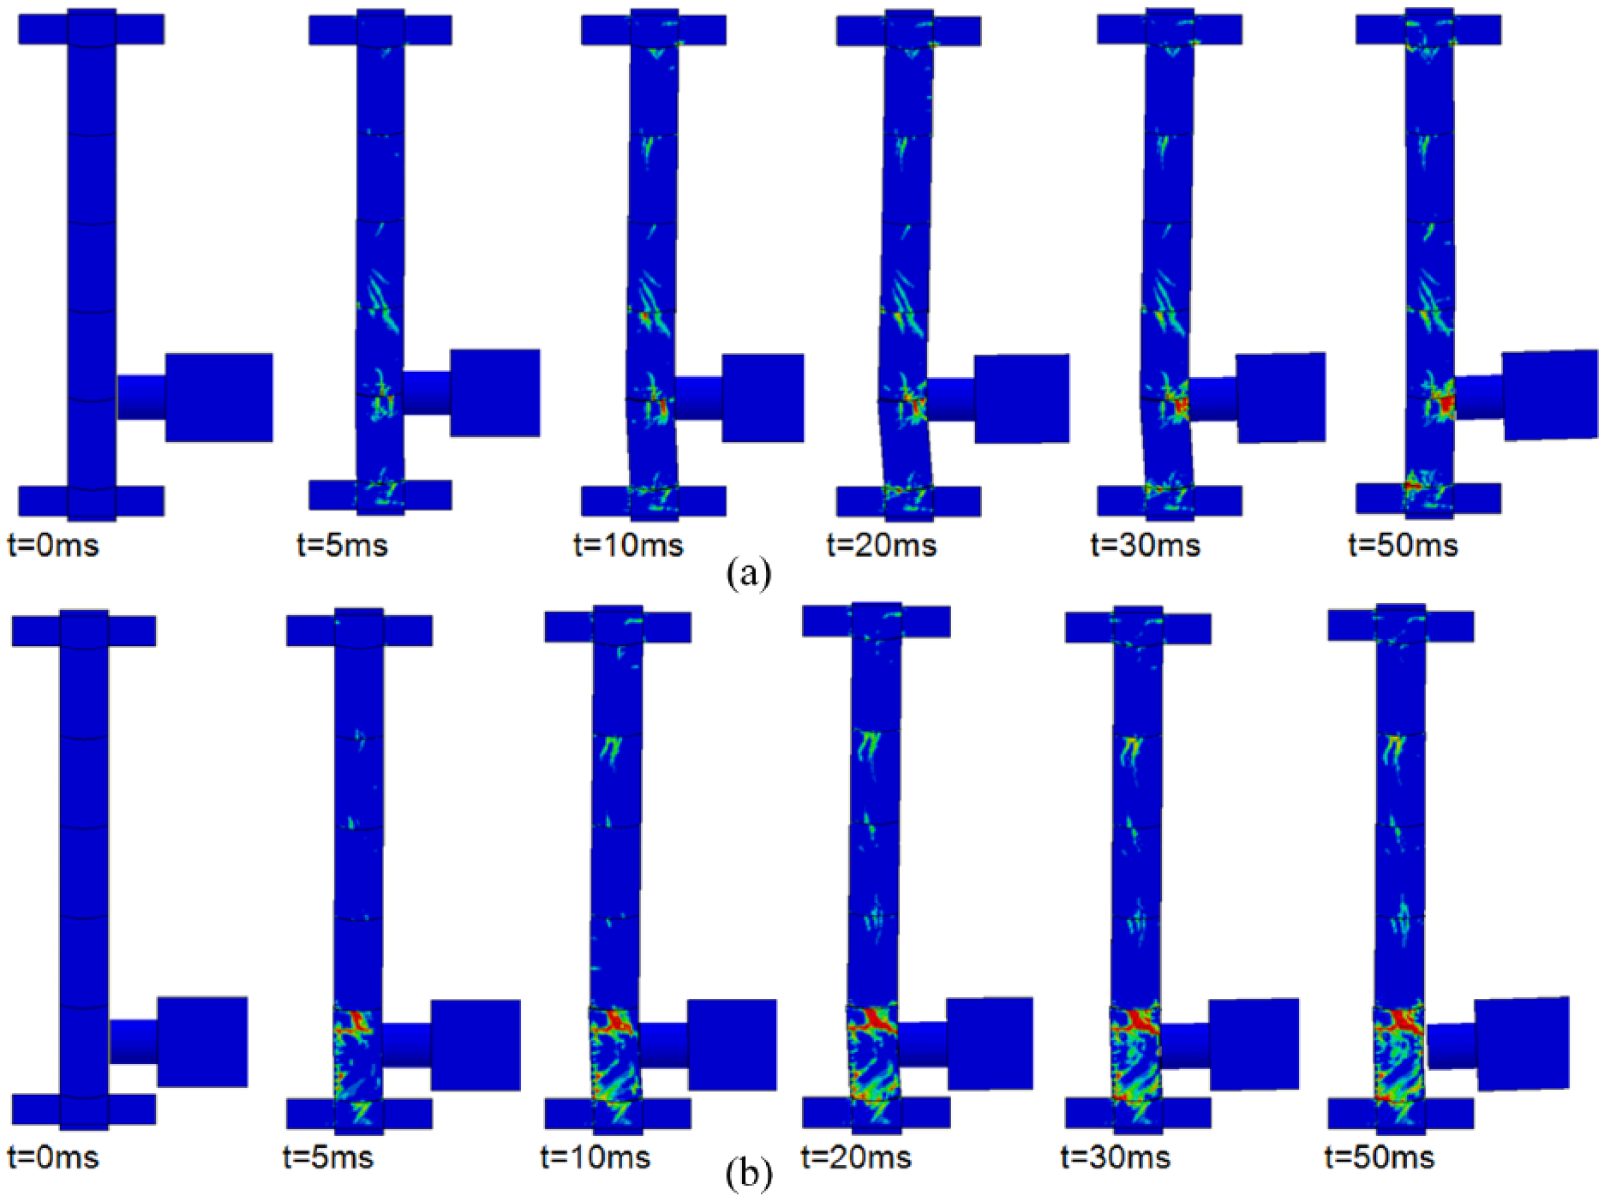
Column damage development contours: (a) segmental joint and (b) bottom segment.
In comparison, when the column is subjected to impact directly onto the bottom segment, the impact-induced stress wave quickly propagates to the back side of the bottom concrete segment (t = 5 ms), which leads to the damage of concrete in the rear side (as shown in Figure 10(b)). Because of the large lateral force, shear damages are also developed at the segmental joints of the bottom segment especially that in contact with the second segment. The shear damage grows quickly and extends cross the entire segment (t = 20 ms). There is no significant flexural bending response that can be observed in this segmental column as compared to the one under impact at segmental joint.
Figure 11 compares the lateral displacement contours of the two columns. Each dot in the curve denotes the centre movement of each segment. From Figure 11(a), a clear kink can be observed forming between the first and second segments indicating the joint opening occurs. In comparison, when the column is subject to direct impact on the bottom concrete segment, the segment is forced to deform laterally while the other segments deform only as a result of the shear force transferred through the segmental joint and the tendon. There is no apparent segmental joint opening or kink can be found on the lateral displacement contour. The comparison also indicates the different response and failure modes of the segmental column when the impact locations differ.
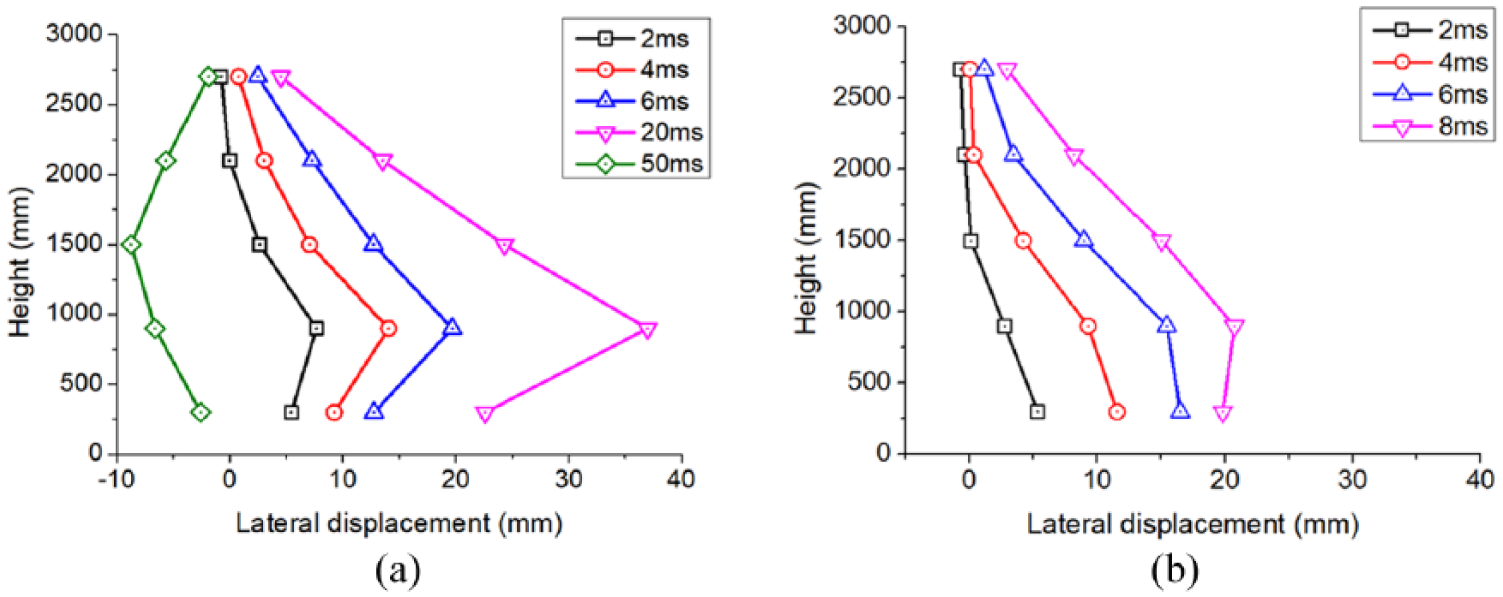
Lateral displacement contours of segmental columns under (a) base joint impact and (b) centre of bottom segment impact.
Figure 12 presents the impact load time histories measured when the columns are subjected to impact at segmental joint and directly on the concrete segment. A peak impact load of 3435 kN is resulted when impacted at segmental joint, while slightly higher peak load (3506 kN) is found when impacted directly on the base segment. This is expected because when impact at segmental joint, the resistance stiffness of the column is relatively smaller because of the joint opening. From the load time histories, it can also be observed that the loading time for the column under segmental joint impact is much longer (about 45 ms) than that under direct concrete segment impact (about 30 ms). Again, this is mainly because the column is more flexible when impacted at the segmental joint. As a result of longer loading time, 18% higher impulse is measured when subjected to segmental joint impact (about 17,150 kN ms) than direct segment impact (13,920 kN ms) despite the impactor is of the same weight and the same velocity.
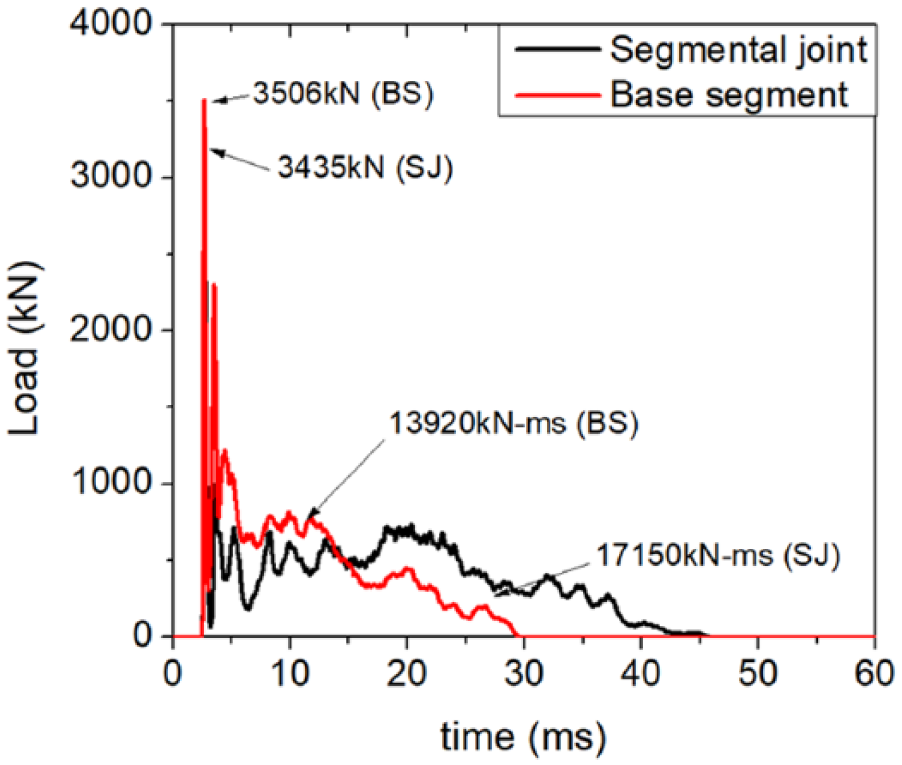
Comparison of impact load time histories of columns impacted at different locations.
Influence of impactor velocity
To evaluate the different damage modes and levels of the columns under impact loading with different velocities, the 11.2t impactor is released at 1, 4 and 8 m/s, which correspond to 11,200, 44,800 and 89,600 kN ms impulses. Figure 13(a) shows the deflection time histories of the second segment when the column is subjected to impact at the bottom segmental joint. As can be found, larger impact results in higher peak deflections in the second segment. After the impact, the column rebounds as the prestress tendon pulls the deformed column back and closes the segmental joint. When the column is subjected to low velocity impact, a peak deflection of 6.7 mm is resulted. The column vibrates and almost recovers its original position. When the column is under medium-level impact, a peak deflection is 36.8 mm on the column with negligible residual deflection. However, it is noticed that the free vibration period of the column is longer. When the column is subjected to 8 m/s impact, the peak deflection is nearly 120 mm on the second segment, and about 40 mm residual deflection is found on the impacted segment. Figure 13(b) presents the deflection time histories of the first segment when the column is under direct impact onto the centre of this segment. Similarly, the peak deflection also increases as the impactor velocity increases. A peak deflection of about 3 mm is measured on the bottom segment when impacted with 11,200 kN ms impulse, which increases to about 24 mm when subjected to 44,800 kN ms impulse. Under the ultimate impact of 89,600 kN ms impulse, a peak deflection of 90 mm is observed on the bottom segment.
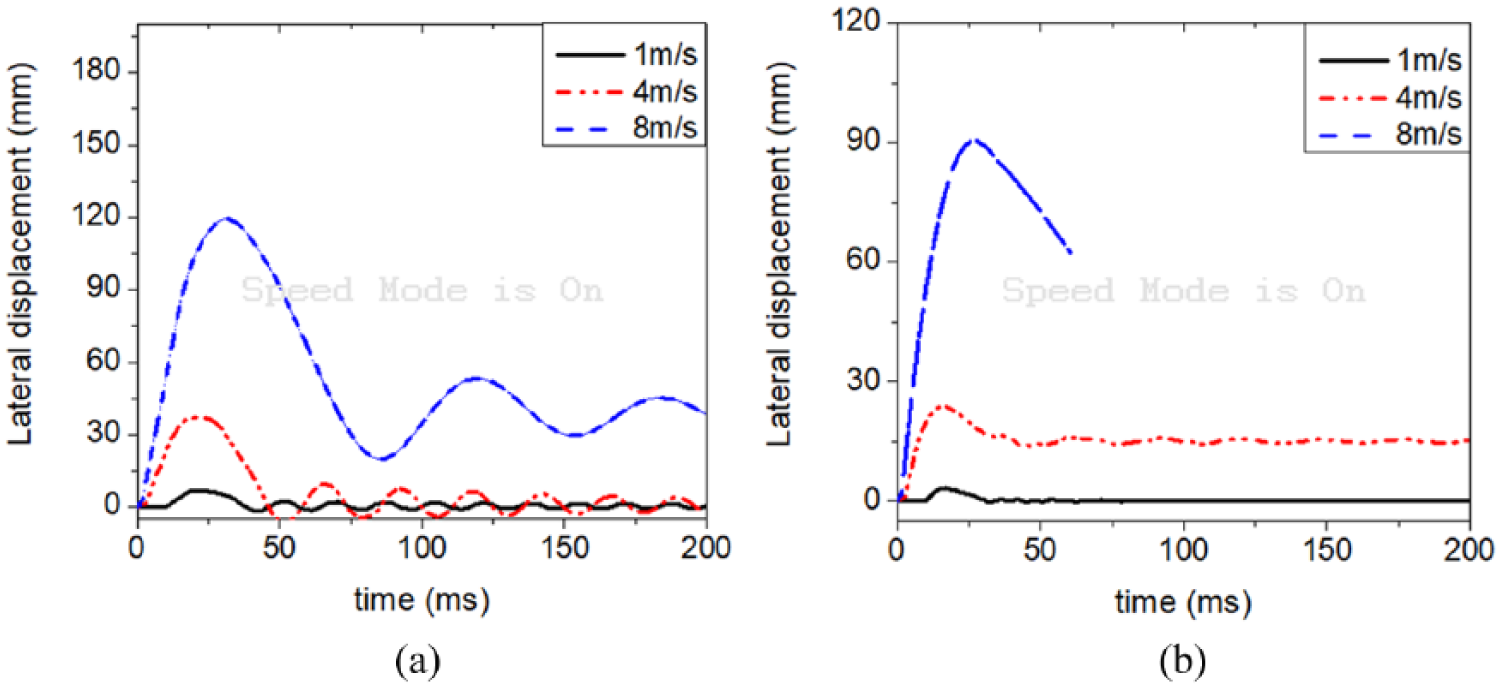
Deflection time histories of (a) second segment under segmental joint impact and (b) first segment under centre of bottom segment impact.
Figure 14 illustrates the comparison of column damages under different impulses. When subjected to segmental joint impact, very minor damage is induced in the column when subjected to 11,200 kN ms impulse, while under 44,800 kN ms impulse concrete compressive damage occurs at the segmental joint under impact due to flexural compression and also the left corner of the first segment due to segment rotation. When the column experiences 89,600 kN ms impulse, the concrete around the segmental joint is mostly crushed; and more severe compressive damage occurs in the corner of the bottom segment. When subjected to direct impact on concrete segment, minor concrete damage is induced when the column is subjected to 11,200 kN ms. Diagonal shear damage can be found on the bottom segment when subjected to 44,800 kN ms direct impact on the bottom segment. Under the ultimate 89,600 kN ms impulse, the bottom segment is totally crushed.
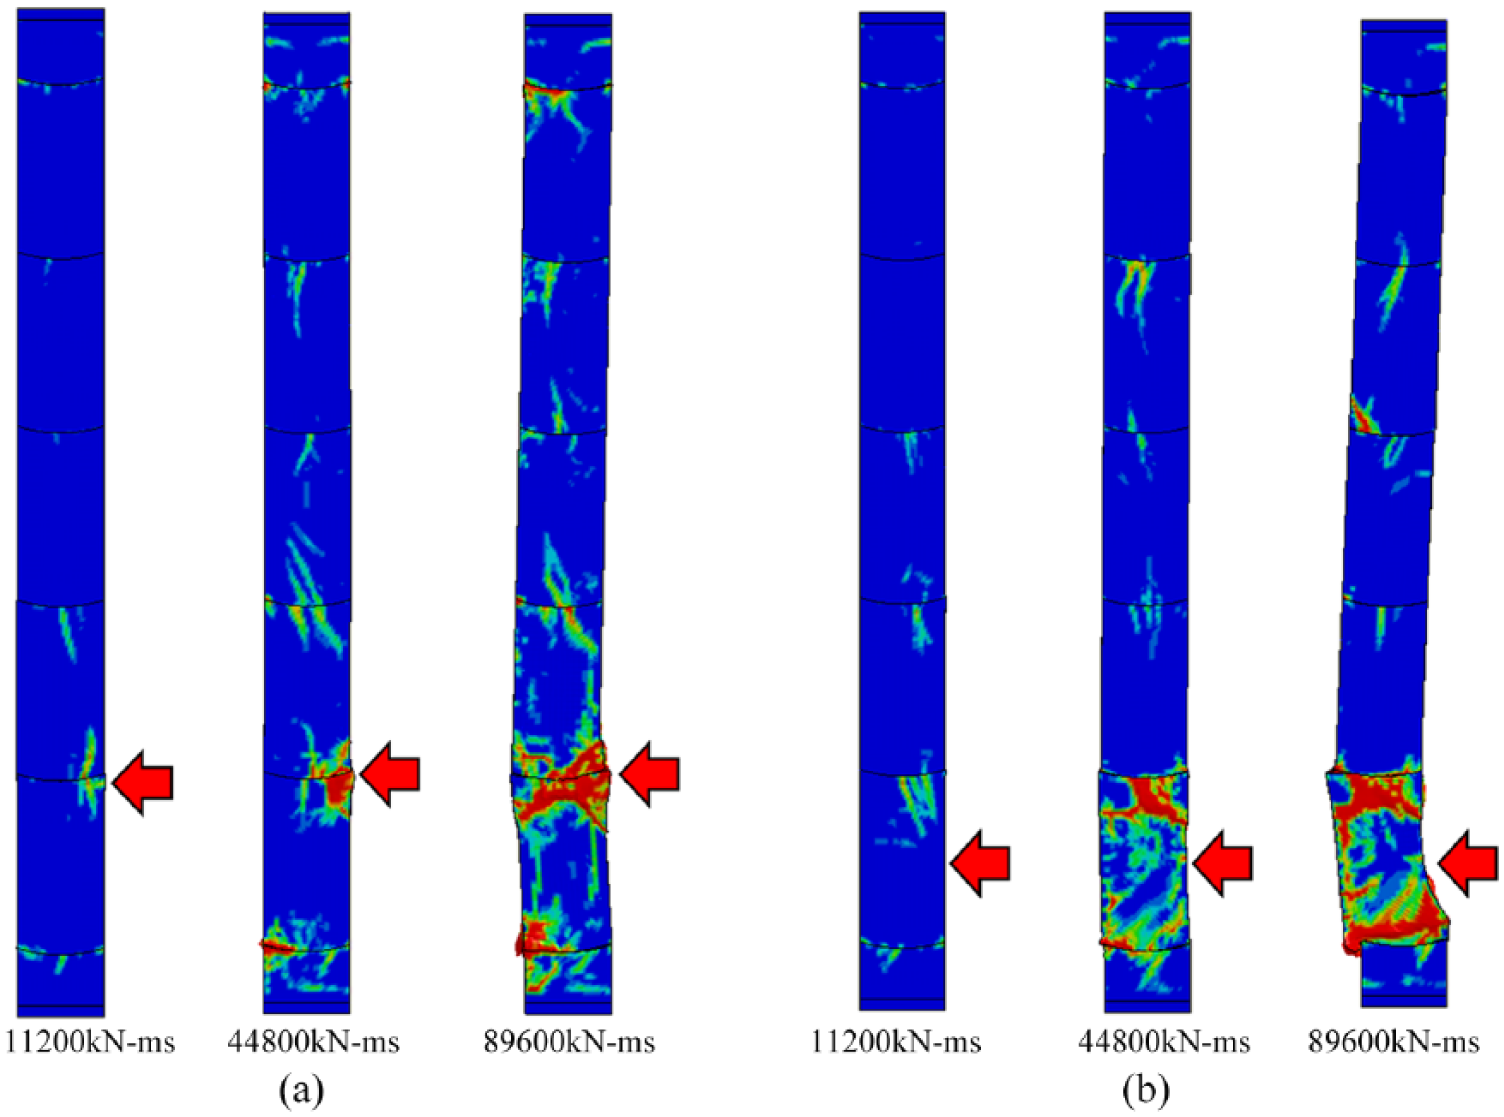
Damage of columns under (a) impact at the bottom joint and (b) impact at the centre of bottom segment with different impulses.
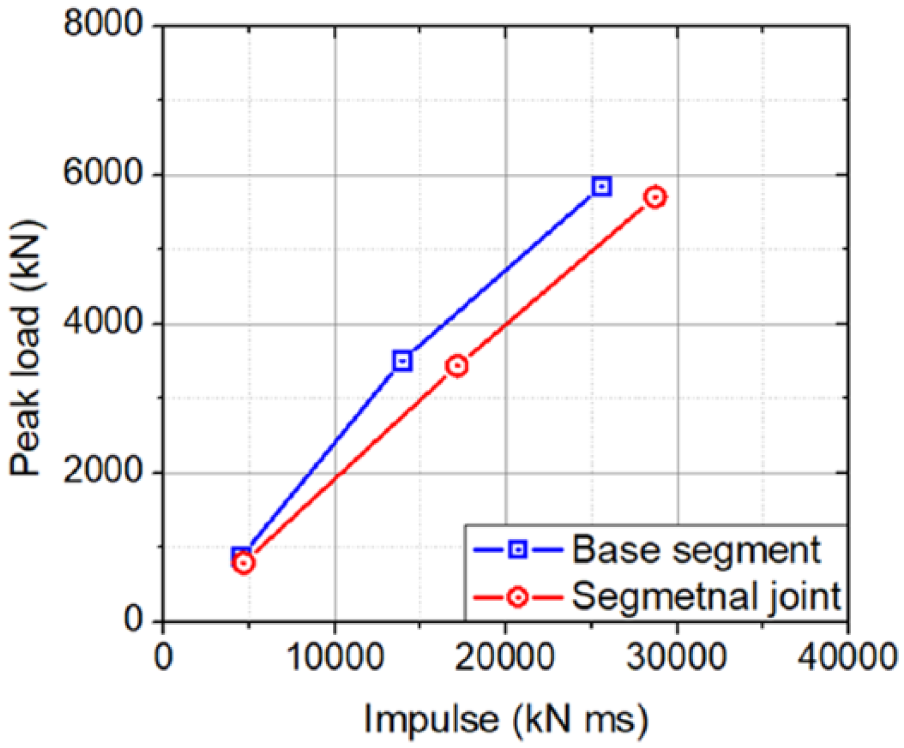
Figure 15 compares the peak impact loads and the impulses generated by impacts at two different locations. As shown, similar peak loads and impulses can be found when the columns are under low velocity impacts at different locations which result in minor damages in the columns. As impact velocity increases, marginally larger peak loads are resulted when impacted onto concrete segment directly because the column experiences less deformation as compared to that when impacted at the joint. However, because of longer loading duration, larger impulses are always measured on the columns impacted at segmental joint. For instance, under 11.2t impactor strike at 4 m/s about 19% higher impulse is experienced by the column under segmental joint impact, and when the impact velocity increases to 8 m/s, about 11% higher impulse is found.
Comparison of peak impact loads and impulses.
Influence of prestress level
As demonstrated above in the experiment and numerical simulation, prestress tendon could benefit the performance of segmental column which pulls the deformed column back to its original location. However, there is no design standard or recommended practice on the level of prestress in the tendon for segmental column. The influence of prestress level is therefore investigated herein by increasing the prestress level in the tendon from 10% to 15% and then 20% of equivalent column compressive capacity. The impact velocity is 4 m/s, and concrete strength is 50 MPa. The segmental column is impacted at segmental joint and centre of bottom segment.
When the segmental columns are subjected to lateral impact at segmental joint, increase prestress ratio in the tendon could lead to higher moment resistant capacity at segmental joint. As shown in Figure 16(a), when increasing prestress level from 10% to 15%, the peak moment at the segmental joint between the first and second segments increases from 113 to 121 kN m by 7%. Further increasing the ratio to 20% leads to the peak moment at the segmental joint to 129 kN m (about 14% higher compared to 10% prestress ratio). The responses of the columns with different prestress levels also differ. For instance, a peak lateral displacement of about 36 mm is found on the column with 10% equivalent prestress ratio, which reduces to about 34 mm when the tendon prestress increases to 15%, and to about 32 mm when prestress level increases to 20%. Despite the reduction effect to column peak deflection is not significant, the effect to column post-impact behaviour is apparent. With higher prestress level, the column shows higher free vibration frequency and slightly lower residual displacement.
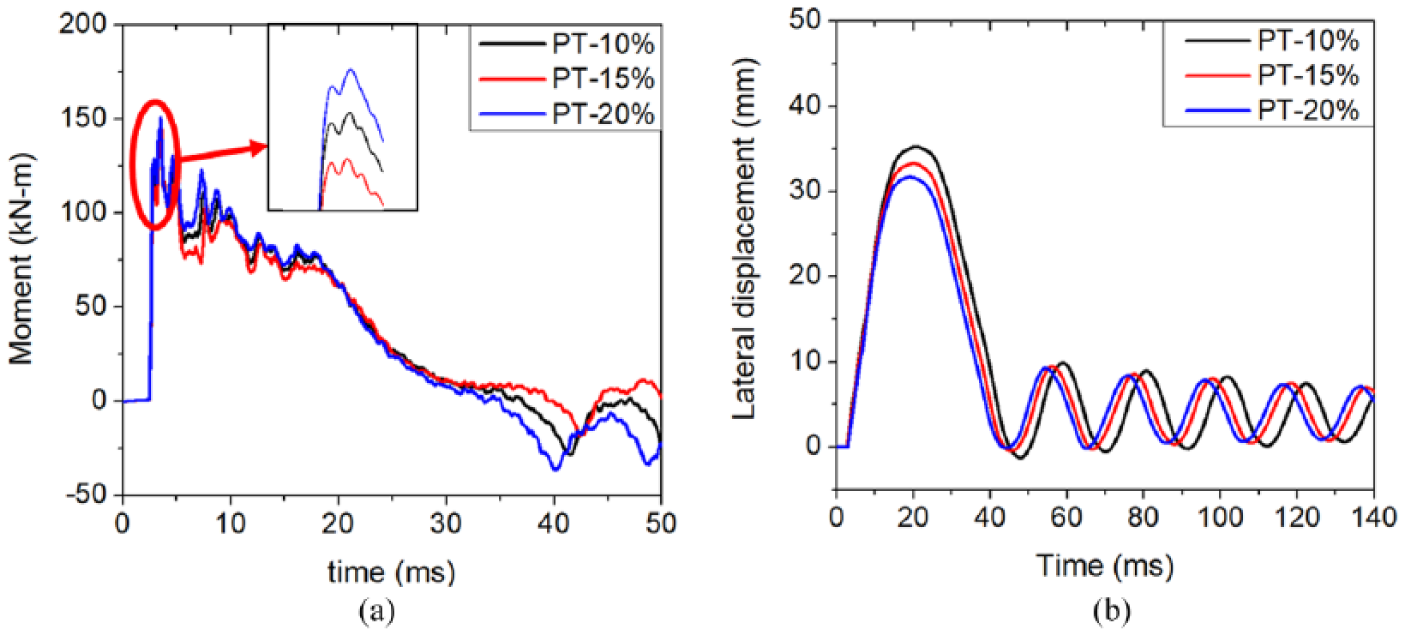
(a) Moment time histories between the first and second segments and (b) lateral displacement time histories of the second segment when subjected to segmental joint impact.
Similar observations are found on segmental columns when impacted at the centre of bottom segment. As shown in Figure 17(b), increasing prestress level from 10% to 15% and 20% leads to the peak deflection of the first segment dropped from 21.5 mm to about 20.6 mm (−4.2%) and 19.8 mm (−7.9%). A small difference in residual displacement can also be found that about 12.1 mm residual displacement is measured for column with 10% prestress, which reduces to about 11.1 mm (−8.2%) and about 10.7 mm (−11.6%) with 15% and 20% prestress. The improvement to the performance of segmental column is mainly because by increasing the prestress level, axial stress in the column is effectively increased, which leads to higher shear resistance at segmental joint. As evidenced in Figure 17(a), the lateral restraining forces measured between the footing and the concrete segments are higher when higher prestress is applied. Nevertheless, because the concrete shear keys adjacent to the impacted bottom segment suffer severe damage under the impact (Figure 14(b)), limited improvement is therefore observed on the column. Figure 17(c) compares the damage contours of the columns, it can be found that with increased prestress level, more severe damage is resulted on the column due to concrete shear damage.
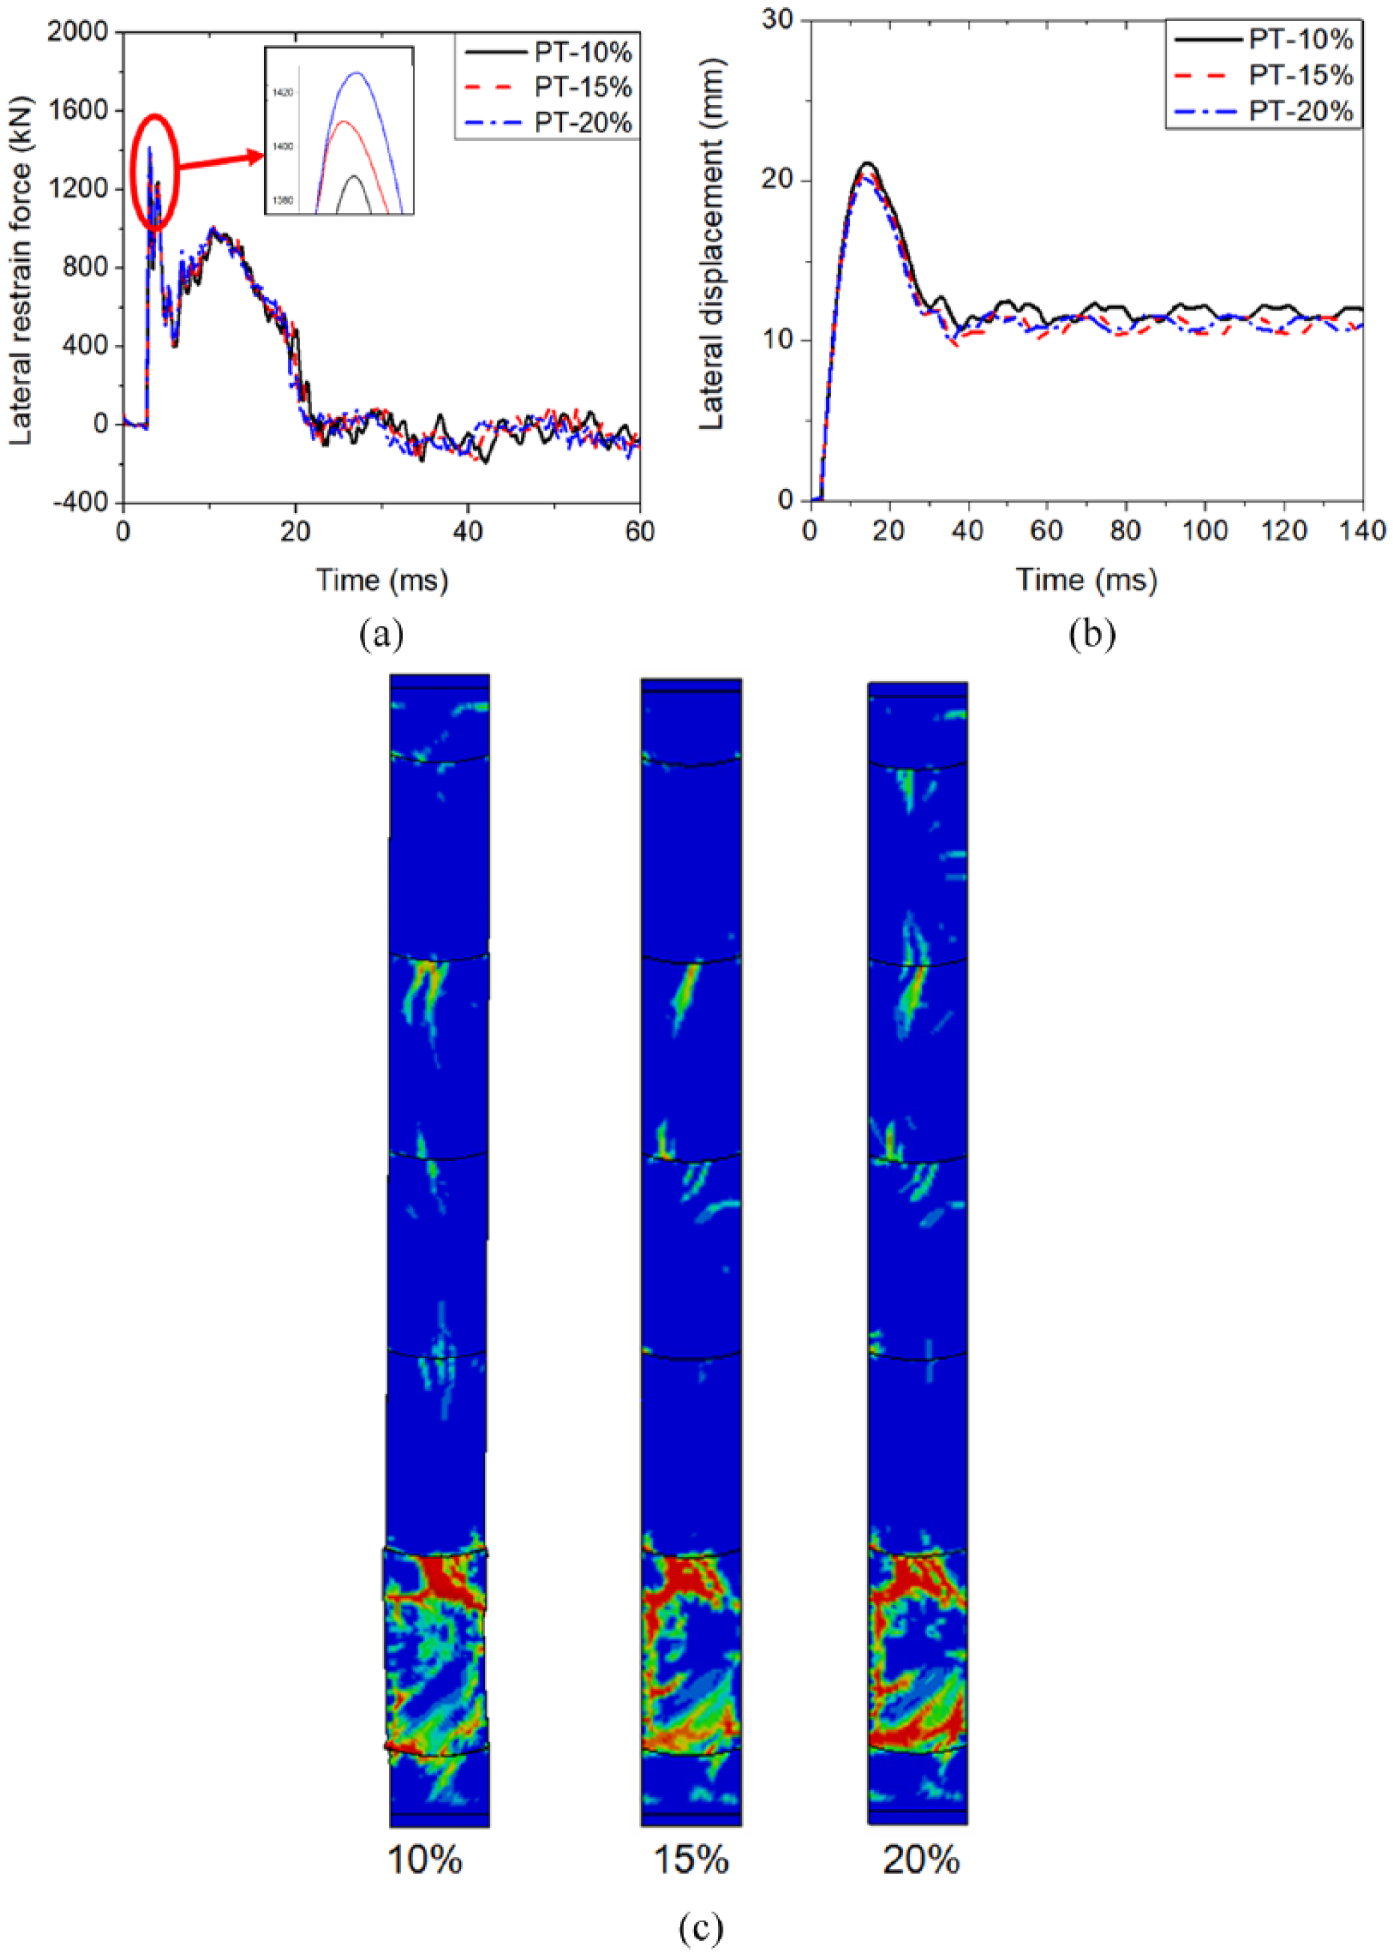
(a) Lateral restrain force time histories between footing and concrete segments, (b) lateral displacement time histories of the first segment when subjected to bottom segment impact and (c) damage contours of the columns.
Through the above comparison and analysis, it can be found that prestress level in the tendon could influence the response of segmental column when subjected to lateral impacts at bottom segmental joint. Smaller column lateral deflection can be resulted because higher prestress increases column stiffness. Higher prestress level also slightly reduces column lateral deflection when the column is subjected to impact directly onto bottom segment. This is because increased prestress level leads to higher shear resistance at segmental joint. Nevertheless, more serious damage is also resulted on the column due to shear damage.
Influence of concrete strength
Concrete strength is another important parameter to consider. As described above, the damage and failure of segmental column is mainly due to flexural compressive and shear failure of concrete when subjected to segmental joint impact and concrete crush and shear damage when subjected to direct concrete segment impact. Therefore, the responses of segmental columns made of 30, 40 and 50 MPa concrete are numerically modelled. The prestress level maintains at 10% of column vertical loading capacity (0.1fc′Ag) and the dead load is also 10% of column capacity. The impactor velocity varies between 1 and 8 m/s associated with 11,200, 44,800 and 89,600 kN ms imposed impulses.
Figure 18 compares the deflection time histories of the second segment when the column is subjected to segmental joint impact. As can be observed, when the column experiences minor damage under 1 m/s impact, the peak deflection reduces from 3.9 mm with 30 MPa concrete to about 3.7 mm with 40 MPa concrete and further to 3.6 mm with 50 MPa concrete. Marginal difference can be found on the columns with different strength concretes. When medium-level damage is resulted in the columns subjected to 4 m/s impact, it can be observed that noticeably less damage occurs on the column with higher strength concrete especially around the segmental joint. It is more apparent from the deflection time history that the peak deflection reduces from 26 mm for 30 MPa concrete to 24 mm for 40 MPa concrete and 22.8 mm for 50 MPa concrete. When subjected to 89,600 kN ms impulse, the effect of concrete strength to relief concrete damage becomes more apparent. Much less damage around segmental joint is found on column with 50 MPa concrete comparing to those with lower strength concrete. The peak deflection is also effectively reduced by 22% and 14% as compared to 30 and 40 MPa concrete.
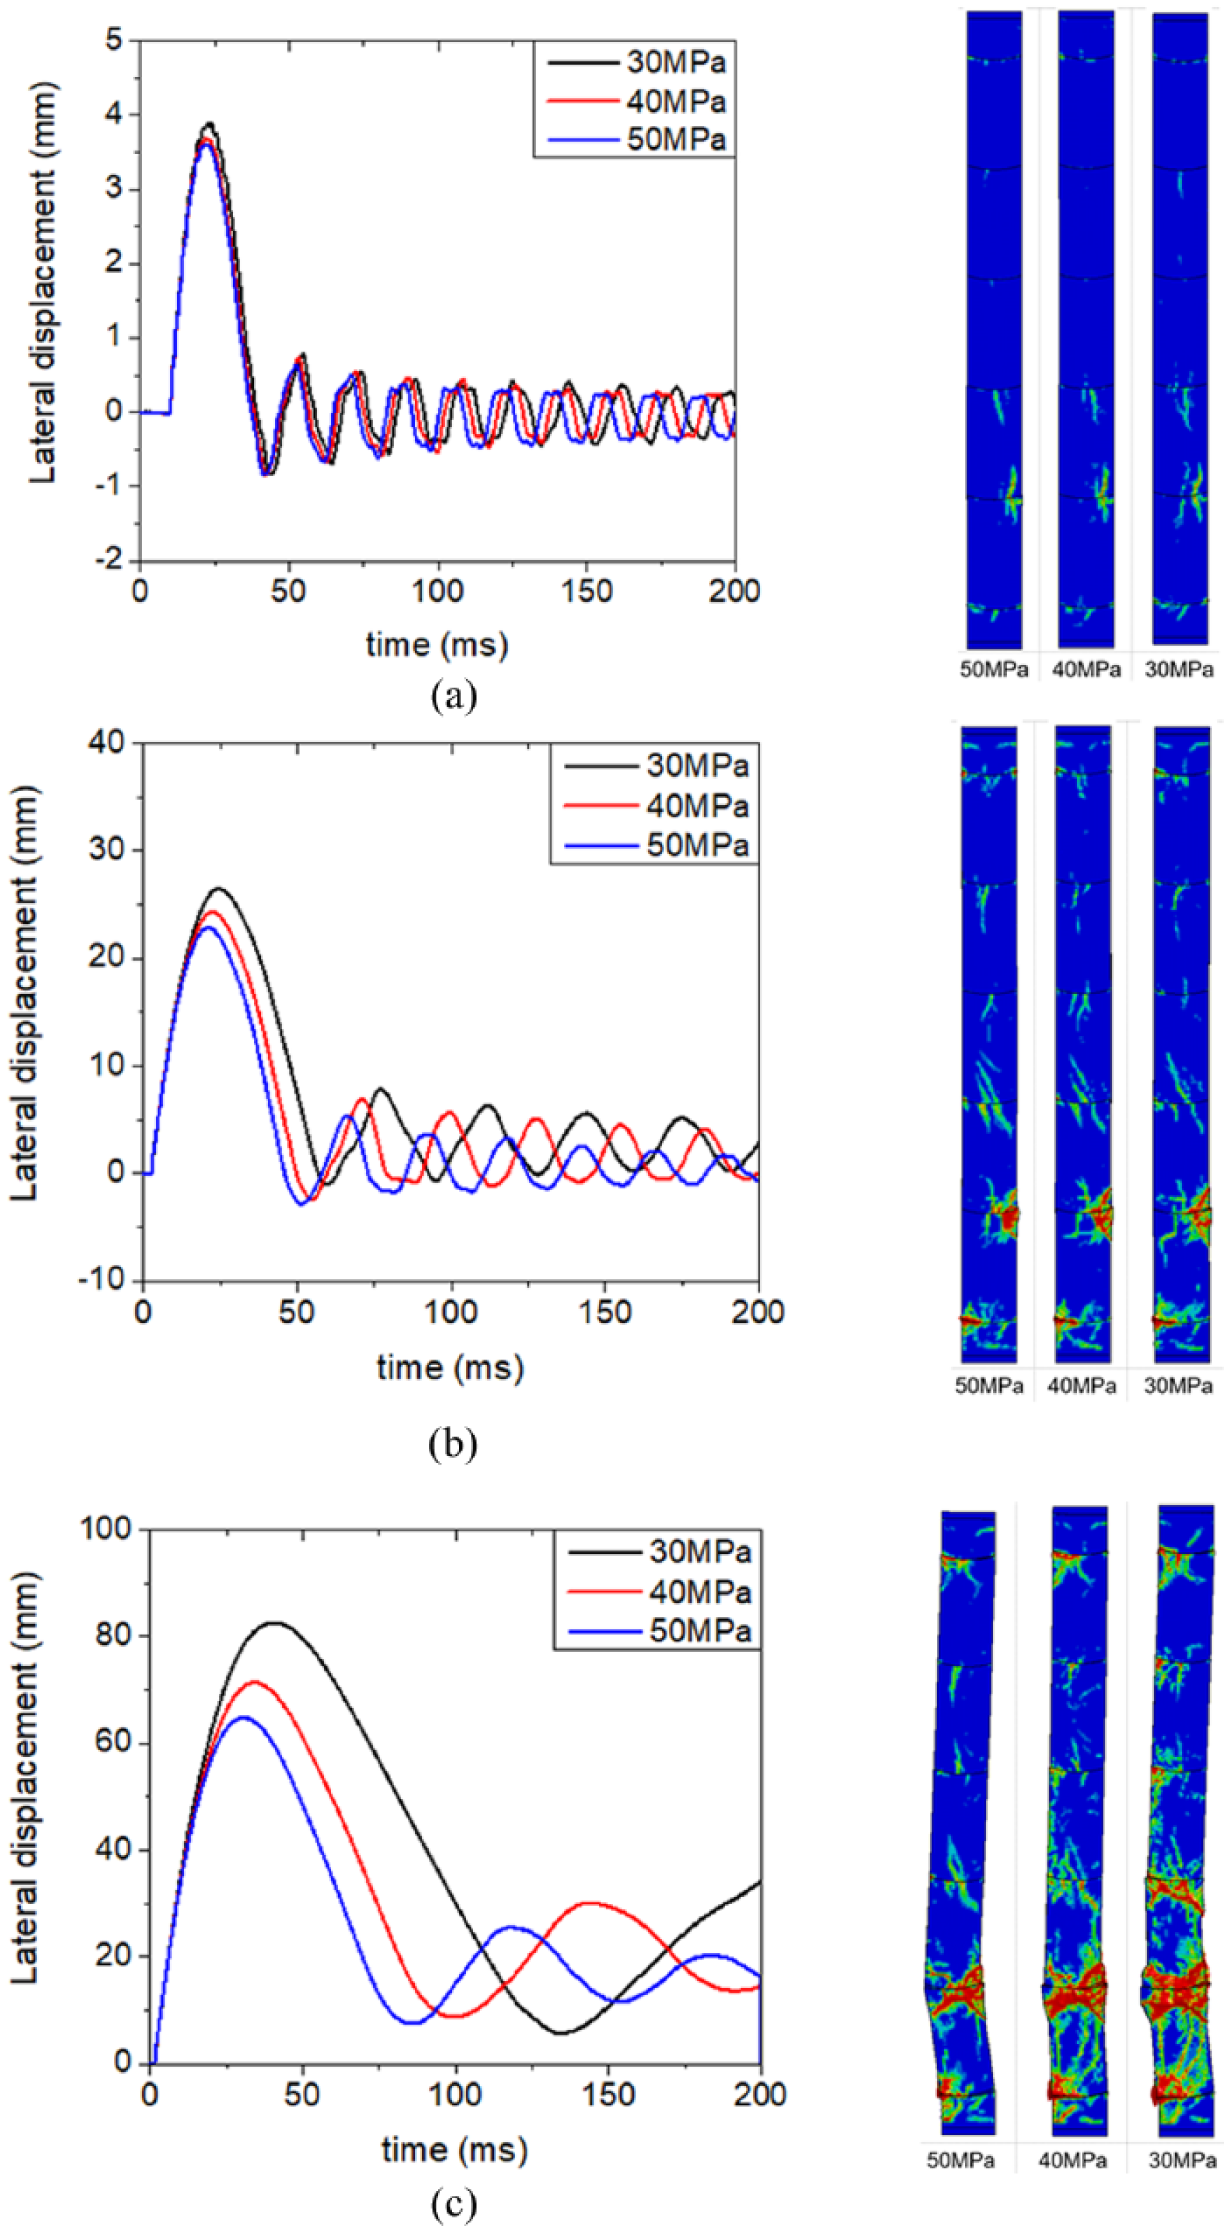
Comparison of second segment deflection time histories and damage contours for columns with different concrete strengths subjected to impact at the segmental joint: (a) minor damage (1 m/s, 11.2t impact)), (b) medium damage (4 m/s, 11.2t impact)) and (c) major damage (8 m/s, 11.2t impact).
Similarly, when the segmental column is subjected to direct impact on the bottom segment, higher concrete strength also contributes to improve column performance especially when concrete damage level is significant. For instance, when subjected to 1 m/s impact leading to minor concrete damage, almost the same deflections can be found on the columns with different concrete strengths, as shown in Figure 19(a). When column experienced medium speed impact, noticeably less damage can be found on the column with higher concrete strength. The peak and residual deflections measured on the first segment also reduce substantially. With 30 MPa concrete, 31 mm peak and 18 mm residual deflections are measured, while with 40 MPa concrete, only 24 mm peak (−23%) and 15 mm (−17%) residual deflections are resulted (as shown in Figure 19(b)). These results indicate if only minor damage is induced on the concrete segment, the responses of columns made of concrete with different strengths are similar because the variation on column stiffness is insignificant. However, when impact force is sufficient large and causes moderate to severe damage to concrete segment, prominent differences in column responses are observed because concrete damage reduces the stiffness of the column and column made of low strength concrete material suffers more severe damage than that made of high strength concrete under the same impact loads.
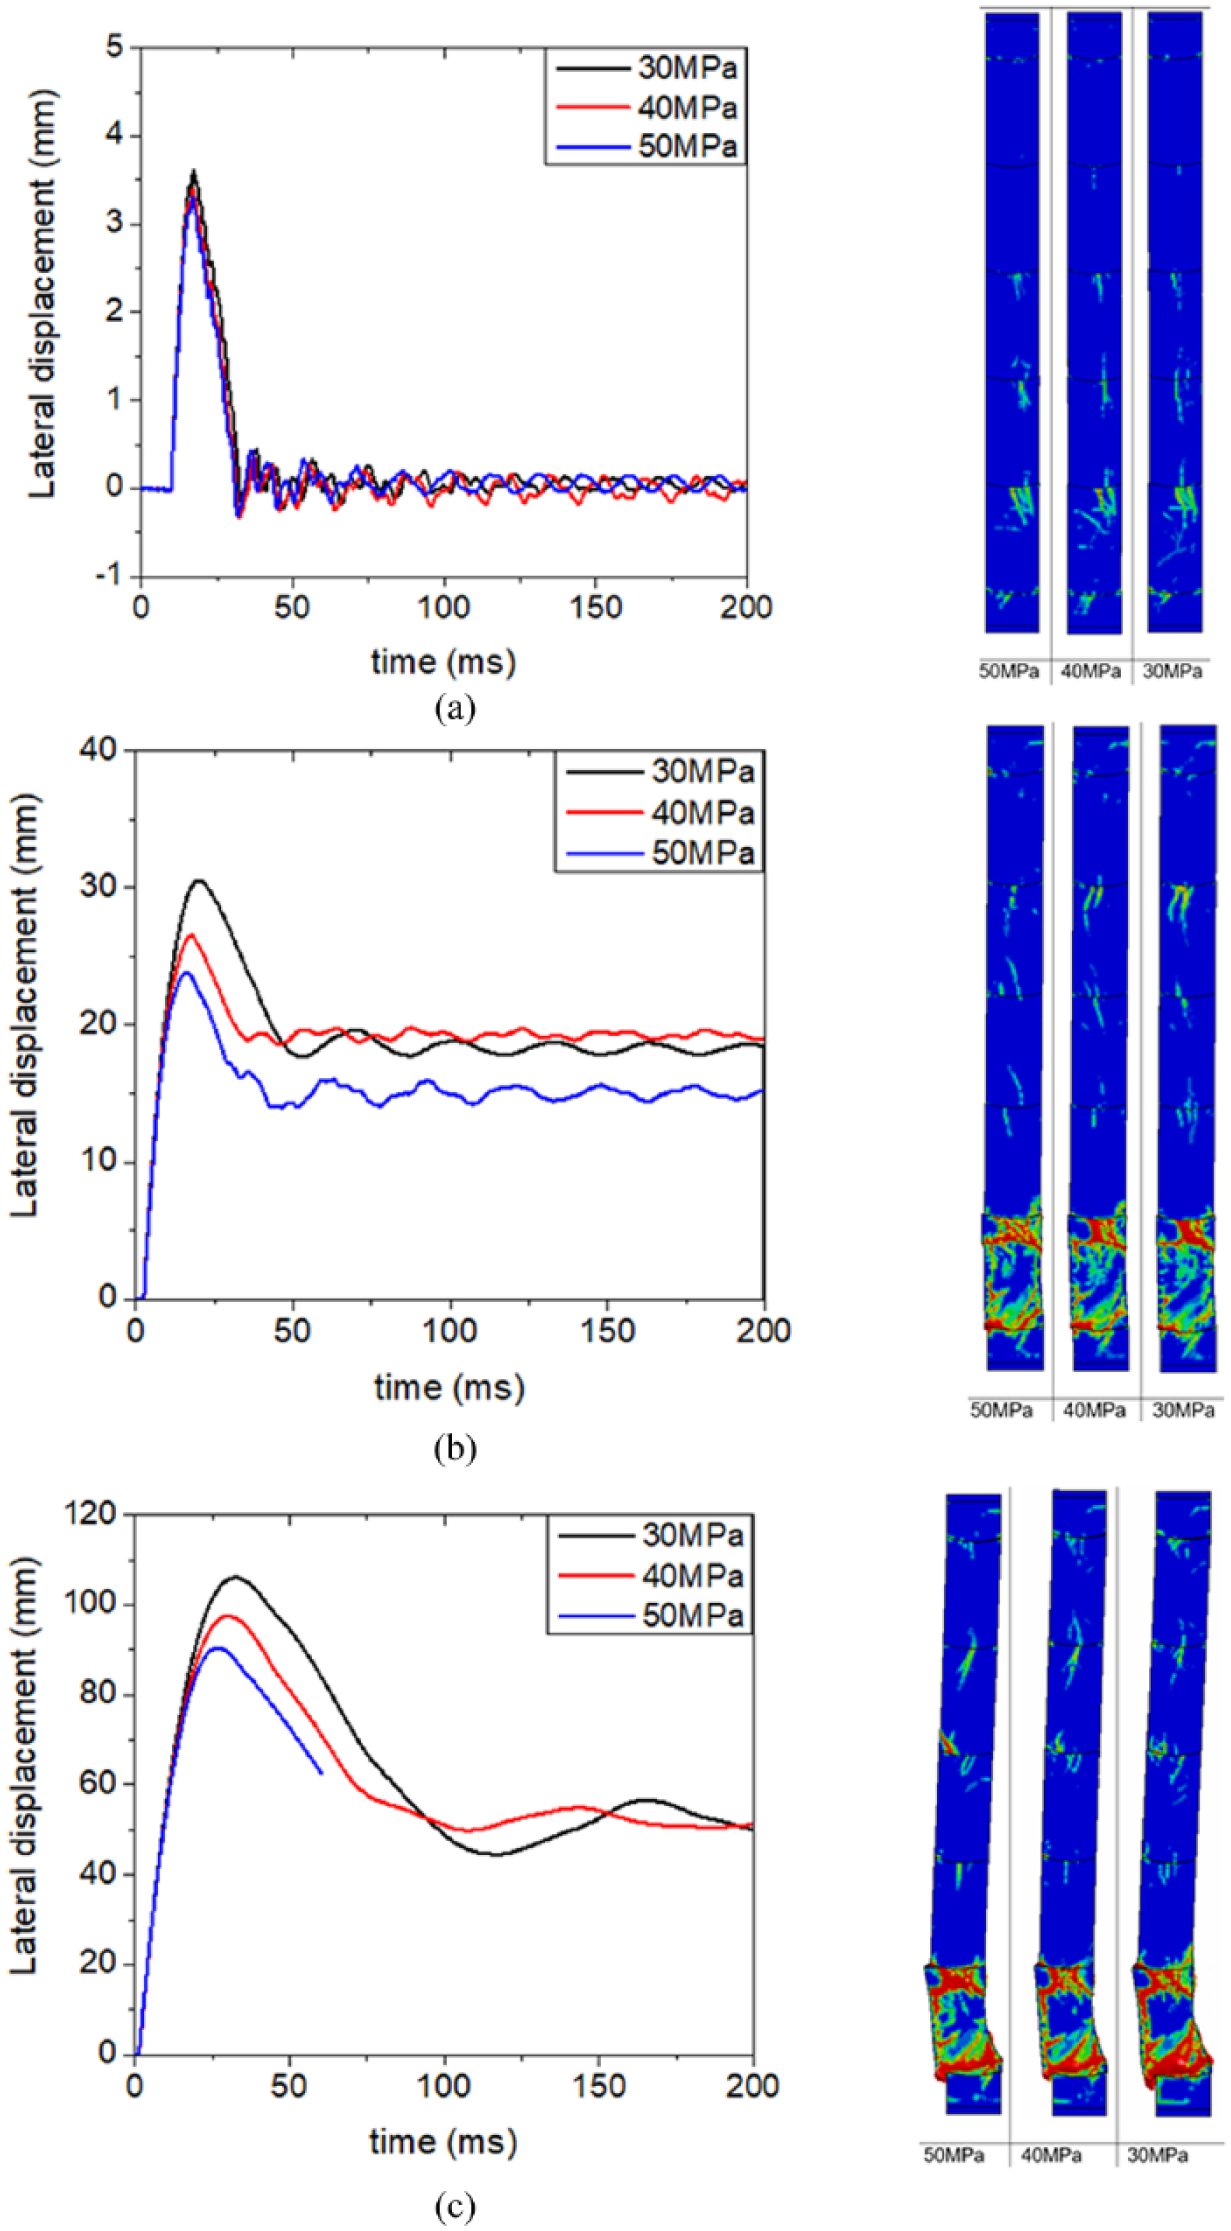
Comparison of first segment deflection time histories for columns with different concrete strengths subjected to direct concrete segment impact: (a) minor damage (1 m/s, 11.2t impact), (b) medium damage (4 m/s, 11.2t impact) and (c) major damage (8 m/s, 11.2t impact).
Conclusion
This article presents our recent studies on the performance of precast segmental concrete columns with unbonded post-tensioning tendon under lateral impact loading near the column base. A detailed three-dimensional numerical model of segmental column is developed and validated with laboratory testing results. The different failure modes of column when subjected to impact at bottom segmental joint and directly onto the centre of bottom concrete segment are investigated. It is found that despite the impact location is close to column base, the behaviour of the segmental column is still primarily flexural dominated when impacted at segmental joint. But when impacted directly on the bottom segment, shear deformation and failure to the column would be formed. Through parametric study, it is found that the level of post-tensioning force in the tendon leads to better impact resistances, which reduces the lateral deflection of the column. However, it results in more severe concrete shear damage when impacted directly on bottom concrete segment. Using higher strength concrete could provide noticeable improvement to the performance of segmental column subjected to impact loads.
Footnotes
Declaration of conflicting interests
The author(s) declared no potential conflicts of interest with respect to the research, authorship and/or publication of this article.
Funding
The author(s) disclosed receipt of the following financial support for the research, authorship, and/or publication of this article: The authors acknowledge financial support from Australian Research Council for carrying out this study.