




Abstract
Although marked advancements have been achieved to improve the computer power, progressive collapse analysis of large-scale reinforced concrete structures is still time-consuming or even impractical. In this study, a numerical model is proposed for efficient progressive collapse analysis of reinforced concrete structures. Recent advancements that can accurately and efficiently model the mechanical behavior of structural components are incorporated in the numerical model of reinforced concrete structure. The beams/columns, joint regions, and slabs are modeled by enhanced fiber beam element, macrojoint model, and layered shell element, respectively. In this way, the shear failure of beams/columns, failure of joints, and resistance contribution from floor slab can be taken into account for progressive collapse analysis of reinforced concrete structures. A six-story reinforced concrete frame structure is modeled using the approach proposed in this study. The progressive collapse of the structure is analyzed under column removal and direct blast loading scenarios. For comparison purpose, other popularly used finite element models are also adopted to carry out numerical simulations. The proposed model is proven to yield accurate simulation results with the least cost of time among all models. Based on the proposed model, parametric simulations are performed to investigate effective measures to improve the structural resistance to progressive collapse. It is found that increasing longitudinal reinforcement ratio in beams and columns can increase the catenary action capacity, but hardly increases the compressive arch action capacity. Moreover, the steel mesh reinforcement at top layer of slabs plays a significant role in resisting progressive collapse of reinforced concrete structures, which should be considered in design to resist progressive collapse.
Keywords
Introduction
Extreme loading conditions, such as impact and blast, are generally not taken into account in current practices in structural design and analysis. When structures are subjected to such highly dynamic actions, significant damage to structural components might be generated. In the worst case, the load-bearing elements can be completely destroyed, which may lead to collapse of the partial or entire structure, a large number of casualties, and marked economical losses. Recent decades have witnessed broad attention from structural engineering community to prevention of structural collapse (Alashker et al., 2011; Bao et al., 2012, 2008, 2017; El-Tawil et al., 2013; Iribarren et al., 2011; Kaewkulchai and Williamson, 2004; Khandelwal et al., 2008; Salem et al., 2011; Shi et al., 2010). The definition of the term “progressive collapse” is known as the spread of initial local failure from one or more elements to the neighborhood, which eventually results in the collapse of the entire structure or a disproportionate large part of it (Ellingwood, 2006). Understanding the mechanism of structural collapse and accurate analyses are crucial for design of new structures and retrofitting existing structures for collapse control.
Experimental and numerical methods are commonly adopted by researchers to study the progressive collapse resistance of structures. Laboratory investigations are mainly concentrated on planar frame structures (Orton and Kirby, 2013; Stinger and Orton, 2013; Yi et al., 2008), beam-column substructures (Choi and Kim, 2011; Lew et al., 2011; Qian and Li, 2012a; Su et al., 2009; Yap and Li, 2011; Yu and Tan, 2012, 2013), and scaled three-dimensional (3D) reinforced concrete (RC) structures (Kokot et al., 2012; Xiao et al., 2015). Moreover, a series of field tests were conducted by Sasani to study the progressive collapse resistance under column removal scenarios (Sasani et al., 2007, 2011; Sasani and Kazemi-Moghaddam, 2011; Sasani and Sagiroglu, 2008, 2010). According to the results obtained from these tests, flexural action, compressive arch action, and catenary action are the main collapse resistance mechanisms of RC structures. On one hand, the testing of planar frame structures or substructures cannot represent the whole structure due to the reduced complexity. On the other hand, whether physical tests adopting scaled structures can yield accurate results is often questioned because the scaling laws cannot always be satisfied. However, physical investigations about the resistance to progressive collapse of full-scale structures inevitably encounter many problems such as high costs and excessive complexities and uncertainties, which impedes the possibility to carry out duplicate or parametric studies.
With the significant advancements in computer technology and computation mechanics, testing full-scale structures in mathematical form has become achievable. A number of numerical methods for progressive collapse analysis of RC structures are developed, including discrete element method (DEM) (Gu et al., 2014; Hakuno and Meguro, 1993), applied element method (AEM) (Salem et al., 2011), and finite element method (FEM) (Brunesi and Nascimbene, 2014; Department of Homeland Security, 2011; Sagiroglu and Sasani, 2013). However, the DEM, AEM, and FEM with detailed models are still very time-consuming to complete the overall process of structural collapse, making it impractical for parametric studies or post-disaster estimation of structural safety. For example, a series of progressive collapse analyses were performed using detailed FE models for two 5-story RC frame buildings under column loss scenarios by Weidlinger Associates Inc. (WAI) (Department of Homeland Security, 2011). Even the DOD High Performance Computing (HPC) resources were used, the simulations of structural progressive collapse were still computationally intensive.
As a consequence, reduced FE models using frame elements were widely adopted for progressive collapse analyses of RC structures due to their computational efficiency (Iribarren et al., 2011; Kaewkulchai and Williamson, 2004, 2006; Kim and Yu, 2012; Lu et al., 2013). Unfortunately, the structural model used in these simulations generally neglected the joint failure, bond failure under large deformations, slab effect, and so on, and the simulation results cannot be considered satisfactory. In recent years, a large amount of research activities has been carried out by the National Institute of Standards and Technology (NIST) to account for these deficiencies. However, steel structures were mainly considered (Khandelwal and El-Tawil, 2007; Khandelwal et al., 2008; Main and Sadek, 2013; Sadek et al., 2008). Achievements on reduced computational models for RC structures are very limited. A macro-based joint model was proposed by Bao et al. (2008) to simulate the progressive collapse of RC frame structures and was later modified according to a test on full-scale RC sub-assemblages (Bao et al., 2012; Lew et al., 2011). However, there is still a lack of 3D reduced numerical models which can be used for progressive collapse of RC frame structures with both reliability and efficiency.
In a previous study, an enhanced fiber beam model that accounts for both damage and shear effects of RC beams and columns under blast loading was proposed in progressive collapse analysis (Li et al., 2016). However, the complex nonlinear behavior of beam-column joints and floor system is not properly considered. The beams and columns of RC structure are still modeled by traditional fiber beam element model in Bao et al. (2012), which is not capable of modeling RC components under blast loading. In this study, fiber beam element with shear effect, RC beam/column macrojoints, and floor system are introduced into the proposed model to simulate progressive collapse of RC structures subjected to blast loads. Experimental results in literatures are used to validate the macrojoint model and floor system model. In the end, a six-story RC frame structure is analyzed under column removal and blast loading scenarios to demonstrate its reliability and efficiency. Based on the proposed model, parametric simulations are carried out to investigate effective measures to increase the structural resistance to progressive collapse.
Proposed numerical model and validation
The RC structures generally undergo strong material and geometric nonlinearities in the process of progressive collapse (Yu and Tan, 2013). Although detailed FE model with solid elements for concrete material can simulate all the collapse resistance mechanisms, it is not computationally efficient and therefore not suitable for analyzing large-scale RC structures. To increase the calculation efficiency while assuring the accuracy, in this study, the reduced model consisting of enhanced fiber beam element, rigid beam element, spring element, and layered shell element is developed as shown in Figure 1. The enhanced fiber beam element for beams/columns, the macrojoint model for beam-column joint regions, and layered shell element for floor systems are key parts of the numerical model. It should be noted that all building codes require certain overlapping lengths of lap splice so that the discontinuous reinforcements can be considered as continuous. Therefore, this study neglects the lap splices but only considers continuous reinforcements. Although a certain degree of simplification is made for each model for efficiency, the reliability of the models is proven by comparing simulation results with experimental references as detailed below.
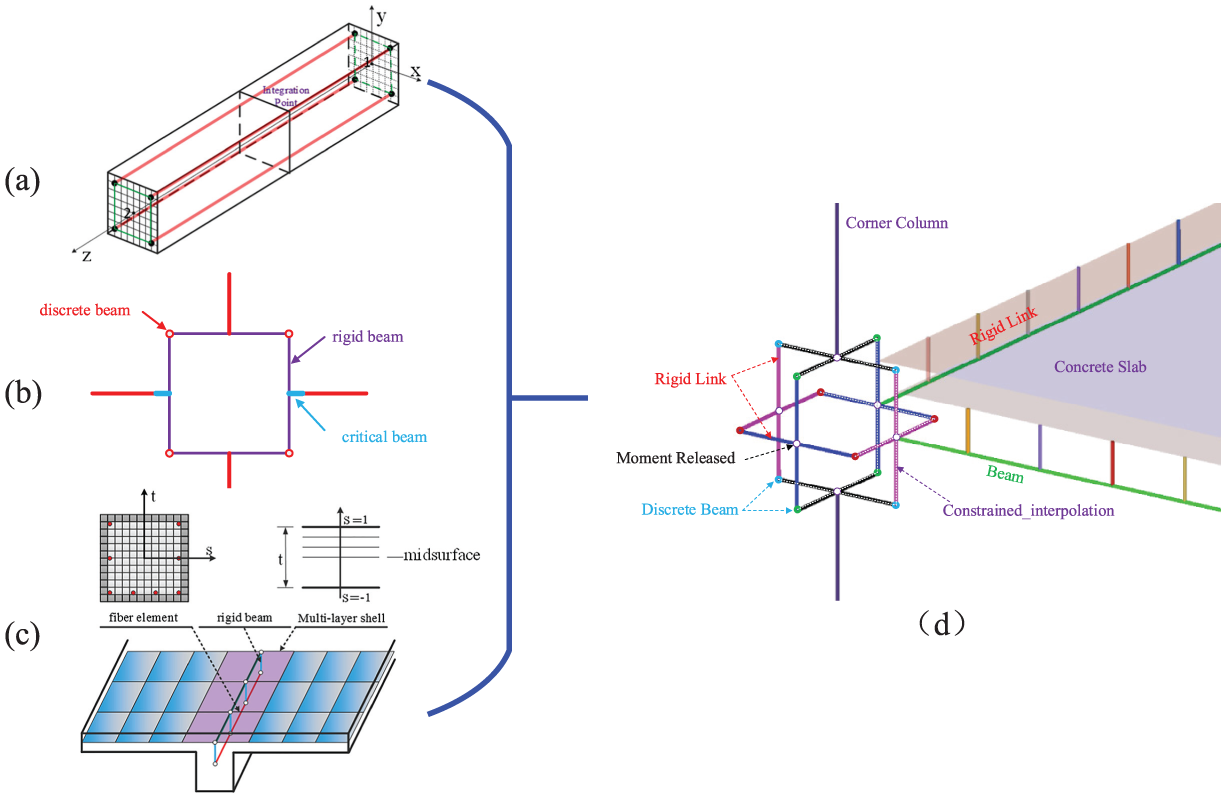
The hierarchy of the proposed numerical model: (a) the enhanced fiber beam element, (b) the macrojoint model, (c) the floor system model, and (d) the proposed numerical model for progressive collapse of RC structures.
Enhanced fiber beam element model for beams and columns
Traditional fiber beam element model has been widely used to model RC beams and columns whose failure is predominantly controlled by flexural behavior under normal actions. Under highly dynamic actions such as blast or impact, RC beams and columns are highly likely to have significant shear damage, which cannot be captured by traditional fiber beam element model (Crawford et al., 2012, 2013; Crawford and Magallanes, 2011). In order to accurately analyze the dynamic response of RC structures, the damage and shear effects have been introduced into Hughes-Liu beam element. The Mazars damage model and isotropic hardening plasticity model are used for concrete and reinforcing bars, respectively. The strain rate of concrete is introduced into Mazars model by modifying the damage threshold
Component-based macrojoint model for beam-column joints
In conventional simulations of RC structures, beam-column joint region is often modeled as a node where beam and column elements intersect, as shown in Figure 2. However, this modeling technique cannot properly consider the stiffness of joint regions. In addition, joint regions may suffer severe shear deformation and sometimes even shear failure. To account for these remarkable characteristics, macrojoint model has been widely used in seismic analysis of RC structures (Lowes et al., 2005; Mitra and Lowes, 2007) and was recently used in progressive collapse analysis (Bao et al., 2008, 2012; Yu and Tan, 2013). The macrojoint model adopted in this study is based on the modified model by Bao et al. (2012), as shown in Figure 1(b). In the macrojoint model, Hughes-Liu beam element is used to represent the beams and columns while the joint panel is modeled by a deformable rectangular frame which consists of rigid beams and nonlinear springs located at the corners. Furthermore, separated critical beams are defined to consider the bond-slip behavior of reinforcing bars at the fixed end. Zero-length discrete beam elements are used to connect the rigid beams, and independent curves are assigned for all degrees of freedom using *MAT_GENERAL_NONLINEAR_6DOF_DISCRETE_BEAM in LS-DYNA. The description of this functionality as well as other key functionalities used in the present study is summarized in Appendix I. The in-plane moment–rotation relationship can be generated using the MCFT (Vecchio and Collins, 1986). The connection between beams/columns and joint panels is defined through the keyword *CONSTRAINED_INTERPOLATION in LS-DYNA (Hallquist, 2007).
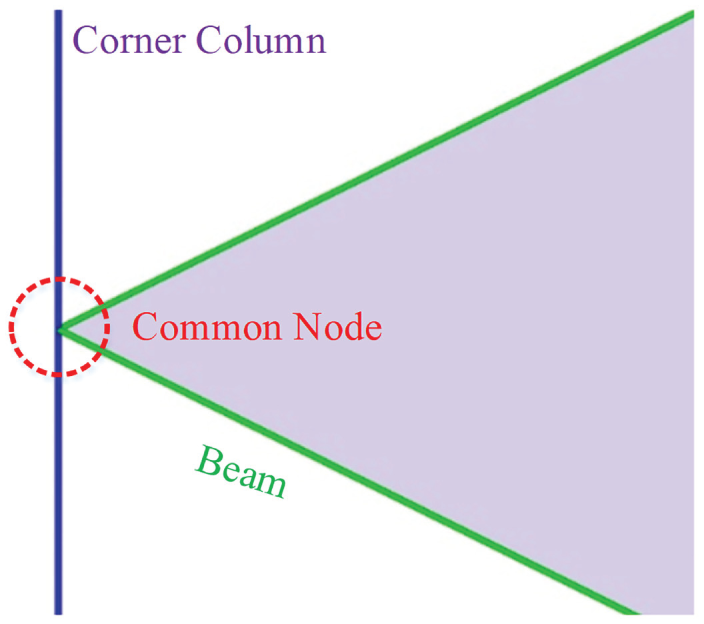
Traditional frame model for RC structures.
As illustrated by some recent experiments (Lew et al., 2011; Yu and Tan, 2013), the bond-slip at the beam-column ends connected to the joints may induce the “fixed end” rotations, which plays a significant role in the process of progressive collapse. In order to save computational effort in analyzing large-scale RC frame structures, the model proposed by Yu (2012) is used here to consider the bond-slip behavior in a macroscale way. The stress–slip relation is transformed into stress–strain relation of rebars based on equations (1) and (2) proposed by Bao et al. (2012), such that it can be easily used in the numerical simulations


where L0 is the initial gauge length of the steel bar and L is the deformed length of the steel bar including slip
The shear stress versus shear strain


where Vj is volume of the joint region.
Specimen S1 tested by Yu and Tan (2013)
In order to validate the feasibility of the macrojoint model, results of the RC beam-column sub-assemblages (S1) tested by Yu and Tan (2013) are used as the reference. The net span of the beam is 2750 mm with a sectional dimension of 150 mm × 250 mm. Details of the specimen can be found in Table 1. The boundary conditions in the simulation were considered with special cares using discrete beams to model the horizontal constraints so that the connection gaps can be well captured by defining a properly measured force–displacement curve for the discrete beams. Figure 3 shows the FE models of the specimen developed in LS-DYNA. The macrojoint model considers both the dimension of joint regions and bar slip at the beam ends, while the traditional model neglects the dimension of joint regions. The compressive strength of concrete is 31.2 MPa while the yield and ultimate strengths of reinforcement are shown in Table 2. The calculated moment–rotation relationship is shown in Figure 4. A displacement-controlled loading scheme is applied on top of the middle joint to conduct the analysis.
Geometric properties of the specimen (Yu and Tan, 2013).


FE models for the test specimen S1.
Material properties of steel bars in Yu and Tan (2013).

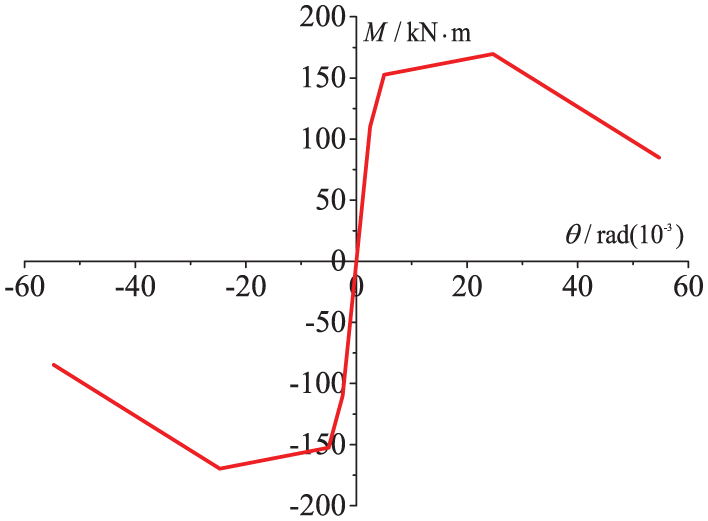
The calculated moment–rotation relationship for S1 specimen in (Yu and Tan, 2013).
The experimental and numerical results are compared in Figure 5. In general, the numerical simulation results with macrojoint model agree better with the test results in comparison with traditional model. Particularly for macrojoint model, the predicted applied load is slightly higher than the test value possibly because the boundary conditions cannot be captured well enough as the stiffness of horizontal constraints measured is assumed as multilinear curves for simplicity. Meanwhile, the predicted fracture of bottom rebars is slightly different from the experiment, and a certain deviation exists in the catenary stage. This is mainly because the longitudinal bars in the same row generally fail at the same time in the finite element model for its symmetry and material homogenization, while in reality, the material may exist some initial defects and the bar fracture happens in an indefinite sequence. Nevertheless, the macrojoint model considering bond–slip behavior and joint panel shear effect has the ability to well capture the resistance mechanisms from the very beginning to large deformations, including flexural action, compressive arch action, and catenary action. In addition to comparing the force–displacement relations, Figure 6 compares the final deformation of the specimen from tests and simulations with macrojoint model and traditional co-node model. As can be seen, the final deformations observed in the test and calculated by numerical simulation with macrojoint model match well, whereas the traditional co-node model for beam-column joint region fails to yield accurate results due to over simplification. Therefore, the macrojoint model is deemed to yield satisfactory calculation results.

Comparison of experimental and numerical results of the specimen: (a) applied load versus displacement and (b) horizontal reaction force versus displacement.
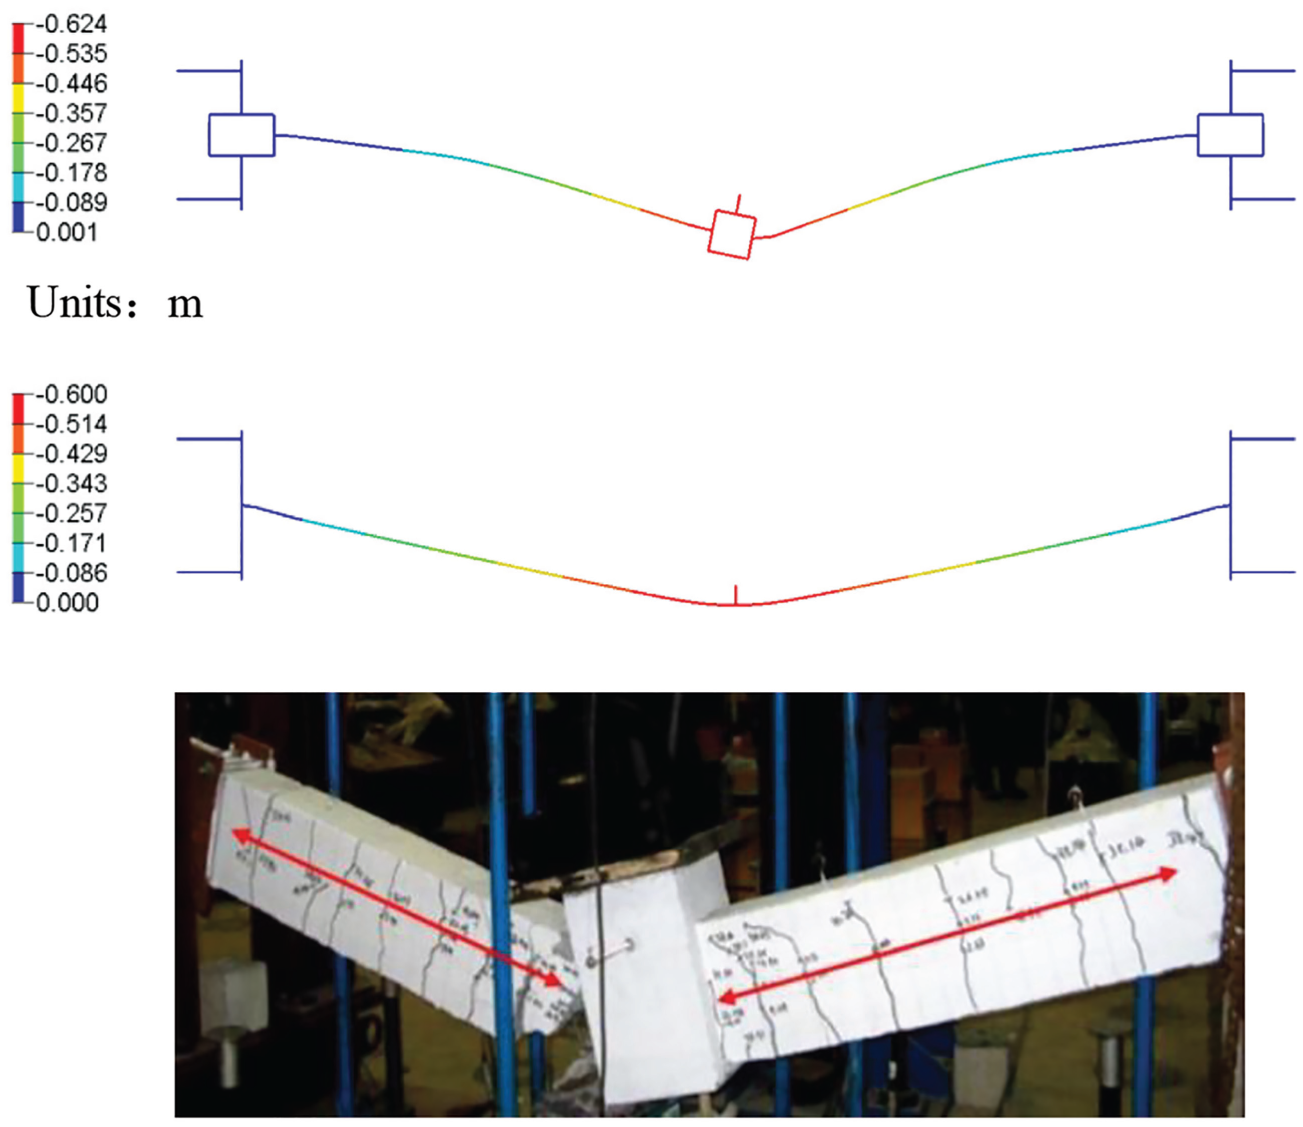
Comparison of the final deformation state of experimental and numerical results.
Specimen IMF tested by NIST
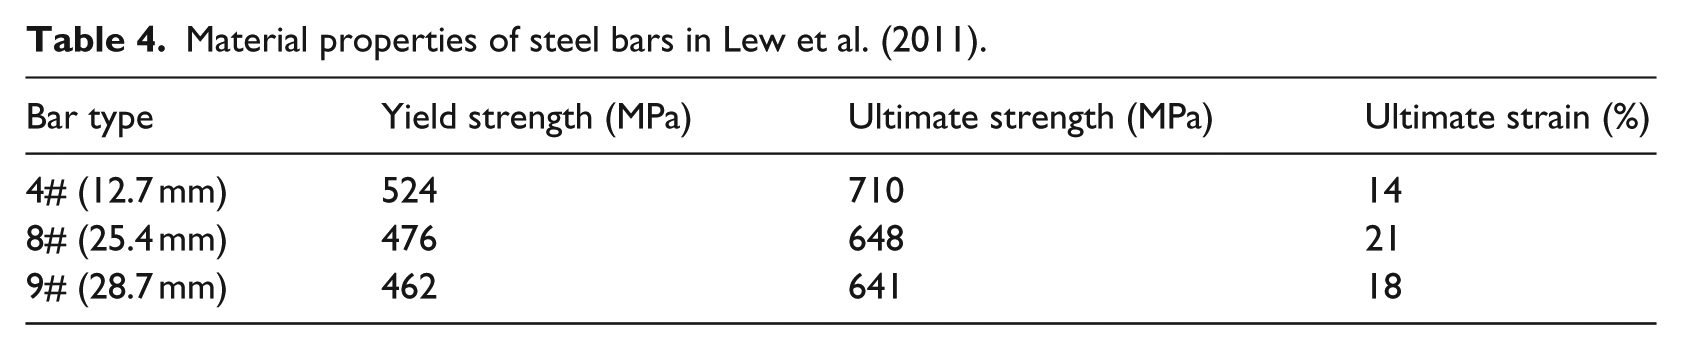
An experimental study of two full-scale RC beam-column assemblies (specimen IMF, SMF) under a column removal scenario is carried out by NIST in 2011 (Lew et al., 2011). The specimen IMF is simulated using the present numerical model. The geometrical properties of the specimen are shown in Table 3, and the detailed reinforcement information can be found in the reference. Figure 7 shows the established FE models using macrojoint model and traditional model, respectively. The calculated moment–rotation relationship for the discrete beam is shown in Figure 8. The concrete compressive and tensile strength are 32 and 3.1 MPa, respectively. The mechanical properties for steel bars are given in Table 4. The comparison of results from test and simulation is shown in Figure 9. As can be observed, the simulated result by macrojoint model matches well with the test data.
Geometric properties of the specimen (Lew et al., 2011).

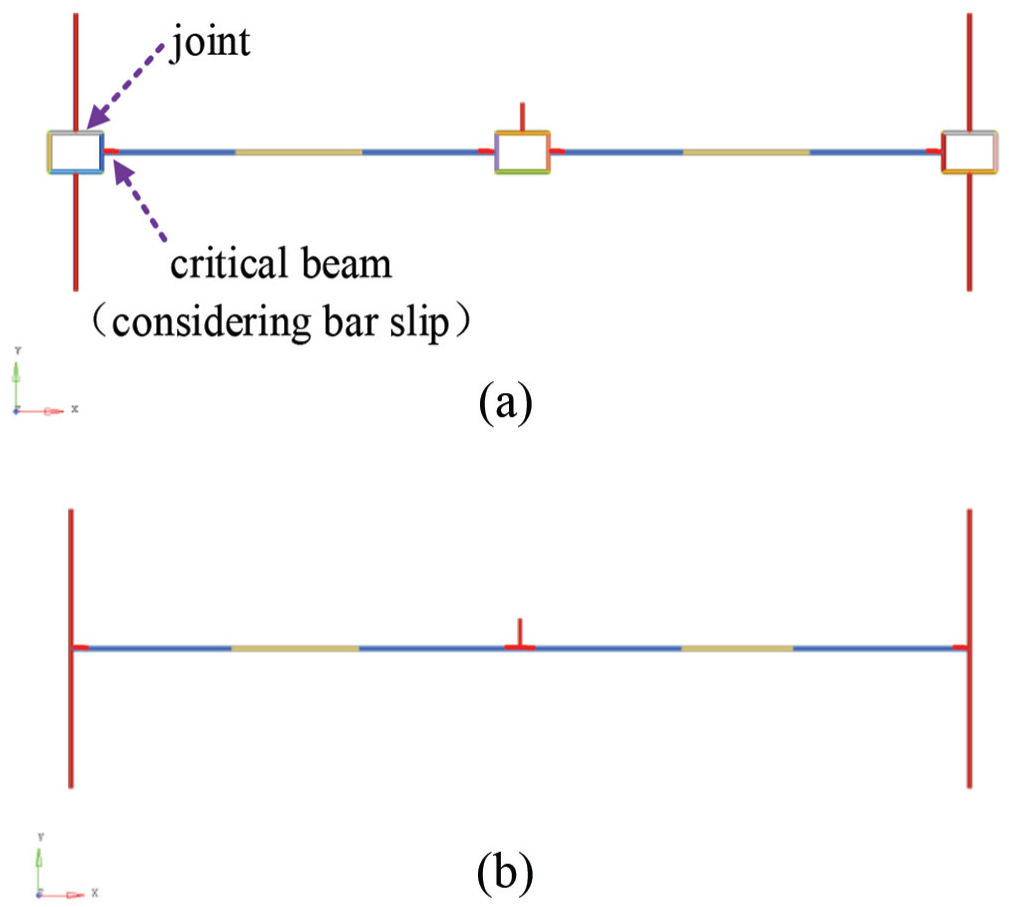
FE models for the test specimen IMF: (a) Macrojoint model and (b) traditional model.

The calculated moment–rotation relationship for the specimen in (Lew et al., 2011).
Material properties of steel bars in Lew et al. (2011).
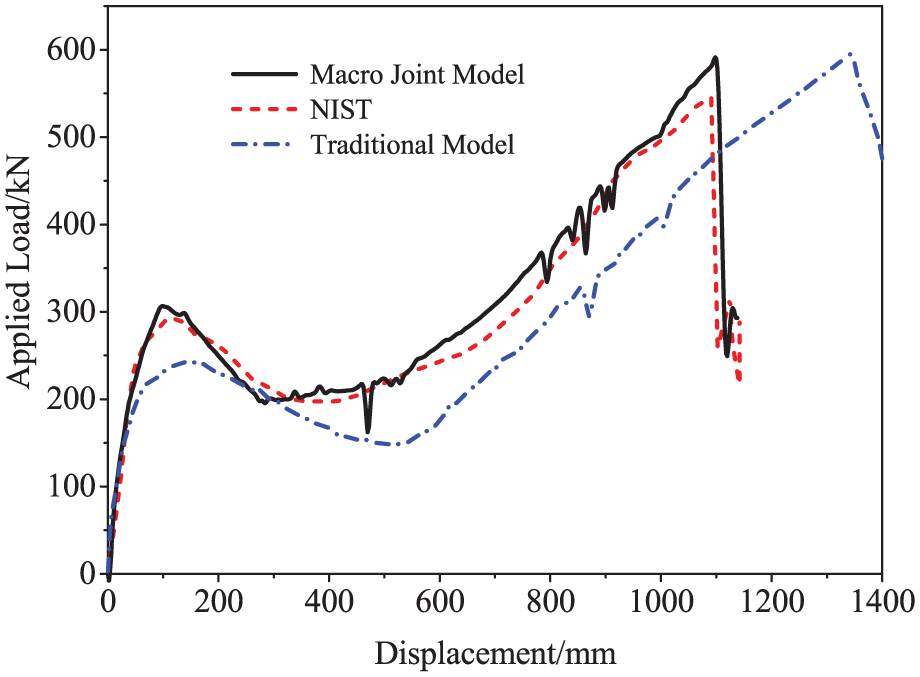
Comparison of experimental and numerical results.
Macromodel for floor systems
The floor slab could provide compressive and tensile membrane actions in the process of deformation development, contributing a lot to progressive collapse resistance of RC structures (Keyvani et al., 2014; Punton et al., 2011; Qian and Li, 2012b, 2013). Under an increasing load, the formation and propagation of flexural cracks in the slab along with yielding of rebars reduce the depth of the compressive zone in the cross section. As a result, the neutral axis moves away from the centerline, and tensile strain forms at the mid-height of the slab. When the ends of the slab are fixed, the compressive membrane action can be formed as it deforms vertically. In addition, the floor slab can provide axial and bending constraints to beams and remarkably increase the flexural stiffness. It is reported that the ultimate resistance of the beam-column sub-assemblage with slab can increase 63% compared to the specimen without slab (Qian and Li, 2012b). Therefore, modeling of floor system should carefully consider two main aspects, namely (a) the compressive and tensile membrane actions and (b) correct positions between beams and slabs, such that the contribution of floor slabs to the structural resistance to progressive collapse can be accurately accounted. The model for floor system developed in this study is shown in Figure 10. Perfect bond between reinforcement and concrete matrix is assumed. The slab is modeled using multi-layer shell elements, which is achieved by user-defined integration algorithm through keyword *INTEGRATION_SHELL. The Hughes-Liu shell element in LS-DYNA is adopted to simulate the floor slabs. This type of shell element is based on a degenerated brick element formulation and includes finite transverse shear strains. For cast-in-place RC beam-slab floor system, from some representative experiments conducted by Qian and Li (2012b), Ren et al. (2016), and Lu et al. (2017), no shear failure can be observed in the interface between slab and supporting beam. Therefore, in our study the shear failure of the interface is not considered, that is, the floor slab and supporting beam is connected by rigid beams as illustrated in Figure 1(d). The rigid beams are modeled by *MAT_RIGID free from global translational and rotational constraints, by which the continuity of displacements and rotations at the interface between beams and floor slabs is ensured. Reasonable consideration of moment of inertia of the floor system is essential for accurate calculation of the structural resistance. However, as illustrated in Figure 2, beams and slabs share nodes in the traditional frame model for RC frame structure. Thus, the neutral axes of floor slab and beam are overlapped due to this simplification, and the moment of inertia of the beam-slab floor system is significantly underestimated. By linking slabs and supporting beams with rigid beams in this study, the relative positions of beams and slabs, and thus the moment of inertia of the beam-slab floor system, can be properly considered. The material model defined by keyword *MAT_CONCRETE_EC2 is adopted to separately simulate the constitutive properties of concrete and reinforcement. In addition, this material model is also able to include concrete cracking in tension and crushing in compression, and reinforcement yielding, hardening, and failure, which are of great importance to calculate the mechanical behavior of slab subjected to large deformation.

Overview of the floor system model.
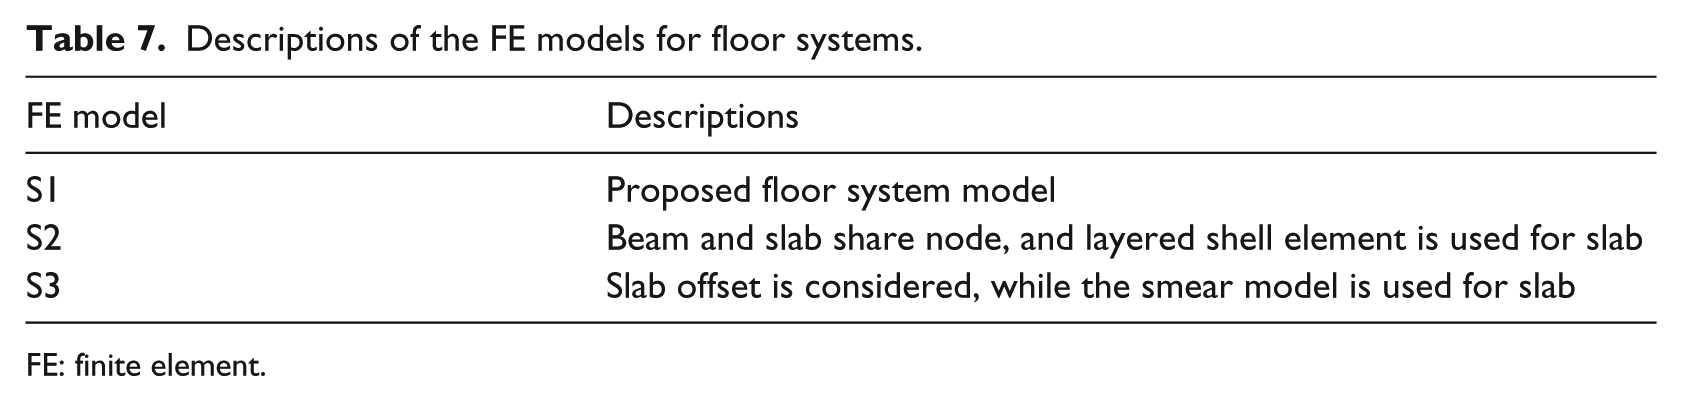
To validate the proposed model for floor system, test on beam-slab sub-assemblages (S6) in Ren et al. (2016) is simulated and the numerical and experimental results are compared. Fixed boundary condition is applied to both ends of the slab through two strong beams connecting the boundary blocks to restrict horizontal displacement. The dimension of the section and arrangement of reinforcement are detailed in Table 5. An average compressive strength of 44 MPa is adopted for concrete, and material properties of steel reinforcement are shown in Table 6. The established FE model of the specimen is shown in Figure 11 where the beams and slabs are connected through rigid beams. A total of three different FE models (denoted as S1, S2, and S3 in Table 7) are developed to demonstrate the advantage of the proposed floor system model S1. The rigid links between beams and slabs are abandoned in S2 model, and beams and slabs share nodes in a traditional way. As for S3 model, the separated modeling of concrete and reinforcement in slabs is replaced by a smeared scheme. A displacement-controlled load is applied on the middle joint to calculate the response of the slab. The comparison of experimental and numerical results of applied load versus displacement relation is shown in Figure 12. It is obvious that the numerical results computed with S1 model agrees well with the experimental result, including the compressive arch action capacity, the catenary action capacity, and the bar fracture. Using model S2, the calculated flexural action and compressive arch action capacities are underestimated. The calculated peak compressive arch resistance is only about 33 kN whereas that obtained from test is 50 kN. This is mainly because S2 model ignores the slab offset, which leads to the underestimation of the structural moment of inertia. In addition, the catenary action capacity is well captured by S2 as it is primarily influenced by longitudinal reinforcements. In S3 model, both the compressive arch action and catenary action capacities are significantly underestimated for its smeared consideration of reinforcement in slabs. This implies that it is vital to simulate the slabs in a proper way where compressive ring forming within the deflected slabs play a significant role in collapse resistance mechanisms. Meanwhile, the catenary action mechanism cannot be well developed with the smeared reinforcements in slabs. It is worth mentioning that an additional simulation without slabs is conducted, and the first peak resistance is only about 12 kN, which is far less than that (50 kN) calculated by considering slabs presented in Figure 12. The increase of the resistance of the floor system with slabs can be attributed to the increased flexural stiffness as well as the formation of compressive membrane action of the floor slabs.
Geometric properties of the specimen (Qian and Li, 2012b).

Material properties of steel reinforcement in Qian and Li (2012b).

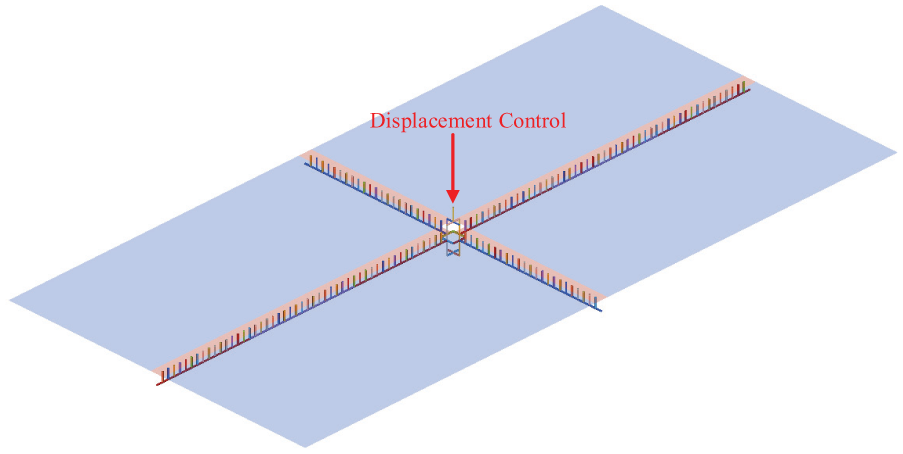
FE model of the specimen.
Descriptions of the FE models for floor systems.
FE: finite element.
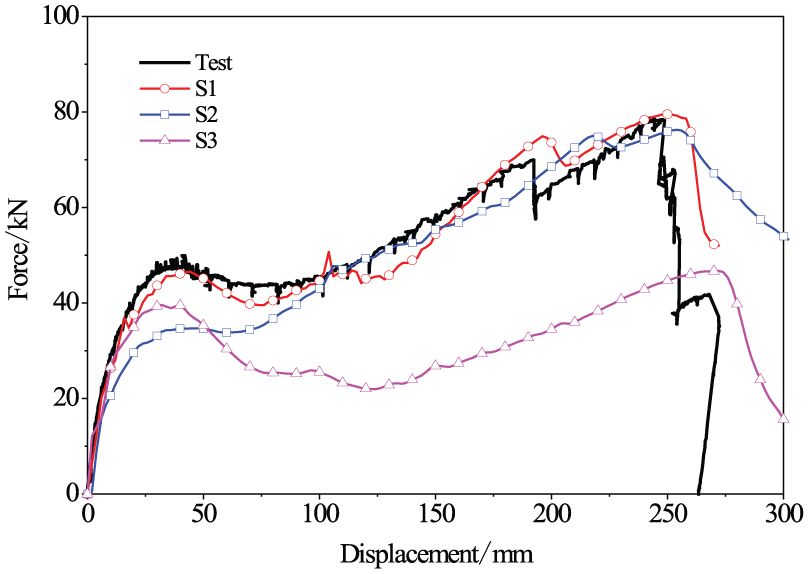
Comparison of the experimental and calculated force–displacement relationships.
Proposed numerical model for RC frame structure
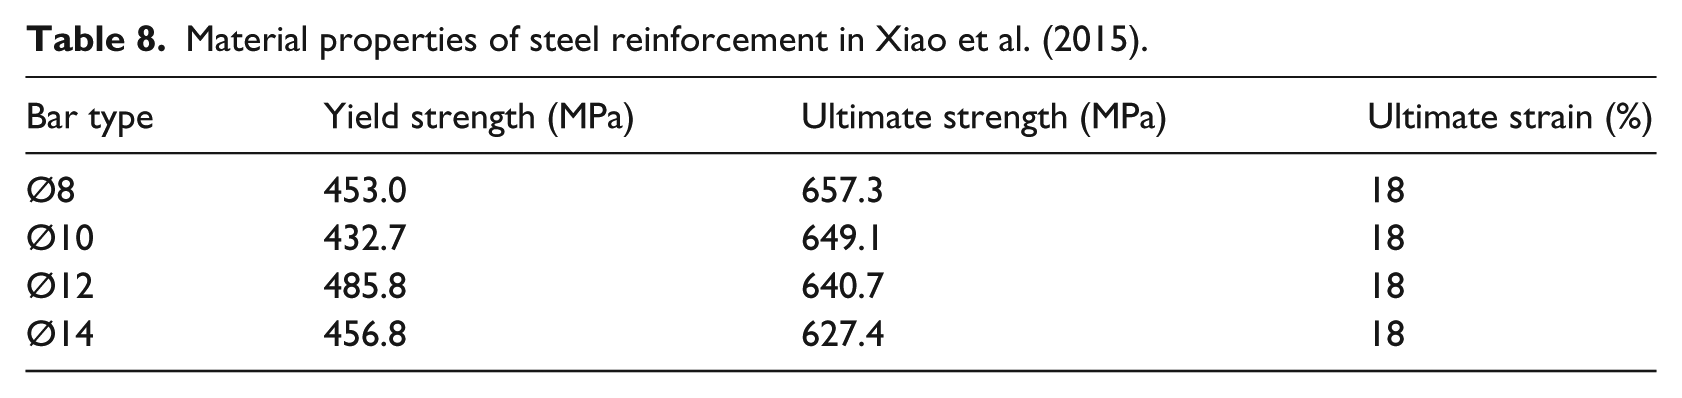
In order to calibrate the proposed numerical model of the RC frame structure, the field test on a 3-bay, 3-story, half-scale RC frame by Xiao et al. (2015) is simulated. The plan view, loaded regions, and elevation view are shown in Figure 13. Geometrical properties and reinforcement details can be found in the reference. The average unconfined concrete compressive strength was 33 MPa. The yield strength, ultimate strength, and ultimate strain of reinforcement are provided in Table 8.
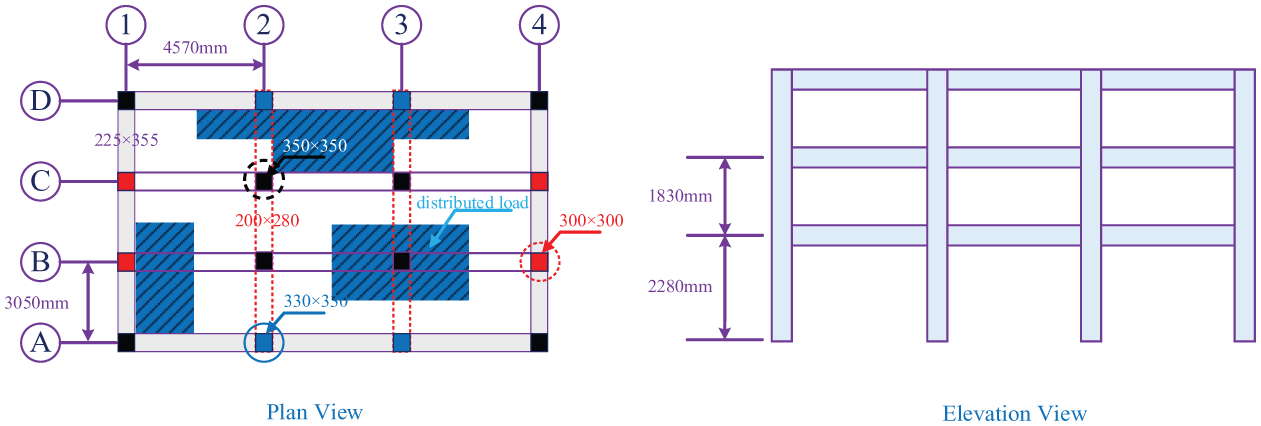
Plan and elevation views of the 3-story RC frame structure.
Material properties of steel reinforcement in Xiao et al. (2015).
The test scenarios with sequential removal of columns D3 and D2 are selected to conduct the numerical simulation. Both the proposed model and traditional frame model are used to simulate dynamic response of the RC frame structure under sequential removal of columns D3 and D2. The vertical displacement histories on top of removed columns obtained from the test and simulations are compared in Figures 14 and 15. As can be seen, the proposed model is able to accurately reproduce the test results, indicating its validity in progressive collapse analysis of frame structures.
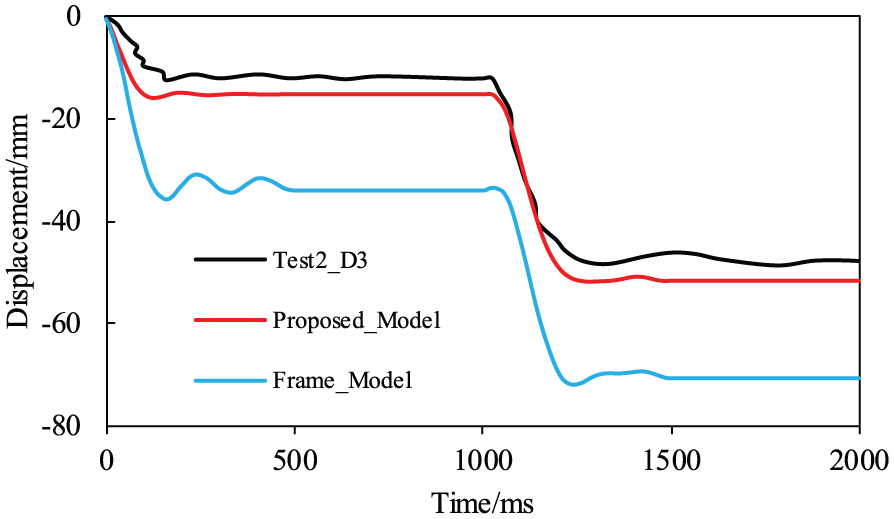
Comparisons of displacement history of the point at top of column D3.
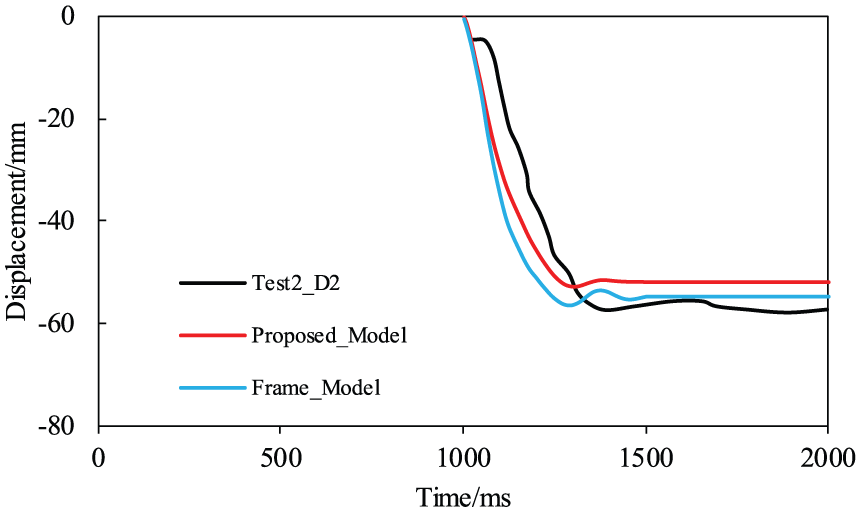
Comparisons of displacement history of the point at top of column D2.
Numerical examples
Based on the validated models for beams/columns, joint regions, and floor systems, confidence has been built to conduct progressive collapse analysis of the structural system. A six-story RC frame building is modeled as a benchmark in this study. The plan and elevation views of the building are shown in Figure 16. In the plan view, beams and columns at different positions are numbered by A, B, and C in horizontal direction and 1, 2, 3, and 4 in vertical direction. For example, corner columns are represented by A1, A4, C1, and C4 while beam between columns B2 and C2 is represented as B2-C2. The cross-sectional dimensions of beams and columns are both 300 mm × 300 mm. Four longitudinal reinforcing bars are placing at each corner of the section with a diameter of 16 mm for beams and 20 mm for columns while the Ø10 mm stirrup reinforcements are spaced with 200-mm interval for both beams and columns. The thickness of the floor slab is 100 mm with steel mesh reinforcement ratio of 0.785% in the middle layer. The compressive strength of concrete is 30 MPa. The yield strength, ultimate strength, and ultimate strain of steel reinforcement are 335 MPa, 480 MPa, and 0.15, respectively. The service load applied on the floor slab is 2.0 kPa, and a load of 60 kPa is imposed on top of beams considering the weight of infill walls. It should be noted that the infill walls can provide alternative load paths to transfer the loads originally only supported by the beams, and thus, improve the collapse resistance capacity of the RC frame (Shan et al., 2016). In this study only the weight of infill walls is considered as the RC frame structure is of primary concern. When the corresponding material failure criteria is reached, related elements are deleted to simulate the failure of the structure.

Plan and elevation views of the RC frame structure.
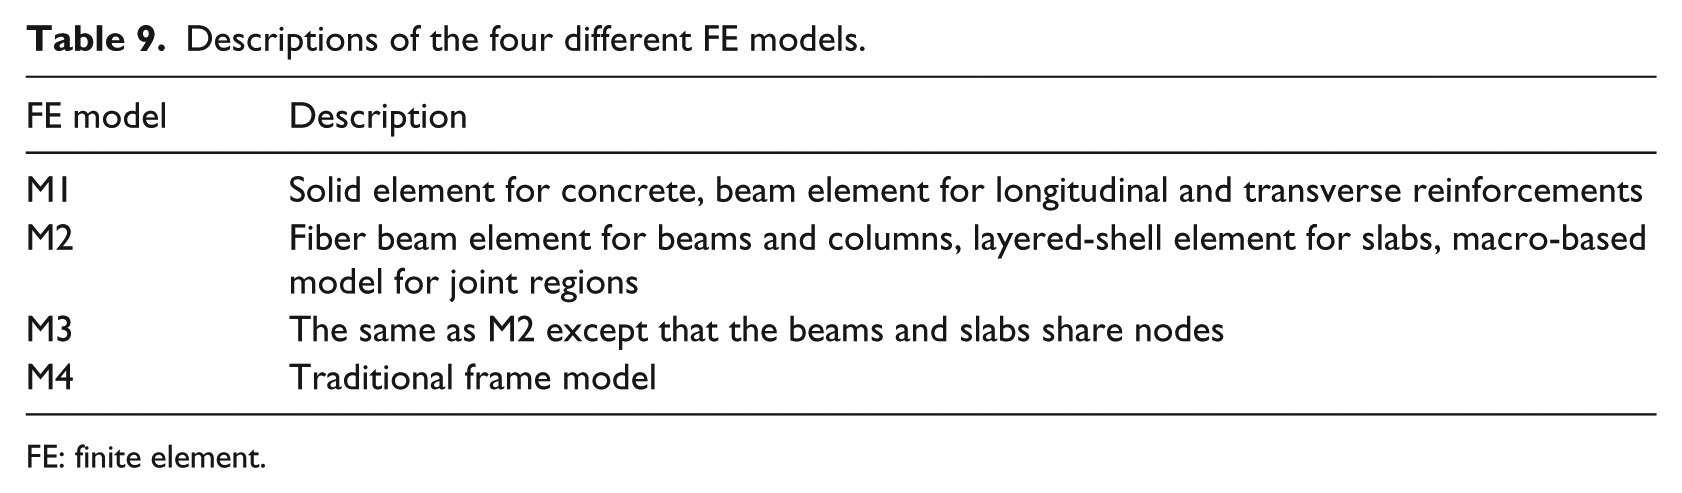
For validation and comparison purpose, a total of four different FE models are developed and simulated. As outlined in Table 9 and shown in Figure 17, M1 model is considered as a reference with solid elements for concrete and beam elements for reinforcing bars. M2 is the proposed numerical model with enhanced fiber beam element for both beams and columns, macrojoint model for joint regions, and layered-shell element model for floor slabs. M3 is almost the same as M2 except that the beams and slabs share nodes. M4 is the traditional frame model which neglects the details of the joint regions and shares nodes in beams and slabs.
Descriptions of the four different FE models.
FE: finite element.
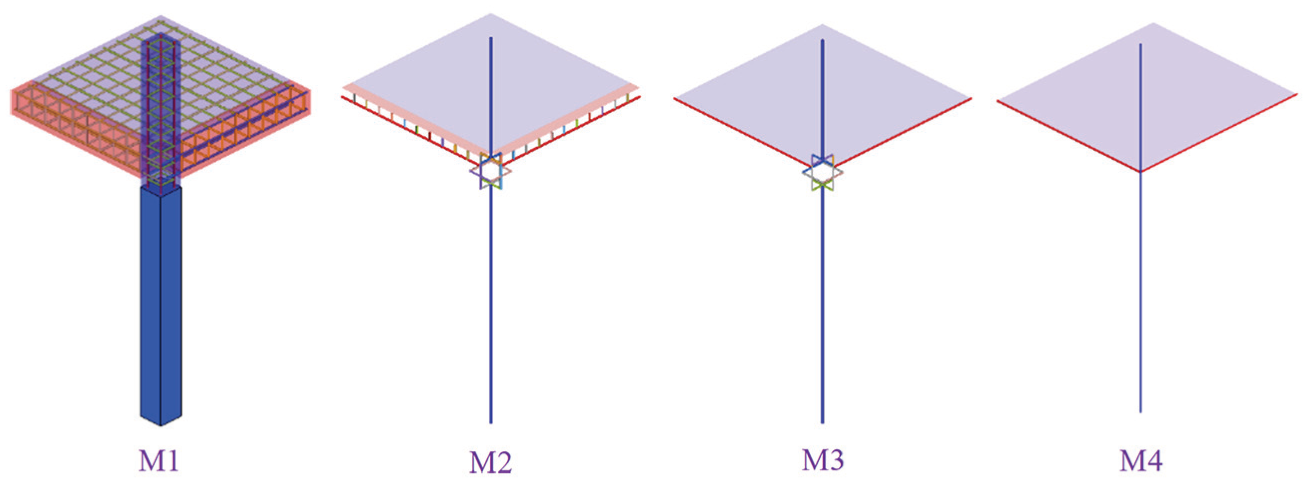
FE models of the RC frame structure (corner region).
Dynamic response under column removal scenarios
The service loads are applied to the model gradually from 0 to 200 ms. After the structure enters into a steady state, column(s) of interest are removed instantaneously using the restart technique, followed by nonlinear response analysis until the defined termination. It should be noted that the immediate removal of columns is not completely representing the real case. However, this analysis method is widely used in the research field and even been recommended by several design codes and standards for progressive collapse design (Department of Defense, 2009; General Services Administration, 2003). Therefore, this analysis approach is adopted in this study. In this section, four scenarios of column removal are considered to validate the proposed numerical model, of which three scenarios removes single column at different positions, while the fourth case considers removal of two columns simultaneously. In each case, all FE models in Table 9 are simulated to calculate the dynamic response of the RC frame structure and possible progressive collapse process.
Removal of columns C1, C2, and B2
The side columns may be destroyed during a terrorist attack while the inner column may be severely damaged in a gas explosion accident. Therefore, for scenarios with single column removal, corner column C1, side column C2, and inner column B2, are considered. The calculated final displacement contour state of the frame structure and the vertical displacement time histories at the node above the removed column are compared in Figure 18. As can be observed, the vertical displacement distribution in the structure and displacement time histories from M1 and M2 simulations are almost identical for all the three scenarios. For the scenario with corner column C1 removed, the maximum displacement of the node above the removed column is about 60 mm for M1 and M2 while that for M3 is 435 mm, which indicates the structural resistance is significantly underestimated. Meanwhile, the calculation of M4 cannot reach a steady state, and progressive collapse of the frame structure occurs.
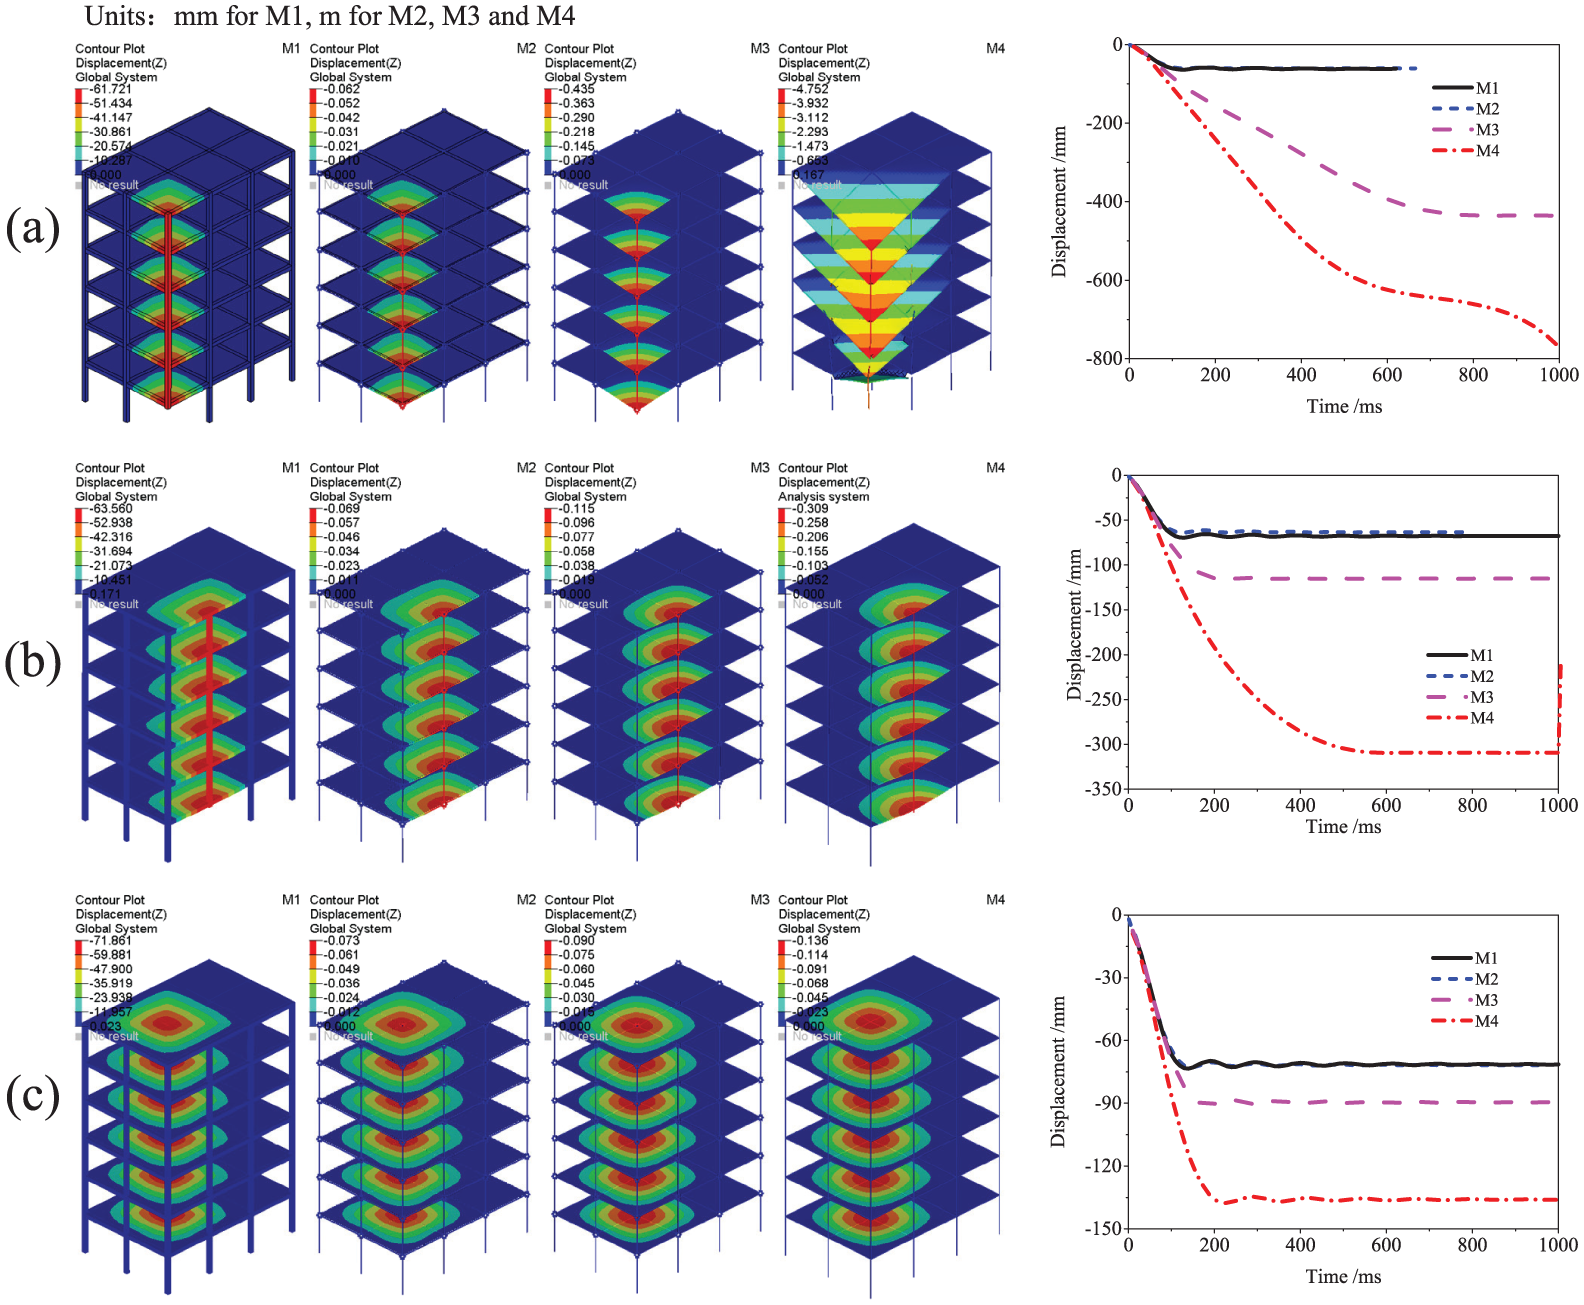
Comparisons of displacement contours and time histories: (a) removal of column C1, (b) removal of column C2, and (c) removal of column B2.
The comparison of axial force time histories in adjacent column C2 in scenario with column C1 removed is shown in Figure 19. As can be observed, the results calculated from M1 and M2 simulations match very well, while the axial forces in column C2 obtained from M3 and M4 simulations first reach a much lower value and keep steady, indicating the initiation of resistance mechanism of floor system. When the resistance reduces due to cracking of the slab, the axial force in column C2 increases. For M3 simulation, the structure finally reaches a steady state while the corner region in M4 simulation is finally collapsed due to severe damage of column C2 and the floor slab. For the scenario with column C2 removed, the relation between axial force in beam B2-C2 and vertical displacement at point B2 are compared in Figure 20 while the relation between moment at B2 end of beam B2-C2 and vertical displacement at point B2 are compared in Figure 21. As can be observed, the initial stiffness from M1 and M2 simulations are almost identical, indicating that the proposed numerical model is reliable compared with the high-fidelity FE model. However, the initial stiffness from M3 and M4 simulations are underestimated. This is mainly because that the slab position and joint regions remarkably affect the stiffness of the structural system.
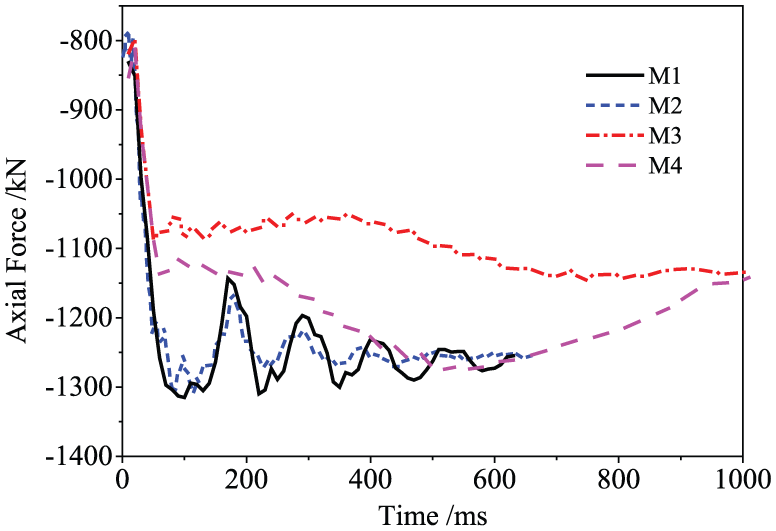
Axial force time histories of column C2 under removal of column C1.

Axial force–displacement curves at B2 end of beam B2-C2 under removal of column C2.

Moment–displacement curves at end B2 of beam B2-C2 under removal of column C2.
Figure 22 gives the damage contour of slabs from M2 simulation. As can be observed, the damage is slight. However, the current crack opening strain distribution indicates the possible pattern of yield lines with increased loads. The damage contour of the slabs calculated by M3 and M4 models are compared in Figure 23. It can be seen that the slabs in M4 simulation are more severely damaged due to the ignorance of both slab offset and stiffness of joint regions. Similar observations can be made for scenario with column B2 removed and are not detailed in the article. Therefore, the numerical model without properly considering the slab position and stiffness of joint regions largely underestimates the structural resistance to progressive collapse.
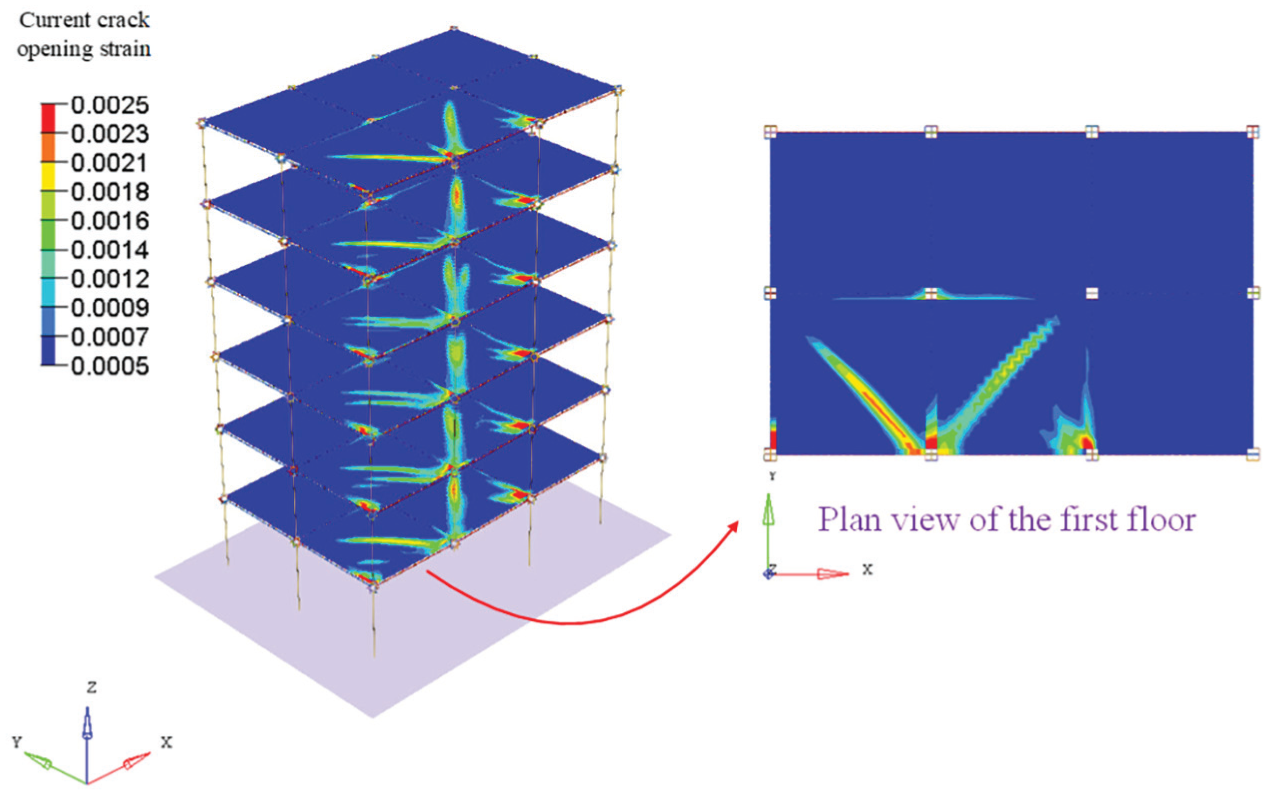
The crack distribution of slabs calculated by M2.
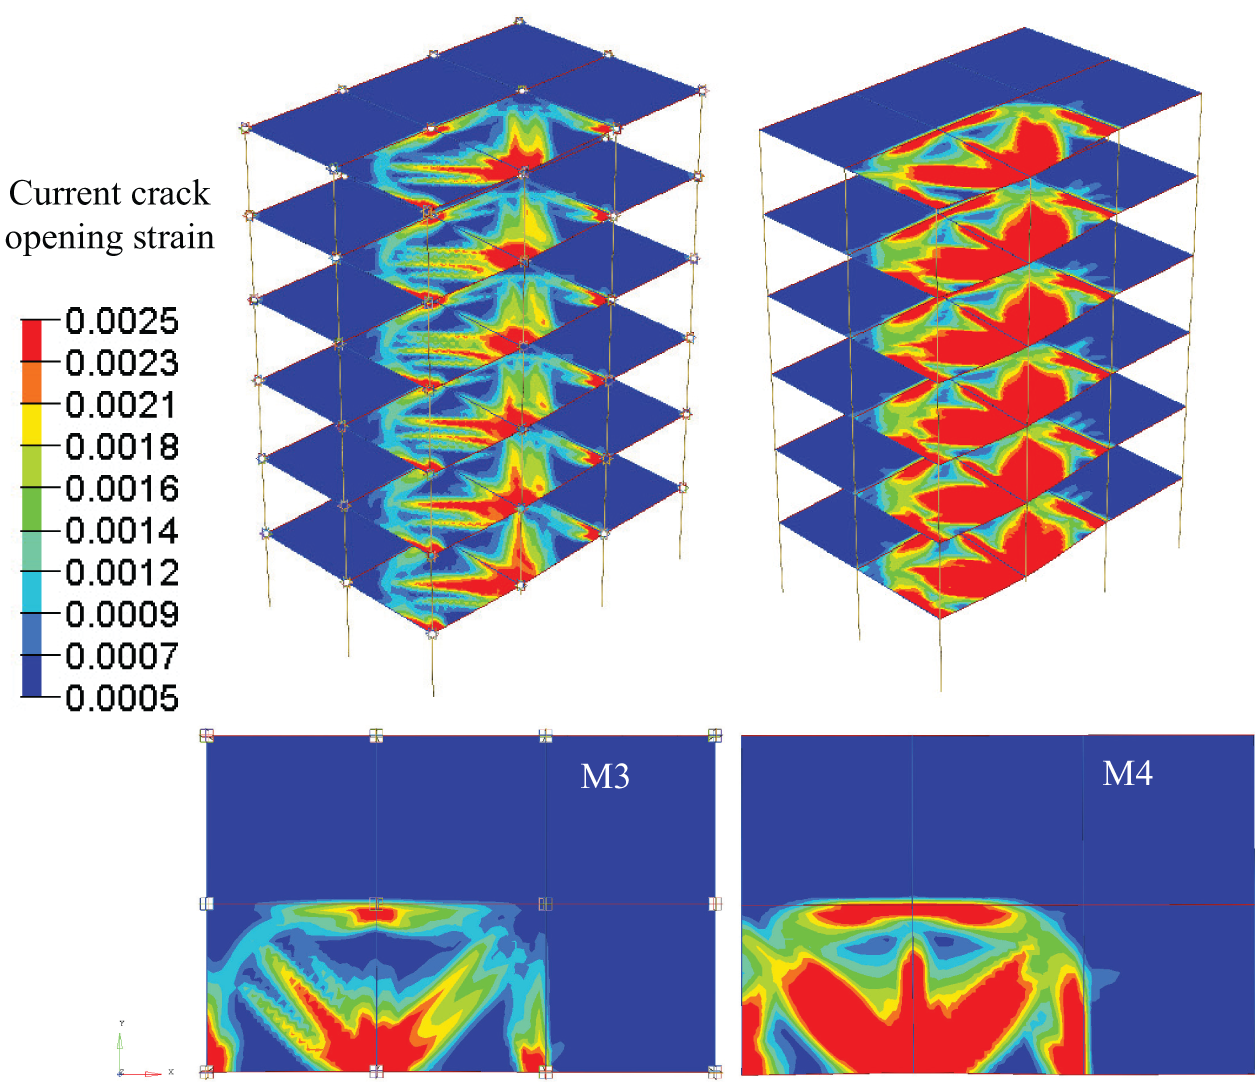
The comparison of crack distribution of slabs between M3 and M4.
Simultaneous removal of columns C1 and C2
In this scenario, two columns, namely C1 and C2, are removed simultaneously. The frame structure collapses in all the simulations with considered numerical models. The relation between axial force in beam C2-C3 and vertical displacement at point C3 is shown in Figure 24, in which the results calculated by M1 model are omitted as the section force is not equivalent to the axial force in the beam. The maximum axial force calculated by M2 model is 730 kN while those by M3 and M4 models are 475 and 450 kN, respectively. This is because M2 model takes account of both the slab offset and stiffness of joint regions more precisely. When the vertical displacement reaches to about 400 mm, the catenary action initiates. As can be seen in Figure 24, the maximum catenary force calculated by M2, M3, and M4 are almost identical with a value lower than 200 kN. The most possible reason is that the main influencing factor affecting catenary action is the longitudinal rebars in the beam.

Comparison of axial force–displacement relationship at beam ends.
The progressive collapse process calculated by all the four numerical models is shown in Figures 25 and 26. The collapse process of M1 and M2 models is almost identical. The longitudinal rebar at beam ends in the joint regions fractured first, which immensely weakens the resistance of the beam-slab floor system. Then, the cracking in the end region of cantilever slab increases with vertical displacement of the structure. In the end, the slabs are detached from the remaining structure, inducing severe progressive collapse failure of the RC frame structure. The collapse process of M3 simulation has a slight difference in comparison with M1 and M2 model. Using M4 model yields the most severe simulation results among all simulations. Unlike other simulations that the collapse is limited within two spans, for M4 simulation, at t = 2.0 s, the collapse is extended to the end span of the structure, which finally induces collapse of the whole structure. The remaining structure from M2 model is found subjected to slight damage as shown in Figure 27.
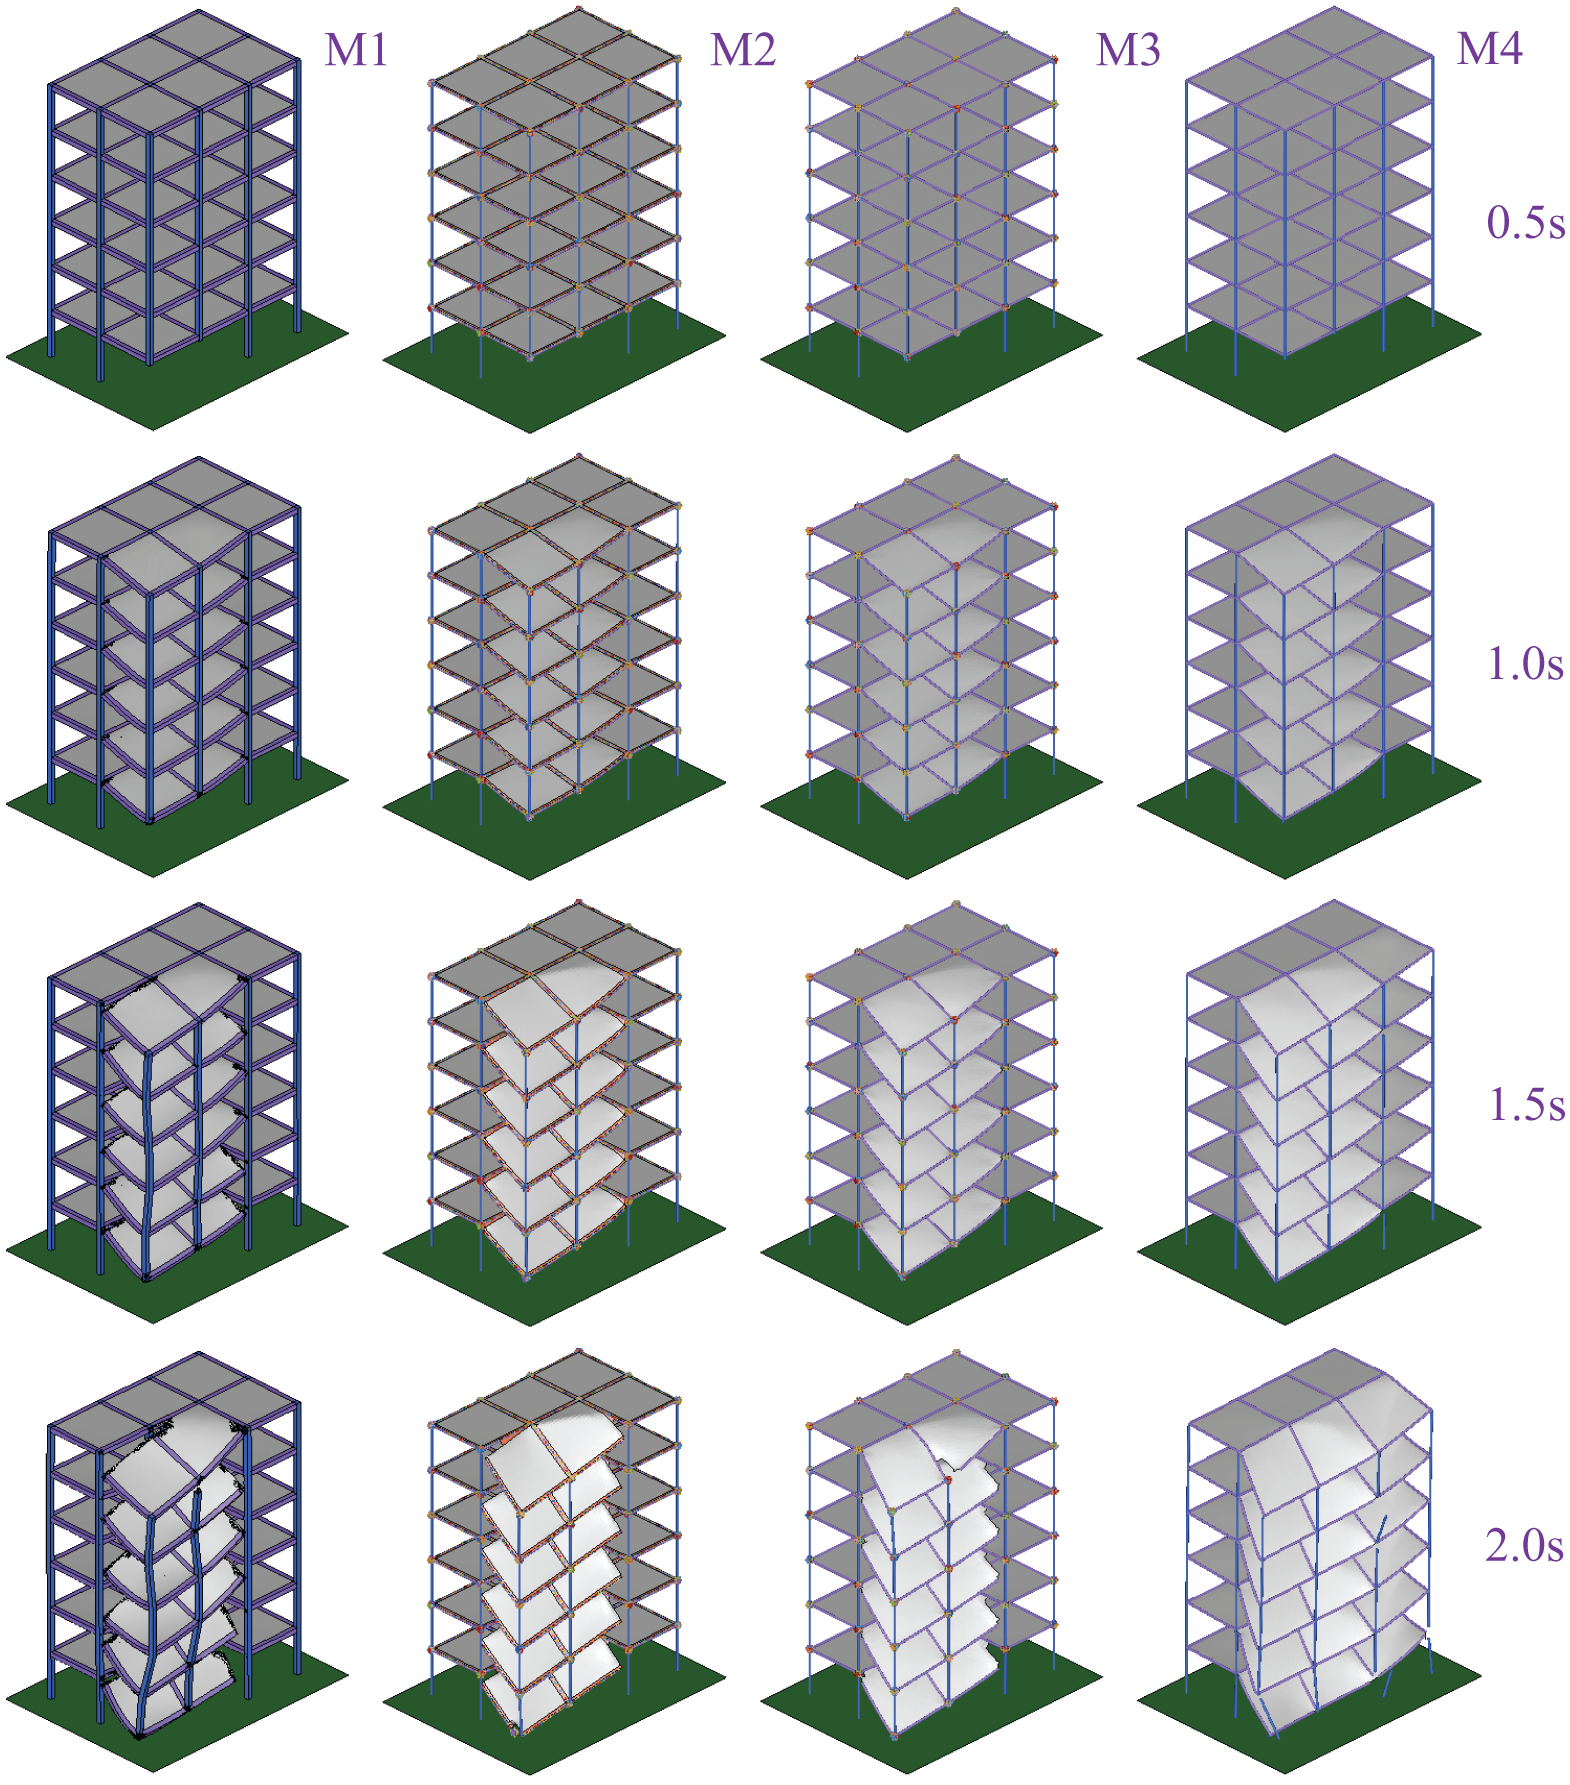
Collapse process of the 6-story RC structure under two columns removal scenario (from 0.5 to 2.0 s).
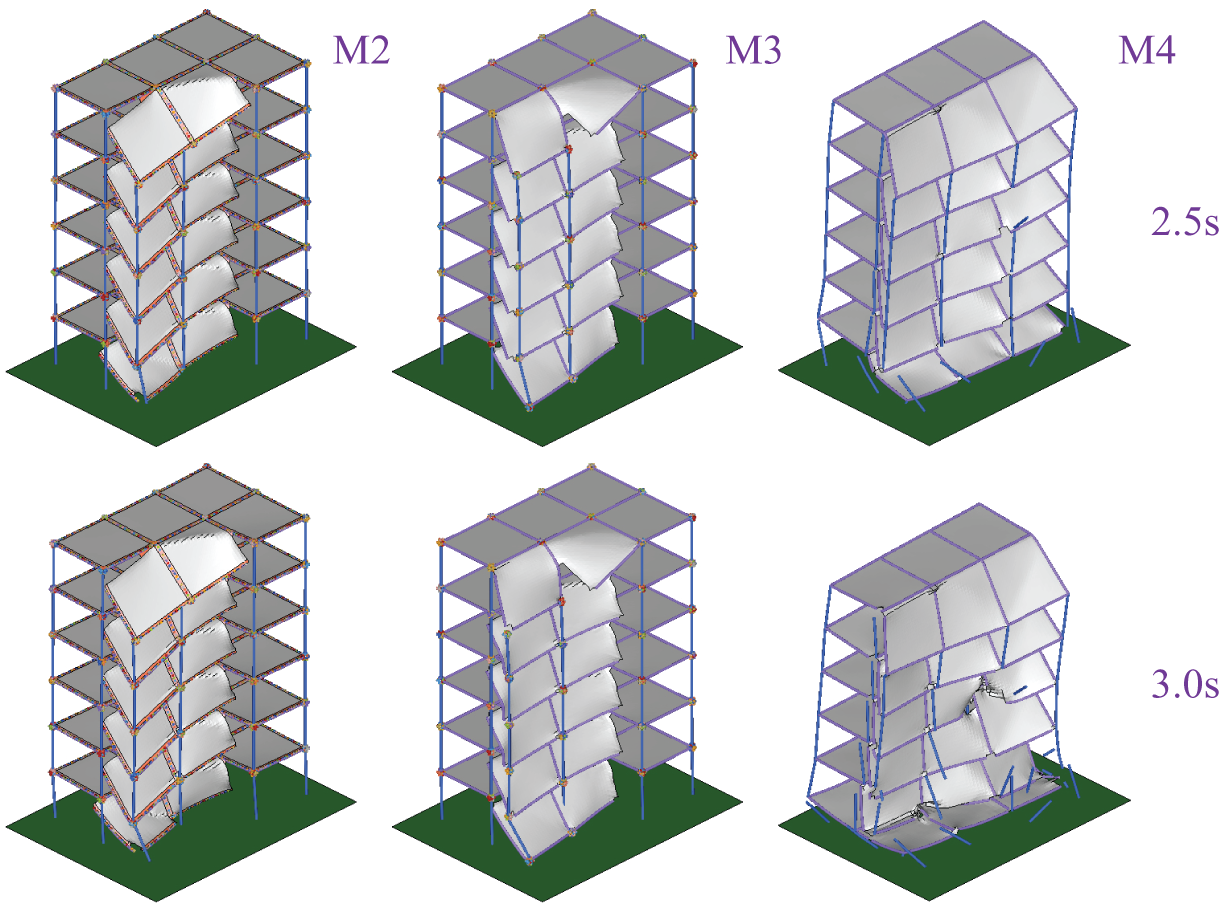
Collapse process of the 6-story RC structure under two columns removal scenario (from 2.5 to 3.0 s).
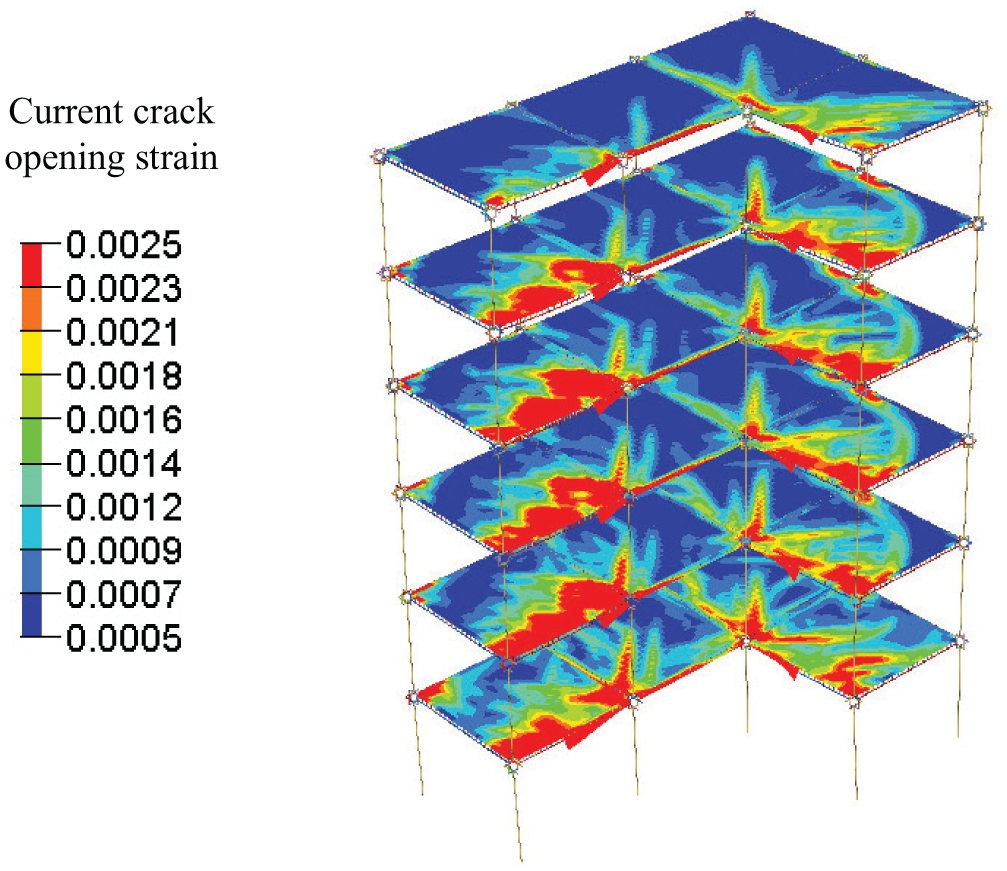
Crack distribution of the remaining structure of M2.
Dynamic response under blast loading
One of the very important objectives of this research is to develop a numerical model which can be used to analyze the dynamic response of RC frame structures under blast loading with both computational accuracy and efficiency. The six-story RC frame structure in Figure 16 is adopted in this section. Meanwhile, in order to demonstrate the importance of introducing the enhanced fiber beam element in the proposed numerical model, model M5 with traditional fiber beam element is added in this section. Instead of directly removing column(s) of interest, a blast load with peak overpressure of 20 MPa and duration of 1 ms is applied to column C2 as shown in Figure 28 where points A and B are at the mid-height and top of the column, respectively.

Scheme of the FE models under blast loading.
Figure 29 compares the transverse displacement time histories of point A. As seen, the maximum displacements calculated by M1, M2, and M3 models are all about 74 mm, and the residual displacements from M1 and M2 simulations match very well while that from M3 simulation is slightly larger. The maximum displacement using M4 model is the largest with a value of about 90 mm, and its residual displacement is almost the same as that of M3. It is worth noting that both the maximum and residual displacements of M5 are much smaller than those from simulations with the other four models. This is mainly because the traditional fiber beam element fails to capture the shear deformation of the column under blast loading, leading to overestimation of the compressive arch action and underestimation of the transverse displacement demand. In the whole structure, the top end of column C2 is constrained by the beam and slab, which is very different from an isolated column. Figure 30 gives the vertical displacement histories of the top end of column C2 at point B. The residual vertical displacements calculated by M1, M2, and M3 models are all about −7.5 mm (downward) and that by M4 model is about −11 mm (downward) whereas that by M5 model is about +3.1 mm (upward). When the load bearing column of a structure is destroyed under blast loading, the internal force will seek for alternate load path for redistribution. The axial force time histories of column C2 are shown in Figure 31, it is obvious that the axial forces calculated by M1, M2, and M3 models are almost the same and that by M4 model reduces the most whereas that by M5 model increased to a value even larger than the initial axial load. As a result, the introduction of enhanced fiber beam element into the proposed numerical model is critical for accurately calculating the dynamic response of RC frame structures subjected to blast loads.
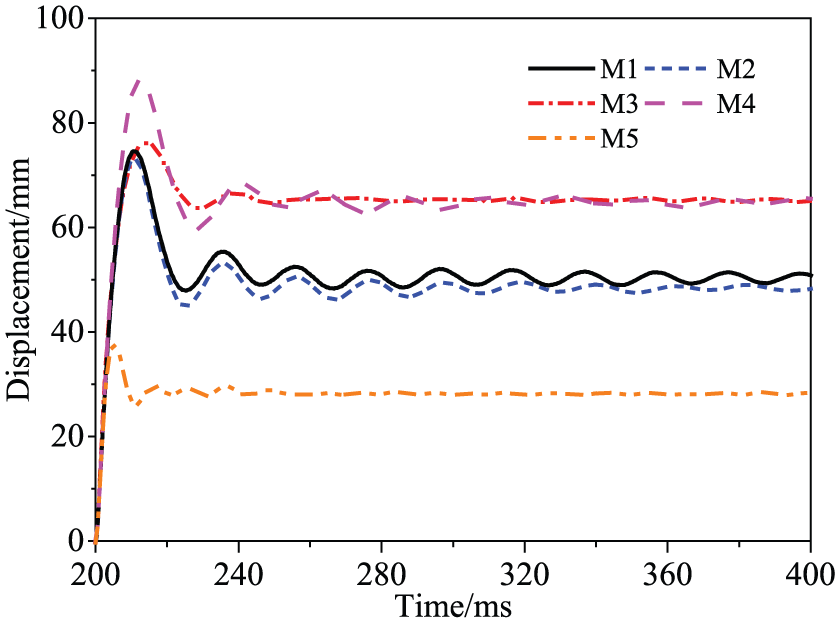
Transverse displacement time history of point A.
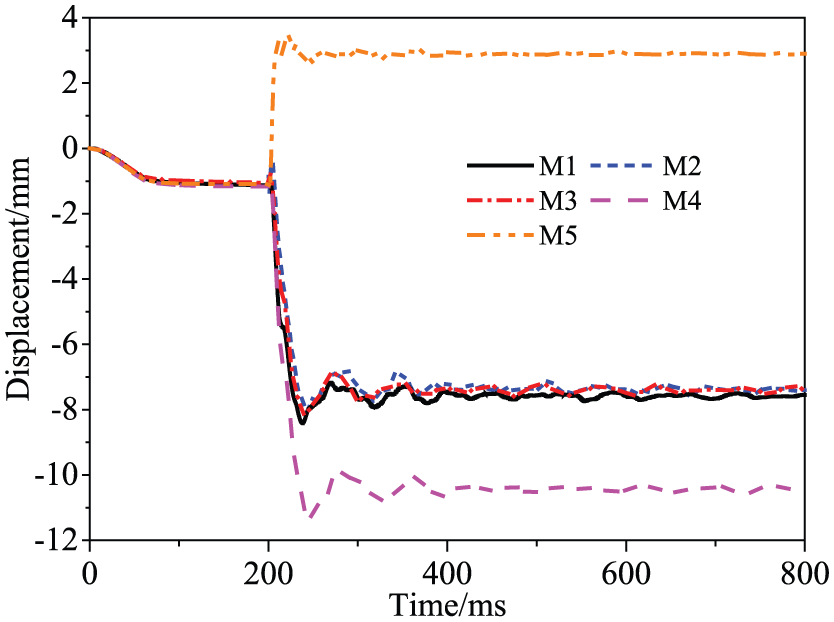
Vertical displacement time history of point B.
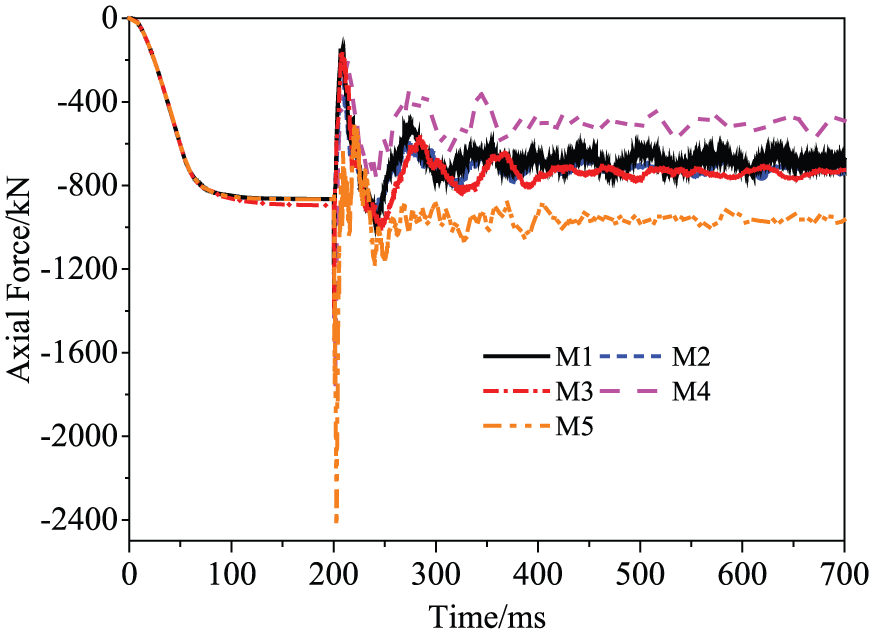
Axial load time history of column C2.
Time consumption
The reliability of the proposed numerical model has been demonstrated thoroughly in the previous numerical examples. All the numerical simulations are carried out using a desktop computer with 3.4 GHz CPU frequency and 8 GB memory. Table 10 summarizes the elapsed computation time. As can be seen, the total elapsed time using M1 and M2 models for the collapse case in section “Simultaneous removal of columns C1 and C2” are 297 and 6 h, respectively. The proposed numerical model is able to significantly improve the computational efficiency while guaranteeing the accuracy, making it a very promising model for progressive collapse analysis of large-scale RC structures.
Comparison of the computational time.

FE: finite element.
Discussion
Based on the improved efficiency and proven accuracy of M2 model, in this section, parametric study is conducted to investigate effective measures to enhance the structural resistance to progressive collapse. The scenario with both columns C1 and C2 removal is considered. As outlined in Table 11, the considered measures include variations in longitudinal rebar of columns, longitudinal rebar of beams, steel mesh reinforcement ratio in slabs, and positioning of steel meshes in slabs.
Descriptions of the structural models.

FE: finite element.
The calculated relation between axial force in beam C2-C3 and vertical displacement at point C3 by M2, M2_C1, and M2_C1_B1 models are compared in Figure 32. As shown, the resistance in compressive arch mechanism stage cannot be increased by increasing the longitudinal reinforcement ratio in either beams or columns. Nevertheless, the maximum axial tensile force in catenary stage increases from 138 to 158 kN when the longitudinal reinforcement ratio in columns doubles. This is mainly attributed to the added constraint to the beam ends. In comparison with M2 model, further increasing the longitudinal reinforcement ratio (M2_C1_B1) in beams leads to an increase of the maximum axial tensile force. This is consistent with the fact that the main factor influencing the catenary resistance is the longitudinal reinforcements in beams. Therefore, the resistance in catenary stage can be more effectively increased by increasing the longitudinal reinforcement ratio in beams.
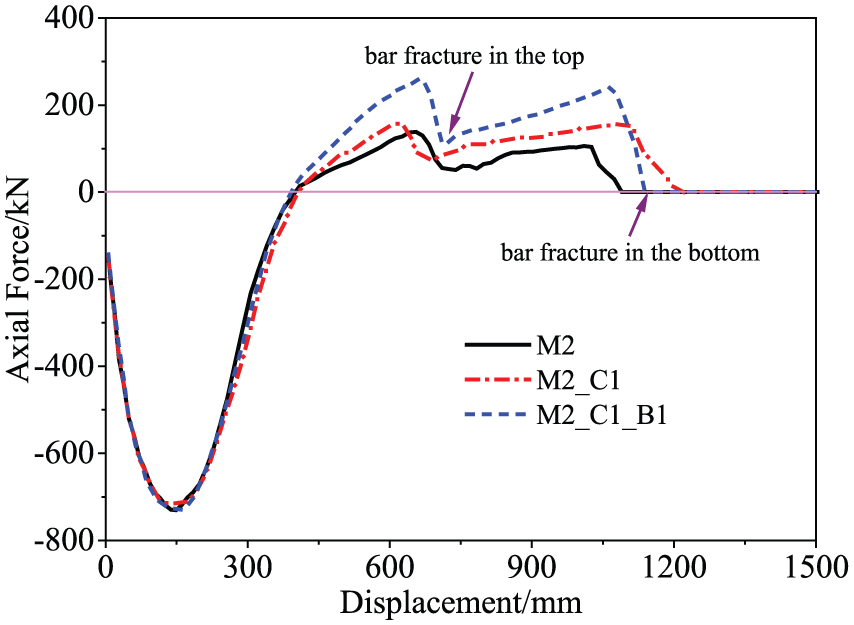
Comparison of axial force–displacement curves at end C3 of beam C2-C3 by model M2, M2_C1 and M2_C1_B1.
The influences of steel mesh reinforcement ratio and positioning in slabs are studied based on the comparison of simulations using M2_slab1, M2_slab2, and M2_slab3 models with that using the proposed numerical model M2. As is shown in Figure 33 that compares the relation between axial force in beam C2-C3 and vertical displacement at Point C3, in the compressive arch mechanism stage, the maximum axial force increases from 730 to 797 kN with a 50% increase of the slab steel mesh reinforcement ratio. However, the maximum axial force increases to 853 kN when placing the steel meshes in both top and bottom layers of the slab without the change of steel mesh reinforcement ratio. If the steel mesh reinforcement is only placed at the bottom of the slab, the maximum axial force reduces from 730 to 679 kN when the steel mesh reinforcement ratio is the same as M2. This indicates that in the compressive arch stage, properly placing steel mesh reinforcement in the slabs is a more dominant measure to enhance the structural resistance to progressive collapse. In the catenary mechanism stage, the maximum axial tensile force does not diverge a lot when different models are considered in the simulations. This is possibly due to the fact that the removal of corner column C1 limits the development of catenary action.

Comparison of axial force–displacement curves at end C3 of beam C2-C3 by model M2, M2_Slab1,M2_Slab2 and M2_Slab3.
The collapse states calculated by different models at t = 2.5 s are compared in Figure 34. As can be observed, the damage predicted by M2_Slab2 model is the slightest, while that by M2_Slab3 model is the most severe. This is mainly because that both the top and bottom of the slabs in M2_Slab2 model are reinforced with steel meshes, such that the top steel mesh can still provide resistance when concrete cracks. The collapse resistance of M2_Slab3 model is the smallest because the steel mesh is only put at the bottom of the slab, which makes the damage of concrete slab more severe. What’s more, there is no steel mesh providing tensile force, which leads to the further development of slab damage, reducing both the compressive arch action and catenary action.
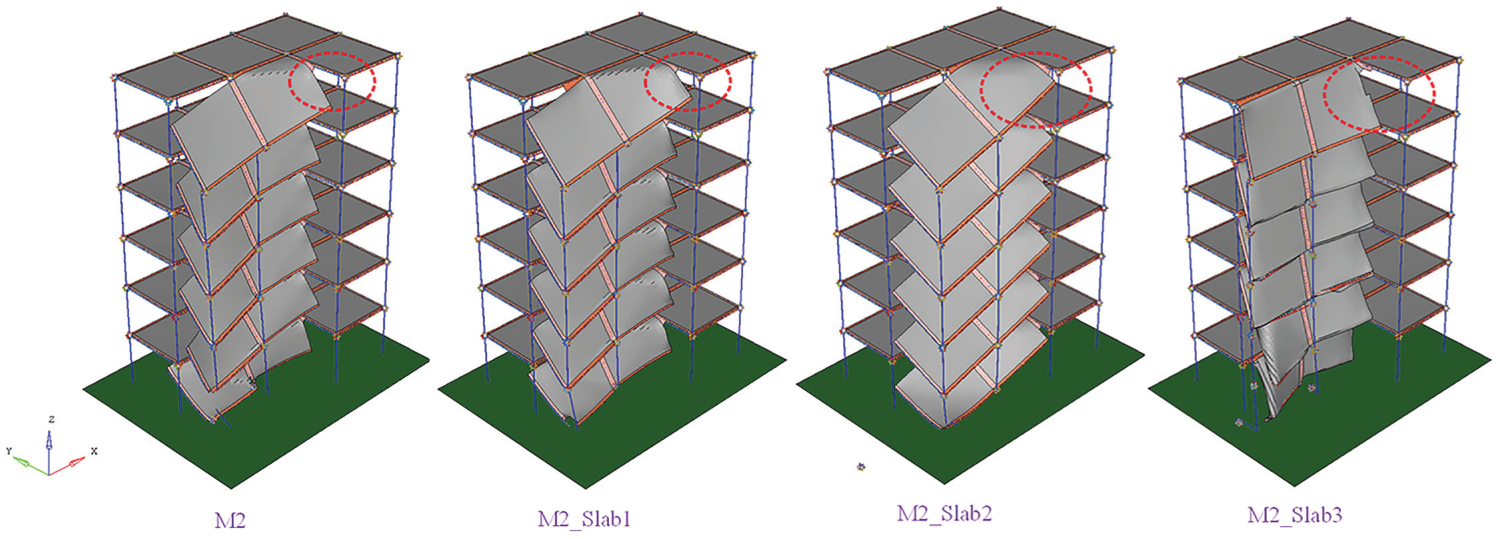
Structural collapse state at t = 2.5 s.
Conclusion
In this study, a computationally efficient numerical model is developed for progressive collapse analysis of RC structures under both column removal and direct blast loading scenarios. Enhanced fiber beam element, macrojoint model, and floor system model are three vital parts of the proposed numerical model and are validated by corresponding experimental results in the literature. A six-story RC frame structure is simulated with different FE models, in which the detailed high-fidelity FE model is used as the reference model. In addition, effect of some parameters on the collapse resistance is discussed based on calculated results with the proposed numerical model. Some main conclusions are as follows:
The enhanced fiber beam element plays a crucial role for the proposed numerical model when analyzing dynamic response of RC structures under direct blast loading.
The resistance mechanisms of floor system can only be accurately captured by the proposed floor system model with both layered shell element and slab offset taken into account.
The computational precision of the proposed numerical model is almost the same as that of detailed high-fidelity FE model, while the computation time is only about 1/50 of the detailed model under structural collapse scenario.
Increasing longitudinal reinforcement ratio in beams and columns can increase the catenary action capacity, but hardly increases the compressive arch action capacity.
The steel mesh reinforcement at top layer of slabs plays a significant role in resisting progressive collapse of RC structures, which should be considered in design to resist progressive collapse.
Footnotes
Appendix 1
The functionalities in LS-DYNA are summarized and described below:
Declaration of conflicting interests
The author(s) declared no potential conflicts of interest with respect to the research, authorship, and/or publication of this article.
Funding
The author(s) disclosed receipt of the following financial support for the research, authorship, and/or publication of this article: The authors gratefully acknowledge the financial support of the National Key Research and Development Program of China under grant nos 2016YFC0701100 and 2016YFC0701105 and the National Natural Science Foundation of China under grant nos 51238007, 51522808, 51678405, 51808129, and 51878445 for carrying out this research.
