



Abstract
The current design procedure for blast resistant glass panes is based on dynamic analysis of idealized SDOF models under simplified triangular impulse loads or code-specified pressure-duration (pressure-impulse) curves. In both cases, the main objective is to prevent failure of the pane with no explicit consideration of other limit states to reach higher performance levels. In this study, multi-performance pressure-duration curves of Laminated Glass (LG) panes are estimated by accurate pre-validated Finite Element (FE) models. Multiple performance criteria including initial cracking, PVB-50% (maximum polyvinyl butyral, i.e. PVB, interlayer strain of 50%), PVB-100% (maximum PVB interlayer strain of 100%), and ultimate failure of the pane are considered and pressure-duration curves are estimated for each of these performance levels. Ultimate failure of the pane can be either due to rupture of the PVB interlayer or pull-out of the pane from its frame. Multi-performance pressure-duration curves are obtained for 18 different LG panes with three different layups, two widths, and three aspect ratios. According to the obtained results, the thickness of the glass layers has more pronounced contribution to the blast resistance of the panes in all limit states compared with the PVB thickness. Moreover, the ultimate failure mode of the LG panes with thicker PVB interlayer is observed to be typically pull-out of the pane rather than PVB rupture. Therefore, these panes require frames with deeper bites to develop their full blast resistance. Finally, the blast performance of the LG panes are compared with that of Thermally Tempered Glass (TTG) panes to shed more light on the superior blast resistance of LG panes.
Keywords
Introduction
During the last three decades, protection of structural and non-structural elements from accidental or man-made threats has become a growing concern among engineers, researchers, building owners, and government officials. The main threat in a matter of milliseconds after a blast event, is commonly associated with fragments of the fractured glass panes and glazing systems. For example, During Oklahoma City bombing in 1995, broken glass has been reported within a radius of over 10 blocks from the blast center (FEMA 277, 1996) and 362 out of 426 hospitalized people had been injured due to falling or flying glass fragments (ODCEM, 1995). Historical reports also indicated that, 85% of blast-related injuries are due to projectile glass shards (Dusenburry, 2010; Loof et al., 2010). As the first line of defense, glazing systems and glass panes have a crucial role in providing adequate blast resistance in buildings and cannot be treated as secondary non-structural elements from design consideration. Significant efforts have been made to investigate the performance of different glass panes under blast loading. These include field blast tests (e.g. Bogosian and Avanessian, 2002; Hooper, 2011; Weissman et al., 1978; Zhang et al., 2014, 2015a and 2015b), shock tube tests (Kumar and Shukla, 2011; Meyers et al., 1994; Wedding, 2010), Finite Element (FE) simulations (e.g. Amadio and Bedon, 2012; Ataei and Anderson, 2014; Eslami et al., 2020; Hidallana-Gamage et al., 2015), and simplified analytical studies based on Single Degree of Freedom (SDOF) models (Meyers, 1984; Pritchard, 1981; Samieian et al., 2019). A comprehensive review of previous studies on the response of different glass panes under blasts is provided by Zhang and Hao (2016). Although Annealed Glass (AG) panes are economical and widely used in the construction industry, it is known that they break into dangerous jagged shards when fractured. Moreover, AG panes have very low dynamic flexural strength in the range of 30 MPa (Meyers, 1984) to 80 MPa (British code EN 572-1 2004). Thermally Tempered Glass (TTG) panes, on the other hand, have higher dynamic flexural strength in the range of 110 MPa (Department of Defense [DoD], 2008) to 200 MPa (UK Glazing Hazard Guide, 1997) and they break into fine cubes which result in reduced laceration risk. However, there are some evidence that even TTG panes may break into large jagged fragments under blast loadings (Beauchamp and Matalucci, 1998; Zhang et al., 2015). Moreover, similar to AG panes, TTG panes break in an extremely brittle manner with no residual strength.
According to the current state-of-the-practice, Laminated Glass (LG) panes are known to have superior blast performance compared with other commercial glasses, such as AG and TTG panes. In their most widely used configuration, LG panes are made from two glass panes bonded together with a polymer interlayer. The interlayer is commonly made from a ductile polymer, such as polyvinyl butyral (PVB), which significantly improves the post-cracking behavior of the LG pane. Unlike monolithic AG and TTG panes, LG panes have significant post-cracking residual strength which is provided by the membrane action of its polymer interlayer. Moreover, the interlayer holds the broken glass shards together and subsequently reduces laceration hazard. This reliable performance of the LG panes is not limited to highly controlled laboratory conditions, but has been proven during earlier bombing attacks in various buildings as shown in Figure 1.

Performance of LG panes during earlier blast events (Left: Norville and Conrath, 2006, Middle: Hooper, 2011, Right: NMA [https://www.nma.gov.au/]).
Blast resistant capacity of LG panes has been investigated by different researchers. Kranzer et al. (2005) experimentally investigated blast resistance of 7.5 mm (3 mm AG + 1.52 mm PVB + 3 mm AG) LG panes. Using full-scale open-air blast tests, Hooper (2011) investigated the blast response of LG panes with different sizes and layups. In addition to the carried out tests, Hooper (2011) used FE simulations to further investigate the blast response of one of the tested LG panes and estimated its iso-damage pressure-impulse (P-I) curves for different damage levels. However, the obtained P-I curves by Hooper (2011) were limited to a specific LG pane with specific dimensions and thickness. Iso-damage P-I curves for an LG pane with a specific size and thickness were also provided by Smith (2001). Using pendulum impact and field blast tests, Zhang et al. (2015) evaluated the resistance of LG panes with different thicknesses and compared P-I curves from experimental results with those estimated using SDOF models. They concluded that the applicability of SDOF models is sometimes questionable and tends to underestimate the capacity of the LG panes. Similar conclusion was recently made by Eslami et al. (2020) for TTG panes. SDOF models rely upon an equivalent mass, equivalent load, and a nonlinear resistance function. These attributes are derived based on a predefined shape function which is similar to the deformed shape of the glass pane under a uniform static out-of-plane pressure. Blast tests (Hooper, 2011; Zhang et al., 2015) as well as FE simulations (Eslami et al., 2020; Hidallana-Gamage et al., 2015) indicated that the deformed shape of the glass panes vary with time and characteristics of the blast. Accordingly, P-I curves developed using simplified SDOF models may underestimate the true capacity of the LG panes. Nevertheless, blast resistant design of glass panes based on SDOF models (ASTM, 2010; DoD, 2018; Morison, 2010; Smith, 2001; UK Glazing Hazard Guide, 1997) are still the dominant practice among professional blast engineers.
Superior blast performance of a typical LG pane is provided by the membrane action of its ductile interlayer PVB. Using low-speed and high-speed tensile tests, the behavior of PVB material is investigated by Iwasaki et al. (2007), Hooper et al. (2012), and Zhang et al. (2015). The obtained test results indicated that PVB has a bilinear viscoelastic behavior under high strain loads which is close to the bilinear elasto-plastic behavior. However, this behavior is not suitable for PVB under quasi-static loads. As the strain rate increases, rupture strength of PVB increases but its corresponding rupture strain decreases (Zhang et al., 2015). Two of the most widely used standards for blast resistant design of LG panes are UFC 4-010-01 (DoD, 2018) and ASTM F2248 (ASTM, 2010). As depicted in Figure 2, ASTM F2248 specifies an equivalent quasi-static 3-s duration loading for different TNT charge masses and standoff distances. From the obtained equivalent quasi-static pressure, the required thickness of the LG pane can be estimated from the charts provided in ASTM E1300 (ASTM, 2009), as illustrated in Figure 2. Further descriptions about the design procedure based on ASTM F2248 is provided by Norville and Conrath (2006). UFC 4-010-01 allows three design procedures based on dynamic analysis (FE or SDOF models), testing, and the procedure specified in ASTM F2248. UFC also recommends that the LG panes should at least consist of two 3 mm glass panes with a 0.75 mm interlayer PVB.

Design procedure of LG panes under blast per ASTM F2248 (Note that ASTM E 1300 is based on probability of breakage Pb of 0.008).
Unloading-reloading behavior of PVB is not fully understood yet. However, recent large-strain high-speed cyclic tests on PVB specimens indicated that unloading modulus of PVB is more or less similar to its loading modulus (Elsziere, 2016) indicating that the elaso-plastic behavior is also applicable to simulate the behavior of the PVB layer during rebounding. Although detrimental effect of negative phase of the blast is well recognized (Rigby et al., 2014; Teich and Gebbeken, 2010; Wei and Dharani, 2005), the majority of the earlier numerical studies simply neglected the negative phase of the blast and/or rebounding of the glass panes (DoD, 2008; Hooper, 2011; Meyers, 1984; Zhang et al., 2016).
This study is intended to estimate the blast capacity of different LG panes with different dimensions and thicknesses. Blast capacity are presented in terms of pressure-duration curves, similar to those provided by UFC 3-340-02 (DoD, 2008) for TTG panes. Three-dimensional (3D) FE models are developed and utilized in this study as opposed to relying on simplified SDOF models. In addition, both positive and negative phases of the blast are considered so that the entire loading behavior is characterized. Performance-Based Design (PBD) is now a well-documented procedure in earthquake engineering (Gunay and Mosalam, 2013; Moehle and Deierlein, 2004), however, it is not mature enough in blast engineering practice (Whittaker et al., 2003). Although different blast protection (performance) levels have been recognized by UFC 4-010-01 (DoD, 2018) for glass panes, they are limited to qualitative descriptions which cannot be easily used for practical PBDs. GSA (2003) has also specified different safety levels for experimentally investigated glass panes which obviously is not a straightforward procedure for professional engineers. To address this challenge, pressure-duration curves in this study are obtained for different limit states corresponding to different performance criteria suitable for developing a PBD methodology.
FE modeling
Blast behavior of LG panes is simulated using 3D FE models with solid elements in ABAQUS software (Dassault Systems Simulia, 2015) as shown in Figure 3. All simulation are carried out using ABAQUS/Explicit solver with no mass scaling. According to equation (1), blast overpressure time history is estimated by the modified Friedlander equation shown below (Eslami et al., 2020). This overpressure is applied to the model as an out-of-plane dynamic pressure. Parameters


FE modeling of the LG panes, including blast loading and considered failure modes.
The decay parameter,

where
British code EN 572-1 (2004) recommends dynamic fracture strength of 80 MPa for AG which is similar to that suggested by Cormie et al. (2009), Hooper (2011), and Amadio and Bedon (2012). However, smaller fracture strengths in the range of 60 to 65 MPa have also been used (Hidallana-Gamage et al., 2015). During model validation of this study, it is found that fracture strength of 60 MPa is more suitable according to the adopted FE modeling technique. Based on shock tube tests by Kumar and Shukla (2011), fracture strain of AG is about 0.1%. Post-crack behavior of the AG layer is simulated using the BRITTLE cracking model in ABAQUS assuming a fracture energy of 50 J/m2. This model is well suited for behaviors dominated by tensile cracking which is the case for glass panes under out-of-plane bending. When maximum tensile stress in any element reaches to the defined fracture strength (60 MPa in this study), the tensile strength of that element linearly drops to zero and the element will be removed from the model once the associated principal strain reaches to 0.1%. Other material properties of the AG layer are presented in Table 1.
Mechanical properties of the AG and PVB layers.

Earlier studies indicated that PVB, under high strain rates, has a bilinear elasto-plastic behavior with rate-dependent apparent yield and ultimate strengths (e.g. Larcher et al., 2012; Zhang et al., 2013). As a result, Johnson-Cook model is used to simulate the post-elastic behavior of the PVB interlayer. Although Johnson-Cook model was basically developed for metals, earlier experimental data have shown that this model is well suited to simulate behavior of PVB under high speed loads (Hooper, 2011; Zhang et al., 2015). Mechanical properties as well as Johnson-Cook parameters of the PVB layer are presented in Table 1. These values are similar to those used and calibrated by Hooper (2011). From high-speed tensile tests, Zhang et al. (2015) suggested that the rupture strain of PVB decreases by increasing the applied strain rate and varies from 280% (at strain rate of 0.008 s−1) to 140% (at strain rate of 1360 s−1). Similar results were also reported by Hooper (2011) and Iwasaki et al. (2007). According to earlier studies reviewed by Zhang et al. (2015), a rupture strain of about 200% is reasonable according to the range of blast-induced strain rates. In the numerical models, PVB and AG layers are merged and strain compatibility is considered between the PVB and AG layers. In other words, the PVB interlayer and the AG layers are fully bonded together. This simplified assumption is considered as earlier experimental and numerical studies indicated that debonding failure is less likely to occur (Hooper, 2011; Zhang and Hao, 2016; Zhang et al., 2013; Eslami et al., 2018, 2009; Farhangi and Karakouzian, 2020).
Although single-sided joints are more aesthetically appealing, provisions in current standards (DoD, 2018) indicate that structural silicon sealants should be applied to both sides of blast-resistant glass panels. Moreover, experimental results indicate that full blast capacity of LG panes with single-sided silicon joints may not be achieved due to the joint failure (Hooper, 2011). There are significant uncertainties in mechanical properties and dimensions of the silicone sealants as they can be manufactured by different chemical formulations which affect the mechanical properties of the product. According to the parametric study carried out by Zhang et al. (2013), the flexural rigidity of the boundary condition has no significant effect on blast capacity of the LG panes and in general a boundary condition with restrained rotational Degrees of Freedom (DOFs) impose higher demands on the pane and would probably be on the safe side. However, a fixed boundary condition cannot simulate the pull-out failure mode of the LG panes which has been observed during earlier blast tests (Cormie et al., 2009; Zhang et al., 2015). To handle these challenges, the LG panes in this study are fully clamped by rigid steel elements with a bite of 30 mm around all sides of the pane with no additional silicon sealant. Contact normal and tangential interactions are defined between the clamping elements and the LG pane. As a result, in addition to the PVB rupture, pull-out failure mode is considered in the carried-out simulations (Figure 3).
Model validation
The reliability of the considered FE modeling technique is verified by comparing the FE results with those obtained from earlier experimental studies by Zhang et al. (2015) and Hooper (2011). Details of the selected test specimens and obtained results are summarized in Table 2. Figures 4 and 5 compare the obtained results from the FE simulations with the measured response from the tests. Zhang et al. (2015) reported overpressure time histories of their tests. After digitizing these overpressure time histories, they are applied to the FE models. However, in the case of Hooper’s specimens, there were no reported overpressure time history for the considered specimens. As a result, the required overpressure time histories are calculated from the modified Friedlander’s equation. It can be seen that FE results are in good agreement with experimental results in terms of maximum deflection of the pane, failure mode, and cracking patterns. Material properties used in the model validations are similar to those presented in the previous section.
Considered specimens for the 3D FE model validation and obtained results.


Validation of the 3D FE models using (a) 600 mm × 600 mm LG pane under airbag pendulum impact test and (b) 1500 mm × 1200 mm LG pane under field blast test – experimental results by Zhang et al. (2015).

Validation of the 3D FE models using (a) two 1500 mm × 1200 mm LG panes and (b) a 1700 mm × 3300 mm LG pane under field blast tests – experimental results by Hooper (2011).
Numerical studies
A series of numerical simulations is carried out using the above developed numerical model for different configuration of glass panes for blast resistance. A total of 18 LG panes with three different layups, three aspect ratios, and two widths are considered, as presented in Table 3. Because of bi-symmetry of the problem, only one-quarter of each pane is modeled. As discussed earlier, blast overpressure time histories are estimated based on the modified Friedlander equation and applied to the panes along their out-of-plane direction. The adopted blast positive phase duration ranged from 2 to 100 ms. For each positive blast duration, the pane is subjected to a small blast overpressure. In the next step, the overpressure is increased and again subjected to the initial undamaged pane. This procedure is continued and the peak overpressure is progressively increased and the analysis is repeated to investigate the performance of the pane from its pre-cracking state to its ultimate failure, which could be either PVB rupture or pull-out of the pane. This procedure is shown in Figure 6 for one of the panes under two different positive phase durations. In this figure, the lines with star markers represent variation of maximum principal strain of the PVB layer with increasing the blast overpressure and the lines with circle markers represent the associated maximum displacement of the pane. From the obtained pressure-strain curves, the pressure-duration curves associated with different limit states can be estimated according to the algorithm illustrated in Figure 7.
Details of the considered LG panes.


Progressive blast analyses of the 600 × 600 LG pane with layup of 3/0.76/3 for positive durations of (a) 2 ms and (b) 20 ms.

Adopted algorithm to estimate the multi-performance pressure-duration curves for each LG pane.
Pressure-duration curves
In this section, pressure-duration curves are presented for four different blast performance criteria, namely, initial cracking, maximum PVB strain of 50% (PVB-50%) maximum PVB strain of 100% (PVB-100%) and ultimate failure which could be either PVB rupture or pull-out of the pane. Note that PVB-50%and PVB-100% are less severe limit state which occur before rupture of the PVB layer. Having peak overpressure,

Note that
In the presented pressure-duration curves, the circular markers are the results from the FE simulations and the solid lines represent the fitted curves which can be expressed as,

Parameters
Parameters of the pressure-duration fitted curves for performance criteria of initial cracking and PVB-50%.

Parameters of the pressure-duration fitted curves for performance criteria of PVB-100% and ultimate failure.

Initial cracking criterion
The first performance criterion in this study is initial cracking of the glass layer(s). Pressure-duration curves for this limit state are shown in Figure 8. Results indicate that, compared with the PVB thickness, the glass thickness has a greater contribution to enhance the cracking capacity of the LG panes. In other words, cracking strength of the LG panes are not so sensitive to the thickness of the interlayer PVB. As expected, the LG panes have smaller cracking capacity under longer duration blasts. Note that in the illustrated curves, the parameter b is the width (the shorter dimension) of the pane and the height (the larger dimension) of the pane is denoted by a. Therefore, the aspect ratio is defined by the ratio of the larger dimension to the shorter dimension of the pane.

Initial cracking pressure-duration curves for LG panes with aspect ratios of (a) a/b = 1, (b) a/b = 1.5, and (c) a/b = 2 (a = larger dimension of the pane).
PVB-50% criterion
The second performance criterion in this study is PVB-50% which would be achieved when the maximum principle strain at the interlayer PVB reaches 50% (recall that rupture strain of PVB is 200%) for the first time. Pressure-duration curves associated to this criterion are illustrated in Figure 9. According to the obtained results, the PVB-50% capacity of the LG panes can be increased by using either thicker glass layers or thicker PVB layer. However, the thickness of the glass layer still has greater contribution. Note that one of the LG panes (the pane with layup of 3/1.52/3, aspect ratio of 2 and width of 1.2 m) pulled out before attaining the PVB-50% during blasts with positive phase durations of 2 and 5 ms. As a result, PVB-50% is not available in these cases.

PVB-50% pressure-duration curves for LG panes with aspect ratios of (a) a/b = 1, (b) a/b = 1.5, and (c) a/b = 2 (
PVB-100% criterion
PVB-100% is the third criterion defined in this study which would be achieved when maximum principal strain of the PVB reaches 100% (recall that rupture strain of PVB is 200%) for the first time. Pressure-duration curves associated with this criterion are shown in Figure 10. Note that some of the LG panes, especially those with thicker PVB, pulled out before reaching the PVB-100%. As a result, the capacity curves of this limit state are not always available. The FE simulations indicated that larger panes with thinner total thickness and thicker PVB interlayer are more susceptible to experience pull-out failures. Moreover, the pull-out failure modes are more common in the case of blasts with larger peak pressure and shorter positive durations, that is, the left side of the pressure-duration curves.

PVB-100% pressure-duration curves for LG panes with aspect ratios of (a) a/b = 1, (b) a/b = 1.5, and (c) a/b = 2 (
Ultimate failure criterion
The final performance criterion is the ultimate failure of the pane which can be achieved either by PVB rupture or pull out of the pane. Pressure-duration curves of this criterion are illustrated in Figure 11. According to the obtained results, the panes with layup of 6/0.76/6 have greater capacity than those with layup of 3/1.52/3. This indicates that using thicker glass layer is an effective way to improve the blast resistance of the LG panes. The same conclusion has also been made earlier by Zhang et al. (2013). The failure modes of the panes are summarized in Table 6. It can be observed that the failure mode of the LG panes with thick PVB interlayer is governed by pull-out rather than PVB rupture. Moreover, the pull-out failure is mainly observed for the cases of blasts with shorter positive phase durations.

Ultimate failure pressure-duration curves for LG panes with aspect ratios of (a) a/b = 1, (b) a/b = 1.5 and (c) a/b = 2.
Ultimate failure modes of the LG panes (failure modes are obtained for blasts with 8 different positive phase durations from 2 to 100 ms).

Maximum deflection
Normalized maximum out-of-plane deflections of the LG panes, ∆, associated with different performance criteria are shown in Figure 12. The obtained results are in good agreement with the available experimental results presented in Table 2 and those reported by Morison (2013). As expected, smaller panes with thicker glass layers experienced smaller deflections due to their higher flexural rigidity. It is clear that the LG panes can sustain significant out-of-plane deflections before their ultimate failure regardless of the positive phase duration of the blast. The median deflection ratio, that is, the median of the ratios of the maximum deflection to the pane width, Δ/b, is also presented for each of the previously discussed four limit states.

Maximum deflection of the LG panes for different performance criteria.
TTG panes versus LG panes
In this section, the blast behavior of the LG panes is compared with that of the TTG panes in terms of pressure-duration curves and maximum deflections. Using the FE simulations and adopting the modified Friedlander equation, the pressure-duration curves of the TTG panes with different thicknesses and dimensions were estimated by Eslami et al. (2020). Figure 13 compares the ultimate blast resistance of the LG panes to that of the TTG panes for thicknesses of 8 to 16 mm. As expected, the LG panes generally have higher blast resistance compared to the TTG panes for larger thicknesses. From Figure 13, it is clear that the superior blast resistance of the LG panes is more pronounced in the case of blasts with shorter positive phase durations.
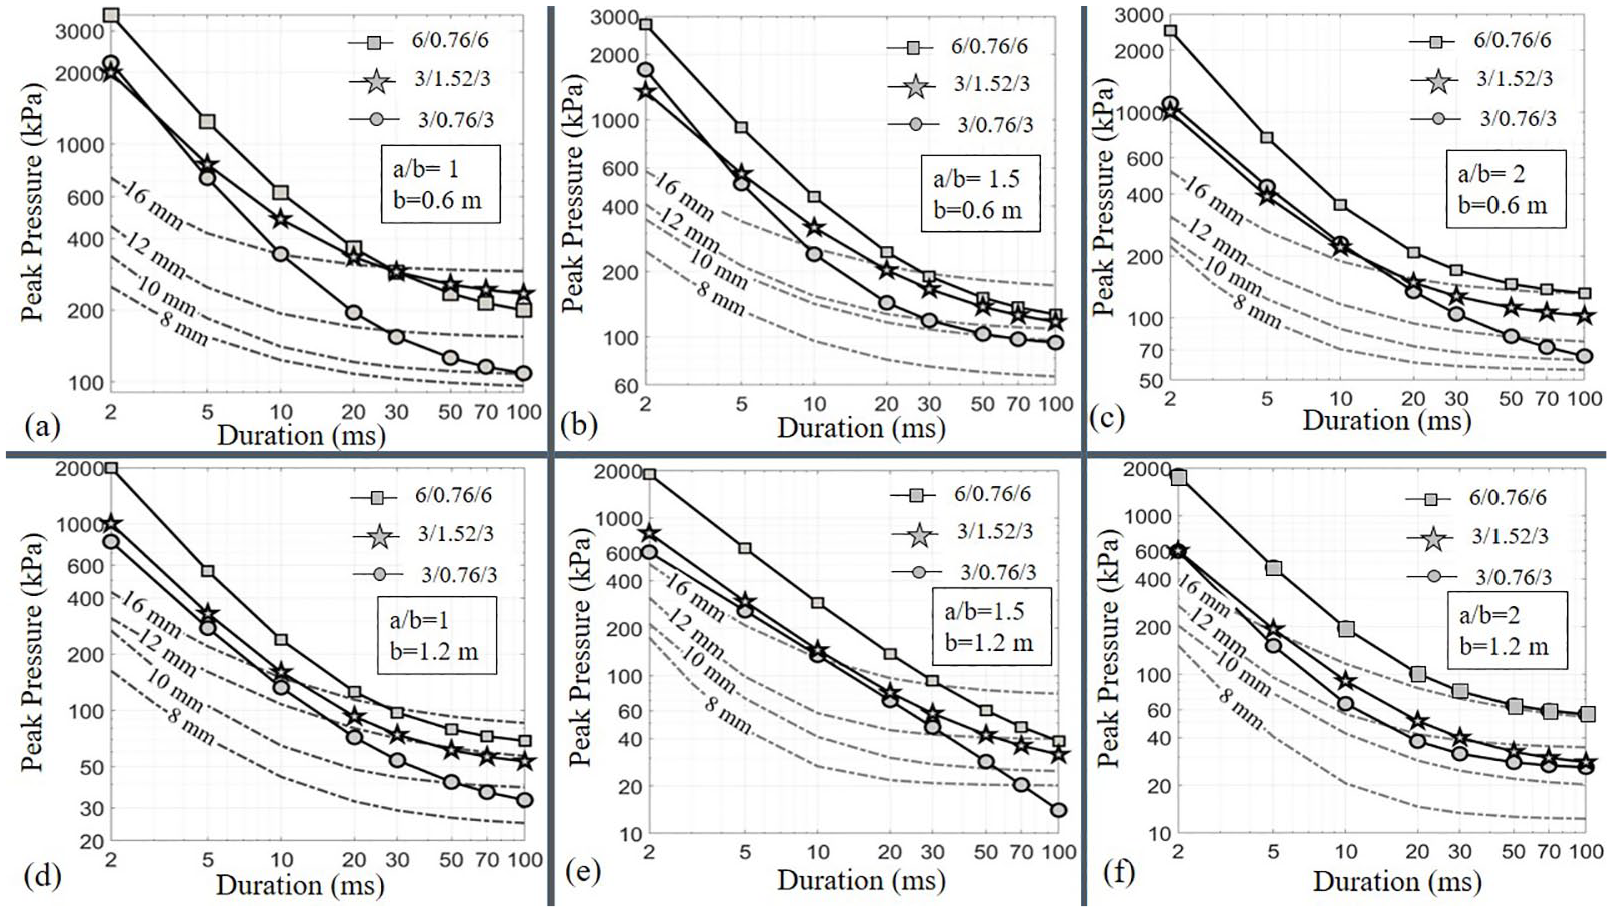
Pressure-duration curves of TTG panes with different thicknesses (dashed lines) and LG panes with different layups (solid lines) for performance criterion based on the ultimate failure.
The same comparison is also made in terms of the maximum deflection ratio of the panes. The obtained results are depicted in Figure 14 where the maximum deflection ratios of the LG panes are significantly higher than those estimated by Eslami et al. (2020) for the TTG panes. This indicates that the LG panes can sustain significant out-of-plane deflections before the ultimate failure which is in agreement with earlier experimental observations (Hooper, 2011; Morison, 2013; Zhang et al., 2015).

Maximum deflections of the TTG panes with different thicknesses (dashed lines) and LG pans with different layups (solid lines) for performance criterion based on the ultimate failure.
Conclusion
Laminated Glass (LG) panes are known to have superior blast resistance as compared to other commercial glass panes, such as annealed or thermally tempered glass panes. According to the current practice, LG panes are mainly designed based on simplified SDOF models with consideration of only a single limit state of ultimate failure. For the purpose of higher levels of blast protection, Performance-Based Design (PBD) procedure should be considered. Although PBD is now a well-documented procedure in earthquake engineering, it is not widely used in blast engineering practice. The main focus of this study is to provide multi-performance blast pressure-duration curves of LG panes. Defined performance criteria (limit states) include: (1) initial cracking of the glass layer, (2) maximum strain limit of 50% (0.25 of the rupture strain) in the PVB interlayer (PVB-50%), (3) maximum strain limit of 100% (0.5 of the rupture strain) in the PVB interlayer (PVB-100%), and (4) ultimate failure of the pane, which can be either PVB rupture or pull-out of the pane from its frame.
Pressure-duration curves are evaluated using sophisticated Finite Element (FE) models. Adopted FE modeling technique is verified by comparing response prediction against earlier blast test data to assess reliability of the FE model. Using modified Friedlander equation, both positive and negative phases of the blast overpressure are considered in the carried out numerical simulations. In some cases, especially during blasts with shorter positive durations, the intended limit state is achieved during rebound of the pane. Pressure-duration curves associated with four performance criteria of initial cracking, PVB-50%, PVB-100% and ultimate failure are estimated for 18 LG panes with three layups of 3 mm/0.76 mm/3 mm, 6 mm/0.76 mm/6 mm, and 3 mm/1.52 mm/3 mm, two widths of 0.6 and 1.2 m and three aspect ratios of 1, 1.5, and 2.
It is concluded that, compared with the PVB thickness, the thickness of the glass layer has a more pronounced effect in blast resistance of the pane, and this is true for all limit states. Full resistance of LG panes with thick PVB interlayer may not fully develop due to pull-out of the pane. As a result, the LG panes with thicker PVB need deeper bites at their edges to prevent premature pull-out.
Finally, the blast resistance of the LG panes is compared with that of the Thermally Tempered Glass (TTG) panes. As expected, the LG panes generally have more blast resistance even compared with thicker TTG panes and the difference is more noticeable during blasts with shorter positive phase durations. Another difference between blast behavior of LG and TTG panes is the maximum out-of-plane deflection of the panes before failure. The TTG panes fail with maximum deflection ratios (ratio of maximum deflection of the pane to the pane width, Δ/b) of 0.02 to 0.05, while the LG panes fail with maximum deflection ratios of 0.1 to 0.4 which is one order of magnitude higher than those of the TTG panes. Obviously, such a great out-of-plane deflection capacity is attributed to the membrane action of the ductile PVB interlayer of the LG panes.
Footnotes
Declaration of conflicting interests
The author(s) declared no potential conflicts of interest with respect to the research, authorship, and/or publication of this article.
Funding
The author(s) disclosed receipt of the following financial support for the research, authorship, and/or publication of this article: This work has been supported by Hinman Consulting Engineers and also Pacific Earthquake Engineering Research Center (PEER) at University of California Berkeley, as part of an ongoing collaboration aimed at the development of performance-based design of structures subject to extreme events.
