Abstract
This paper presents a realistic model for the simulation of a progressive collapse scenario in a typical low-rise building that is constructed from RC flat slabs and supported by columns. The progressive collapse scenario starts after failure of the top slab connections, where the slab is falling downward and impacts with the slab below. This impact event is analyzed, and the dynamic failure of the impacted slab’s connections starts the progressive collapse event. Two different scenarios are identified, depending on the first slab damage condition prior to impact. The first scenario refers to an undamaged impacting slab where an elastic collision occurs with the slab below; in the second scenario, the first slab is damaged, and its collision with the slab below is plastic. In the first scenario, the impacting slab velocity drops to zero while its velocity is fully imparted to the impacted slab. In the second scenario, both slabs continue their motion jointly at a common velocity. In the subsequent impacts, the impacting slabs are a-priori damaged, hence plastic collisions occur. These impact occurrences are analyzed separately, depending on the number of impacting slabs involved, damage characteristics, and impact velocity. Due to the nature of the first impact, the first scenario is characterized by separate motion of the first impacting slab which is falling behind the other slabs. This slab gains speed until it meets the other falling slabs below at a certain altitude, and an intermediate collision occurs, not necessarily at a floor level. In the analyzed five-story building, the intermediate impact occurs after the third impact event, where the slabs are located slightly above the first story level. The intermediate impact elevates the velocity of the impacted slabs such that their impact with the first level slab is more severe and its motion toward hitting the ground level is faster.
Keywords
Introduction
Flat slabs and static punching shear
Reinforced concrete buildings with flat slabs are very common in residential and office buildings. The sensitivity of the flat slab-column connection to punching shear is well-known and the problem of static punching shear failure has been studied widely, both experimentally and analytically (Einpaul et al., 2016; Hueste and Wight, 2002; Hallgren and Bjerke, 2002; Hallgren and Mats, 2002; Kinnunen and Nylander, 1960; Muttoni et al., 2013; Yankelevsky and Leibowitz, 1999; Yamada et al., 1992). Typical experimental studies consider small size slab specimens, commonly of square or circular shapes, with a central short column; the slab is supported along its circumference and the column is pushed downward until punching shear failure is developed. This is a brittle mode failure, which disintegrates the slab from the column by a curved shear surface, emerging from the column perimeter at the top face of the slab toward the slab bottom surface at some distance from the column circumference. In the case of a column with a circular cross-section, it forms a convex surface of revolution that is close to the shape of a truncated cone. This shear surface disintegrates the slab from the column while the concrete shear plug remains connected to the column. In the case of flat slabs supported by columns, the gravity, and live loads act downward and the slab is supported by the column’s upward reaction, therefore, the shear failure is inverse, that is, the shear surface emerges at the column perimeter at the slab bottom face and extends its diameter toward the top face of the slab.
These studies aimed at clarifying the mechanisms involved in a static punching shear event that governs the shear failure of a RC flat slab around a supporting RC column. Most of the studies refer to well-defined static loads. The results of the accumulated knowledge have been implemented in design codes and manuals (ACI318, 2014; CAN/CSA-A23.3-04 A National Standard of Canada, 2004; EC2, 2004; Model code, 2010).
In the common case of a slab supported by columns, it is well-known that the entire dead and live load acting on the slab is carried by the columns, hence, the highest magnitude of shear stresses in the slab are at the column vicinity and may cause punching shear failure. The shear failure under static loading is characterized by cracks observed on the slab top face around the column due to the local radial and tangential bending and mainly by the shear crack crossing the slab height and disintegrating the slab from the column. The concrete on both sides of the shear crack remains intact and mostly undamaged.
To enhance the slab shear resistance and provide safety against specified static loading, the standards provide detailed instructions for the proper design principles and reinforcement details, including the addition of special shear reinforcement at the slab-column connection zone.
Despite the attention given in the standards to this sensitive problem and the detailed design instructions, punching shear failures in buildings are reported in the literature and in the news media from time-to-time (Lew et al., 1982; Yankelevsky et al., 2020, 2021a, 2021b). There are numerous reasons for such failures, such as excessive or unexpected static or dynamic loads, poor design, poor construction, foundation settlement, and their combinations.
Dynamic punching shear
While numerous studies have been performed on static punching shear, only a limited number of studies were dedicated to the problem of dynamic punching shear but hardly under impact conditions. Indeed, similar dynamic phenomena have been observed in other areas where a local dynamic high intensity action has been applied to a flat concrete slab and caused its punching and breaching, such as in the case of projectile impact at low or high velocity (Dancygier and Yankelevsky, 2002; Dancygier et al., 2007; Yankelevsky, 1997) and in low-velocity drop tests on concrete slabs (Chen & May, 2009; Kumar and Mittal, 2017; Zineddin & Krauthammer, 2007). A limited number of experimental and numerical studies examined RC slabs to impulsive loading and high-speed loading and examined the slab shear [22–24]. In all these cases, the dynamic punching shear resulted from a local dynamic impact between a small size impacting body and the slab, whereas in the present problem large slabs impacting each other at a relatively low velocity over a large contact area in presence of local column constraints impact. Therefore, the above background is much different from the present problem.
Dynamic punching shear that is somewhat related to the present problem has been studied in (Micallef et al., 2014) where approximate simplified models based on structural dynamics principles were suggested.
Slabs impact and progressive collapse
The present problem starts with the connections failure of a flat slab, that is detached from its supports and is falling one floor height below and impacts the slab underneath. There are numerous examples of disastrous impact punching shear failures of flat slabs, at the end of which all slabs rest on the ground one on top of the other, and columns of several stories’ height remain in an upright position (King and Delatte, 2004; Lew et al., 1982).
A common scenario starts with a collapse of a certain floor; this collapse may result from different reasons, either static (e.g., excessive loading, etc.) or dynamic (e.g., gas explosion, earthquake shaking, high-intensity blast, etc.). As a result of the slab-column punching shear connection failures of that slab, the slab is detached from its supports and is falling downward at increasing velocity until its impact with the slab below. No matter what the reason of failure of the first slab is, its contact with the slab below is characterized by a dynamic impact between the two slabs. This impact contact causes impact punching shear to the slab connections and detachment of the impacted slab from its supporting columns. This triggers a sequence of lower slabs impact that develops into a progressive collapse.
The progressive collapse problem attracted the attention of different researchers. Vlassis et al. (Vlassis et al., 2009) proposed a simplified design-oriented methodology for assessing the progressive collapse of floor systems within steel multi-story buildings subjected to impact from an above failed floor. They concluded that a floor system within a steel-framed composite building with a typical structural configuration has limited chances to arrest the impact of a slab from an upper floor. Olmati et al. (Olmati et al., 2017) presented a simplified reliability analysis for assessing the probability of punching of flat slab concrete buildings subjected to a falling slab impact. The analysis assumed an arbitrary portion of the impacting slab in a free fall considering some asymmetry of the impact. FE modelling of the slab employing shell elements ignoring the exact reinforcement details was carried out to determine the demand of the slab column connection, using the critical shear crack theory (Muttoni and Ruiz, 2019). The analysis showed that the demand quickly exceeded the punching shear capacity at early stages of the impact event and concluded that it is unlikely that a flat plate building will survive the impact from a falling floor. Jawdhari et al. (Jawdhari et al., 2018) conducted analysis of a RC flat slab using the same concept of (Vlassis et al., 2009), assuming that the impacting RC slab is falling from one story height. The RC flat slab building showed low probability to survive the impact. The above studies use simplified models, assume uniform “equivalent” domains and do not consider the exact reinforcement details.
Recently we have studied the impact between two RC slabs (Yankelevsky et al., 2020, 2021a, 2021b). we found out that a realistic detailed model is required to properly simulate the complex behavior of the slab-column connection and its local components such as the longitudinal and shear reinforcements including its details and locations that take part in the local resistance to the impacting slab. The special features of this model compared to previous studies are the following: it includes a fine representation of the concrete volume and the exact reinforcement in the connection zone, it is not confined to structural engineering material and cracking models but is based on continuum mechanics principles and three-dimensional constitutive relationships that are capable to assess the developing damage and failure, and the impact behavior is a natural outcome of the contact between the slabs. This way a high-fidelity solution is obtained with minimum preliminary constraining assumptions. So far, we have investigated the effects of slab thickness and reinforcement details and their contribution to impact punching shear resistance. It has been confirmed that a flat RC slab that is designed according to all the standards’ instructions to withstand static loading, cannot withstand the impact event and its connections experience a dynamic punching shear failure. This background stands behind the present study.
The present study
In the present investigation, we use the realistic model that has been developed and validated earlier, to study the impact between two RC slabs, and extend the analysis to all the slabs along the building height, aiming at investigating the series of subsequent impacts between slabs during a progressive collapse scenario. This has not been studied before, and it aims at studying the nature of slabs impacts in this disastrous event. For that purpose, we consider a five-story building made of RC flat slabs supported on columns and initiate a progressive collapse scenario by assuming failures of the top slab connections and releasing this slab from the columns and letting it fall downward and impact the slab underneath.
The model
Consider a general layout of a five-storey building that is made of RC flat slabs supported by columns having a 200*200 mm cross-section (Figure 1(a)). Assume that the top slab is detached from its connections with the columns and starts falling downward. The falling slab gains velocity due to its decreasing potential energy and it hits the slab underneath at a velocity which depends on the floor height. Assuming a typical floor height of 3.0 m yields an impact velocity of 7.75 m/s. In our previous recent studies on impacting slabs, we examined 4 m and 8 m span slabs in two-story buildings and found that the damage is larger in the larger span slabs. Therefore, we shall consider here 4 m span slabs to account for the lower limit of damage. For that span, structural analysis according to current standards yields a minimum required thickness of 140 mm. Model geometry (a) RC slab plan (b) Interior field side view.
Assuming that a slab is falling parallel to its original position leads to simultaneous contact of its entire area with the impacted slab. This justifies a simplified geometry of the model: the centerlines between all column lines (dotted lines in Figure 1(a)) determine a tributary area ABCD per a typical interior column. The analysis model is depicted in Figure 1(b); it is composed of a set of tributary areas at all floors with a single central column.
The boundary conditions along the circumference of a typical interior tributary area are intended to maintain the continuity conditions between adjacent areas, such that the entire building skeleton can be assembled from a set of these units with adequate boundary conditions along ABCD to account for the entire slab continuity (Yankelevsky et al., 2021). Referring to the coordinate system attached to the point A in Figure 1(a), the boundary conditions of the isolated tributary area are: ∂w/∂x=0 for the edges AB and DC and ∂w/∂y=0 for the edges AD and BC (“clamped–guided” or “symmetrical” boundary conditions, e.g. (Theory manual. revision 4.3., 2005)).
The column’s bottom boundary is assumed clamped (zero velocities in all directions).
The slabs design to static loading is based on C35 concrete and S400 grade ribbed reinforcing steel, which is characterized by its 8% elongation at maximum force and 12% elongation at fracture. Structural analysis requires the following bottom and top reinforcement (Yankelevsky et al., 2021): bottom reinforcement mesh of 8 mm diameter bars with a spacing of 150 mm in both directions over the entire slab. In addition, two 10 mm diameter integrity rebars (length 1.1 m) are placed in each direction crossing the column cross-section. The top reinforcement is arranged in three strips; at the central part of the slab the reinforcement is made of 16 mm and 20 mm diameter rebars at spacings between 100 mm to 200 mm. More details are given in (Yankelevsky et al., 2021).
The static design of a 140 mm thick slab requires additional punching shear reinforcement: three 1.42 m long 45° bent-up 10 mm diameter ribbed bars in each direction.
The RC column reinforcement consists of four longitudinal 12 mm diameter ribbed bars and 10 mm diameter stirrups with a spacing of 120 mm along the column height. The thickness of the column’s concrete cover is 25 mm.
Materials data.

The first slabs impact—Preliminary considerations
Effect of building height on slabs impact
To initiate the progressive collapse scenario, it is assumed that failure has already occurred at the connections of the highest (top) slab at the fifth level (Figure 1(b)), and that the slab is detached from the supporting columns and is about to start its free falling downward. During falling, its velocity is increasing due to gravity, and prior to impact with the fourth level slab it reaches the fourth level at a velocity of 7.75 m/s.
So far, in our previous studies (Yankelevsky et al., 2021) we focused on a single impact event between two slabs, and therefore we referred to a basic model comprising of two slabs and a central column, where the second level slab is considered the top slab and it is impacting the first level slab, that is positioned 3.0 m below the top slab and 3.0 m above the ground surface; this case will be considered as the two-story case. In this scenario, the top slab is ideally detached from the column, and it is undamaged prior to impact. In the present study, we refer to a five-story case where the top slab at the fifth level that is ideally detached like in the two-story case and impacts the fourth level slab. The five-story case differs from the two-story case by a longer supporting column and extra three slabs (at levels 1–3) that passively take part in the impact event of the building. The possible effect of these difference on the impact between the fifth and fourth level slabs will be clarified in the following.
These cases (of the two-story and five-story structures) were analyzed and the velocity-time histories at point A (Figure 1(a)) from the instant of impact are shown in Figure 2. The velocity-time history of the impacted slab is shown in a solid thick line and indicates a sharp increase of the velocity from zero to a maximum velocity that is about the magnitude of the impact velocity of the falling slab. The velocity-time history of the impacting slab is shown in a thin solid line, indicating a sharp decrease of the velocity from the initial impact velocity (7.75 m/s) to a very low magnitude velocity that is almost zero. This is a result of the computational analysis of the impact carried out by the numerical model following the response of all volume cells. It indicates an almost elastic collision, that is defined by an almost complete velocity exchange between the slabs after which the impacting slab velocity drops almost to zero, and the energy of the two slabs system before and after the impact has been conserved. This exchange occurs within a very short duration, as will be further discussed later. First impact velocity-time history for two-story and five-story cases.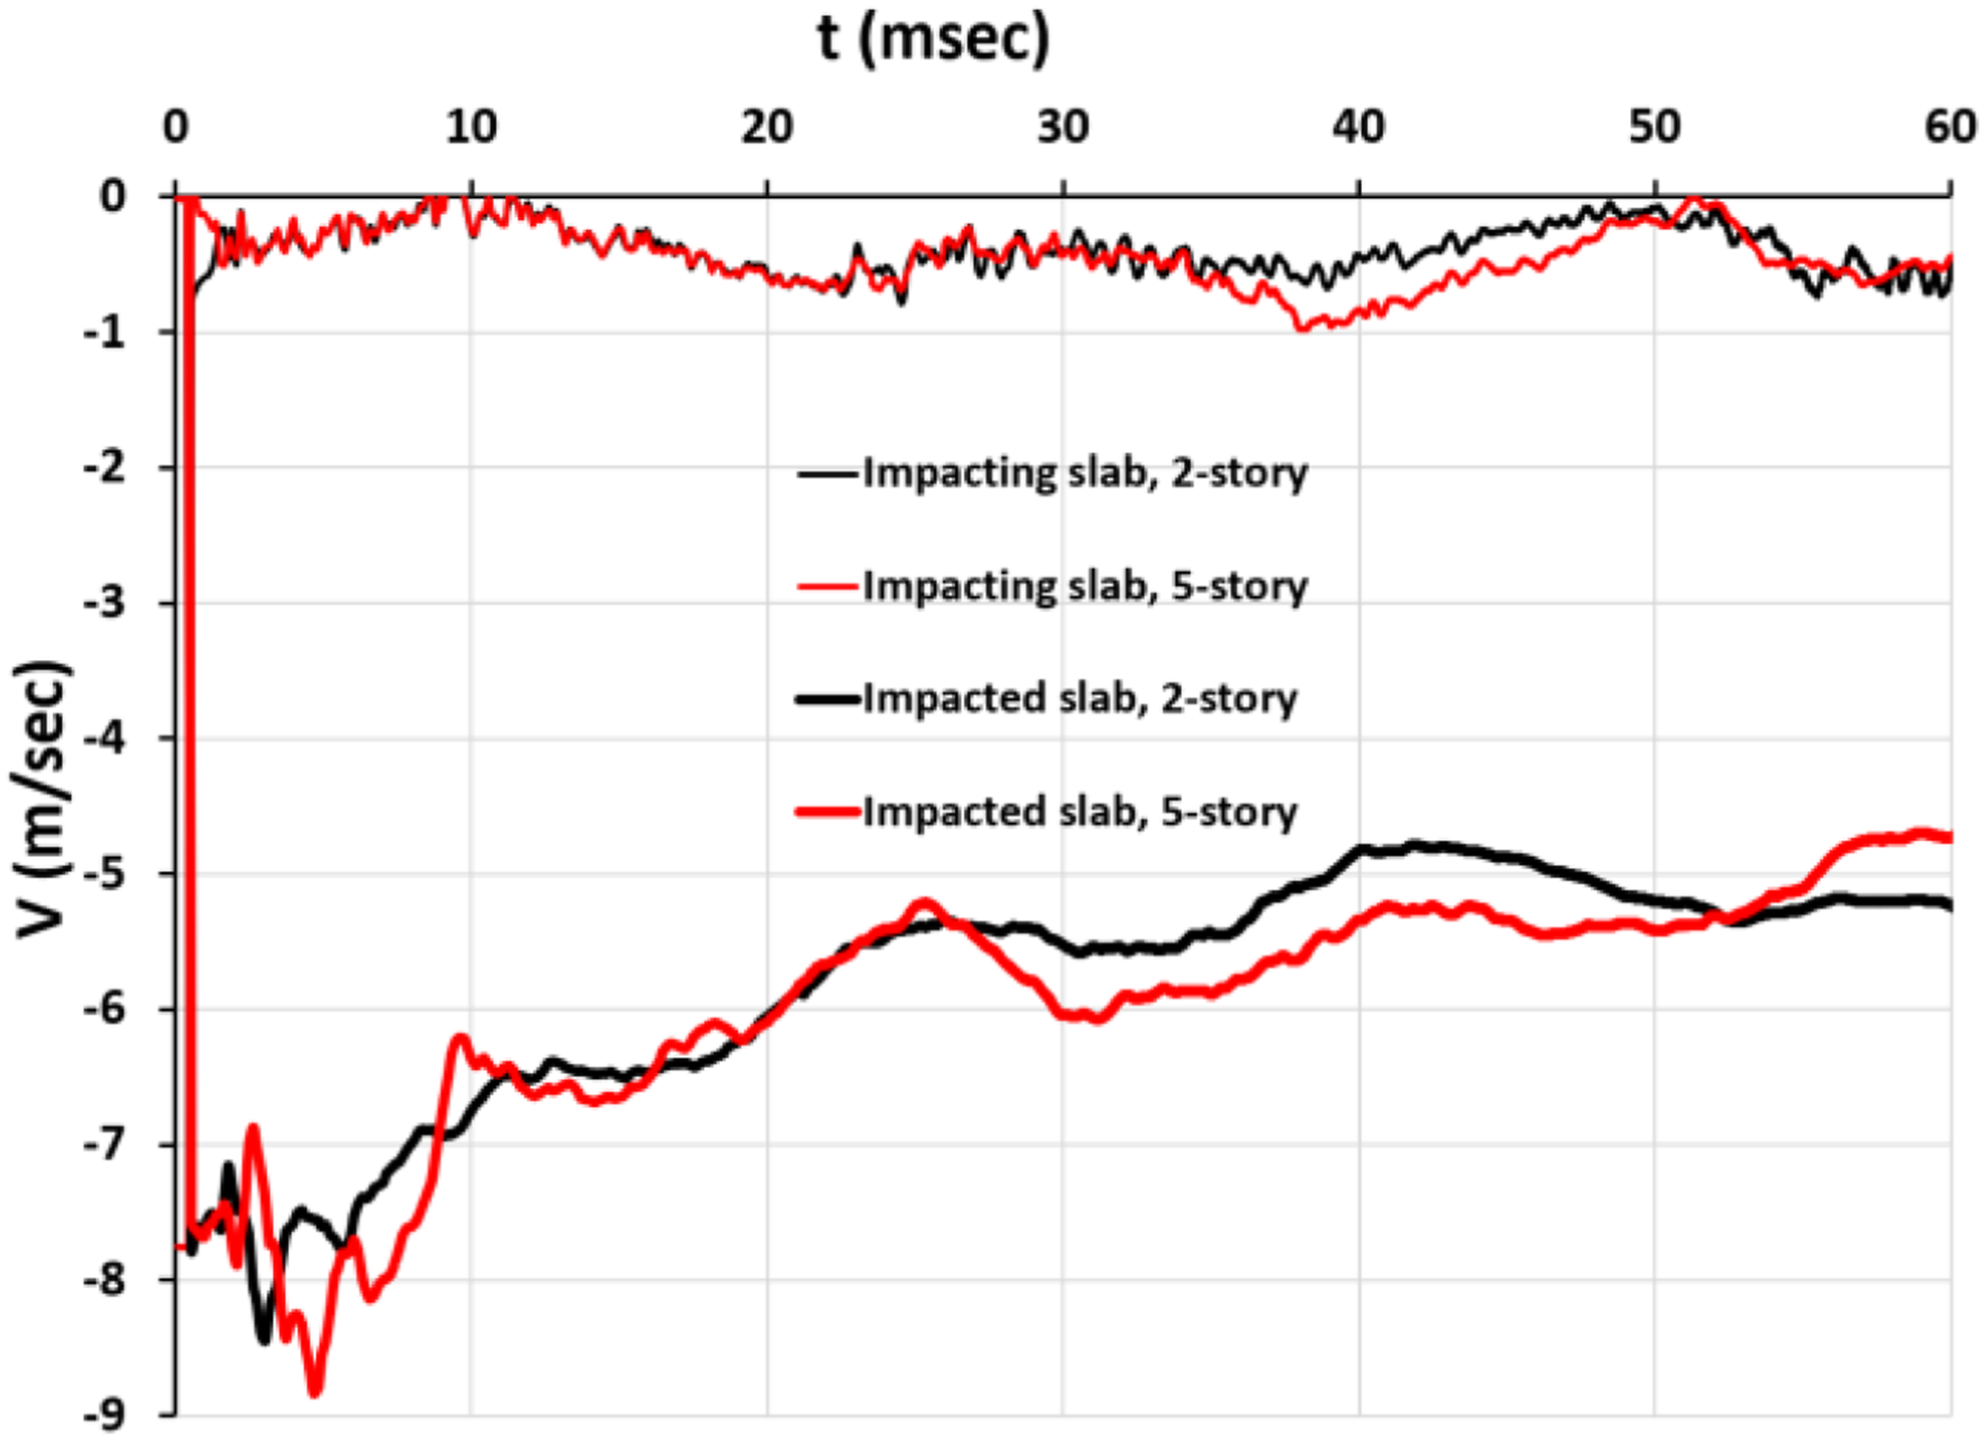
Comparing the black line for the two-story case and the red line for the five-story case, indicates that the response in both cases is very similar. This means that during the short impact event and afterward, there are no significant effects of the rest of the structure on the two impacting slabs response, and therefore we may consider the results and conclusions from the two-story case in our earlier study (Yankelevsky et al., 2021) valid for the first impact stage of the present five-story building.
Simplified representation of the first impacting slab-static punching shear failure
In a progressive collapse scenario starting with a static punching shear connections failure of the first falling (top) slab, the static failure ends with a somewhat complex geometry of the slab in the sheared plug region. Aiming at simplifying the geometrical representation of the curved surface plug hole by a representative cylindrical hole we examine the effect of the idealized hole diameter on the impact response.
Figure 3 shows the behavior of the impacted slabs in two cases of different hole diameters in a detached undamaged impacting slab, that were used for this preliminary impact analysis: a small diameter hole (d = 0.3 m) that is only slightly larger than the column size, and a large diameter hole (d = 0.75 m). The 0.75 m diameter hole may be compared with the larger diameter of a conical shear plug that extends from the column, having the column size diameter at the plug smaller bottom base, and a 0.60–0.75 m diameter at the plug larger top base, corresponding to a crack inclination of 1.5–2 times the slab thickness, respectively. Figure 3 indicates that in both hole sizes similar damage is developed in the impacted slabs. Hole size effect on damage in impacted slab (a) top damage view – small hole (b) top damage view – large hole (c) bottom damage view – small hole (d) bottom damage view – large hole.
The velocity-time histories from the instant of impact for point A (Figure 1(a)) are shown in Figure 4 (the thin solid line for the impacting slab and the thick solid line for the impacted slab). Velocity-time histories for different hole sizes.
The velocity-time history for the small diameter hole is shown in black and for the large diameter hole in red. While the impacted slab with the small diameter hole exhibits a slightly vibrating gradual velocity decrease with time, the large hole response is cycling at somewhat larger amplitudes around the signal of the small diameter hole during about 40 ms (milliseconds) from impact, when the impacted slab connection to the column is severely damaged. At later times, after a connection complete failure, the velocity of the impacted slab approaches a constant value. The velocity of the impacted slab in both cases varies similarly and its residual velocity is similar as well. This residual velocity is the initial velocity of the impacted slab continuing motion downward.
These results mean that the velocity-time history of the impacted slab is only very slightly affected by the hole size with a diameter within the examined range of the real shear crack, hence the residual velocity is almost insensitive of the hole diameter, within that range. Hence, the idealized cylindrical hole may successfully replace the need to carefully represent the curved geometry of the slab with the curved shear crack surface.
The case of impact punching failure of the first slab
In the simplified representation of the first impacting slab-static punching shear failure section, we considered a progressive collapse scenario starting with a static punching shear failure of the top slab, where the entire falling slab is undamaged, and the void central shear plug region was idealized by an interior cylindrical hole. However, there are cases where the punching shear failure of the first falling slab is characterized by considerable damage to the slab in the connection zone and beyond. For example, consider a gas explosion in a certain story of the building and assume that the dynamic loading on this slab, that is considered as the first slab which initiates the entire scenario, is simulated by a pressure of 200 KPa pressure acting on the slab surface during 10 ms and drops to zero afterward. Figure 5 shows typical results of the impact punching shear-gas explosion. Impact punching shear-gas explosion (a) Time histories (b) Gauge location-impacted slab (c) Damage – top view (d) Damage – bottom view.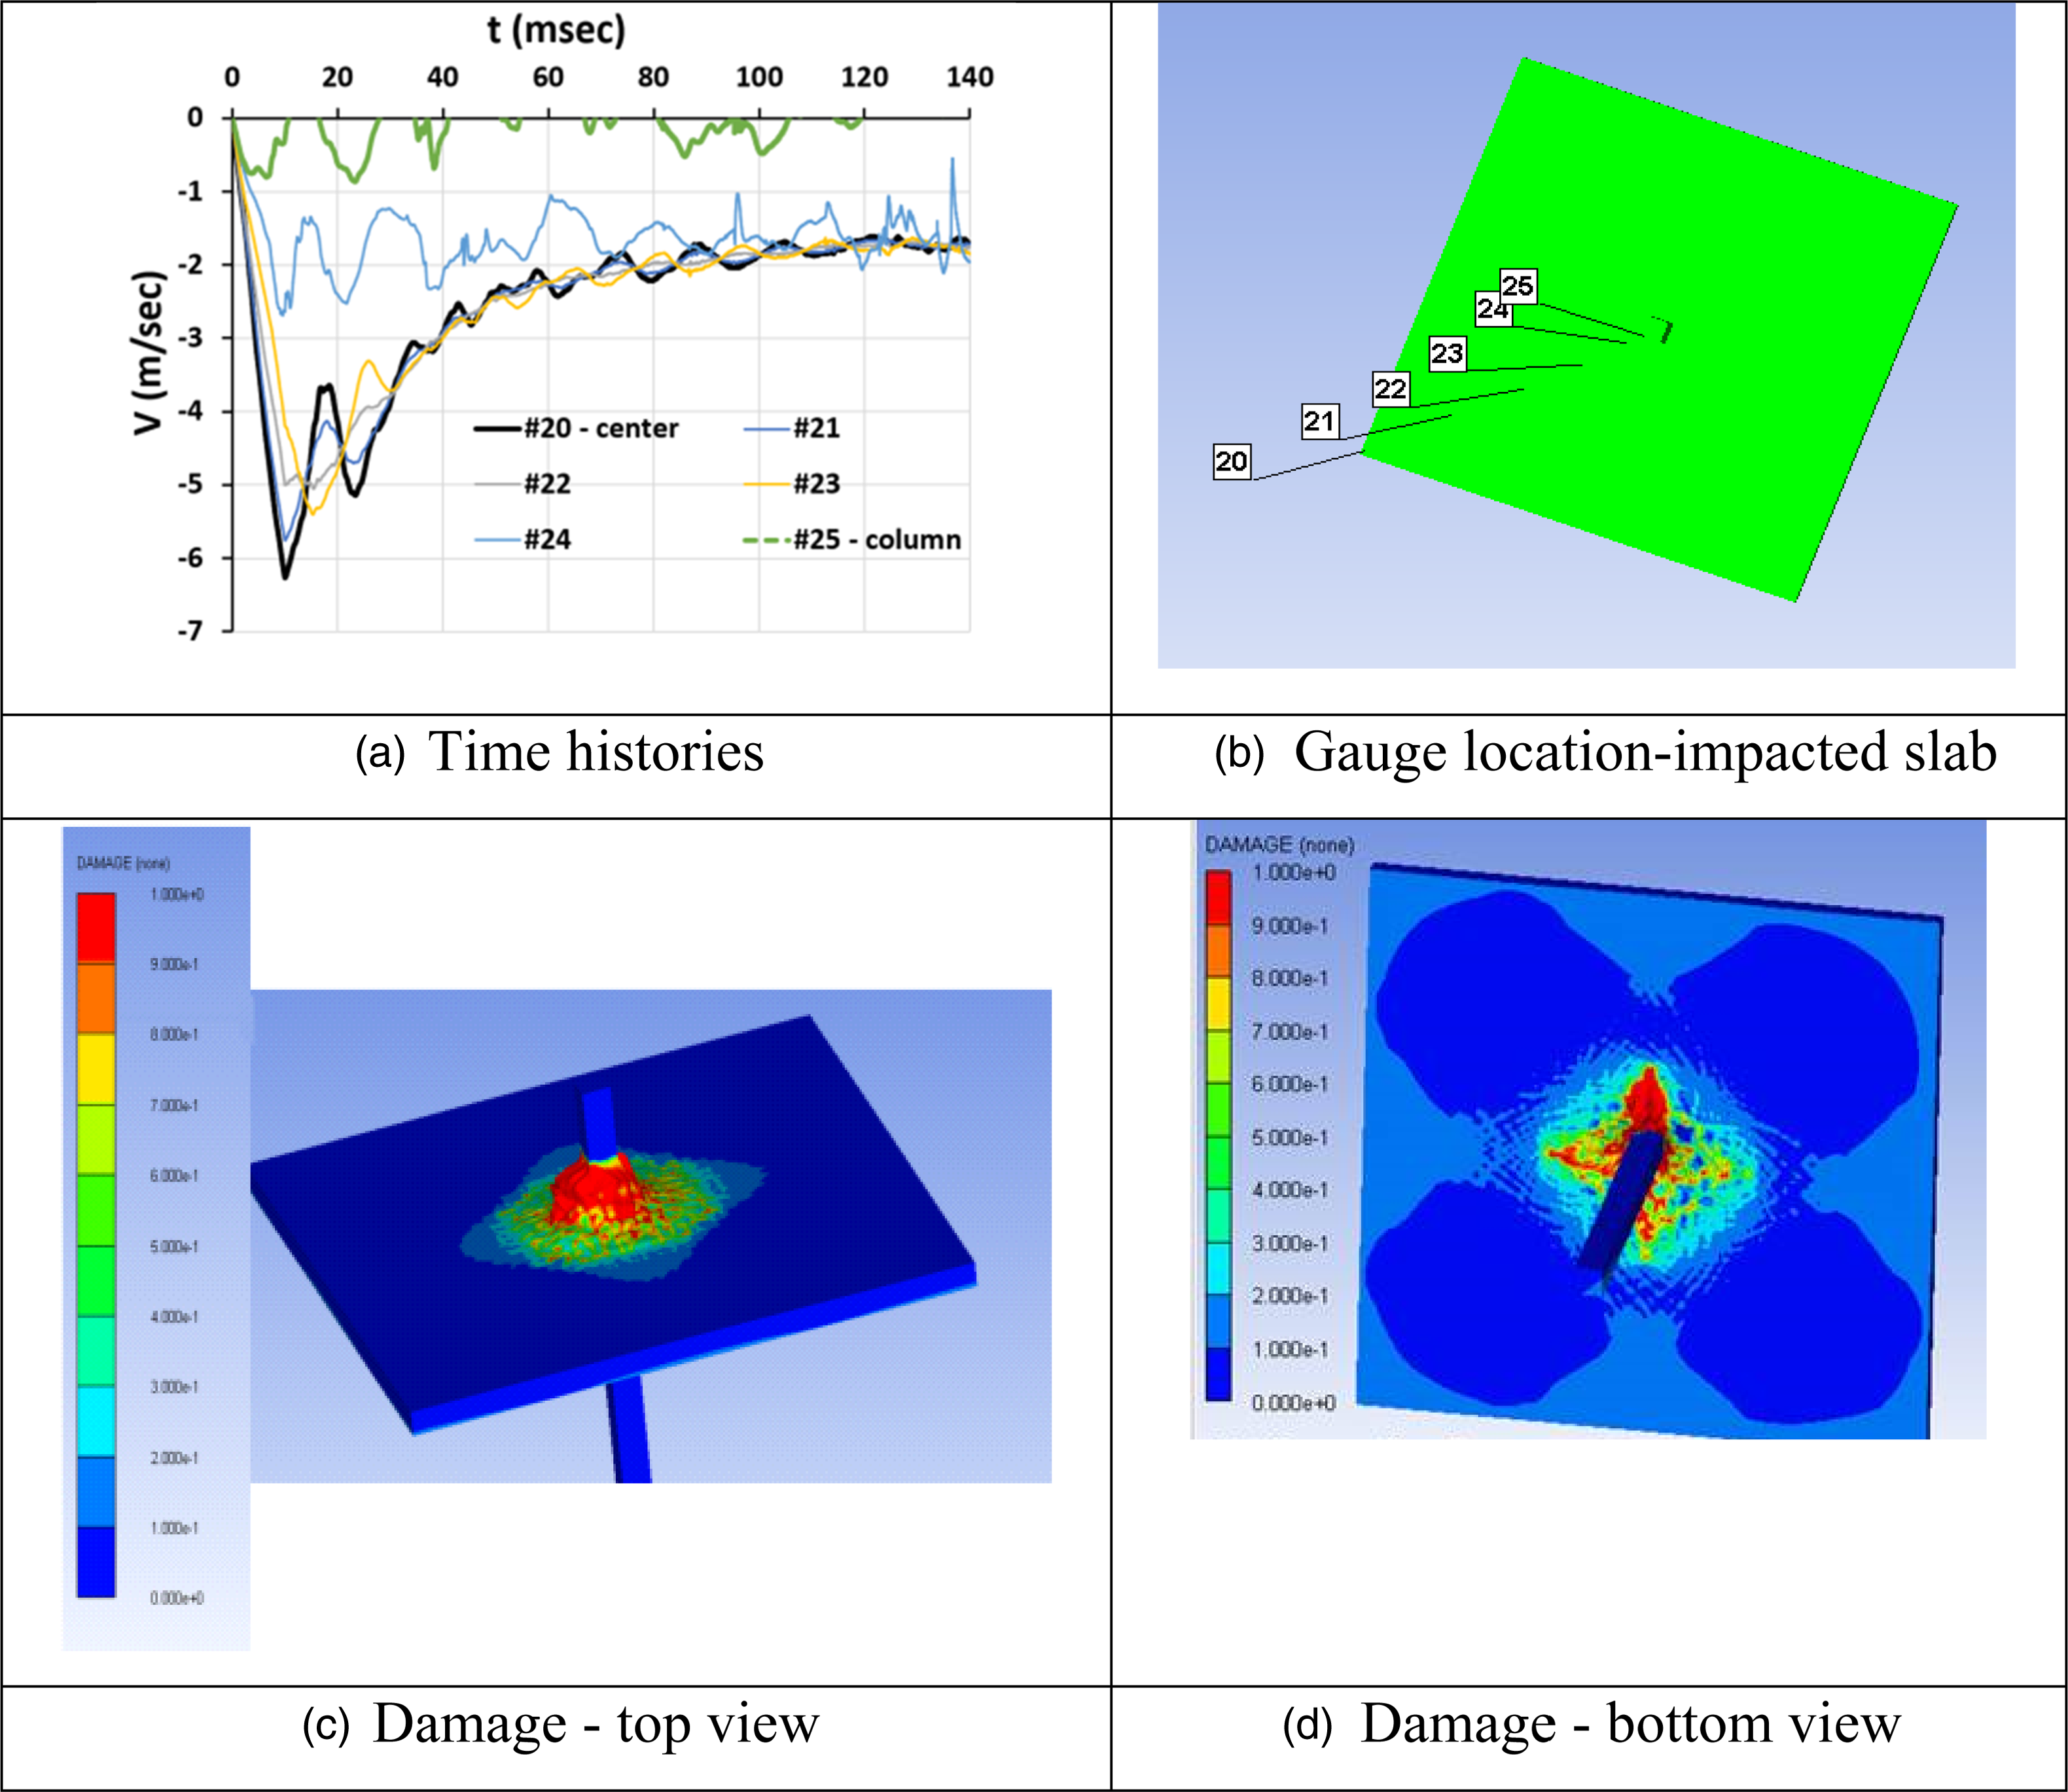
Figure 5(a) shows that it takes about 60–80 ms to destroy the slab-column connection and completely detach the slab from the column. During that duration the impacted slab velocity is decreasing due to the energy consumed by the failure processes, and then the velocity stabilizes at ∼1.8 m/s, in that particular examined case. Analyzing the same problem with a slightly lower gas pressure would yield complete failure of the connection with a zero residual velocity.
Assume that in both cases (i.e., the above statically loaded slab and the preset gas explosion loaded slab) the slabs with detached connections arrive at the slab below at a velocity of 7.75 m/s that is gained by its gravitational motion along the floor height. The second case the gas explosion loaded is characterized by spread damage resulting from the explosion stage.
Figure 5(a) shows the velocity-time history for several points along the diagonal of the tributary area of the impacted slab (Figure 5(b)), from which one may conclude that after ∼30 ms most of the slab area, except of the area near the column (including point #24), followed the same velocity-time history.
This indication is in accordance with the damage view (Figures 5(c) and (d)) showing that complete damage occurs in the impacted slab only in proximity of the column (Figure 5(c)) while the rest of the slab undergoes an even displacement. The bottom of the impacted slab (Figure 5(d)) is moderately to severely damaged over a large area of the slab and differs from the limited zone damage observed in Figure 3(c). This is an important result that will affect the following impact of this slab with the slab underneath.
Taking the final state of damage of this impacted slab (by the slab that had been subjected to the gas explosion pressure) and considering the velocity it is gaining while its free falling due to gravity prior to hitting the slab below, creates the initial conditions for its impact with the slab underneath.
The collision between slabs in this scenario differs from the previous scenario only by the pre-impact damage in the impacting first slab. Analyzing this impact scenario, reveals that this difference leads to significantly different results than observed in the case of an undamaged falling slab. The damage in this impacting slab affects its impact response through the constitutive relationships accounting for the damage distribution in each volume cell and controls its ability to carry stresses and develop strains during the following impact event. The contact analysis in this case shows that an entirely different and more complex momentum transfer occurs (Figure 6) with a gradual variation of energy and momentum with time. In this examined study, it lasts ∼7 ms during which damage expands and the dynamic response is therefore more complex. Velocity-time histories for a damaged slab impact.
During this transition period the velocity of the impacting slab is gradually decreasing while the velocity of the impacted slab gradually increasing, until both slabs reach a common velocity then after. We realize that the final state of identical velocities of both slabs, that is reached after a few milliseconds, matches the definition of plastic collision and therefore it will be denoted as such, although in fact a more complex transition stage precedes this state, which is not considered at all in simple dynamic contact mechanics.
Elastic and plastic slabs impacts
In the case starting with static punching shear failure (the Simplified representation of the first impacting slab-static punching shear failure section), an almost ideal elastic collision had occurred, leaving the impacting slab with an almost zero velocity after the collision and imparting its pre-impact velocity to the impacted slab. That initial velocity of the impacted slab is decreasing during the short duration damage and failure development in the connection and ends with a residual velocity of about 5 m/sec (Figure 4) when the connection of the impacted slab is fully detached from the column. At the end of the impact event, the impacting slab starts its motion downward with a zero initial velocity, while the impacted slab is advancing ahead starting its motion downward with an initial velocity that is the above residual velocity. Therefore, afterward the impacted slab increases its distance from the impacting slab behind. In the case of an explosion resulted connections punching shear failure of a slab, this slab is falling downward and its impact with the slab underneath ends when both slabs are “adhered” to each other and travel downward at the same velocity like in the case of plastic impact (Figure 6).
It is interesting to focus on the early time of impact and contact between the slabs, during which the momentum is transferred, and the post-impact velocities are developed. Figure 7 shows the momentum transfer for both collision scenarios. Collision between the slabs and momentum transfer (a) first scenario – elastic collision ([15]) (b) second scenario – plastic collision.
In the first scenario, an undamaged slab is impacting an undamaged slab (Figure 7(a)): the momentum transfer occurs within less than 0.2 ms, during which the impacted slab gains the velocity of the impacting slab, while the impacting slab’s velocity drops to zero. This figure shows in detail the early time of contact in Figure 4. Evidently this is an elastic collision.
In the second scenario, a damaged slab is impacting an undamaged slab (Figure 7(b)): the momentum transfer lasts for about 7 ms (35 times longer than the elastic collision) during which an energy dissipation process occurs. At the end of this collision event, both slabs continue their motion at the same velocity. After this momentum transfer duration, the joint motion of both slabs may be denoted as a plastic collision in which the energy is not conserved.
A similar scenario of a damaged slab impacting an undamaged slab represents all the following impacts of the slabs below. In each impact event, the final state of damage of the impacting slab prior to the following impact is considered among its initial conditions for analyzing its following impact with the slab underneath.
Simulation of the progressive collapse
In The first slabs impact - Preliminary considerations section, two distinct scenarios have been identified: the first scenario starts with a first undamaged slab impacting an undamaged slab below, and the second scenario starts with a first damaged slab with known damage characteristics which impacts an undamaged slab below. The latter case also applies to each following impact event (after the first slabs collision) in both scenarios during a progressive collapse scenario, where a damaged impacted slab is falling and impacting an undamaged slab below.
In analyzing the overall progressive collapse event of a building, we shall distinguish between two possible scenarios that differ by the conditions of the first impact as described above.
For the sake of comparison between the two scenarios, we assume that in both cases the slabs start falling downward with a zero initial velocity and arrive at the fourth level prior to impact at the same time with a velocity of 7.75 m/s. It was shown above that in the first scenario, the first impact between the fifth level slab and the fourth level slab is elastic, while the following impacts are plastic. In the second scenario, all impacts between slabs are plastic, including the first one. Each plastic impact is determined by the damaged details of the impacting slab as developed at the end of the previous impact.
In this section we shall follow the progressive collapse scenarios and analyze the sequence of impact events between slabs in both cases. Each impact event is composed of two major stages: • downward motion of a slab with an initial velocity (that is the residual velocity of the previous impact stage) at an increasing velocity until impacting the slab below. At this stage, prior to the following impact, the zone of complete damage (D = 1) in the concrete slab (e.g., red zones in Figures 3(a) and (b), 5(c)) is removed, as it is considered extensively crushed material that is disintegrated from the solid slab and has no effect on the slab resistance and response. • The impact stage between slabs, that is composed of the short duration collision, during which the momentum is fully or partly transferred to the impacted slab, depending on the damage condition, and the complete process of the connection failure.
The connection failure process is accompanied by decrease of the impacted slab velocity. The duration of this stage is ∼30–60 ms and it depends on the type of collision and its conditions. During this stage the slab undergoes a downward displacement w 0 that is equal to ∼1.5–2 times the slab thickness and somewhat affects the net floor height that is considered in its motion during the following impact event. This step ends with the residual velocity of this stage.
Analysis of the progressive collapse
In the following, the sequence of impact events will be described, starting with the first impact (between the fifth level slab and the fourth level slab). The impact events of both scenarios will be presented in parallel.
First impact event
In both scenarios the fifth level slab is falling downward one floor height and approaches the fourth level slab at a velocity of 7.75 m/s. The first impact between the fifth level and the fourth level slabs is significantly different in the two scenarios, as it is an elastic collision in the first scenario and a plastic collision in the second scenario.
The 1st scenario
Figure 8(a) shows both slabs at the end of the first impact event, where the impacting slab has hardly moved downward while the impacted slab has already developed its motion with its initial velocity. First impact event – first scenario (a) Total view after collision (b) Zoomed view after collision (c) Time history (d) Gauges on impacted slab.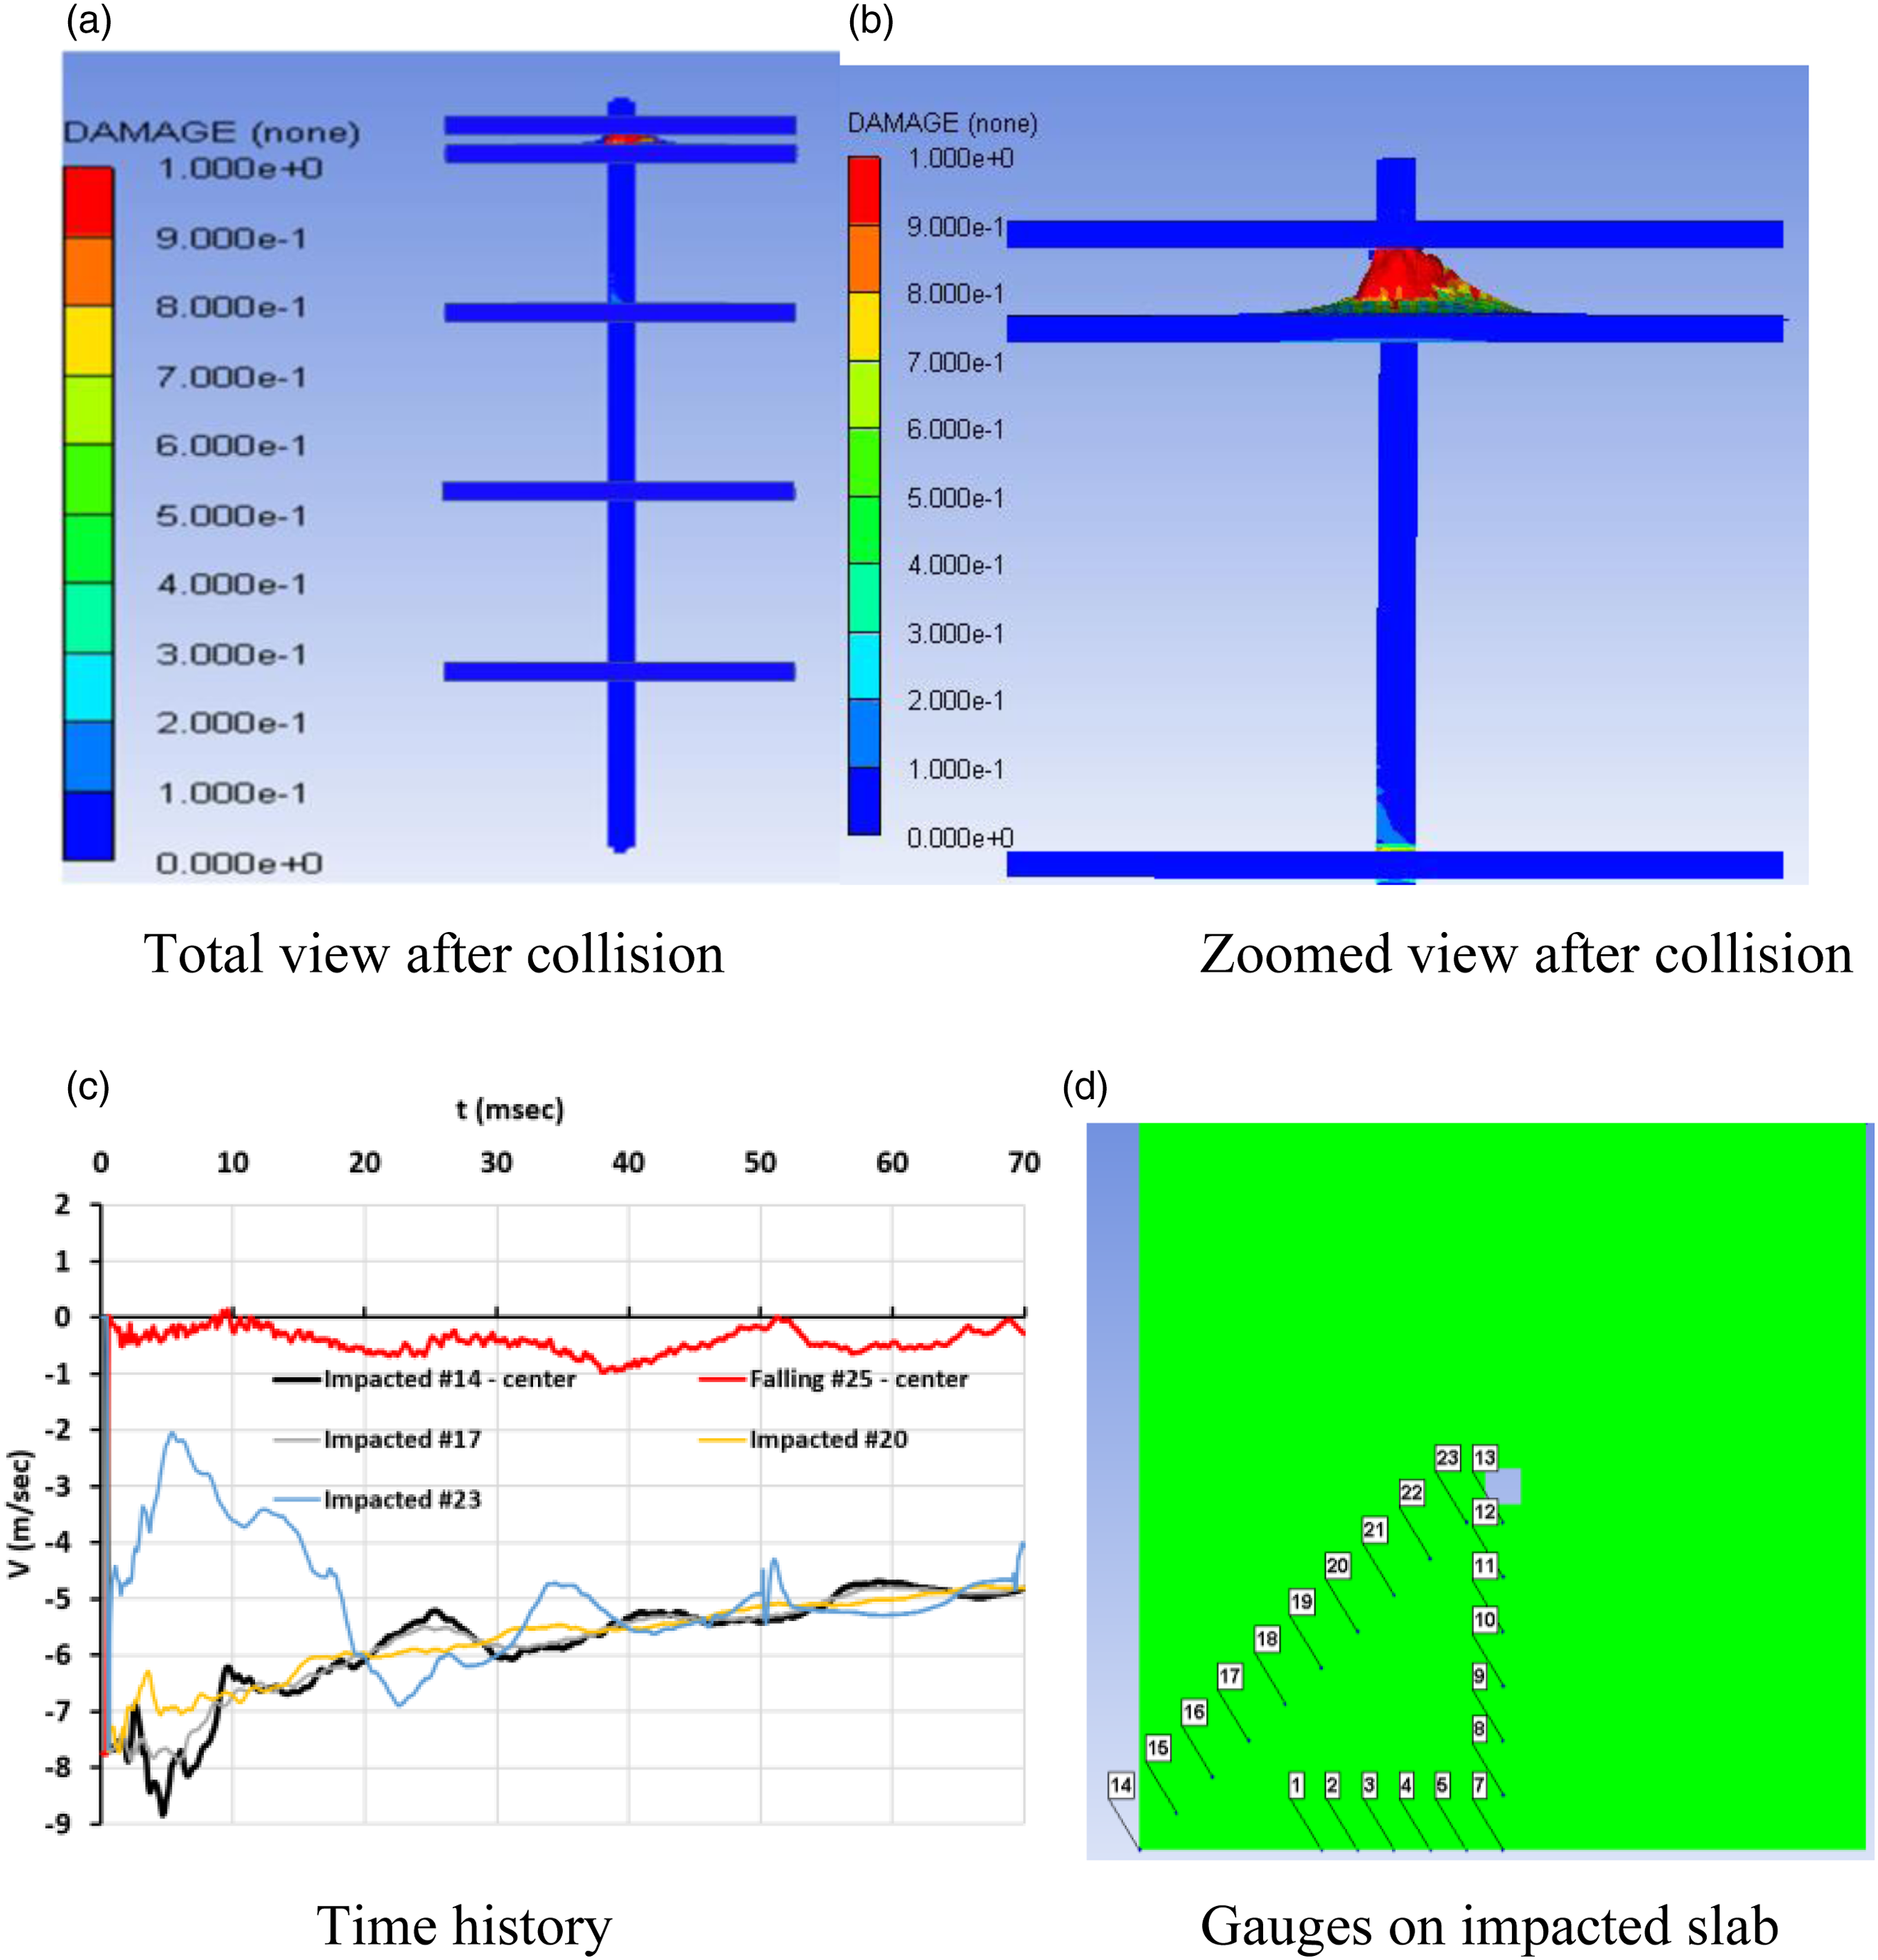
Figure 8(b) shows that a fully damaged concrete zone has been developed in the impacted slab around the column with an upward “bulge” of highly distorted and completely damaged concrete, indicating a complete connection failure.
It should be clarified that Figure 8(b) is a frozen shot of the damage in the slabs, taken at about 70 ms after the impact of the fifth level slab (the upper slab) with the fourth level slab below. The fifth level slab had transferred its momentum to the fourth level slab, and therefore is shown almost at its original position before impact. The red “bulge” refers to fully damaged crushed and comminuted concrete that is disintegrated from the solid slab and has no resistance. After termination of the impact analysis and prior to the following impact stage, the fully damaged material is removed, and a slab with a void is obtained. Therefore, the instantaneous observed red “bulge” will not appear in the following impact and will not affect the following response.
The duration of the momentum transfer and the complete connection failure in this case is ∼50 ms (Figure 8(c)). During the collision stage the velocity of the impacting slab has been fully imparted to the impacted slab (Figure 7(a) and time t = 0 in Figure 8(c)), while the momentum of the falling slab has dropped to zero. Then after, the impacted slab has started its downward motion, while decreasing its velocity due to energy absorption associated with the failure processes of the connection.
At the end of that stage the impacted slab has increased its distance from the impacting slab, and although damaged in the connection zone, most of its area is undamaged and maintains an even velocity (see gauges 14, 17, and 20 in (c) Time history (d) Gauges on impacted slab
Figure c, d). During the connection failure process its velocity gradually decreased and approached a residual velocity of 5 m/s, which is its initial velocity for the next impact event.
The 2nd scenario
During the first impact of the second scenario, the collision stage ends with a common residual velocity of both slabs such that the fifth level and fourth level slabs keep moving downward together (Figures 9(a) and (b)). First impact event – second scenario (a) Total view after collision (b) Zoomed view after collision (c) Time history (d) Gauges on impacted slab.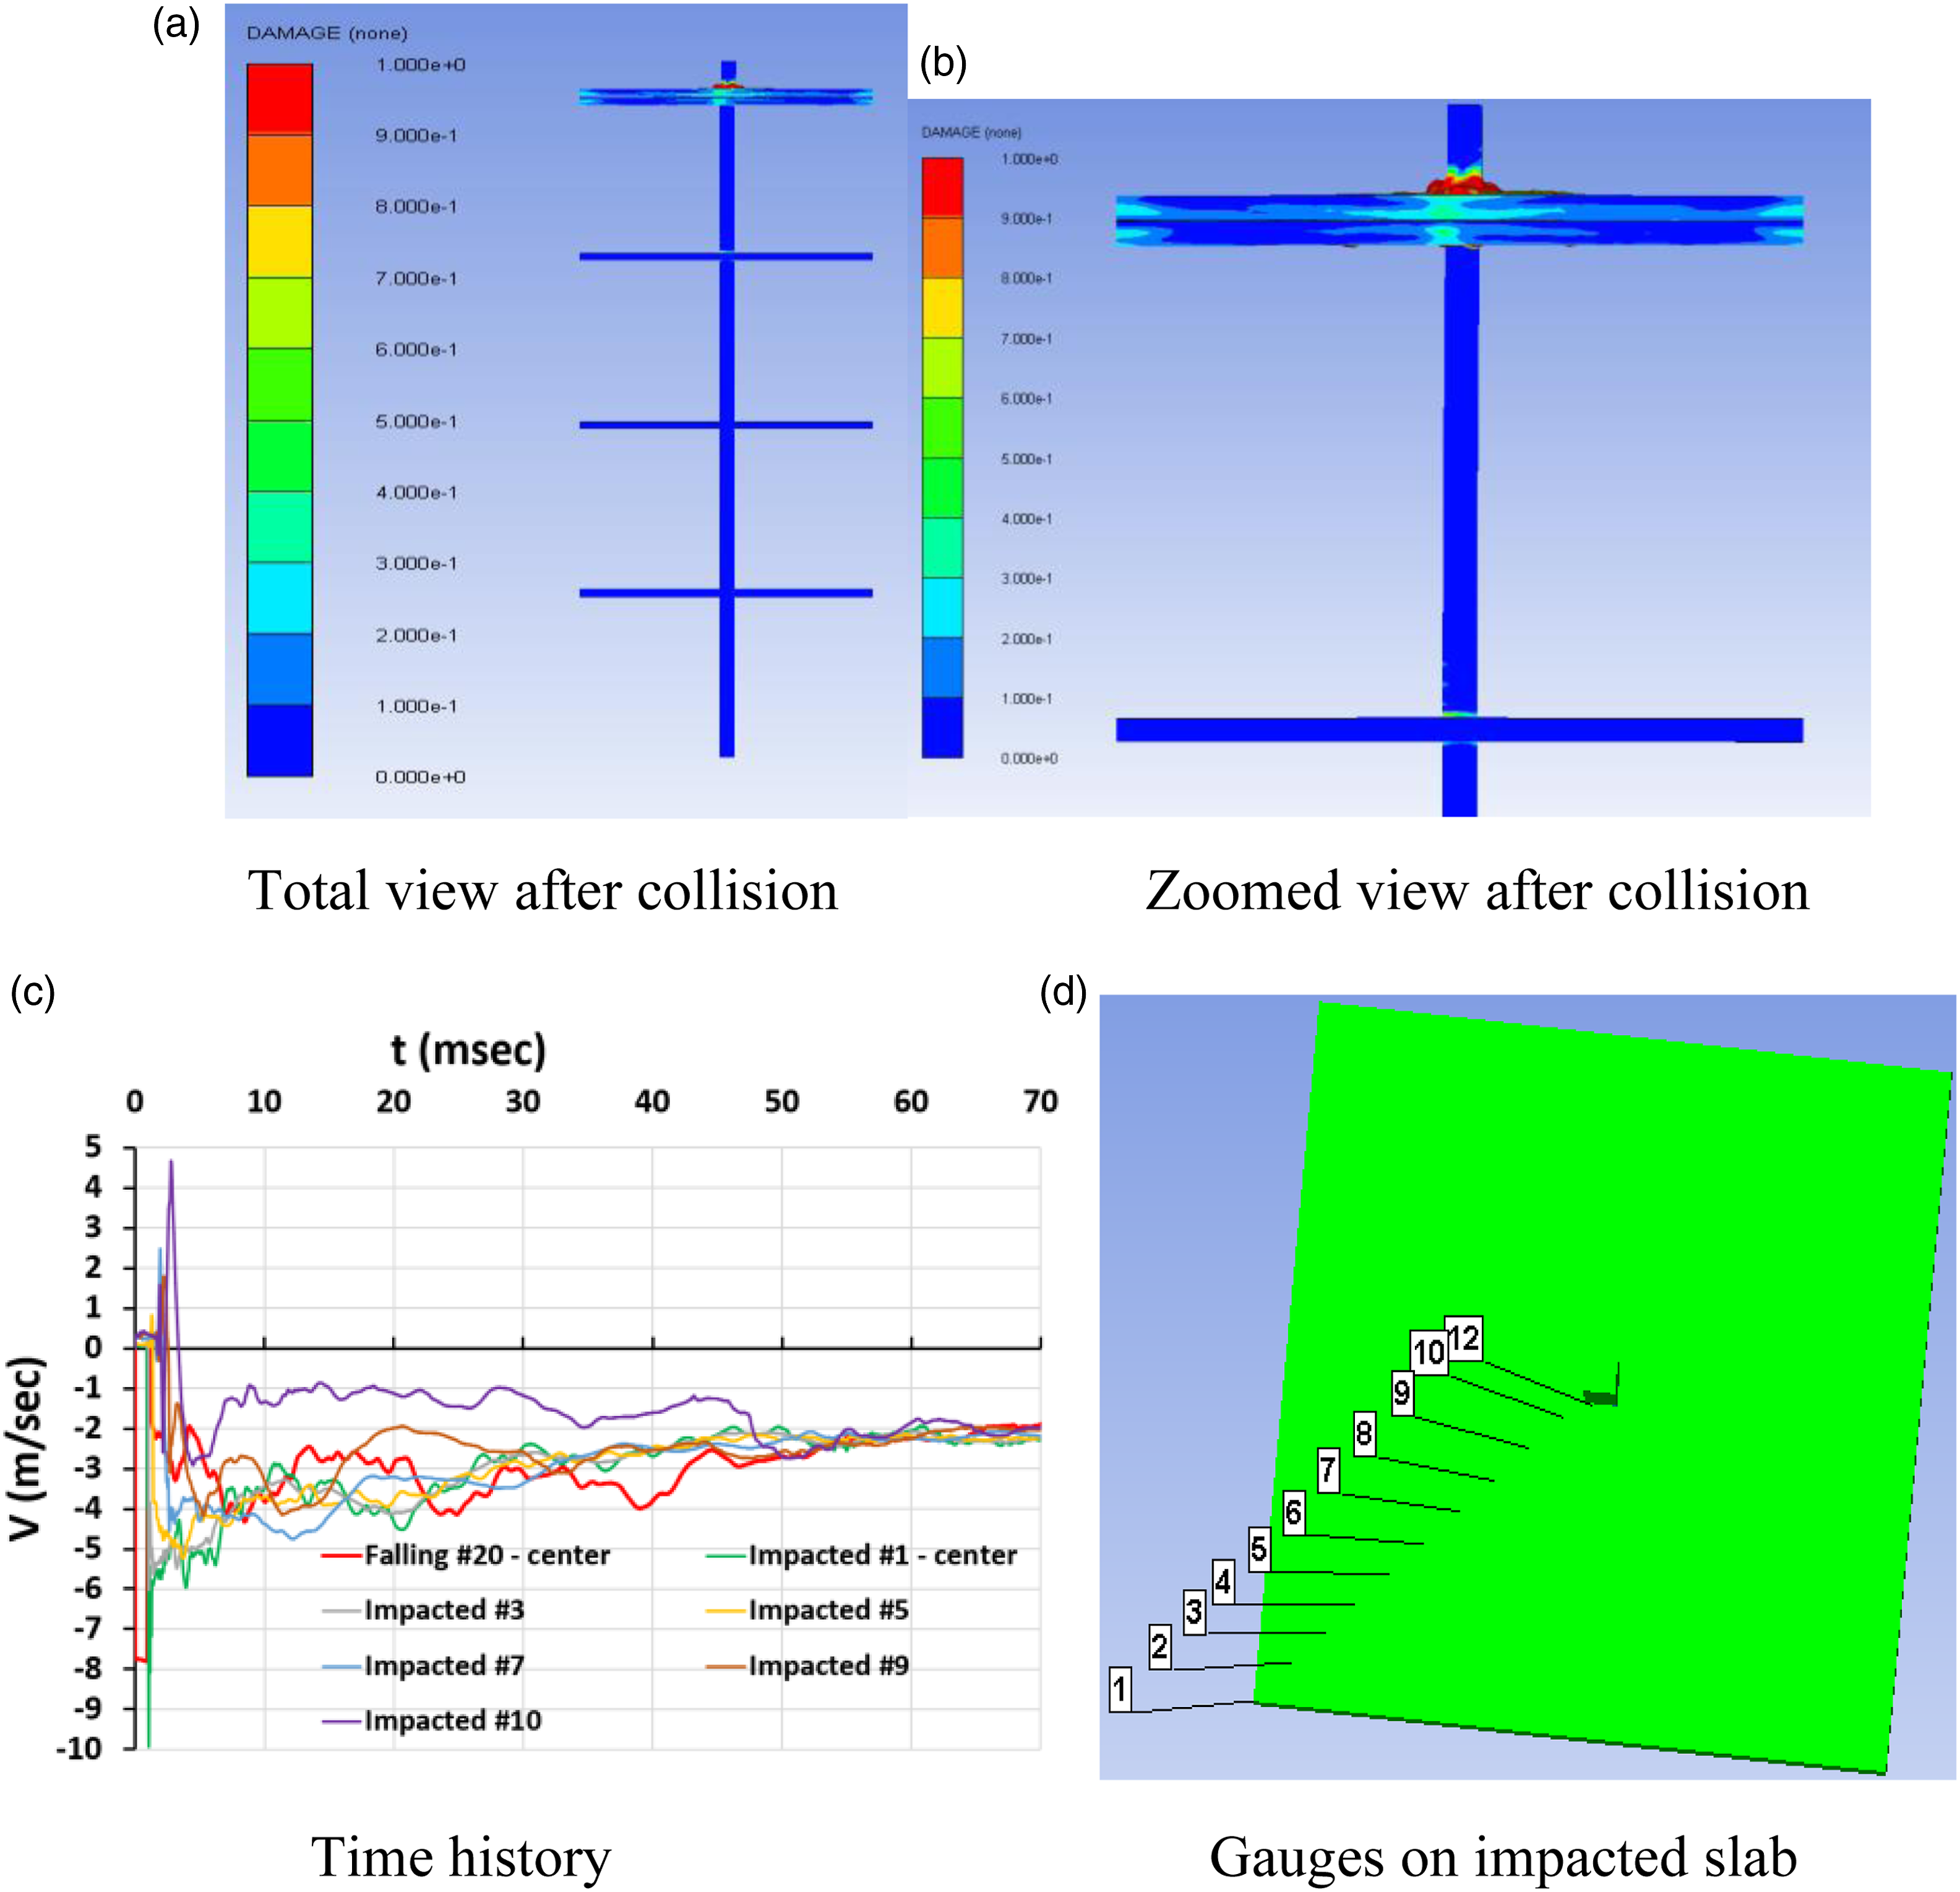
Figures 9(c) and (d) show that the velocity-time histories of almost all points marked on the impacted slab (Figure 9(d)) are similar from an early time (about 10 ms) after impact, except for point #10 (which is very close to the column), however, even the response of that point merges with the other points response after ∼50 ms. The residual velocity after the connection failure is about 2 m/sec (Figure 9(c)).
The damage zone of the impacted slab affects the impact conditions of the subsequent impact event of the fourth level slab with the third level slab below, when the impacted slab in the present case becomes the impacting slab in the following impact event. Therefore, it is interesting to examine the damage of the slabs at the end of the present impact event.
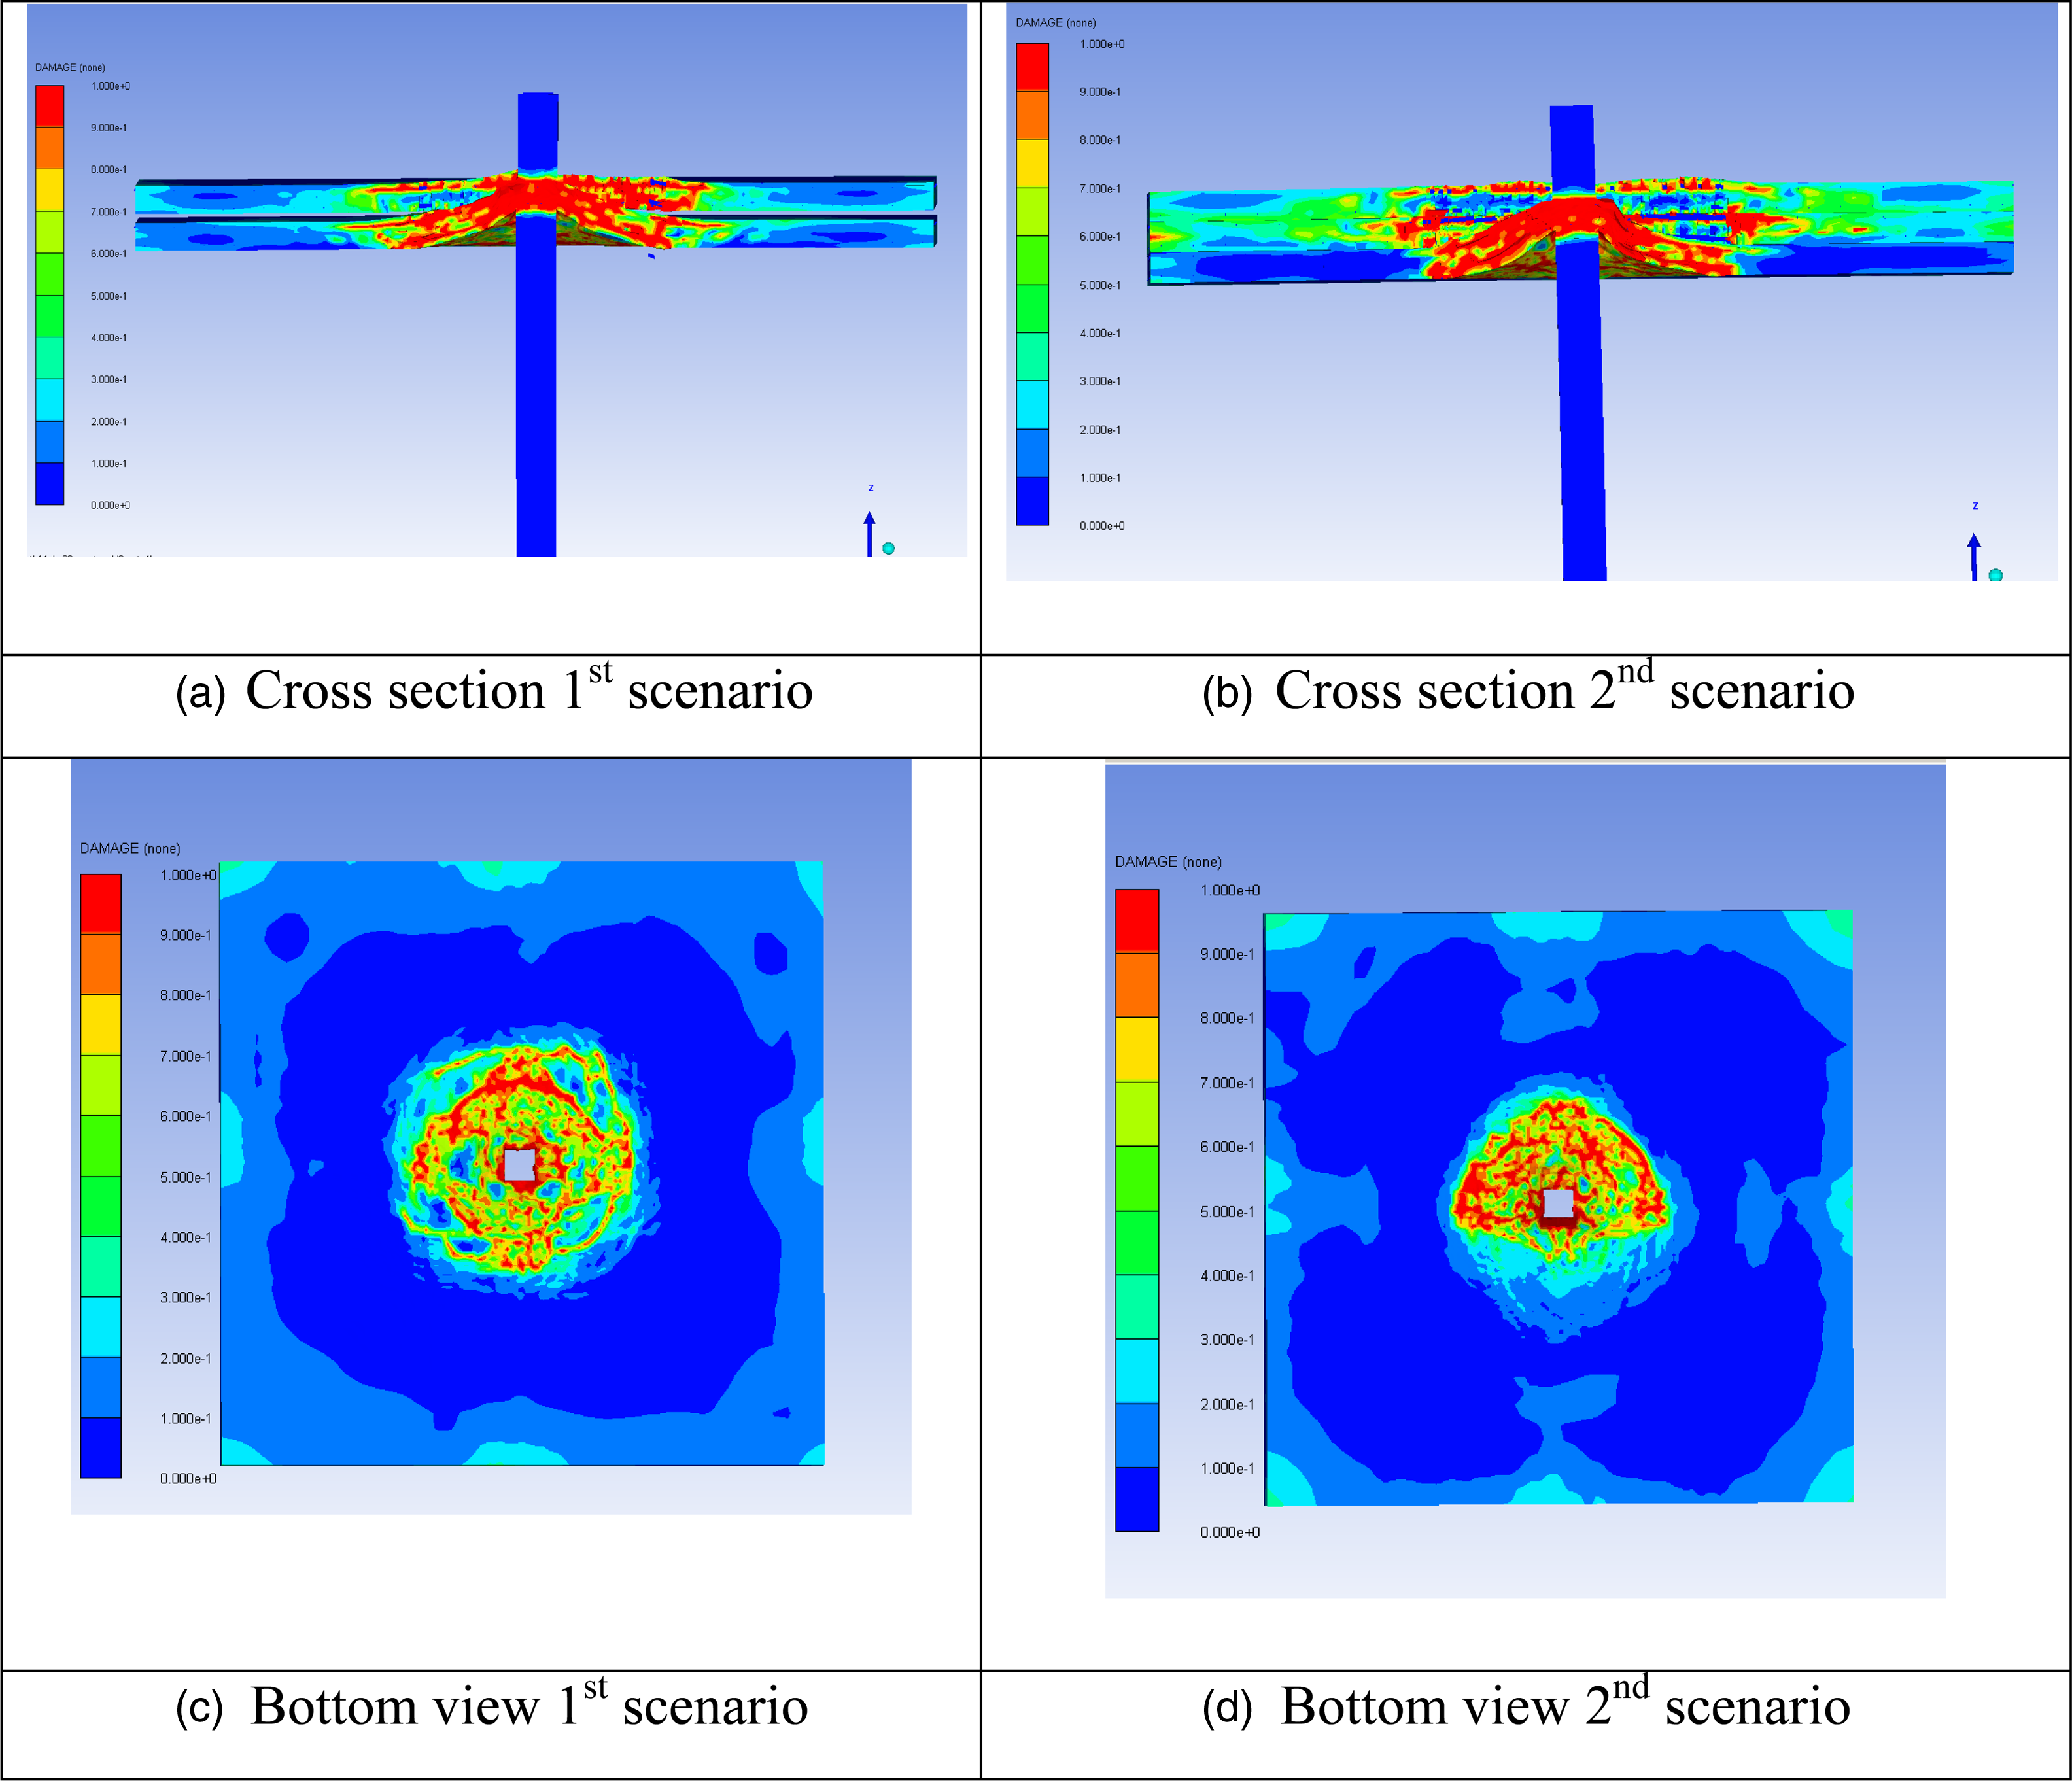
Figure 10(a) presents a three-dimensional top view of the impacted slab in the first scenario and Figure 10(b) shows a top view of the damage of the impacting slab in the second scenario. Figures 10(c) and (d) show the damage map at the bottom side of the impacted slabs in both scenarios. Although the top view (Figure 10(a)) shows a well-defined damage zone around the column in the first scenario, the bottom damage map shows wide damaged areas beyond the column zone. Damage in slabs after first impact event (a) top view - first scenario (b) top view – second scenario (c) Bottom damage map – first scenario (d) Bottom damage map – second scenario.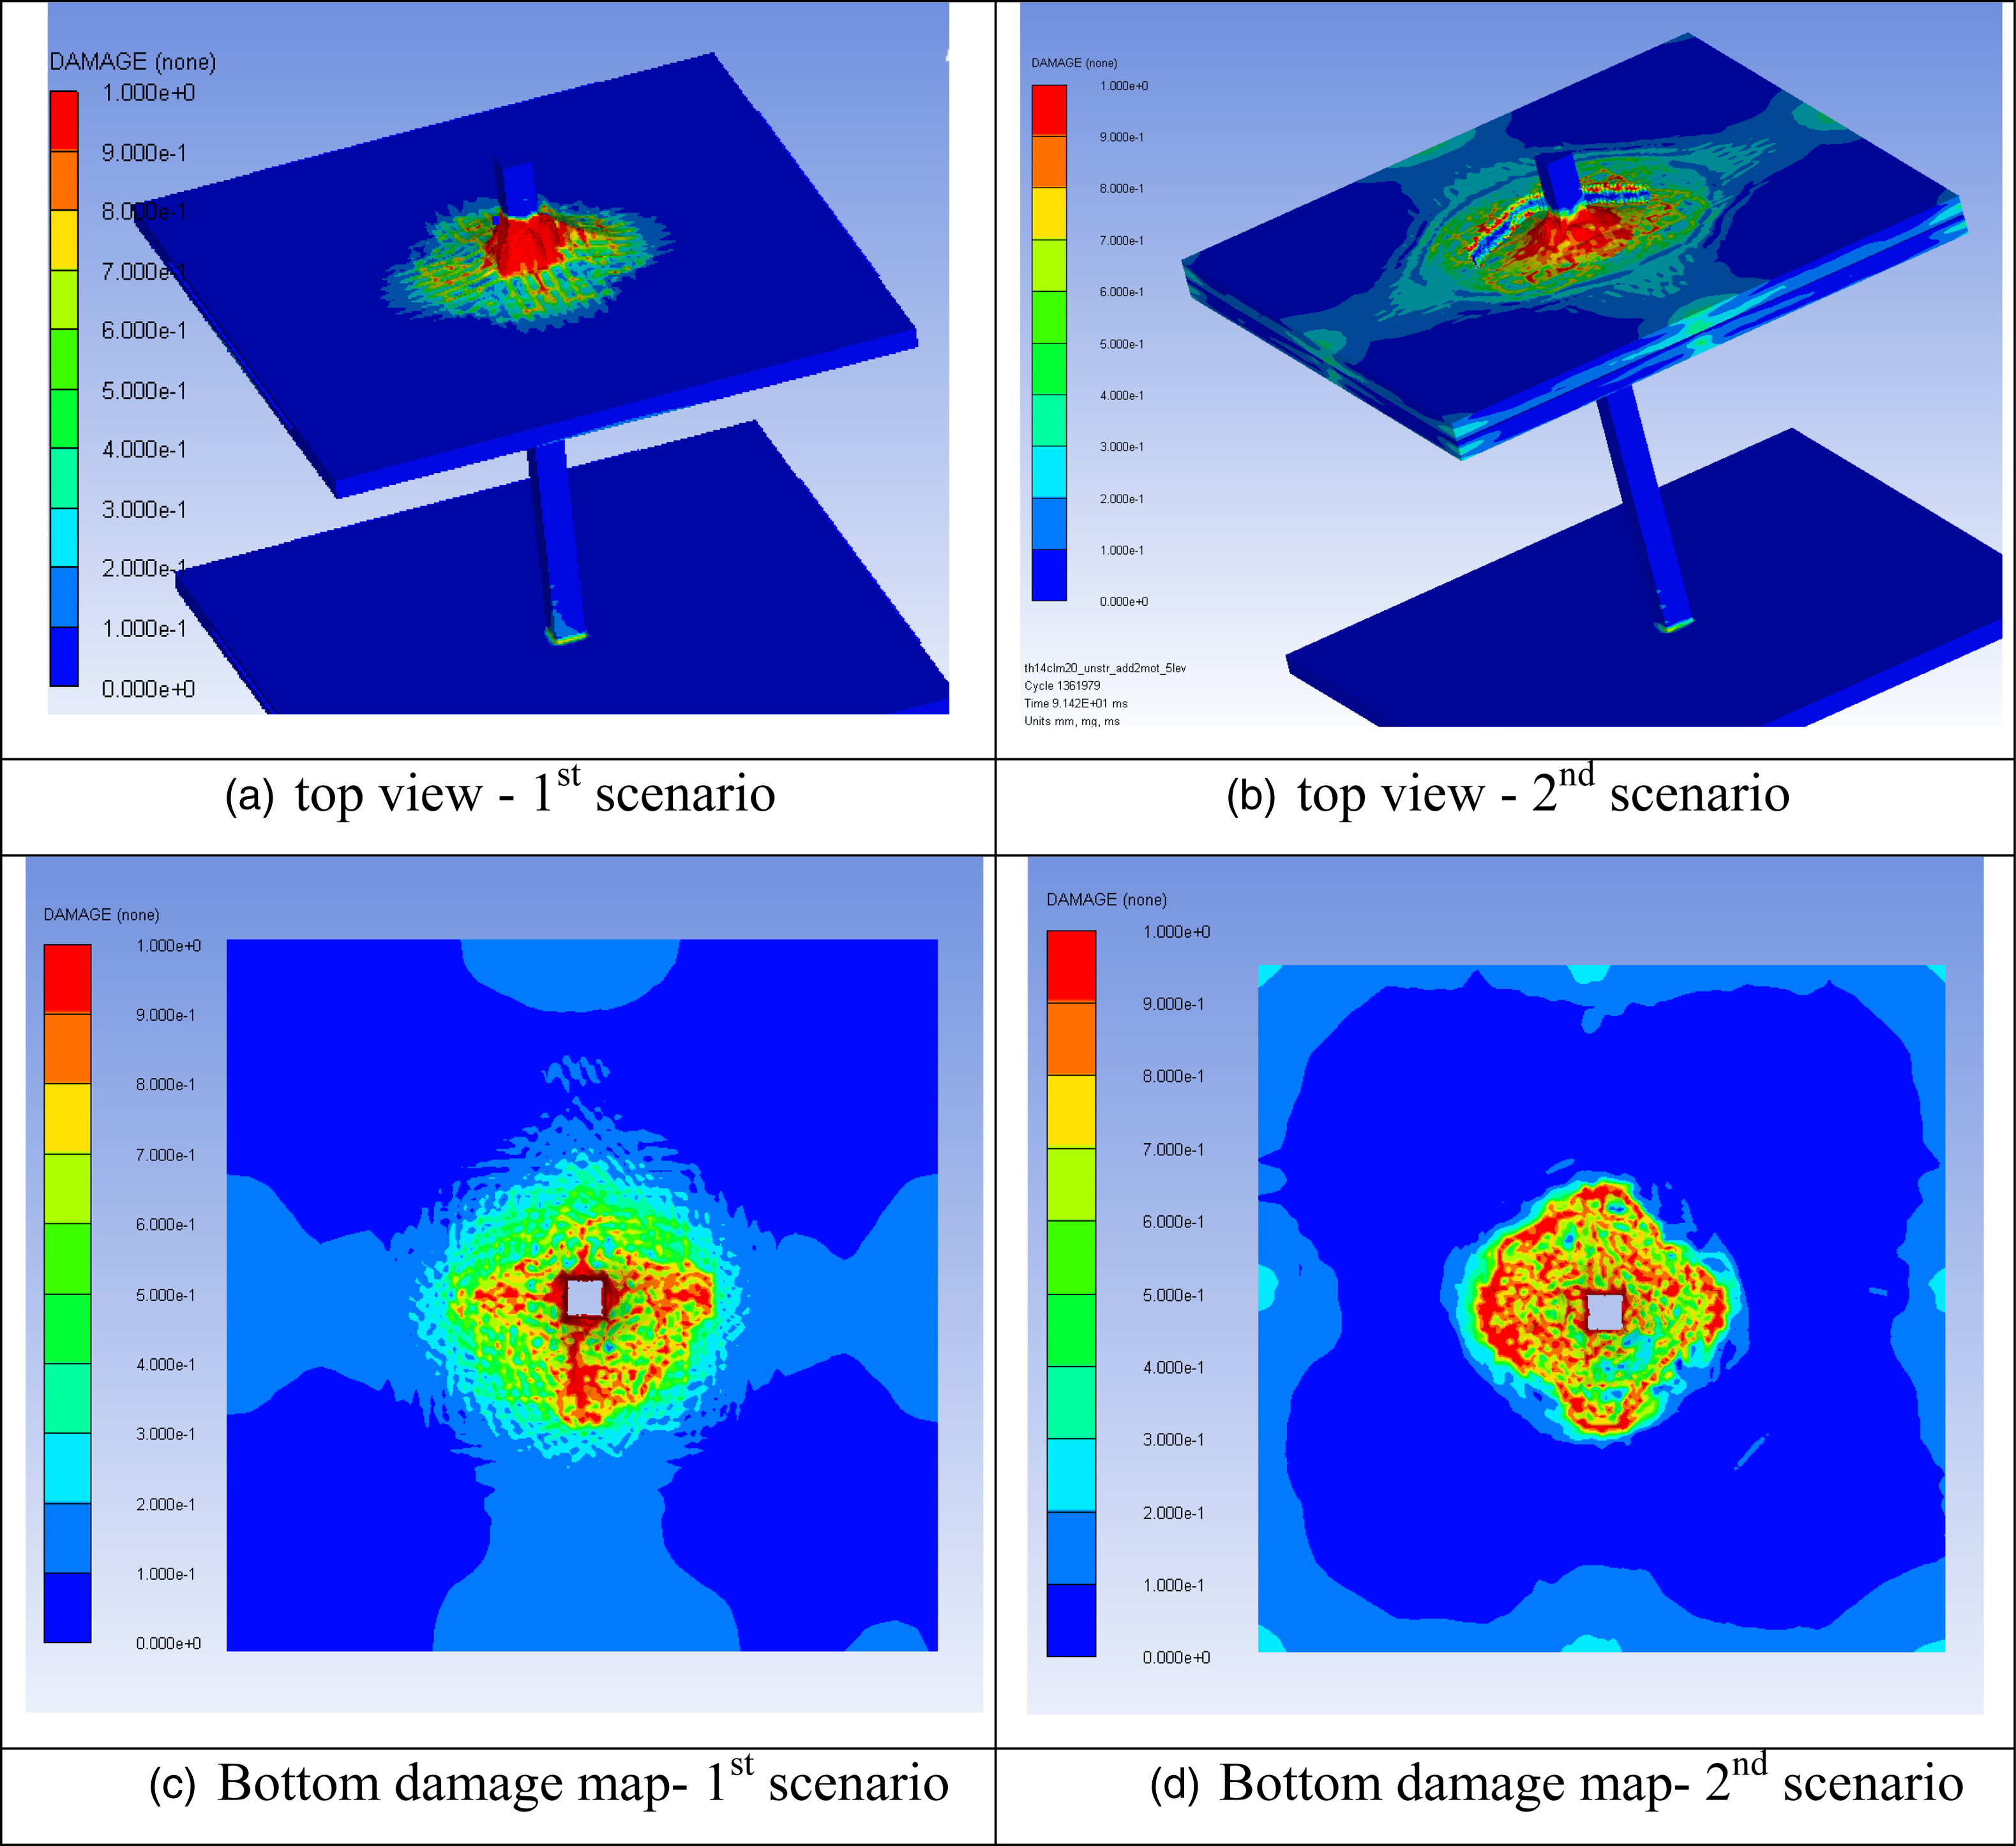
Appendix A provides more damage results for the first impact event.
Second impact event
Right after the first impact event of the fifth level slab with the fourth level slab, the status of the active slabs in the first impact is as follows:
- In the first scenario, the fifth level slab is positioned at about the original level of the fourth level slab after a minor vertical downward displacement, and it starts its free falling downward from that level with a zero initial velocity. During that time, the fourth level slab has been displaced by about 1.5 slab thickness downward, its connection with the column has failed, it has developed a damaged zone, and it is starting its motion downward with an initial velocity of 5 m/s.
The fourth level slab motion toward the third level slab lasts 0.4 s and its final velocity prior to impact with the third level slab is 9 m/s, that is higher than the impact velocity between the fifth and fourth level slabs.
During that time, the fifth level slab has travelled 0.8 m from its impact position with the fourth level slab and gained a velocity of 4 m/s (Figure 11). Second impact event—velocity-time histories and gauge locations (a) first scenario (b) second scenario (c) first scenario - gauges in impacted slab (d) second scenario – gauges in impacted slab.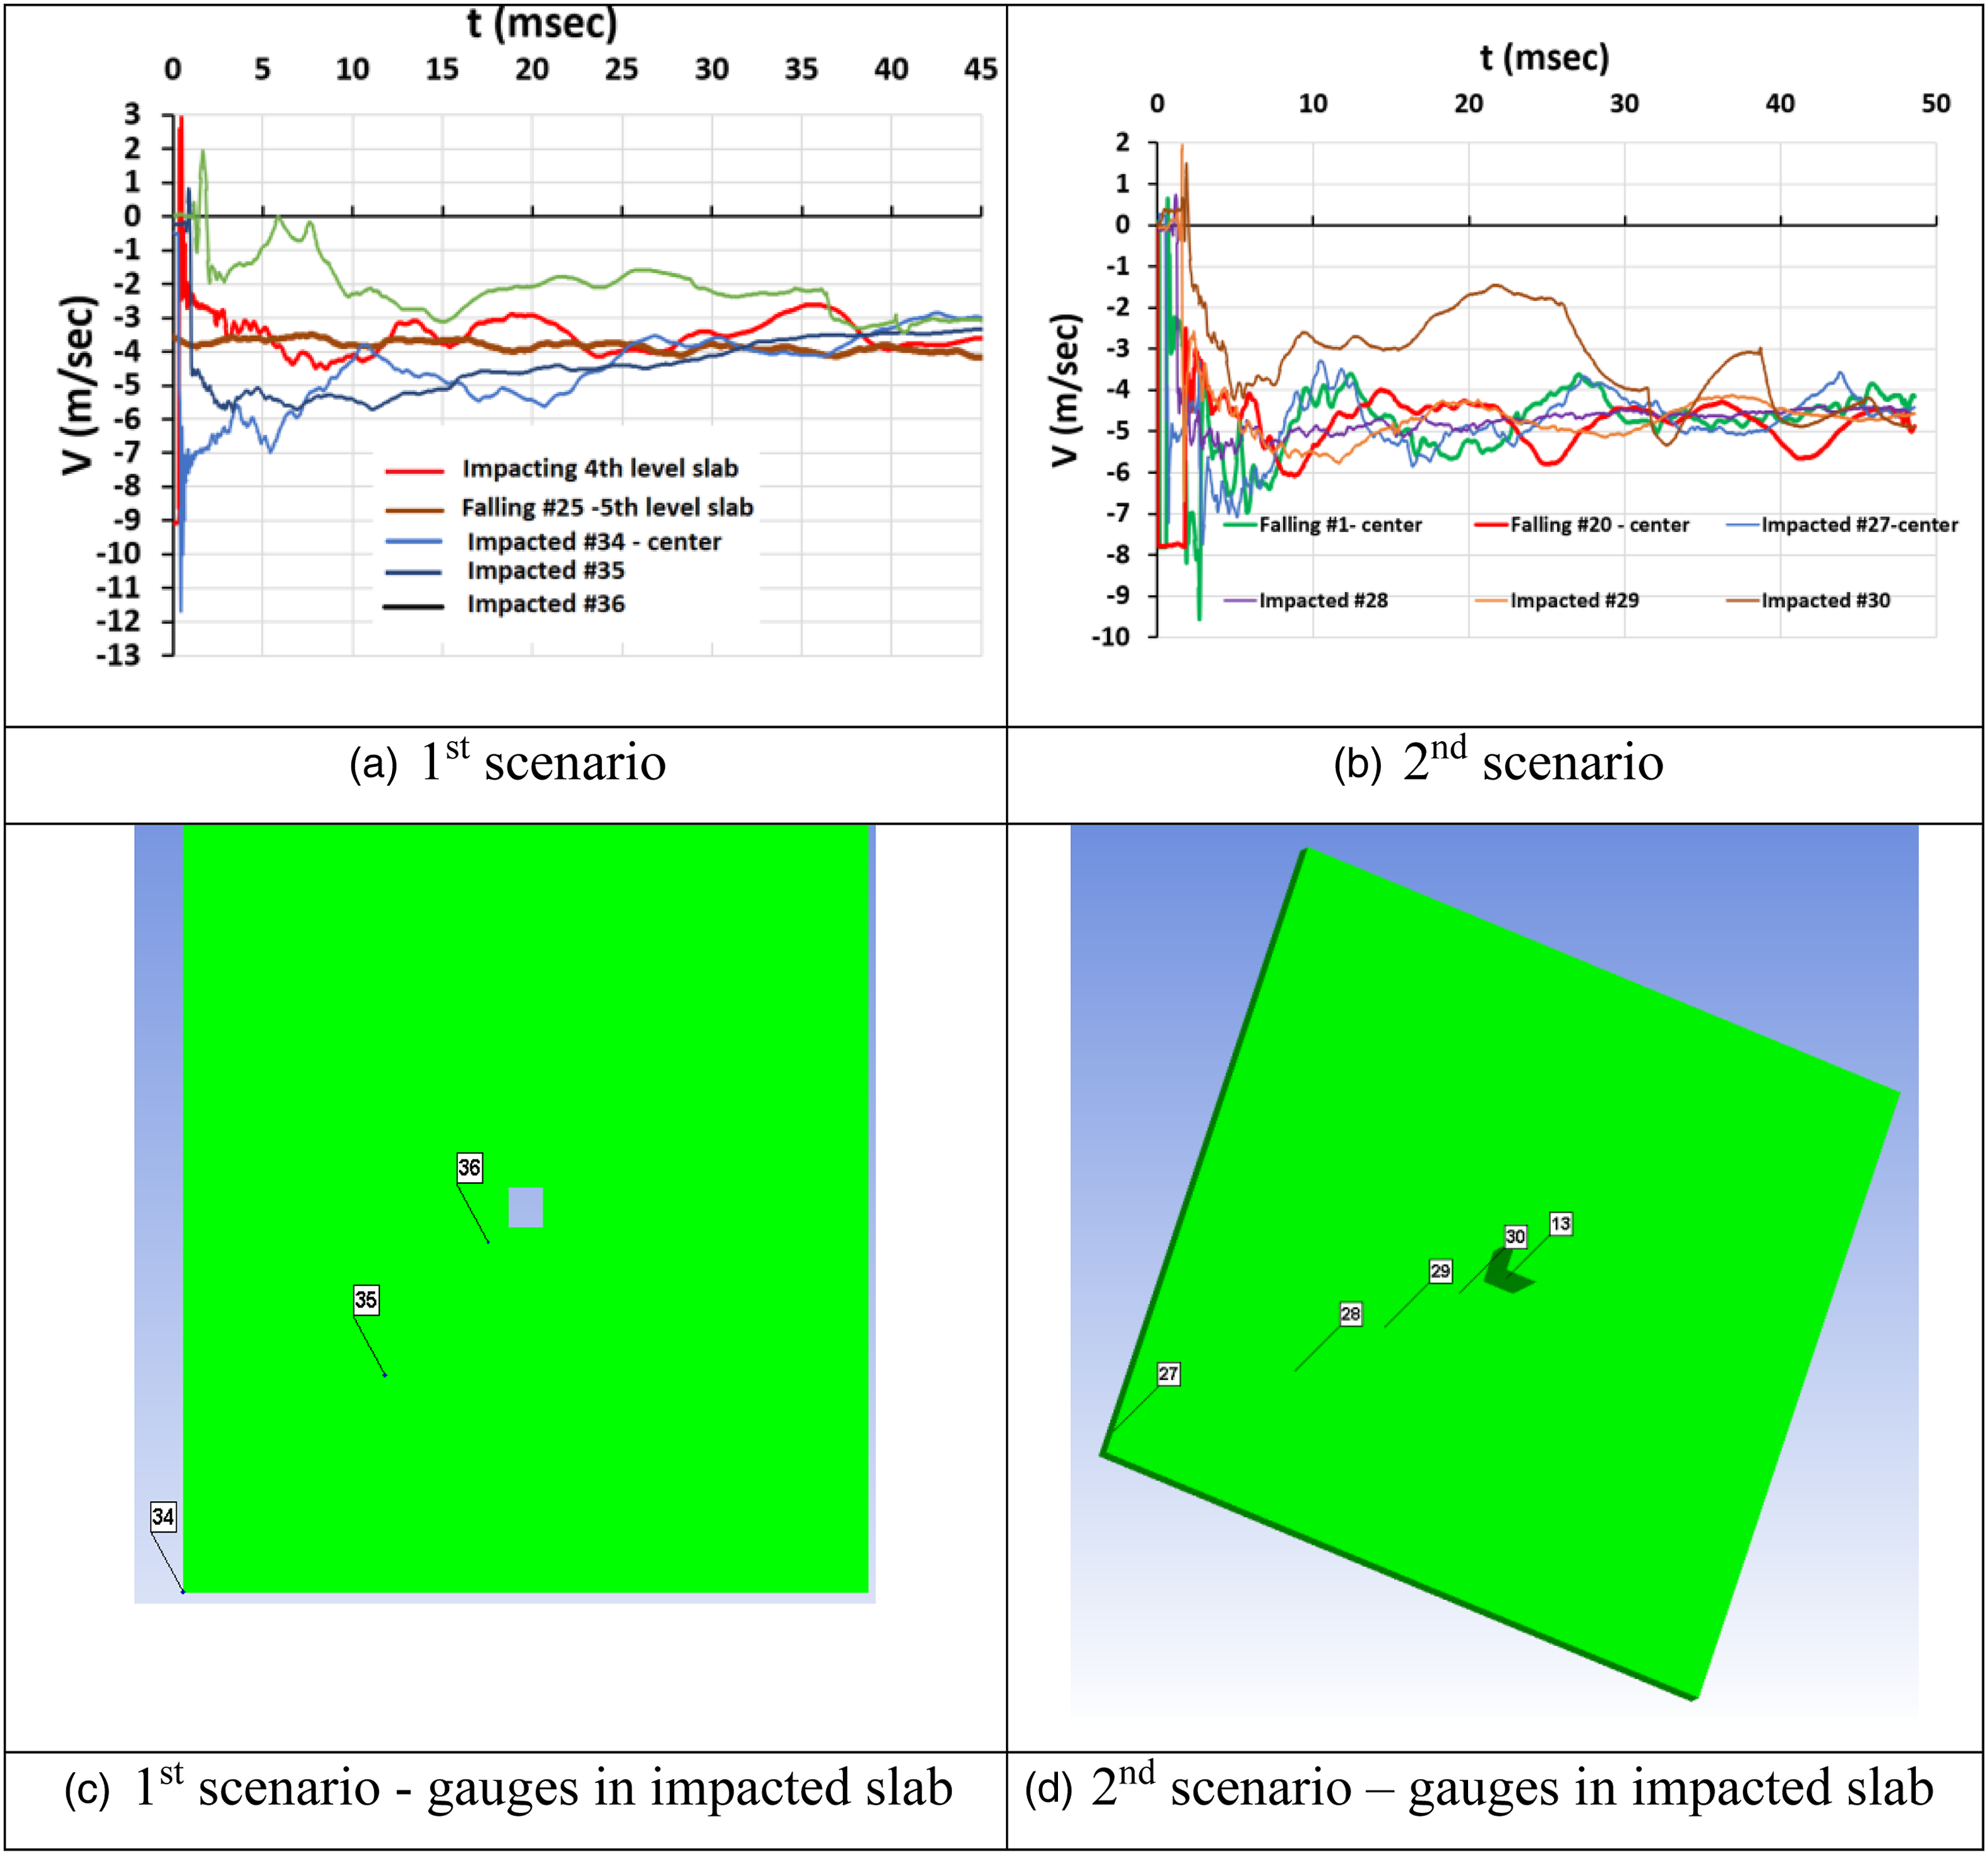
- In the second scenario, the fifth level slab and the fourth level slab are positioned slightly below the original position of the fourth level slab, the connection of the fourth level slab with the column has failed, both slabs are damaged and are starting their joint motion downward at a common initial velocity of 2 m/s.
The fifth and fourth level slabs motion toward the third level slab lasts 0.58 s, and prior to impact with the third level slab these slabs reach a final velocity of 7.75 m/s.
With these conditions a second impact occurs with the third level slab. Figures 11(a), (b) show the velocity-time histories for the two scenarios. Figure 11(a) refers to the first scenario and shows the velocity-time history of the fifth level slab center (point #25) and the fourth level slab center (point#14) compared to several representative points (#34–36) of the third level slab where #34 represents the slab central point (point A in Figure 1(a)) and #36 represents a point that is close to the column circumference (Figure 11(c)). While all the points except for #36 respond similarly from about 25 ms after impact, it takes about 40 ms until the response of point #36 merges with the other time histories and responds similarly to all other points. All points approach a residual velocity of 4.0 m/s.
Figure 11(b) refers to the second scenario and shows the velocity-time histories of the fourth and fifth level slabs centers (points #1, #20) compared to several third level slab representative points (#27–30) where #27 represents the impacted slab central point (point A in Figure 1(a)) and #30 represents a point that is close to the column circumference (Figure 11(d)). While all the points except for #30 respond similarly already from about 15 ms after impact, it takes about 40 ms until point #30 responds similarly to all other points and the residual velocity approaches 4.5 m/s.
Although the initial velocity of the fourth level slab after the first impact event in the first scenario (5 m/s) is 2.5 times larger than the initial velocity of the fifth and fourth level slabs in the second scenario, the final velocity, prior to impact with the third level slab, in the first scenario, is 1.16 times higher than that in the second scenario. Nevertheless, the momentum of the impacting slab in the first scenarios 0.58 of that in the second scenario, because in the latter the mass is twice larger. Therefore, the residual velocity after the second impact event in the second scenario is larger than that in the first scenario, as we can see in Figure (4 m/s and 4.5 m/sec for the first and second scenarios, respectively). In both scenarios, the slabs undergo plastic collisions accompanied with energy dissipation, after which the colliding slabs move together.
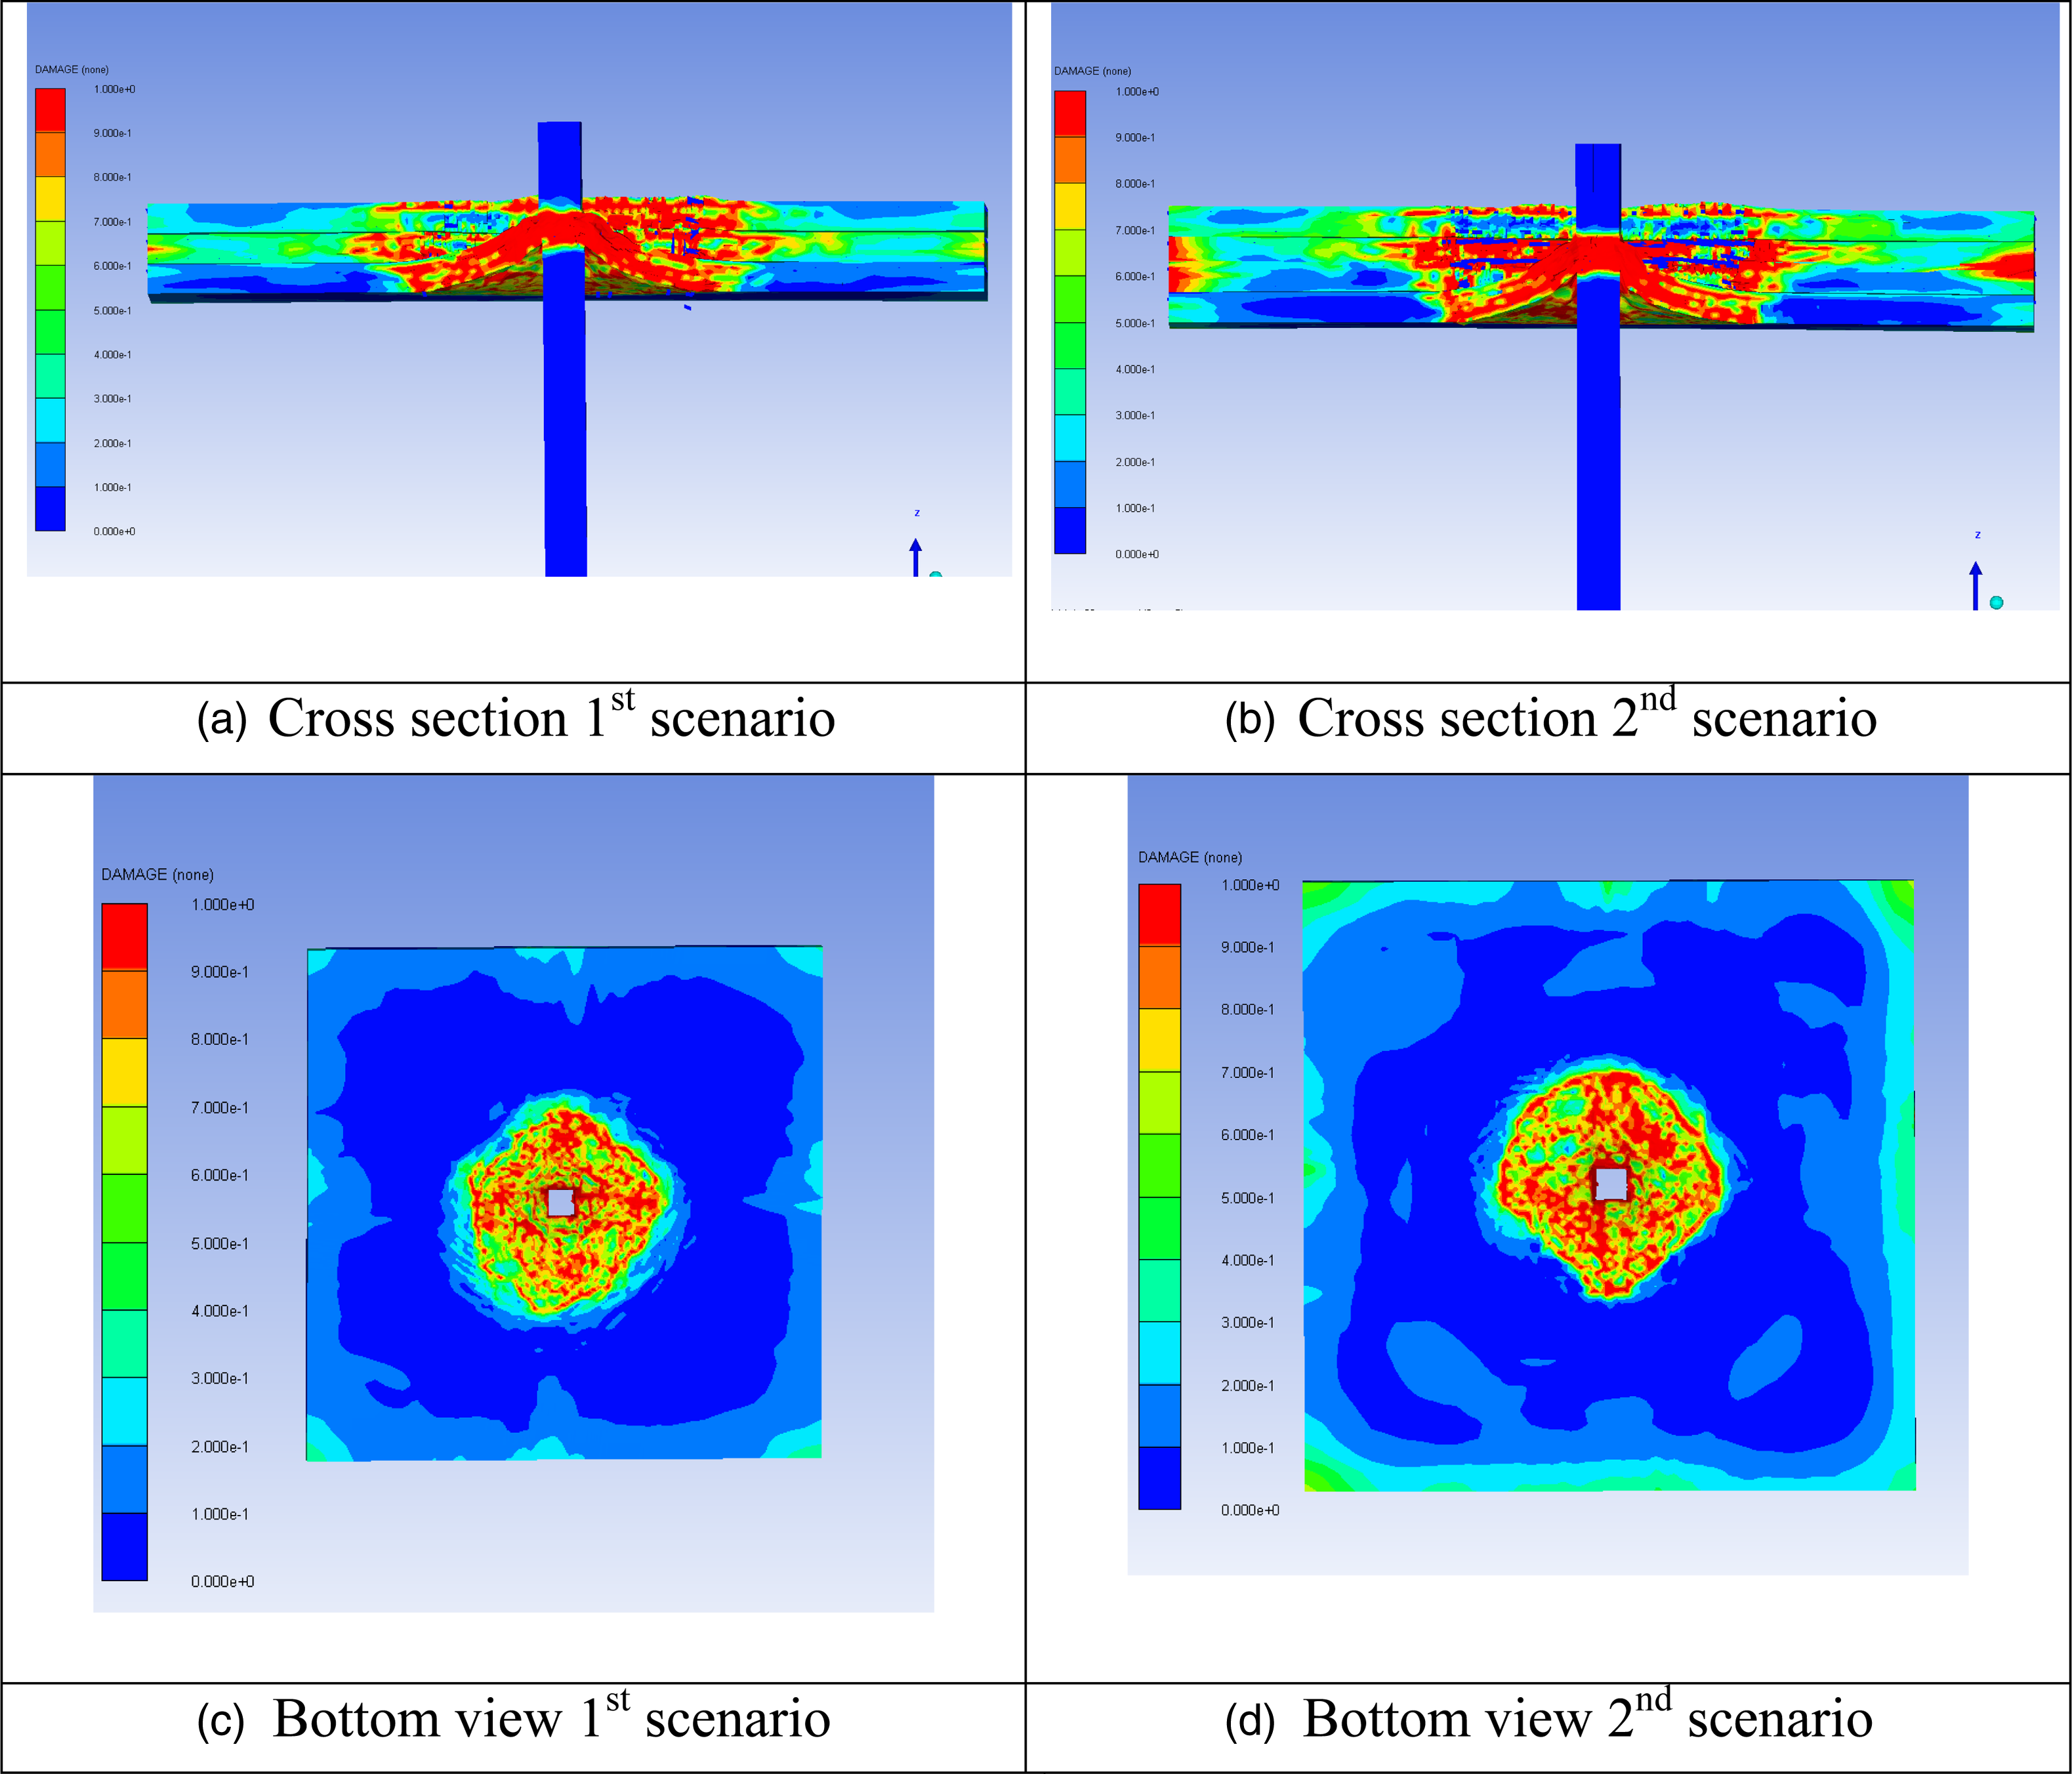
Appendix A provides more damage results for this impact event.
Third impact event
The residual velocities after the second impact event (4 m/s and 4.5 m/s for the first and second scenarios, respectively) are quite similar. In the first scenario, the fourth, and third level slabs arrive together at the second level slab at a velocity of 8.49 m/s. In the second scenario, the fifth, fourth, and third level slabs arrive together at the second level slab at a velocity of 8.73 m/s.
The impact velocities in the two scenarios are quite similar but the collisions conditions are different due to the different number of impacting masses. Therefore, the second scenario impact event will end with a higher residual velocity. The velocity-time histories in both scenarios are shown in Figure 12, ending with residual velocities of ∼4.5 m/sec in the first scenario and ∼6.1 m/sec in the second scenario. Third collision—time histories and gauges at the impacted slab (a) first scenario (b) second scenario (c) first scenario – gauges (b) second scenario – gauges.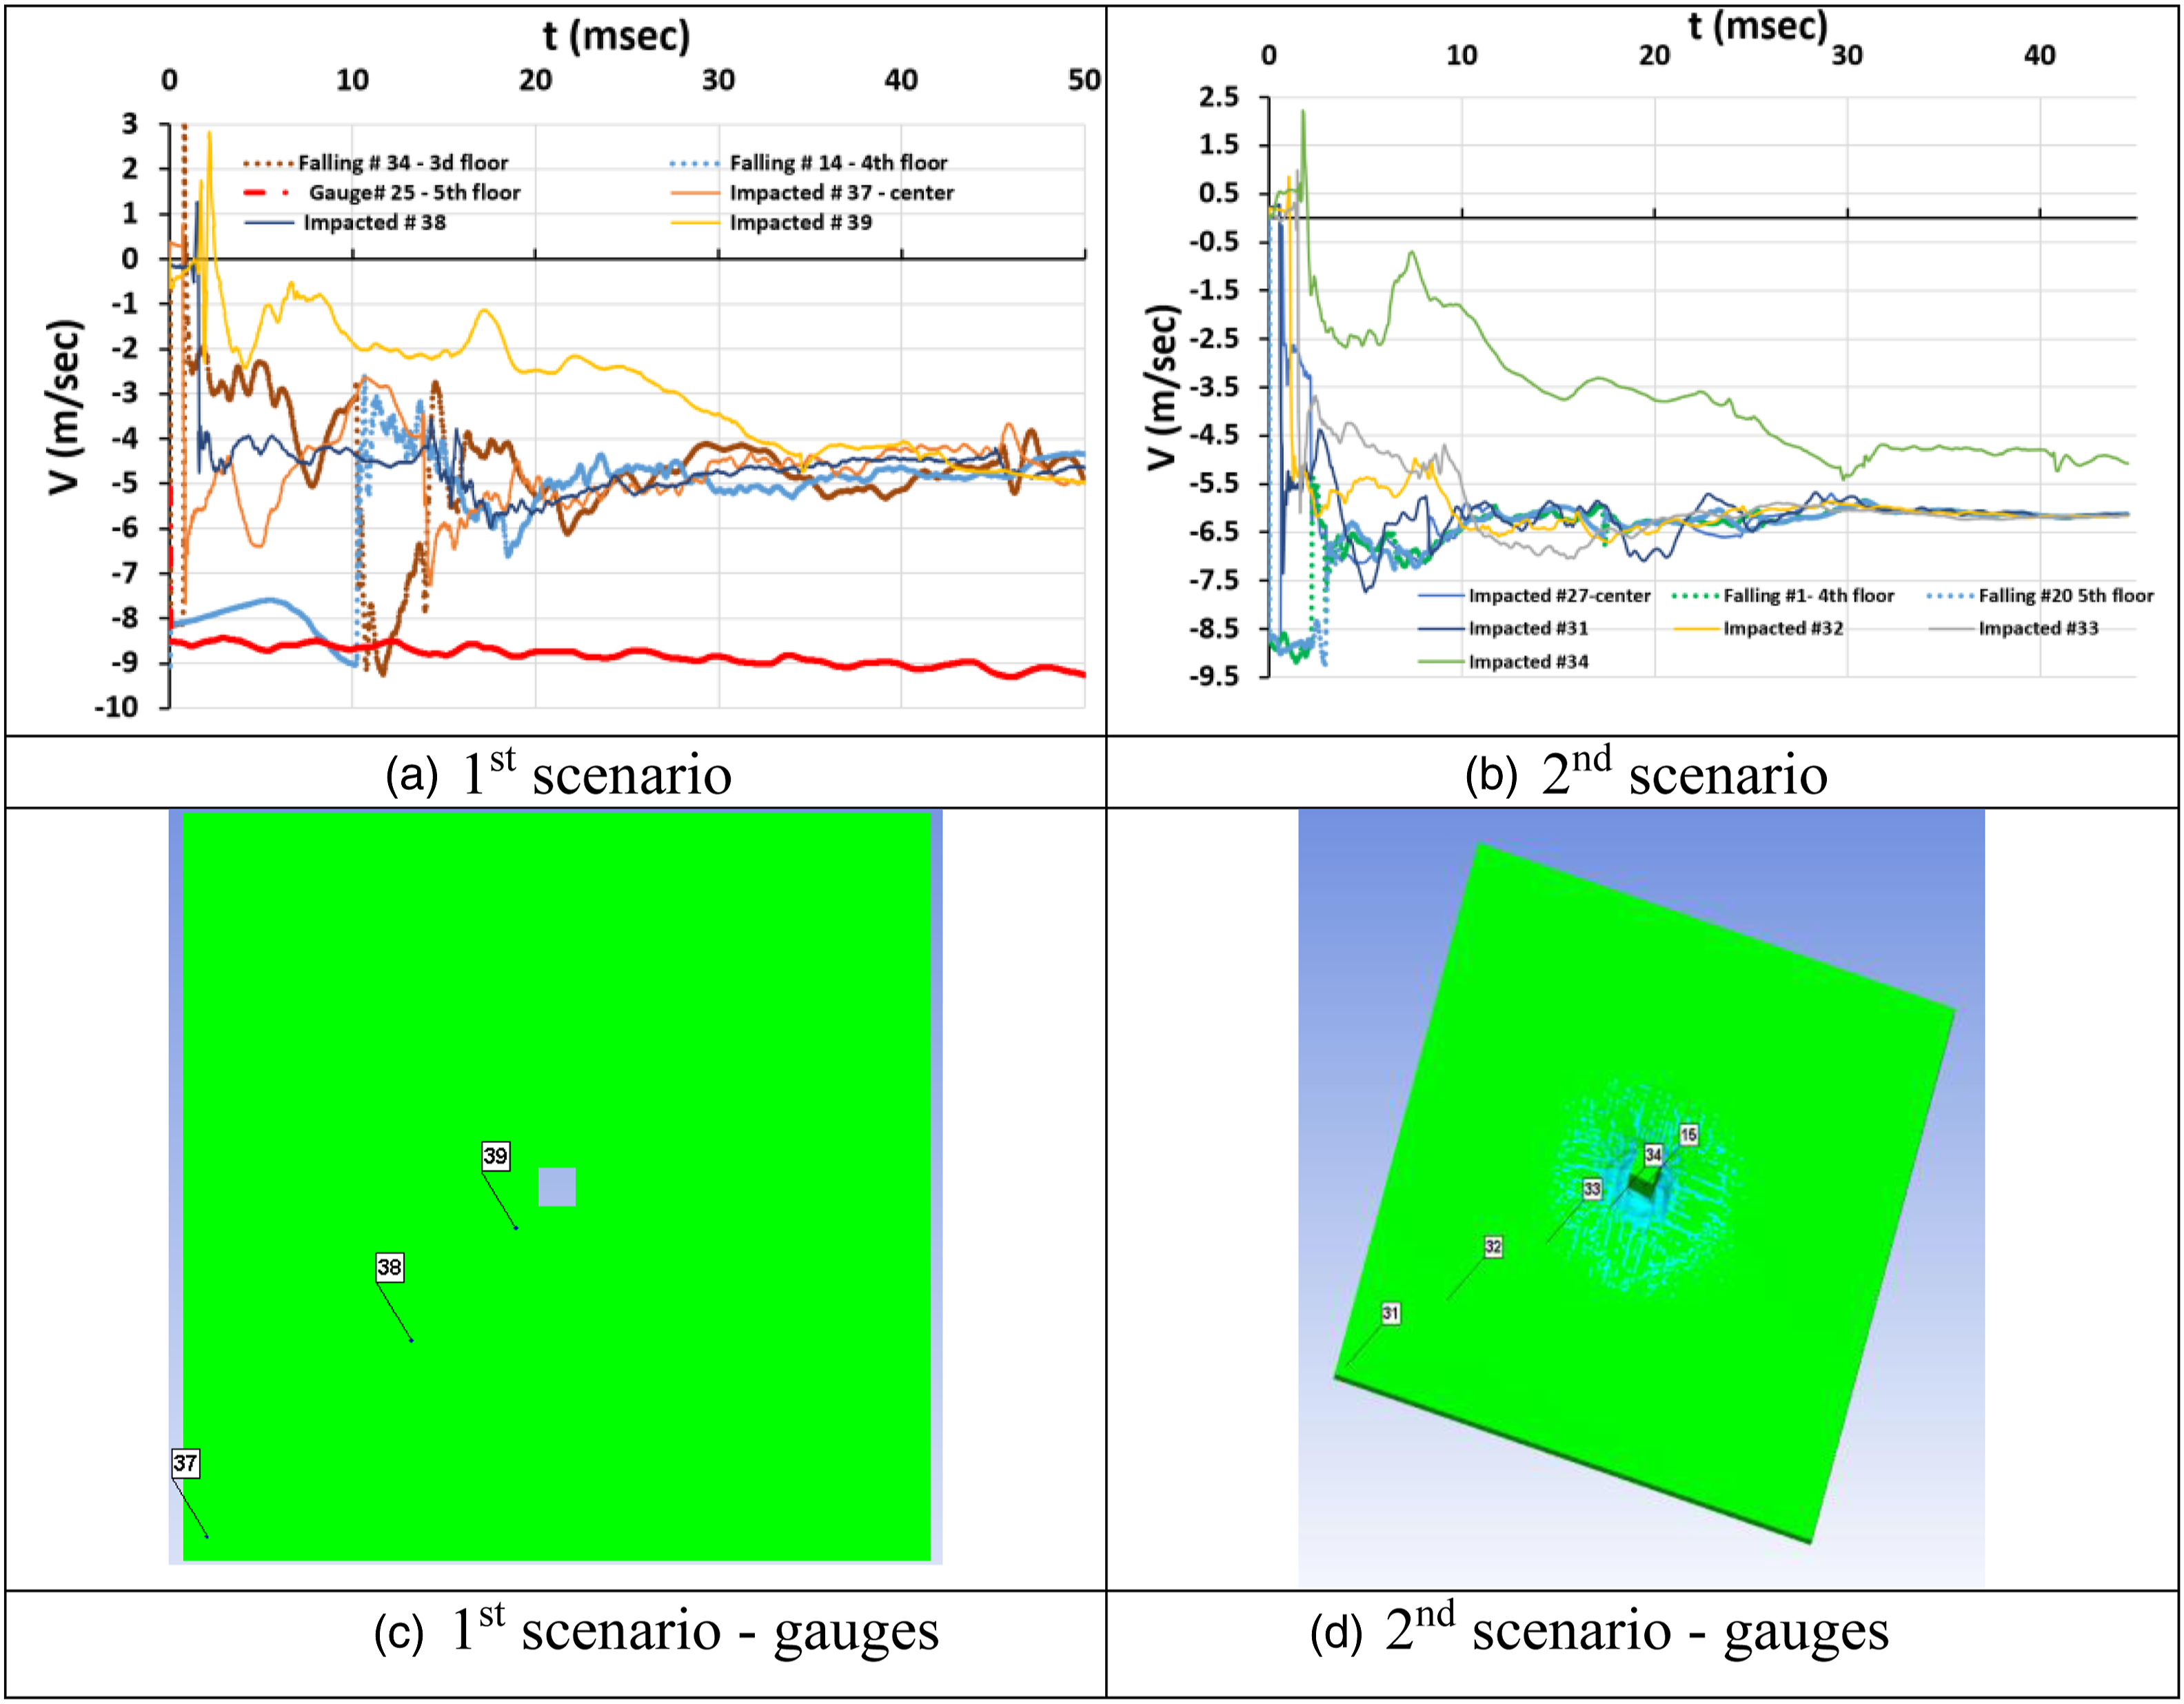
One may realize that the residual velocities in this impact event are higher than in the previous impact event. This is due to the increasing mass of the impacting cluster of slabs which are impacting a single slab at a time. Therefore, with increase of the number of impacting masses, the plastic collision ends with a higher residual velocity that moderately approaches the falling velocity of the cluster of slabs prior to impact.
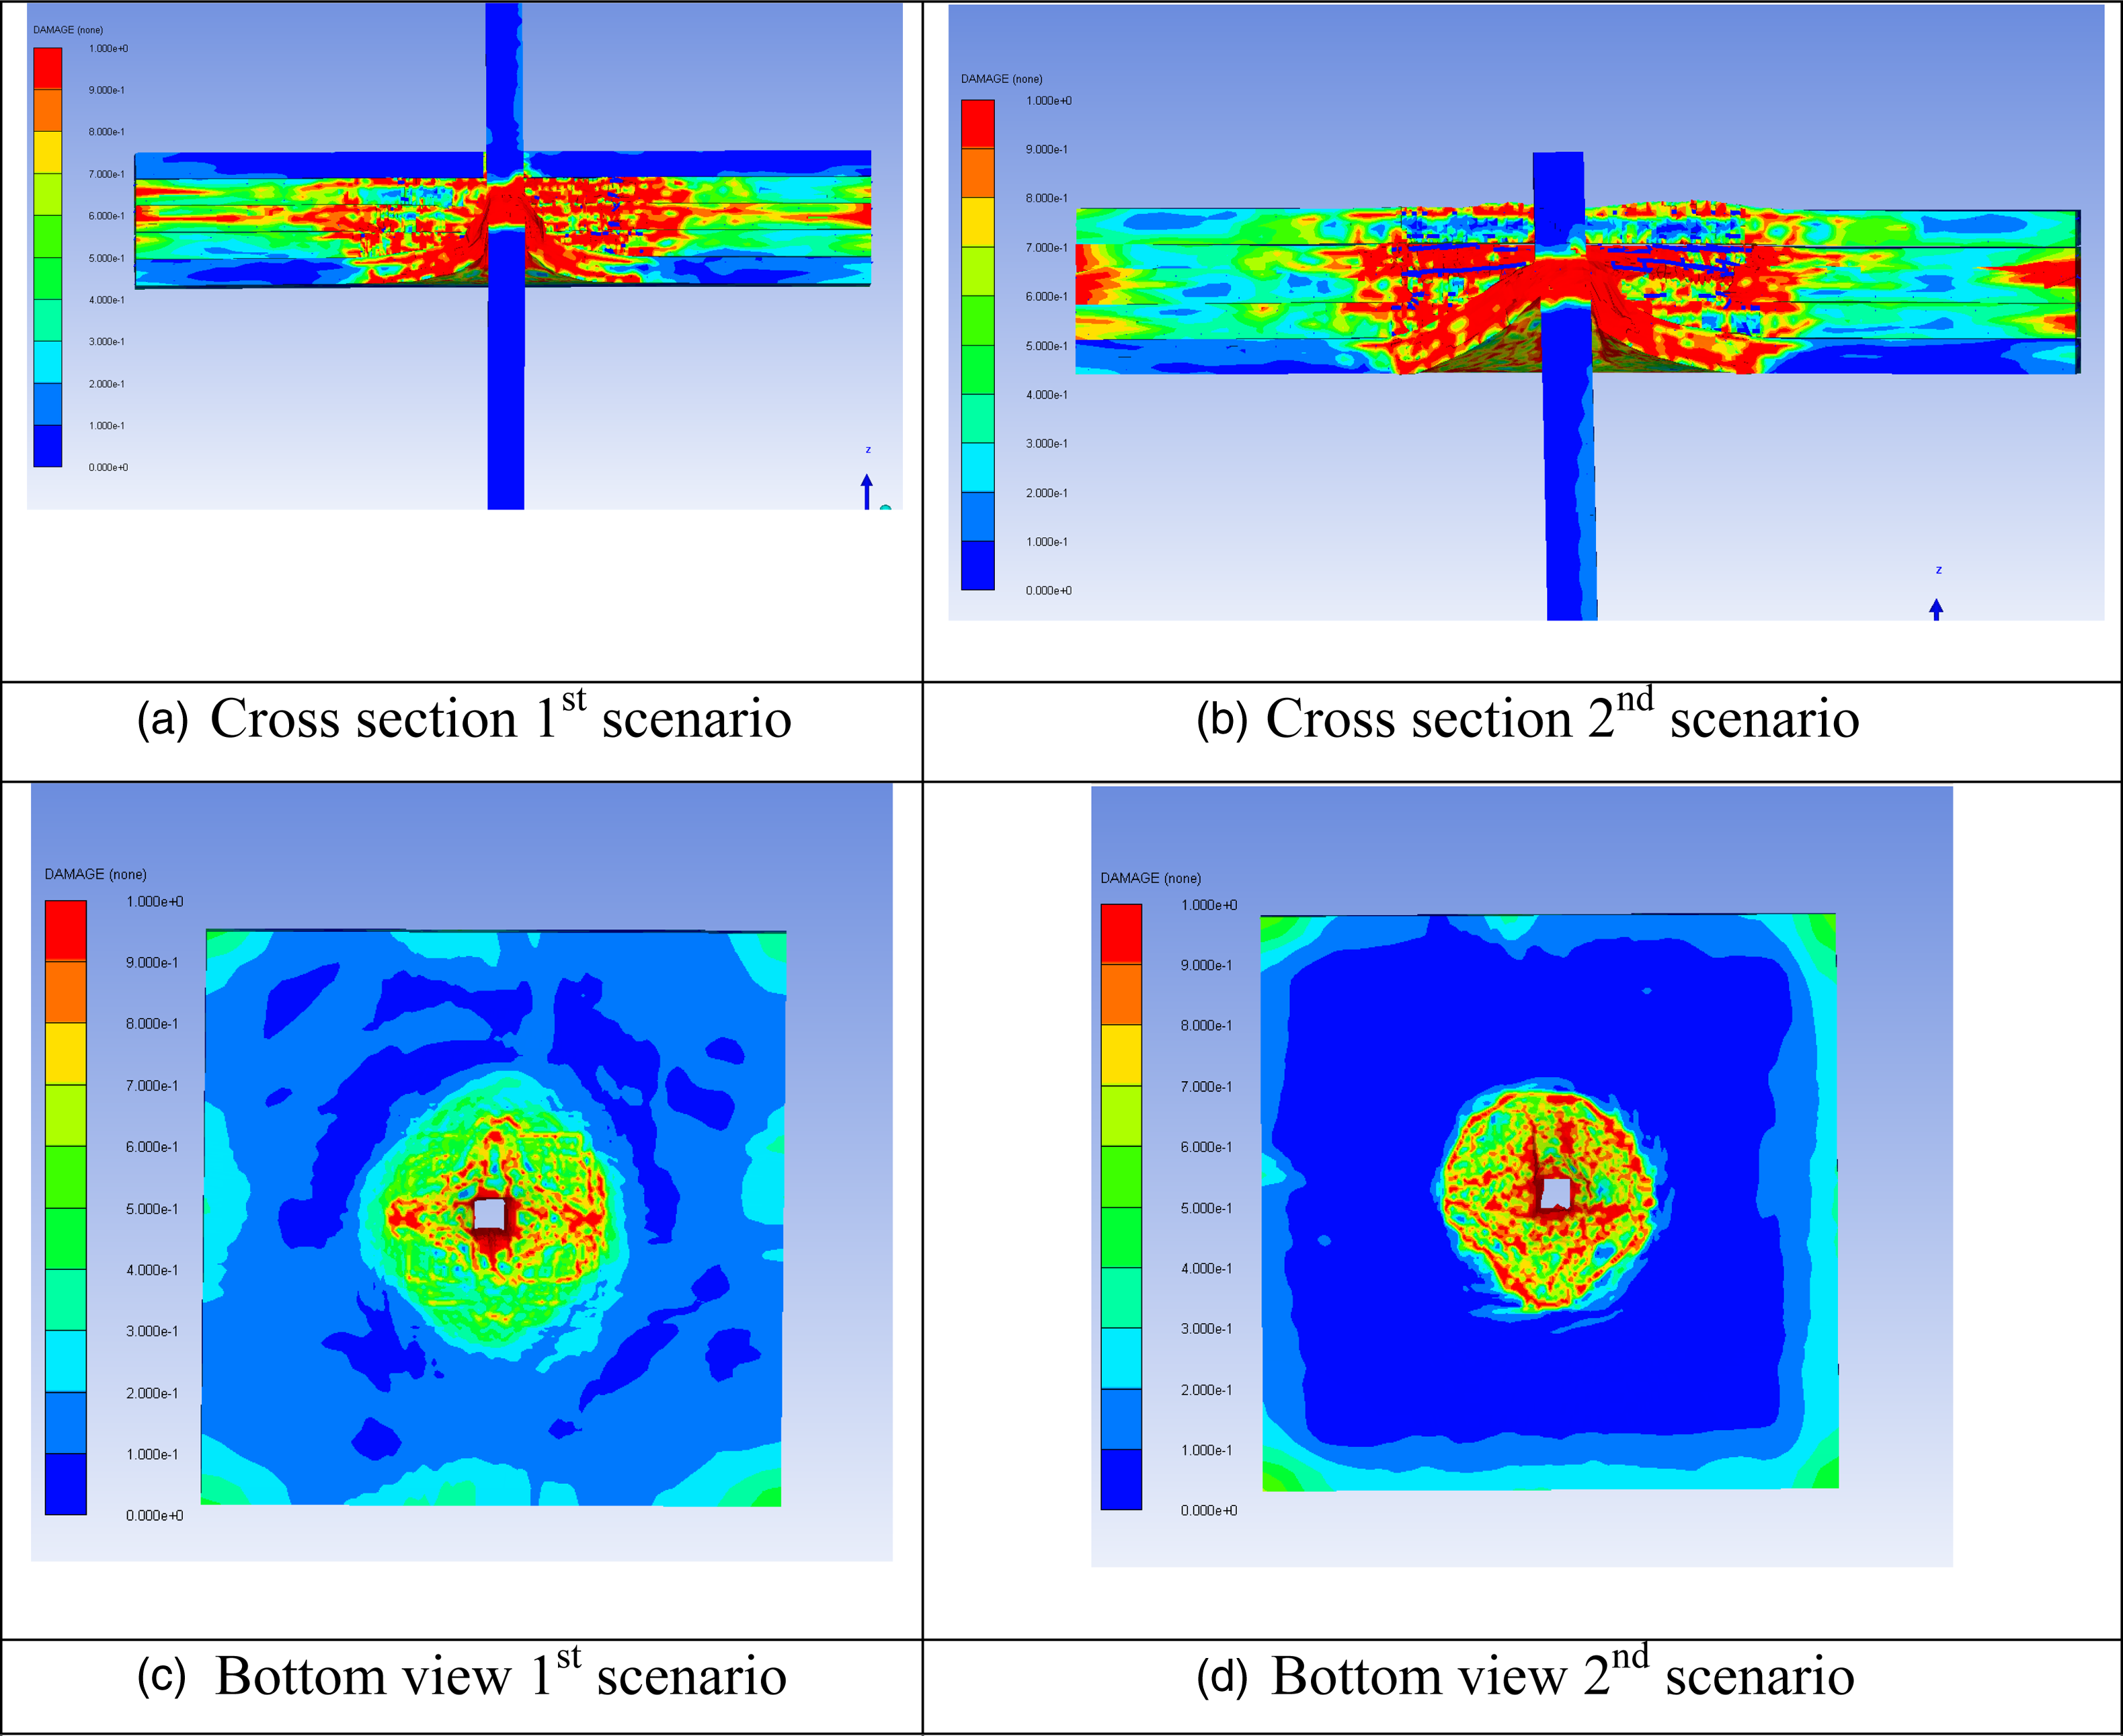
Appendix A provides more damage results for this impact event.
Intermediate impact
Before proceeding to the fourth impact with the first level slab, we should assess the entire situation of the slabs in both scenarios. In the second scenario, all slabs from above are falling together toward their impact with the first level slab, and in the following section this impact will be analyzed.
In the first scenario the situation is somewhat more complicated, as a cluster of three masses (fourth ,third, and second level slabs) are moving at a common increasing velocity, while the fifth level slab is moving separately behind. The cluster of masses with a residual velocity of 4.5 m/s will arrive at the first level slab at a velocity of 8.73 m/s prior to impact. At the same time, the fifth level slab is continuously increasing its velocity; at the time when the third impact event occurred, the velocity of the fifth level slab has increased to 8.9 m/s that exceeds the velocity of the slabs’ cluster prior to the fourth impact. Should the process continue as before, the free-falling slab would further increase its velocity and when the cluster of slabs will impact the first level slab, the velocity of the fifth level falling slab will further increase, and within the elapsed time of 1.353 s from the start of its falling it would travel downward a distance of 9.15 m, that is larger than the 9 m distance between the levels of the first impact and the fourth impact occurrences. That means that prior to the masses’ arrival at the first level slab, the fifth level falling slab will meet the cluster of slabs somewhere on their way between the second and the first levels, and an intermediate extra impact will occur. Analysis shows that this intermediate impact will occur 0.51 m above the first level, between the impacting slab (the fifth slab) with a velocity of 12.71 m/s and the cluster of the fourth, third, and second slabs at a common velocity of 7.91 m/s.
Figure 13(a) shows the velocity-time history during the intermediate impact. Opposed to all previous impact events this intermediate impact event lasts less than 10 ms, because no connection failure with the column is involved. All masses are in contact and continue moving as a cluster at a common velocity of ∼9.5 m/s (Figure 13(b)), and reach the first level slab at a velocity of 9.76 m/s. If the intermediate impact had not occurred, the impact velocity with the first level slab would have been 8.73 m/s. Anyway, this is the highest impact velocity during the entire progressive collapse process described above. Intermediate impact event.
Fourth impact event
The fourth impact event in both scenarios occurs between four slabs moving together at a common velocity and the first level slab. In the first scenario, the impact velocity is 9.76 m/s. The velocity-time history of this impact event is shown in Figure 14(a), which follows the velocity at representative slabs of the fifth, fourth, third, and second level slabs as well as with representative points along the diagonal of the impacted first level slab (Figure 14(c)). Fourth impact event—time histories and gauges at the impacted slab (a) first scenario (b) second scenario (c) first scenario – gauges (b) second scenario – gauges.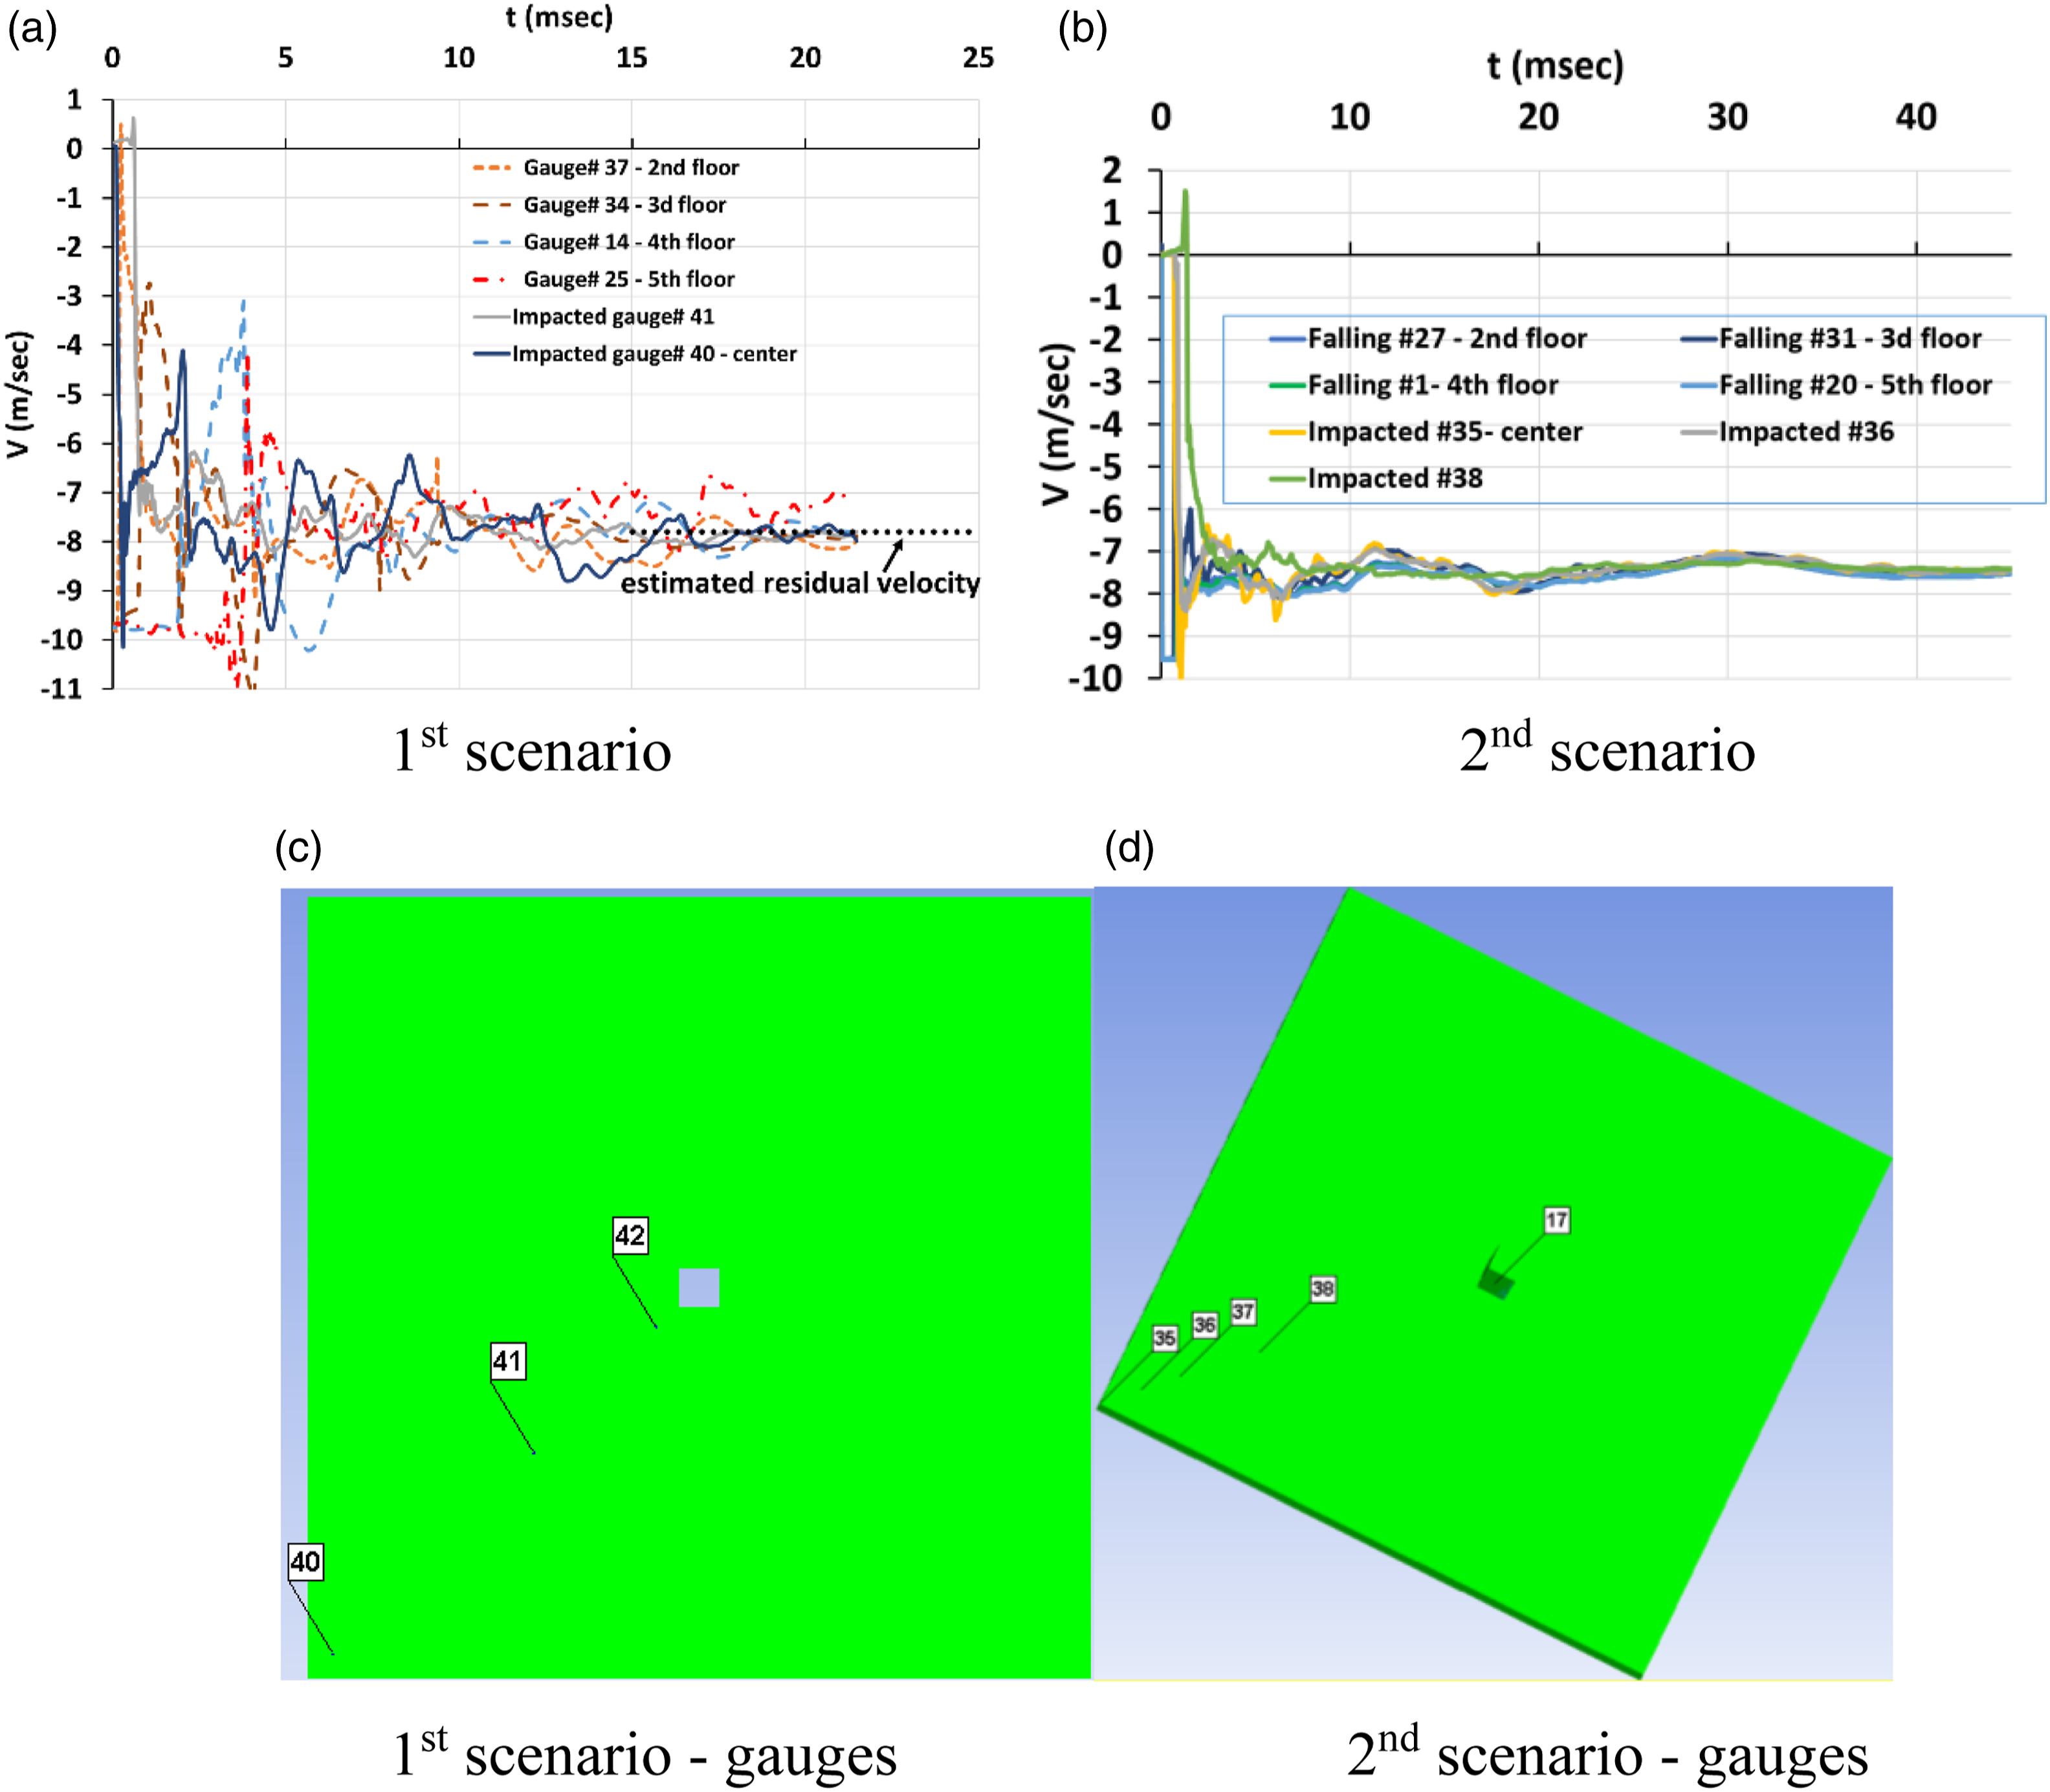
Figure 14(a) shows that the first scenario’s impact event is more complicated than the former impact events and is accompanied by repeated collisions. It ends within less than 20 ms with a residual velocity of 7.8 m/s.
In the second scenario (Figure 14(b)) a cluster of four masses impact the first level slab at a velocity of 9.65 m/s. The impact event duration is a few milliseconds. All curves describing the velocity-time history of the impacting slabs and of representative points along the diagonal of the impacted first level slab (Figure 14(d)) converge very quickly and smoothly to a residual velocity of ∼7.5 m/s (Figure 14(b)).
From that instant, all five slabs fall downward another floor height with initial velocities that are the residual velocities of the impact event with the first level slab, and shortly afterward hit the ground surface.
Conclusions
Recently the authors had developed a realistic model for analyzing the impact event between two RC flat slabs: a top slab which has been detached from its connections and is falling downward (denoted as the impacting slab) and the slab located one floor below (denoted the impacted slab). The model allows a detailed analysis of the slabs’ response and damage evolution during the impact event between the two slabs. It was found that the impacted slab connections with the columns fail, and the impacted slab is losing its supports and is falling downward as well toward the slab below.
This paper extends the basic model and aims at investigating the entire progressive collapse event of all slabs along the building height. It analyzes the sequence of the following impacts occurring between the falling slabs and the slabs underneath and is following the expanding scenario of progressive collapse. The present investigation extends the knowledge gained in the analysis of a single impact event between two slabs and covers the series of subsequent impacts, considering the elapsed time between the impact events and the state of damage of each slab. The novel results of this investigation are:
It was found that when the top-level slab is undamaged, its collision with the slab below is elastic, whereas if this slab is damaged prior to falling downward, its collision with the slab below is plastic.
These two possible damage conditions of the impacting slab may be related to different actions causing the slab’s damage: the undamaged impacting slab may be associated with punching shear failure that is a result of static loading, whereas the damaged impacting slab may be associated with explosion-resulted punching shear.
While the first collision may be either elastic or plastic, the following impacts in both scenarios occur between damaged slabs and lead to plastic collisions.
This is not the only difference between the two scenarios:
The second scenario is characterized by a series of subsequent impacts between an increasing number of slabs falling downward together as a cluster of slabs at a common velocity.
The first scenario is different by the fact that a similar series of impacts occur for almost all the slabs except for the top slab, that had undergone an elastic collision and it is falling behind independently, starting with a zero initial velocity and accelerating downward behind the cluster of slabs, while gaining velocity during it free falling.
At a certain time, the first slab reaches the same altitude of the cluster of slabs and an intermediate impact occurs before reaching the following slab that is still supported by the building columns. This intermediate impact is unique to the first scenario and affects the continuing velocity increase of the falling slabs.
Each impact of slabs with another slab below consumes some time, at the order of ∼40 ms, during which the connections fail along a displacement of ∼1.5 times the slab thickness. During this period, plastic deformations and failure of the connection occurs and the impacted slab’s velocity is reduced as a result. The velocity is then increasing during the free falling of the slab/s until its impact with the slab underneath. Thus, the slabs motion is characterized by increasing velocity between floor levels and velocity decrease during an impact event with another slab and the connection failure process, and vice versa. The top slab in the first scenario keeps gaining speed in an undisturbed gravitational falling mode and its velocity increases continuously. Therefore, this slab will catch the other slabs at a certain point, and an intermediate impact will occur. During the entire progressive collapse event, the velocity of the slabs is different at each impact level, due to the different number of slabs in a cluster and their initial velocity.
The entire progress of the series of impacts is described in detail and the variations in the slabs motion can be followed.
This study provides insight on the progressive collapse scenario and the mechanisms involved. It builds the foundation for a more general approach to analyze progressive collapse scenarios.
Footnotes
Acknowledgements
The authors are grateful for the support given by the Israel Ministry of Construction and Housing and by the Centre for Absorption in Science of the Ministry of Immigrant Absorption and the Committee for Planning and Budgeting of the Council for Higher Education under the framework of the KAMEA Program.
Declaration of conflicting interests
The author(s) declared no potential conflicts of interest with respect to the research, authorship, and/or publication of this article.
Funding
The author(s) disclosed receipt of the following financial support for the research, authorship, and/or publication of this article: This work was supported by the Centre for Absorption in Science of the Ministry of Immigrant Absorption KAMEA Program
Israel Ministry of Construction and Housing

A Damage views of the impacted slabs in the four major collisions
First collision. (a) Cross-section 1st scenario(b) Cross-section 2nd scenario(c) Bottom view first scenario(d) Bottom view second scenario. Second collision. (a) Cross-section 1st scenario(b) Cross-section 2nd scenario(c) Bottom view first scenario(d) Bottom view second scenario. 3d collision. (a) Cross-section 1st scenario(b) Cross-section 2nd scenario(c) Bottom view first scenario(d) Bottom view second scenario. Fourth collision. (a) Cross-section 1st scenario(b) Cross-section 2nd scenario(c) Bottom view first scenario(d) Bottom view second scenario.