



Abstract
This study investigated local failure characteristics of polypropylene fiber reinforced concrete (PPFRC) plates subjected to projectile impact. Flexural and compression tests for two types of PPFRC specimens (PPFRC1 and PPFRC2) were conducted to examine mechanical properties of the PPFRC. The average flexural strength of PPFRC1 and PPFRC2 at a strain rate of 10−1/s were 12.2 N/mm2 and 10.4 N/mm2, respectively. The average compressive strength of PPFRC1 and PPFRC2 at a strain rate of 100/s were 58 N/mm2 and 74.9 N/mm2, respectively. Projectile impact tests for 60 mm- and 80 mm-thick PPFRC plates were conducted by using a 50 g-mass projectile collided at velocities corresponding to 193–423 m/s. Experimental results exhibited that the PPFRC plate had a higher effect of suppressing local failure than a plain concrete plate. Comparison of the tests results with the modified NDRC formula revealed that the limit scabbing thickness was 15–20% smaller than that of a plain concrete plate.
Keywords
Introduction
In recent years, terrorist bombing attack and explosive accidents have occurred frequently in various countries. When a blast terrorism or an explosive accident occurs, the blast pressure damages structures and scattered debris such as concrete pieces generated by the explosive pressure would secondarily collide with surrounding structures. Hence, a design method for global and local failures of structures against the projectile needs to be established specially for socially vital structures such as nuclear power plants, chemical plants, and explosive plants.
Many studies have investigated the failure behavior of concrete structures at velocities corresponding to less than 10 m/s for impacts of a falling rock, debris flow, and manmade disasters such as vehicle and vessel impacts to structures (Kishi et al., 2002; Othman and Marzouk, 2016; Zineddin and Krauthammer, 2007; Miyamoto et al., 1991; Kennedy, 1976; Li et al., 2005). Additionally, the failure behavior of RC slabs under impact load at velocities corresponding to 10–1000 m/s (low-to high-velocity) were also conducted for airplane impact and flying debris impact by explosive accidents (Hughes, 1984; Chang, 1981; Dancygier and Yankelevsky, 1999; Li and Chen, 2003; Li et al., 2005; Chen et al., 2008; Beppu et al., 2008; Werner et al., 2013; Martin, 1994; Shasha et al., 2017). As shown in Figure 1., a concrete plate subjected to low-to high-velocity impact shows local failure. Local failure can be divided into three major failure modes of spalling, scabbing, and perforation. In designing protective structures against low-to high-velocity impact of the projectile, scabbing, and perforation are unacceptable failure modes from the viewpoint of protecting human life inside the structure. Local failure occurs, when tensile stress wave, which derives from reflecting of compressive stress wave by the impact load at a free surface, reaches the strength of tensile strength. In addition, local failure might occur due to local deformation of structural members. Classification of local failure of concrete slabs.
Various studies have focused on suppressing the local failure of concrete plates. Dancygier et al. (Dancygier and Yankelevsky, 1996) and Tai (Tai, 2009) conducted high-velocity impact tests on high-strength concrete slabs, and they have investigated the effect of increasing the strength of concrete on the impact resistance. Mohamed (Mohamed and Ahmed, 2014) et al. conducted high-velocity impact tests on RC slabs whose front or back surface was reinforced with a steel plate. The results exhibited that local failure can be suppressed to some extent by reinforcing the back surface with a steel plate, and the suppressing effect of local failure by the back surface reinforcement was greater than that by the front surface reinforcement.
Restraining effect by Fiber Reinforced Cementitious Composite (FRCC) on the local failure has been studied as one of promising methods for improving static or dynamic resistance of structures. FRCC is a cementitious composite made of short fibers such as steel fibers, polypropylene (PP) fibers, polyvinyl alcohol (PVA) fibers, and glass fibers mixed with mortar or concrete to improve tensile strength and toughness by bridging cracks between matrices. Although the fiber reinforced concrete (FRC) with steel fibers mixed with concrete or mortar has been developed mainly to improve the local failure suppressing effect for cementitious plates, synthetic resin fibers such as PP fibers, PVA fibers, and aramid fibers have begun to be used as alternative materials to steel fibers. Synthetic resin has higher corrosion resistance and are lighter than steel fibers, so they have been used for lining to prevent concrete from peeling off in tunnels. Mechanical properties of the organic fibers and FRCs have been studied in the previous studies. Leung et al. (Leung and Li, 1991), Kanda et al. (Kanda and Li, 1999), and Redon et al. (Redon et al., 2001) proposed theoretical or empirical debonding models between a fiber and matrix. They classified the fiber adhesion mechanism into chemical and frictional adhesion, corresponding to the fact that the separation of fibers from matrix can be divided into two mechanisms: chemically peeling the adhesion and mechanically pulling out of the fiber from the matrix. In the literatures, dynamic strength characteristics of FRCC have been investigated. Wang et al. (Wang et al., 1996) conducted a dynamic flexural test on concrete specimens mixed with PP and steel fibers, and revealed that the specimen mixed with steel fibers showed higher energy absorption. Fenu et al. (Fenu et al., 2016) conducted a tension-type improved Hopkinson bar test on cement mortar specimens mixed with glass fibers and basalt fibers to investigate the dynamic mechanical properties. Xu et al. (Xu et al., 2021) conducted a uniaxial tensile test on basalt fiber reinforced engineered cementitious composite specimens, and they reported that multiple cracking behavior was significantly developed in the material.
Impact-resistant performance of FRC plates has also been investigated. Ong et al. (Ong et al., 1999) conducted low-velocity impact tests for concrete slabs mixed with polyolefin, polyvinyl alcohol, and steel fibers, and they concluded that the concrete slabs reinforced with steel fibers had higher impact performance. Ramakrishna et al. (Ramakrishna & Sundarajan, 2005) conducted impact tests for a cement mortar plate mixed with coconut, sisal, jute, and hibiscus fibers, and they revealed that the mortar plate mixed with coconut fibers had the highest impact performance. Wang et al. (Wang and Chouw, 2018) conducted impact tests for a coconut fiber reinforced concrete plate covered with a flax fiber reinforced polymer on the surface, and the relationship between the impact force and displacement was investigated. Ueno et al. (Ueno et al., 2017) conducted projectile impact tests for a FRC slab mixed with PP fibers by using 46 g mass projectile, and they clarified high impact resistance of the FRC slab. Beppu et al. (Beppu et al., 2020) conducted impact tests on ultra-high-strength fiber-reinforced concrete plates, and exhibited their high impact resistance. Almusallam et al. (Almusallam et al., 2013) conducted impact tests for RC slabs mixed with PP and steel fibers, exhibiting that their spalling depth was identical regardless of the type of fiber, even though damaged area was decreased. Wei et al. (Wei et al., 2021) conducted impact tests on FRC plates containing two types of steel fibers with different length, showing their higher impact performance. Liu et al. (Liu et al., 2021) conducted high-velocity impact tests on steel fiber-reinforced geopolymer plates, and they revealed that the penetration limit was improved by the fiber reinforcement. Kheyroddin et al. (Kheyroddin et al., 2021) conducted drop hammer tests on polypropylene fiber reinforced concrete plates covered with a glass fiber sheet, and they concluded that the polypropylene fiber reinforcement and glass fiber sheet reinforcements were effective in mitigating impact damage.
As described above, FRCC and FRC are qualitatively effective in suppressing local failure caused by a projectile impact. Almussalam et al. (Almusallam et al., 2013), Nam et al. (Nam et al., 2016) and Feng et al. (Feng et al., 2019) investigated the impact-resistant performance of PPFRC plates, whose fibers had a diameter of less than 0.05 mm, subjected to projectile impact. However, few studies focused on the impact resistance of PPFRC plates containing fibers with a diameter of greater than 0.5 mm. Hence, examining the relationship between local failure of PPFRC plates and the material properties is included in this study. In this study, impact tests were conducted for FRC plates with two types of polypropylene fibers (PPFRCs), and the suppressing effect of the local failure of the FRC plates was investigated. Flexural tests and uniaxial compression tests were initially conducted for two types of FRC specimens with different fiber dimension and mixing ratio, to examine the static and dynamic flexural or compressive strength characteristics of the PPFRC. Subsequently, projectile impact tests were conducted for three types of PPFRC plates using a high-pressure launching test machine, to examine scabbing resistance of the PPFRC plates. Furthermore, the scabbing limit thickness of the PPFRC plate was evaluated using the modified NDRC formula.
Experimental program
Polypropylene fibers
Dimension and mechanical characteristics of polypropylene fibers.


Appearance of fibers.
Concrete constituents.

Specified mix constituent.

Flexural test
Static and dynamic flexural tests were conducted according to JCI-SF4 (Japan Concrete Institute: JCI Standard Collection, 2004) and JIS A 1106 (Japan Society of Civil Engineering: Guideline for Experiment on Materials of Civil Works, 2013), using a servo-controlled test machine as shown in Figure 3. The servo-controlled test machine can load with a constant velocity of up to 4 m/s, to investigate the effect of loading rate on the mechanical properties of materials. Figure 4 illustrates an appearance of the flexural test. Load and fulcrum reaction force were measured with load cells in the static and dynamic flexural tests for 100×100×400 mm specimens, as shown in Figure 5. A 120 mm-long strain gauge was attached on the center of the lower face of the specimen, and the strain rate was calculated from the measured strain-time history. The displacement of the L-shaped steel installed at the mid height of the specimen was measured with a laser displacement sensor in the static and dynamic flexural tests. The deflection of the specimen was calculated by subtracting the displacement at the fulcrum of the specimen from the displacement of the L-shaped steel as shown in Figure 5. Table 4 lists test cases. As test parameters in the tests were the type of FRC (PPFRC1 and PPFRC2) and strain rate of 10−6 and 10−1/s, a total of 18 tests were conducted (4 or 5 specimens in each case). Servo controlled impact test machine. Appearance of flexural test. Schematic diagram of flexural test. Test cases of flexural test.



Compression test
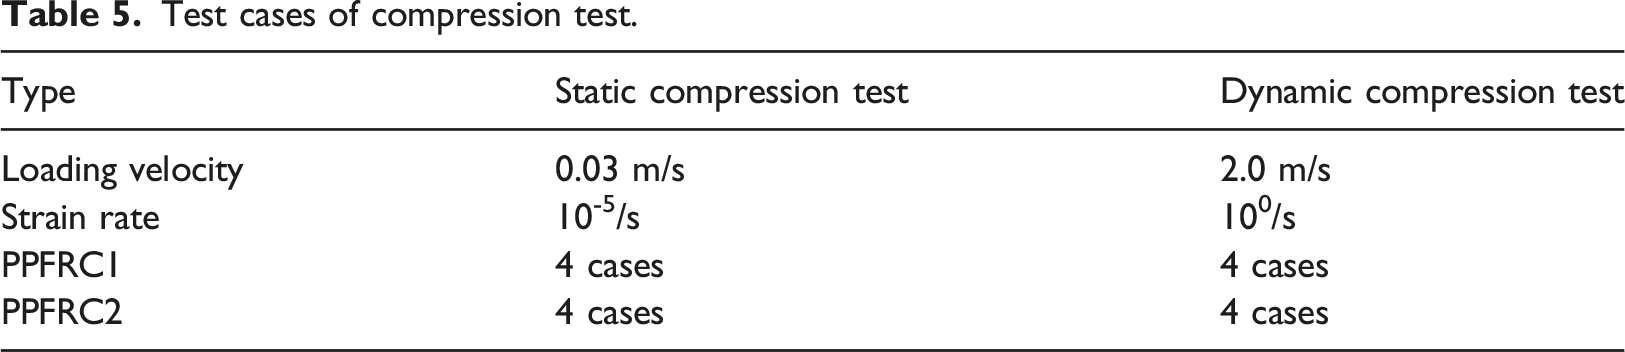
Static and dynamic compression tests were conducted according to JIS A 1108 (Japan Society of Civil Engineering: Guideline for Experiment on Materials of Civil Works, 2013), using the servo-controlled test machine. A schematic diagram of the measurements in the static and dynamic compression tests was depicted as shown in Figure 6. Load was measured with load cells above and below the specimen which has a diameter of 10 cm and a height of 20 cm. To measure the displacement of loading plates installed above and below the specimen, a laser displacement sensor was used in the static compression tests, and an eddy current type displacement sensor was used in the dynamic compression tests. Table 5 lists test cases. As test parameters in the tests were the type of FRC (PPFRC1 and PPFRC2) and strain rate of 10−5/s and 102/s, a total of 16 tests were conducted (4specimens in each case). Schematic diagram of compression test. Test cases of compression test.
Projectile impact test
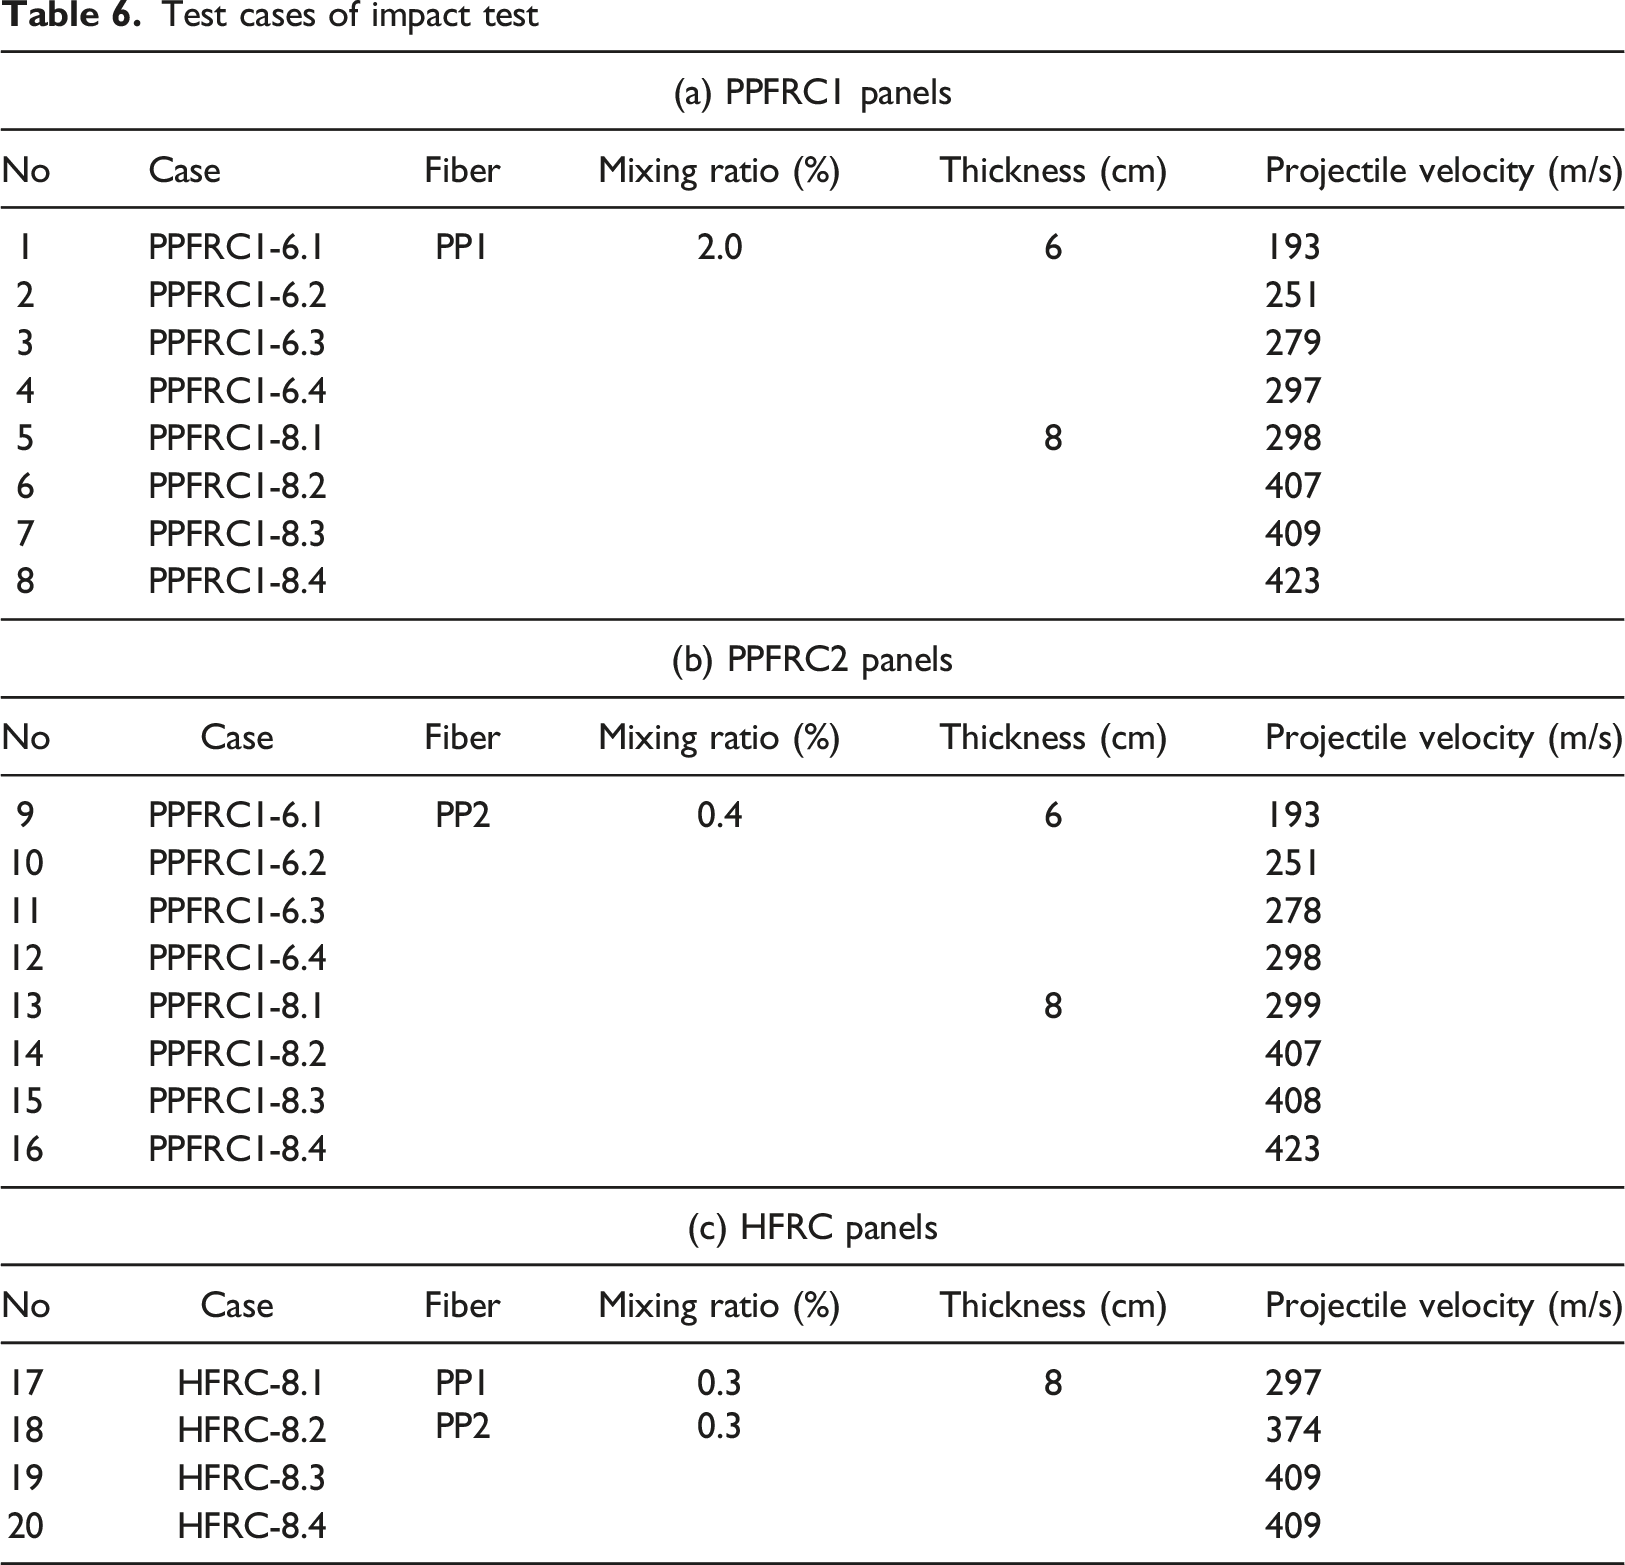
Figure 7 illustrates a schematic diagram of a projectile launching machine. This machine consists of an air compressor, an air chamber, and an acceleration tube. By adjusting compressive air pressure, a projectile with a mass of 50–1000 g can be launched at velocities corresponding to 100–500 m/s. The velocity of the projectile can be measured with a resolution of 1 cm/s by laser velocity sensors installed at 50 cm intervals and universal counters at two locations near the launch port. Figure 8 displays a steel projectile used in the tests. The projectile has the tip of hemispherical shape, with a mass of 45 g and a diameter of 25 mm. The projectile was attached to a nylon fixture inserted into the air chamber, and fired with the fixture. Figure 9 illustrates the measuring items of local failure. Perforation depth or spalling depth is the distance from the front or back surface to the deepest position of the dent caused by failure. The spalling diameter and the scabbing diameter were measured in the vertical, horizontal, and diagonal 45-degree directions around the concrete plate, and the average value was taken as the diameter. Schematic diagram of projectile launching machine. Steel projectile. Measuring items.


Test cases of impact test
Experimental results and discussions
Flexural tests
Figure 10 displays the failure status of the specimens in the static and dynamic flexural tests. One apparent crack occurred in the pure flexural section in all cases, though several cracks were expected to occur due to the crack dispersion effect. Figure 11 illustrates the relationship between flexural stress and deflection in the static test of PPFRC1, as an example. In the initial gradient of the flexural stress-deflection curve, the initial crack strength fLOP (LOP: Limit Of Proportion) or the maximum stress point fMOR (MOR: Modulus Of Rupture) was defined as a point of initial crack or maximum stress. Flexural stress was calculated using the following eq. (1) Failure states of flexural test. Example of Relationship between flexural stress and deflection.


Figure 12 illustrates the relationship between flexural stress and deflection measured in the test. On the whole, the relationship shows that the stress of FRC after the initial crack strength f
LOP
increases due to the crack bridging effect, and then reaches the flexural stress f
MOR
. The initial crack strength f
LOP
and the flexural strength f
MOR
increase as the strain rate increases. The softening gradient after the flexural strength f
MOR
in the dynamic tests became steep, and the maximum deflection decreased. Although PPFRC1 shows higher ductility failure because of the large dimension of PP1 and crack bridging effect, PPFRC2 shows brittle failure due to the short length of PP2 and weak adhesion with concrete matrix with aggregates. Relationship between flexural stress and deflection.
Figure 13 illustrates the relationship between the initial crack strength f
LOP
and the strain rate. In the present study, the strain rate was calculated by averaging the strain rate between the origin and one third of the initial crack strength. The average initial crack strength f
LOP
of PPFRC1 and PPFRC2 at a strain rate of 10−6/s were 6.53 N/mm2 and 5.88 N/mm2, respectively. The average initial crack strength f
LOP
of PPFRC1 and PPFRC2 at a strain rate of 10−1/s were 9.48 N/mm2 and 10.4 N/mm2, respectively. Hence, the dynamic increase factors (DIF
ic
, equation (2)) of the initial crack strength f
LOP
of PPFRC1 and PPFRC2 at a strain rate of 10−1/s were 1.54 and 1.77, respectively, and the dynamic increase factor of PPFRC2 was approximately 15% greater than that of PPFRC1 Relationship between initial crack and flexural strengths and strain rate. DIF of the tensile strength.


Figure 13 illustrates the relationship between the flexural strength f
MOR
and strain rate. The average flexural strengths f
MOR
of PPFRC1 and PPFRC2 at a strain rate of 10−6/s were 9.48 N/mm2 and 5.88 N/mm2, respectively. The average flexural strengths f
MOR
of PPFRC1 and PPFRC2 at a strain rate of 10−1/s were 12.2 N/mm2 and 10.4 N/mm2, respectively. That is, both of the flexural strength f
MOR
PPFRC1 and PPFRC2 plates increased as the strain rate increased. The dynamic increase factors (DIF
fs
, equation (3)) of the flexural strength f
MOR
of PPFRC1 and PPFRC2 at a strain rate of 10−1/s were 1.27 and 1.87, and the value of PPFRC2 was approximately 50% greater than that of PPFRC1 Relationship between flexural fracture energy at 2mm deflection and strain rate. Relationship between DIF of flexural fracture energy at 2mm deflection and strain rate.


Compression test
Figure 17 illustrates the failure status of the specimen in the static and dynamic compression tests. The all FRC specimens showed shear failure with diagonal crack or splitting failure in all cases. Figure 18 illustrates the stress–strain curve of the FRC specimen. Test results showed that the compressive strength and the ultimate strain at the compressive strength increased as the strain rate increases. The average compressive strengths of PPFRC1 and PPFRC2 at a strain rate of 10−5/s were 52.0 kN/mm2 and 57.0 kN/mm2, respectively. Failure states of compression test. Stress-strain relationship of the FRC specimen up to the compressive strength.

The average compressive strengths of PPFRC1 and PPFRC2 at a strain rate of 100/s were 58.9 kN/mm2 and 74.3 kN/mm2, respectively. Hence, the dynamic increase factors (DIF
c
, equation (6)) of the compressive strength of PPFRC1 and PPFRC2 at a strain rate of 100/s were 1.13 and 1.30, respectively, and the value of PPFRC2 was approximately 15% greater than that of PPFRC1 DIF of compressive strength. Relationship between DIF of compressive strength and strain rate.


The average ultimate strain of PPFRC1 and PPFRC2 at a strain rate of 10−5/s were 4800 μ and 5330 μ, respectively. The average ultimate strain of PPFRC1 and PPFRC2 at a strain rate of 100/s were 5480 μ and 6290 μ, respectively. The previous studies reported that the average ultimate strain of plain concrete at strain rates of 10−5/s and 100/s were 2029 μ and 2321 μ (Iwane & Experimental, 2017). The results show that the ultimate strain of PPFRC1 and PPFRC2 is approximately 250% greater than that of plain concrete.
Figure 21 illustrates the relationship between stress and deformation after the compressive strength. The residual stress after the peak stress remains in the static compression test even when the strain reaches 5 mm. Both PPFRCs shows small residual strain and steeper stress-softening as the strain rate increases. Figure 22 illustrates the average compressive fracture energy at a deformation of 1 mm. The compressive failure energy was calculated by integrating the stress-deformation curve up to a specified deformation. The average static compressive failure energies of PPFRC1 and PPFRC2 were 43.6 N/mm and 35.3 N/mm, respectively. The average dynamic compressive energies of PPFRC1 and PPFRC2 were 33.1 N/mm and 28.1 N/mm, respectively. Figure 23 illustrates the relationship between the dynamic increase factor (DIF
cfe
, equation (7)) of the compressive fracture energy at a deformation of 1 mm and the strain rate. The dynamic increase factors of PPFRC1 and PPFRC2 at a strain rate of 100/s were 0.76 and 0.80, respectively Relationship between compressive stress and strain on post-peak range. Relationship between compressive fracture energy and strain rate. Relationship between DIF of compressive fracture energy and strain rate.


Projectile impact tests
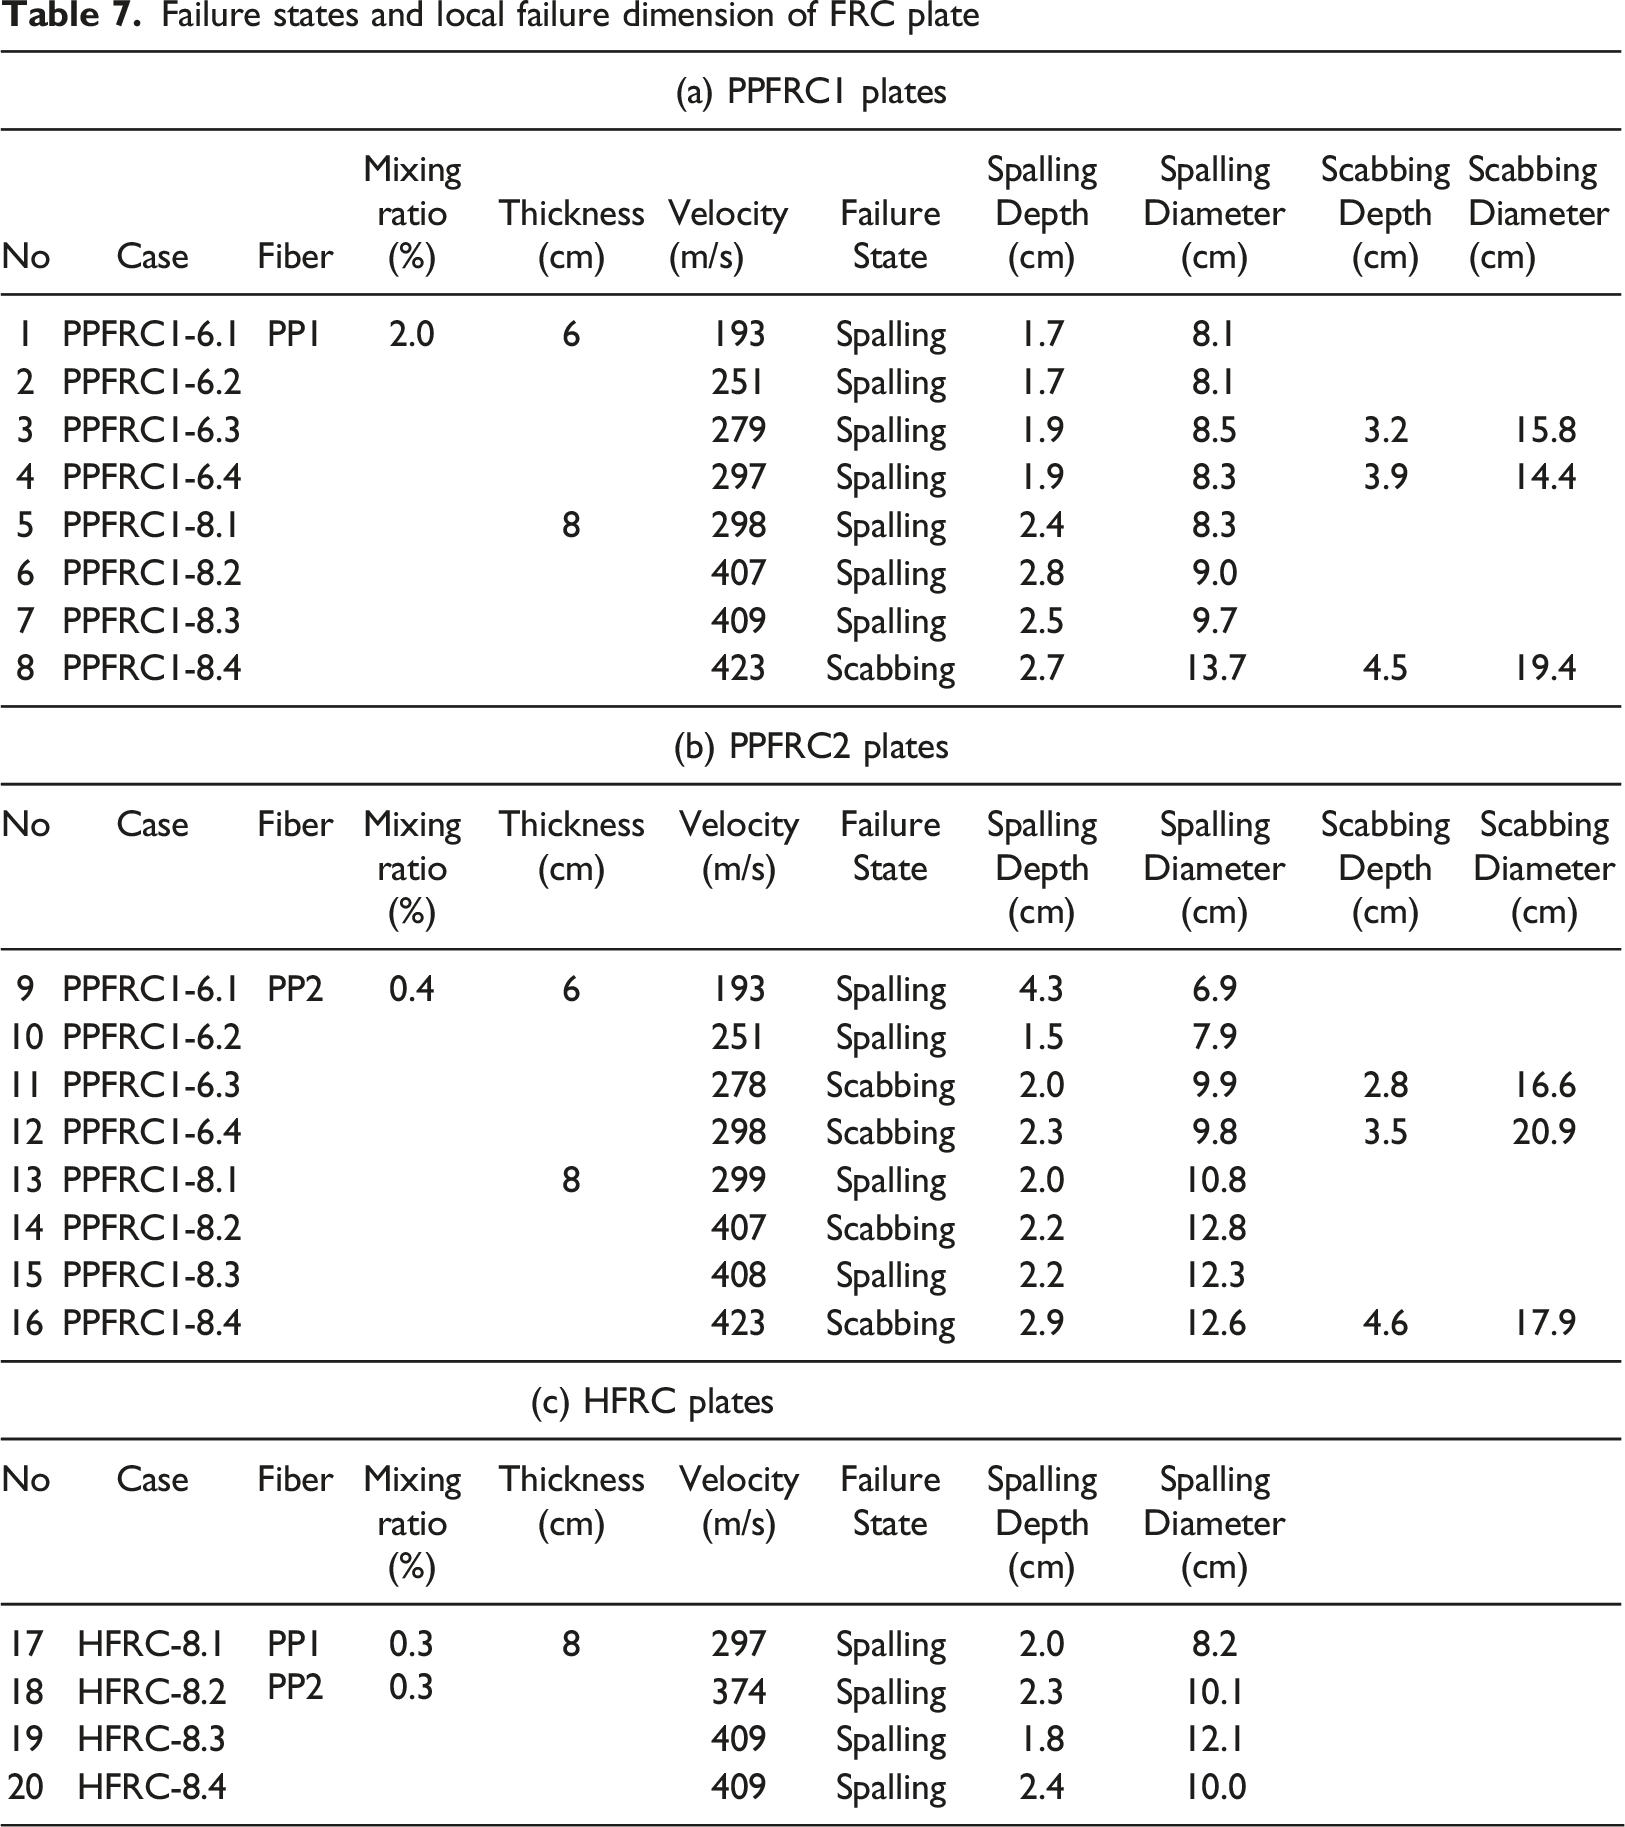
Failure states and local failure dimension of FRC plate

Failure state of PPFRC1.

Failure states of PPFRC2.

Failure state of HFRC.
Figure 25 displays the failure status of the PPFRC2 plates. The failure mode of 6 cm-thick PPFRC2 plate was spalling at the impact velocities corresponding to 193–251 m/s. As the failure mode of 6 cm-thick PPFRC2 plates was scabbing at the impact velocities corresponding to 278–298 m/s, the scabbing limit velocity was between 251 and 278 m/s. The failure mode of 8 cm-thick PPFRC2 plate was spalling at the impact velocity of 299 m/s. The failure mode of 8 cm-thick PPFRC2 plate was scabbing limit at the impact velocity of 408 m/s. Although the slight difference of failure limit between PPFRC1 and PPFRC2 plates might be caused by the difference in fiber orientation, and their scabbing limit and the perforation limit thickness of FRC were identical. For reference, the failure mode of 8 cm-thick PPFRC2 plate was scabbing at the impact velocity of 423 m/s. At the impact velocities corresponding to 408–423 m/s, flexural cracks also occurred in 8 cm-thick PPFRC2 plate.
Figure 26 shows the failure status of the HFRC plate. The failure mode of 8 cm-thick HFRC plate were all spalling at the impact velocity corresponding to 297–409 m/s. Compared with the failure status of PPFRC1 and PPFRC2, the back surface of HFRC had more cracks than those of PPFRC1and PFRC2, indicating their higher energy absorption.
Average penetration depth of PPFRC1 was 15% higher than that of PPFRC2. This is due to the difference of compressive strength at the strain rate of 100/s.
Experimental results showed that the average penetration depth of PPFRC1 plate was approximately 10% greater than that of PPFRC2 plate. From the compressive strength test, the static and dynamic compressive strength of PPFRC1 was approximately 10–20% less than that of PPFRC2, and the compressive failure energy of PPFRC1 was 20% greater than that of PPFRC2. Assuming that the penetration depth could be caused by plastic deformation of concrete, the strength and the absorbed energy after compressive strength affect the penetration depth. Whereas, as the stress state in the penetration process remains in the tri-axial condition, the effect of the uniaxial mechanical properties on the penetration depth would be limited. The experimental result revealed that the compressive strength had a greater effect on the penetration depth than the fracture energy.
The failure modes of PPFRC1 and PPFRC2 plates, which had different strengths and fiber volumes, were almost identical. However, fragmentation of concrete in the rear face was more suppressed in PPFRC2 plate. From the flexural test results, the static and dynamic flexural strengths of PPFRC1 were 60% and 20% greater than those of PPFRC2, respectively. The static and dynamic tensile fracture energies of PPFRC1 were three to four times greater than those of PPFRC2. However, the cross-section of the PPFRC1 plate exhibited a wide opened crack, while multiple cracks were observed in PPFRC2 plate. In other words, PPFRC2 plate generated a large number of fine cracks and absorbed the impact energy. As two PPFRC plates had the identical suppressing effect, it is necessary to investigate the relationship between the mechanical properties of the material and the crack dispersion capability, and the influence of the properties on the impact resistance of the plate.
Comparison of scabbing limit thickness by the modified NDRC formula
The previous studies have reported that the FRC plates has a higher effect of suppressing local failure than that of plain concrete and mortar plates. In the present study, the modified NDRC formula was used to evaluate the scabbing limit of the FRC plates.
Equations (8), (9), and (10) show the formula for the penetration depth by the modified NDRC formula, and equations (11) and (12) show the evaluation formula for the scabbing limit plate thickness


Figure 27 shows the comparison of the experimental penetration depth with those evaluated by the modified NDRC formula in the relationship between the penetration depth and impact velocity. The results show that PPFRC has slight effect in suppressing penetration depth. For reference, the penetration depth of plain concrete calculated by the modified NDRC formula is multiplied by the reduction modulus α to match the experimental results of the PPFRC1 and PPFRC2 plates. The reduction modulus, α = 0.9, were determined to be compatible with the failure mode. This reduction modulus indicates suppressing rate of penetration depth. It can be observed that the penetration depth of PPFRC1 and PPFRC2 plates is approximately 10% smaller than that of plain concrete plate. Figure 28 illustrates the failure mode of the FRC plates in this test, marked in the relationship between the plate thickness and the impact velocity. In Figure 28, the scabbing limit of a plain concrete plate calculated by the modified NDRC formula is multiplied by the reduction modulus α1 and α2 to match the experimental results of the PPFRC1 and PPFRC2 plates. Specifically, reduction modulus, α1 = 0.86 and α2 = 0.75, were determined to be compatible with the failure mode. This reduction modulus indicates suppressing rate of the scabbing limit thickness of the plain concrete plate. It can be observed that the scabbing limit slab thickness of PPFRC1 and PPFRC2 plates is approximately 15%–25% smaller than that of plain concrete plate. By comparing with similar type of FRC which contains 2.0% volume of PP fiber has a length of 0.7 mm and a diameter of 30 mm, performed by Ueno et al. (Ueno et al., 2017), it was found that it has the identical effect of suppressing local failure. Comparison of penetration depth. Comparison of limit thickness.

Li et al. (Li et al., 2006) derived the relationship between the limit thickness and impact energy by adapting the modified NDRC formula. The relationship between the scabbing limit thickness and the impact energy will be discussed by considering the reduction factors associated with the PPFRC plates that were proposed by Li et al. (Li et al., 2006).
Li et al. (Li et al., 2006) derived the impact energy that causes scabbing or perforation by arranging the scabbing and perforation limit thicknesses of the modified NDRC formula. The relationship between the limit thickness and the impact energy can be obtained by arranging equations (11) and (12), as shown below.
The relationship between the scabbing limit thickness [m], H
s
and impact energy [J], E
k
is shown as


Figure 29 illustrates the relationship between the plate thickness and the impact energy, and Figure 30 shows the comparison of scabbing limit energies between a plane concrete plate and the PPFRC plate. The scabbing limit energies of 6 cm-thick and 8 cm-thick of plain concrete plate were 429J and 1822J, respectively. The scabbing limit energies of 6 cm-thick and 8 cm-thick of the PPFRC plate were 1822J and 4368J, respectively. Therefore, the scabbing limit energy of the 6 cm-thick of PPFRC plate was approximately 330% greater than that of a 6 cm-thick plain concrete plate. The scabbing limit energy of 8 cm-thick of PPFRC plate was approximately 130% greater than that of 8 cm-thick plain concrete plate. Comparison of scabbing limit energy. Scabbing limit energy of FRC plate.

Conclusion
This study investigated local failure resistance of polypropylene fiber reinforced concrete plates by conducting projectile impact tests. In the test, two types of PP fibers with different dimensions were employed and the effect of suppressing local failure due to the mixing of PP fibers was examined. The conclusions drawn from this study are listed as follows. 1. From the flexural test, the static and dynamic flexural strengths of PPFRC1 were 60% and 20% greater than those of PPFRC2, respectively, and the static and dynamic tensile fracture energies of PPFRC1 were three to four times greater than those of PPFRC2. Although their tensile properties were significantly different, the failure modes of PPFRC1 and PPFRC2 plates were almost identical. Observation of the cracks in the cross-section showed that a wide opened crack was observed in the cross-section of PPFRC1 plate, while multiple cracks were observed in the cross-section of PPFRC2 plate. Hence, crack dispersion capability affected the impact-resistant performance of the PPFRC plates. 2. From the compressive test, the static and dynamic compressive strengths of PPFRC1 was approximately 10–20% less than that of PPFRC2, and the compressive failure energy of PPFRC1 was 20% greater than that of PPFRC2. Considering the impact test result that the average penetration depth of PPFRC1 plate was approximately 10% greater than that of PPFRC2 plate, it was revealed that the compressive strength had a greater effect on the penetration depth than the fracture energy. 3. From the projectile tests, it was found that the FRC plate containing 2.0% volume of PP1 fibers and the FRC plate containing 0.4% volume of PP2 fibers had identical suppressing effect of local failure. From the comparison with the modified NDRC formula, the scabbing limit thickness of the PPFRC1 and PPFRC2 plates was approximately 15–25% smaller than that of plain concrete plate. The scabbing limit energy of 8 cm-thick of PPFRC plate was approximately 130% greater than that of 8 cm-thick plain concrete plate.
Footnotes
Declaration of conflicting interests
The author(s) declared no potential conflicts of interest with respect to the research, authorship, and/or publication of this article.
Funding
The author(s) received no financial support for the research, authorship, and/or publication of this article.
