
Abstract
Rockslides can cause severe damage to infrastructure, while flexible barriers offer an effective prevention measure. The protection and control effect of flexible barriers can be estimated from the process of rockslide break-runout-impact on the flexible barrier, which can be simulated using the DEM-FDM coupled method in the finite difference code FLAC3D. However, accurate modeling of this process has been hindered by the inability to adequately describe the mechanical behavior of flexible barriers in FLAC3D. To address this issue, this study presents an equivalent continuum model to describe the mechanical behavior of a flexible barrier under rockslide impact. This equivalent model reduces computational complexity while maintaining accuracy. The proposed theoretical model incorporates tensile and bending components along with yield criteria governing stress state changes. Furthermore, the model was implemented in FLAC3D through secondary development. Three experiments were numerically simulated to verify the effectiveness of the proposed model. Utilizing the proposed flexible barrier model and the DEM-FDM coupled method, the process of rockslide break-runout-impact on flexible barriers was numerically investigated. The proposed method was applied to predict the rockslide break-runout-impact process on a flexible barrier in Sichuan Province, China. The numerical results offer scientific guidance for the selection of appropriate flexible barriers.
Introduction
Rockslides can cause destructive impacts on infrastructure, which require adequate protection and control measures (Chen et al., 2023; Cui et al., 2023; Scuderi et al., 2023; Shao et al., 2023; Tomás et al., 2023; Verrucci et al., 2023). Flexible barriers have been widely adopted for rockslide protection and control due to their cost-effectiveness and environmental friendliness (Coulibaly et al., 2019; Tang et al., 2024; Xu et al., 2018; Yang et al., 2019, 2024), as shown in Figure 1. The efficiency of flexible barriers significantly depends on the rockslide break-runout-impact process. For instance, the breaking behavior relates to the risk level of potential rockslides, providing a basis for implementing protective measures. (Li et al., 2023). The runout trajectory governs the kinetic energy and jump height of the rockslide mass, which are critical parameters for designing hazard-mitigation structures (Asteriou and Tsiambaos, 2018). Predicting barrier effectiveness based on their dynamic response is highly complex and challenging (Yu et al., 2019). Therefore, accurately simulating the rockslide break-runout-impact process on flexible barriers is essential for their effective design. Flexible barriers intercepting rocks: (a) field tests, (b) details of flexible barriers.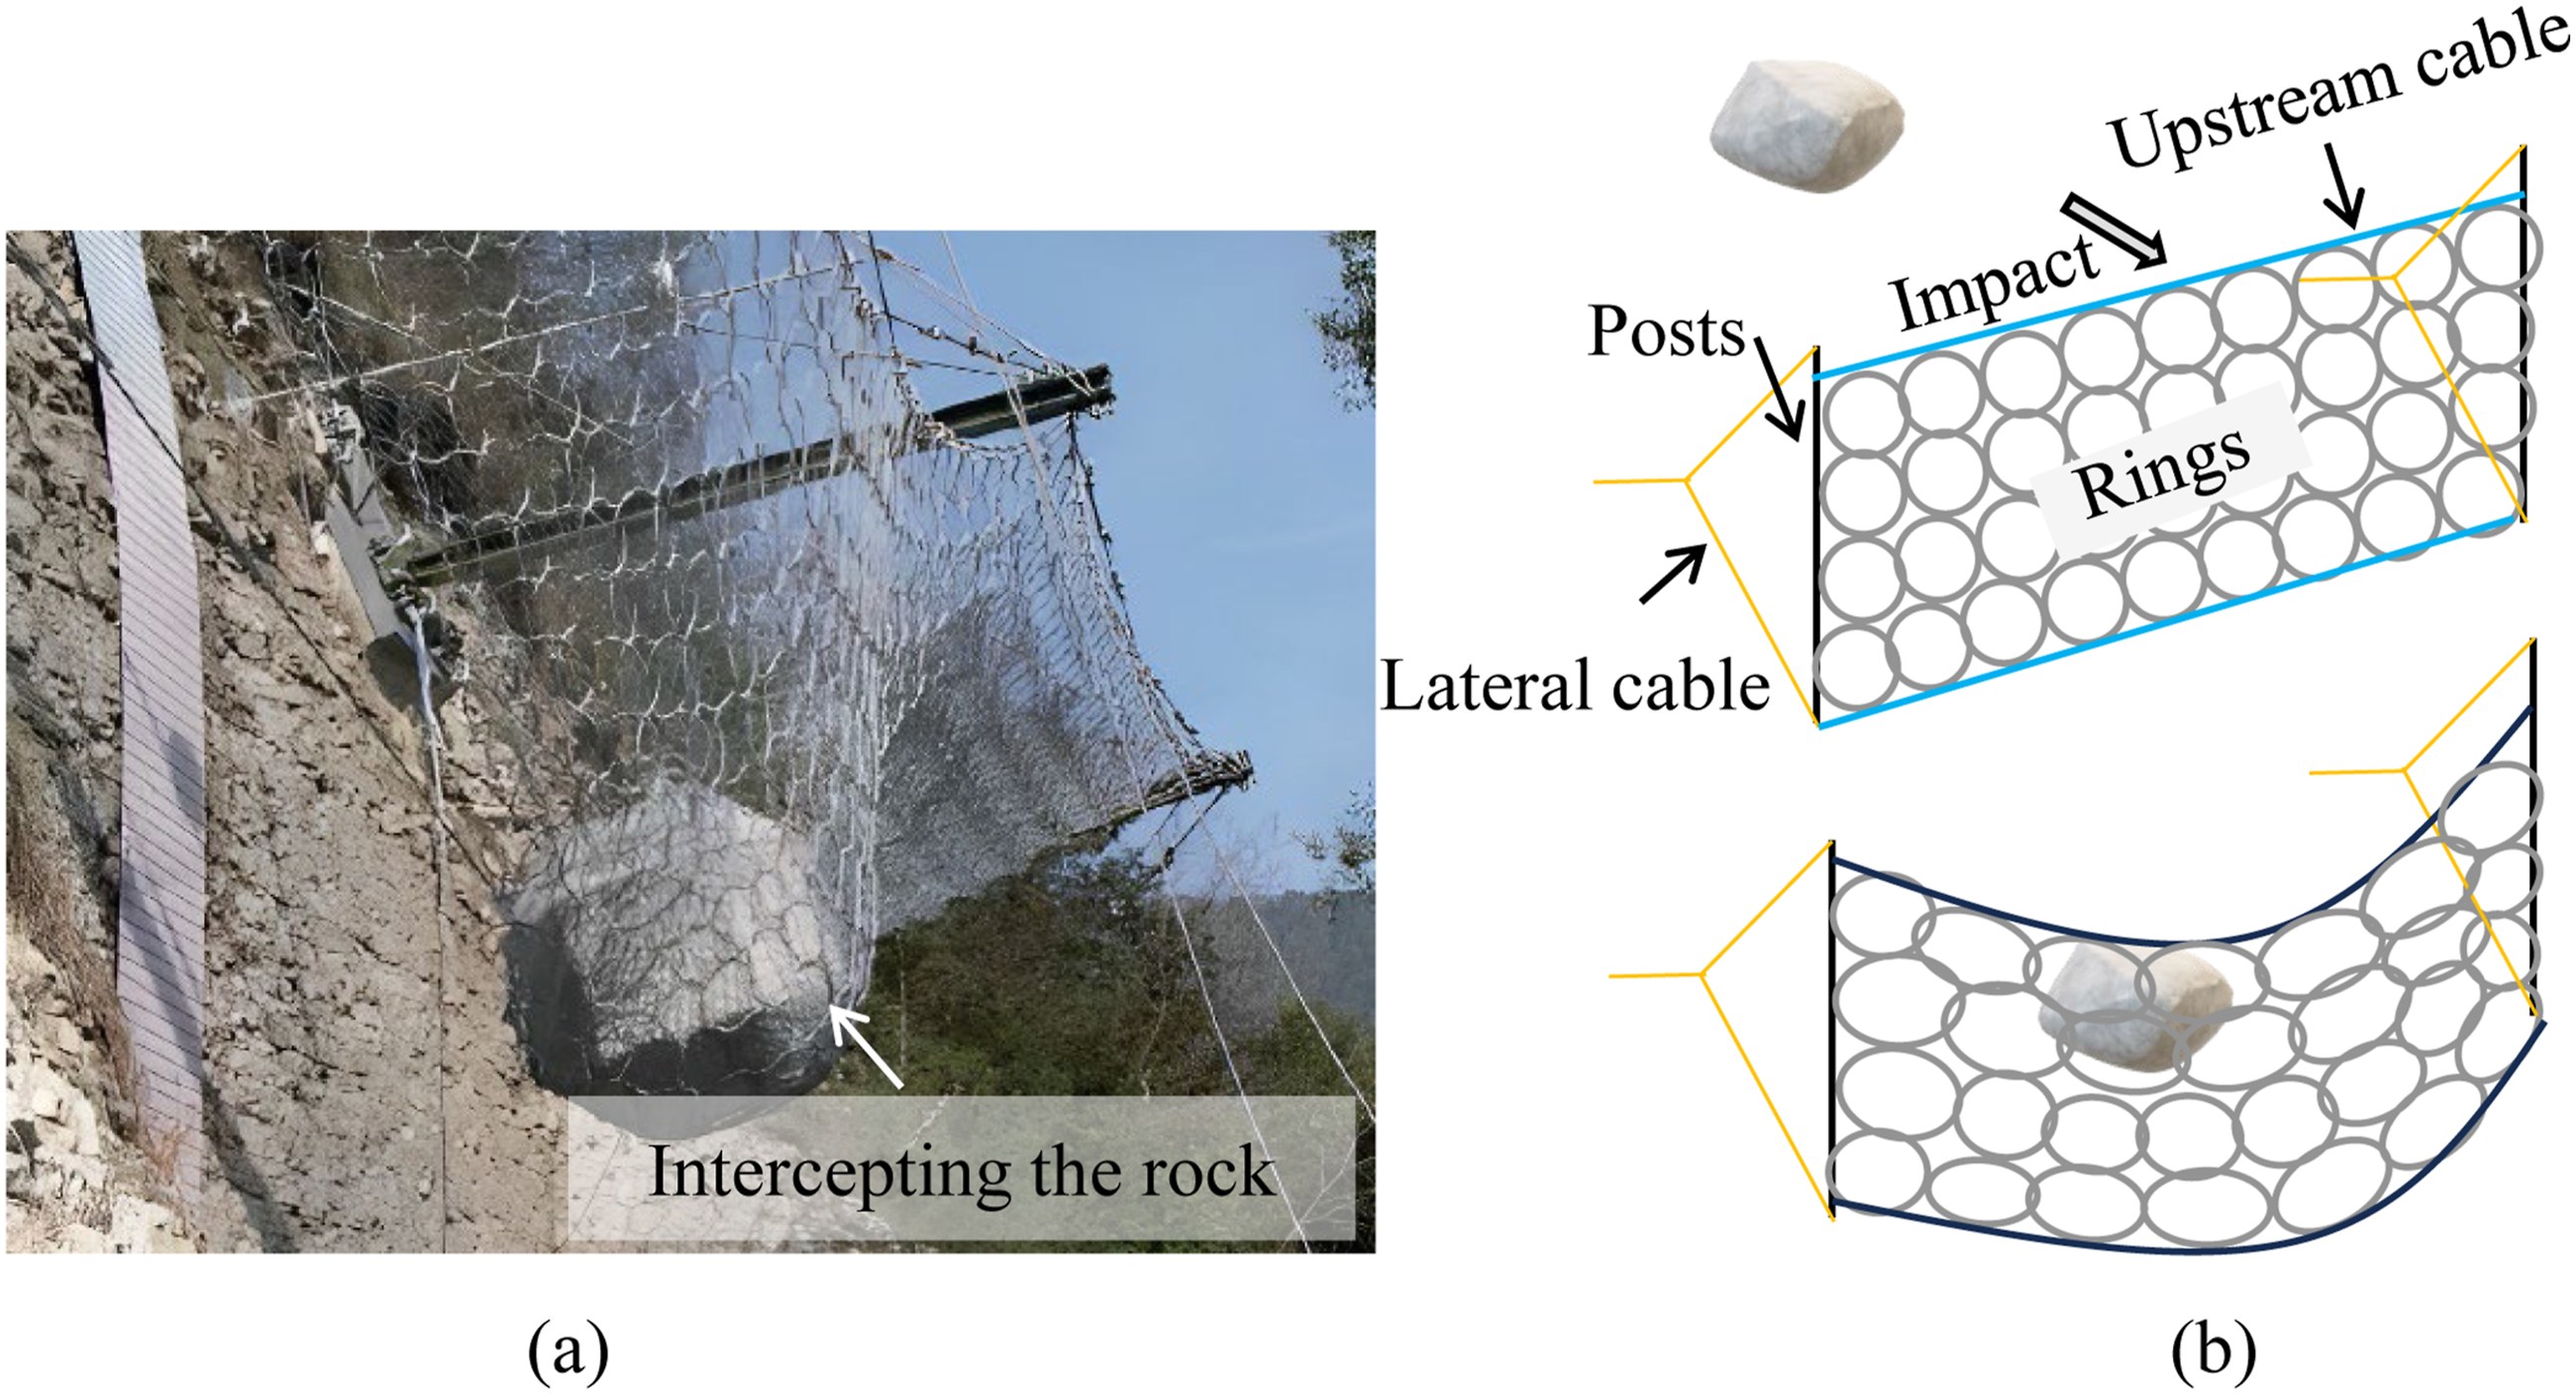
Even though the process of rockslide break-runout-impact on flexible barriers can provide reliable suggestions during protection design, it has not yet been accurately modeled. The accurate numerical modeling of rockslide break-runout-impact process remains a significant challenge due to several factors, including: the complex mechanical behavior and large deformations of the flexible barrier, the dynamic of interaction between the discrete rock mass and the continuum structure, the need for efficient computation of large domains, the accurate numerical modeling of slope, and the fragmentation of rocks during the fall, etc. Researchers have separately conducted numerical modeling of the rockslide break-runout process and its impact on flexible barriers. For example, the DEM-FDM coupled method effectively simulated the rockslide break-runout process. The finite difference code FLAC3D is a common platform for numerically modeling the rockslide break-runout process using the DEM-FDM coupled method. (di Prisco et al., 2023; Shi et al., 2021; Wang et al., 2022). Similarly, FEM (Escallón et al., 2015; Gentilini et al., 2012; Qi et al., 2018), DEM (Albaba et al., 2017), Coupled Arbitrary Lagrangian Eulerian and Finite Element Method (ALE-FEM) (Kwan et al., 2016), and DEM-FEM (Leonardi et al., 2016), have been widely adopted to numerically model the rockslide impact on flexible barriers. However, few studies have simultaneously modeled both the rockslide break-runout process and its impact on flexible barriers. For example, Zhao et al. (2020) investigated the complex dynamic interaction between a debris avalanche and flexible barrier using a coupled DEM-FEM. This model does not consider the actual 3D terrain, potentially leading to discrepancies in the actual deformation and runout behavior. Each method has its own advantages and limitations. FEM is well-suited for modeling structural responses with high accuracy but often struggles with simulating extreme deformations, fragmentation, and discontinuous processes. In contrast, DEM excels in capturing granular flow, block interactions, large displacements, and fragmentation phenomena, but is computationally expensive for large-domain or long-duration simulations. The coupled DEM-FDM approach, adopted in this study, effectively integrates the strengths of both methods: DEM efficiently simulates the complex behavior of the rockslide mass, including disintegration, runout, and impact, while FDM accurately represents the complex 3D bedrock topography and facilitates computationally efficient analysis of structural responses. However, a major challenge within the DEM-FDM coupled method lies in the representation of the flexible barrier itself. Modeling the barrier with DEM would require an excessive number of particles, resulting in high computational cost. Although representing the barrier within FDM is computationally efficient, existing constitutive models in codes such as FLAC3D are unable to accurately capture the large deformations, membrane behavior, and progressive failure typical of flexible barriers under impact.
This limitation highlights the critical need for a novel constitutive model that is both efficient and mechanically appropriate for flexible barriers. Although the model in this study is implemented in FLAC3D—due to its computational efficiency and precision, the proposed equivalent continuum approach is general and could be adapted to other continuum-based numerical platforms. To this end, this study theoretically developed a transversely isotropic plastic hardening constitutive model for flexible barriers and implemented it in FLAC3D through secondary development. The model was validated using experimental data from the literature and subsequently applied to analyze a case study in Jiuzhaigou County, China, examining the influence of protective energy capacity and barrier placement on protection effectiveness.
This rest of this paper is organized as follows. “Methodology” describes the processing of proposed theoretical model for flexible barriers. “Numerical example for validation” verifies the proposed method. “Application case” presents an application case. “Discussion and conclusion” draws the discussion and conclusion in this study.
Methodology
The DEM-FDM coupled method was employed to simulate the rockslide break-runout-impact process on flexible barriers. As illustrated in Figure 2, the numerical model was divided into two parts: the flexible barrier and bedrock were modeled using FDM continuum zones, while the rockslide was modeled using DEM discrete particles. To accurately model the dynamic response of flexible barriers under impact, a theoretical model was developed. The research steps are as follows: (1) theoretical basis and assumptions; (2) theoretical analysis of the tensile ring; (3) implementation in FLAC3D via secondary development. The process of establishing the rockslide and bedrock models involves building the numerical geometry and determining the material parameters. Ultimately, the validated numerical model was successfully applied to a practical case study of an actual rockslide event. Schematic flowchart of this study.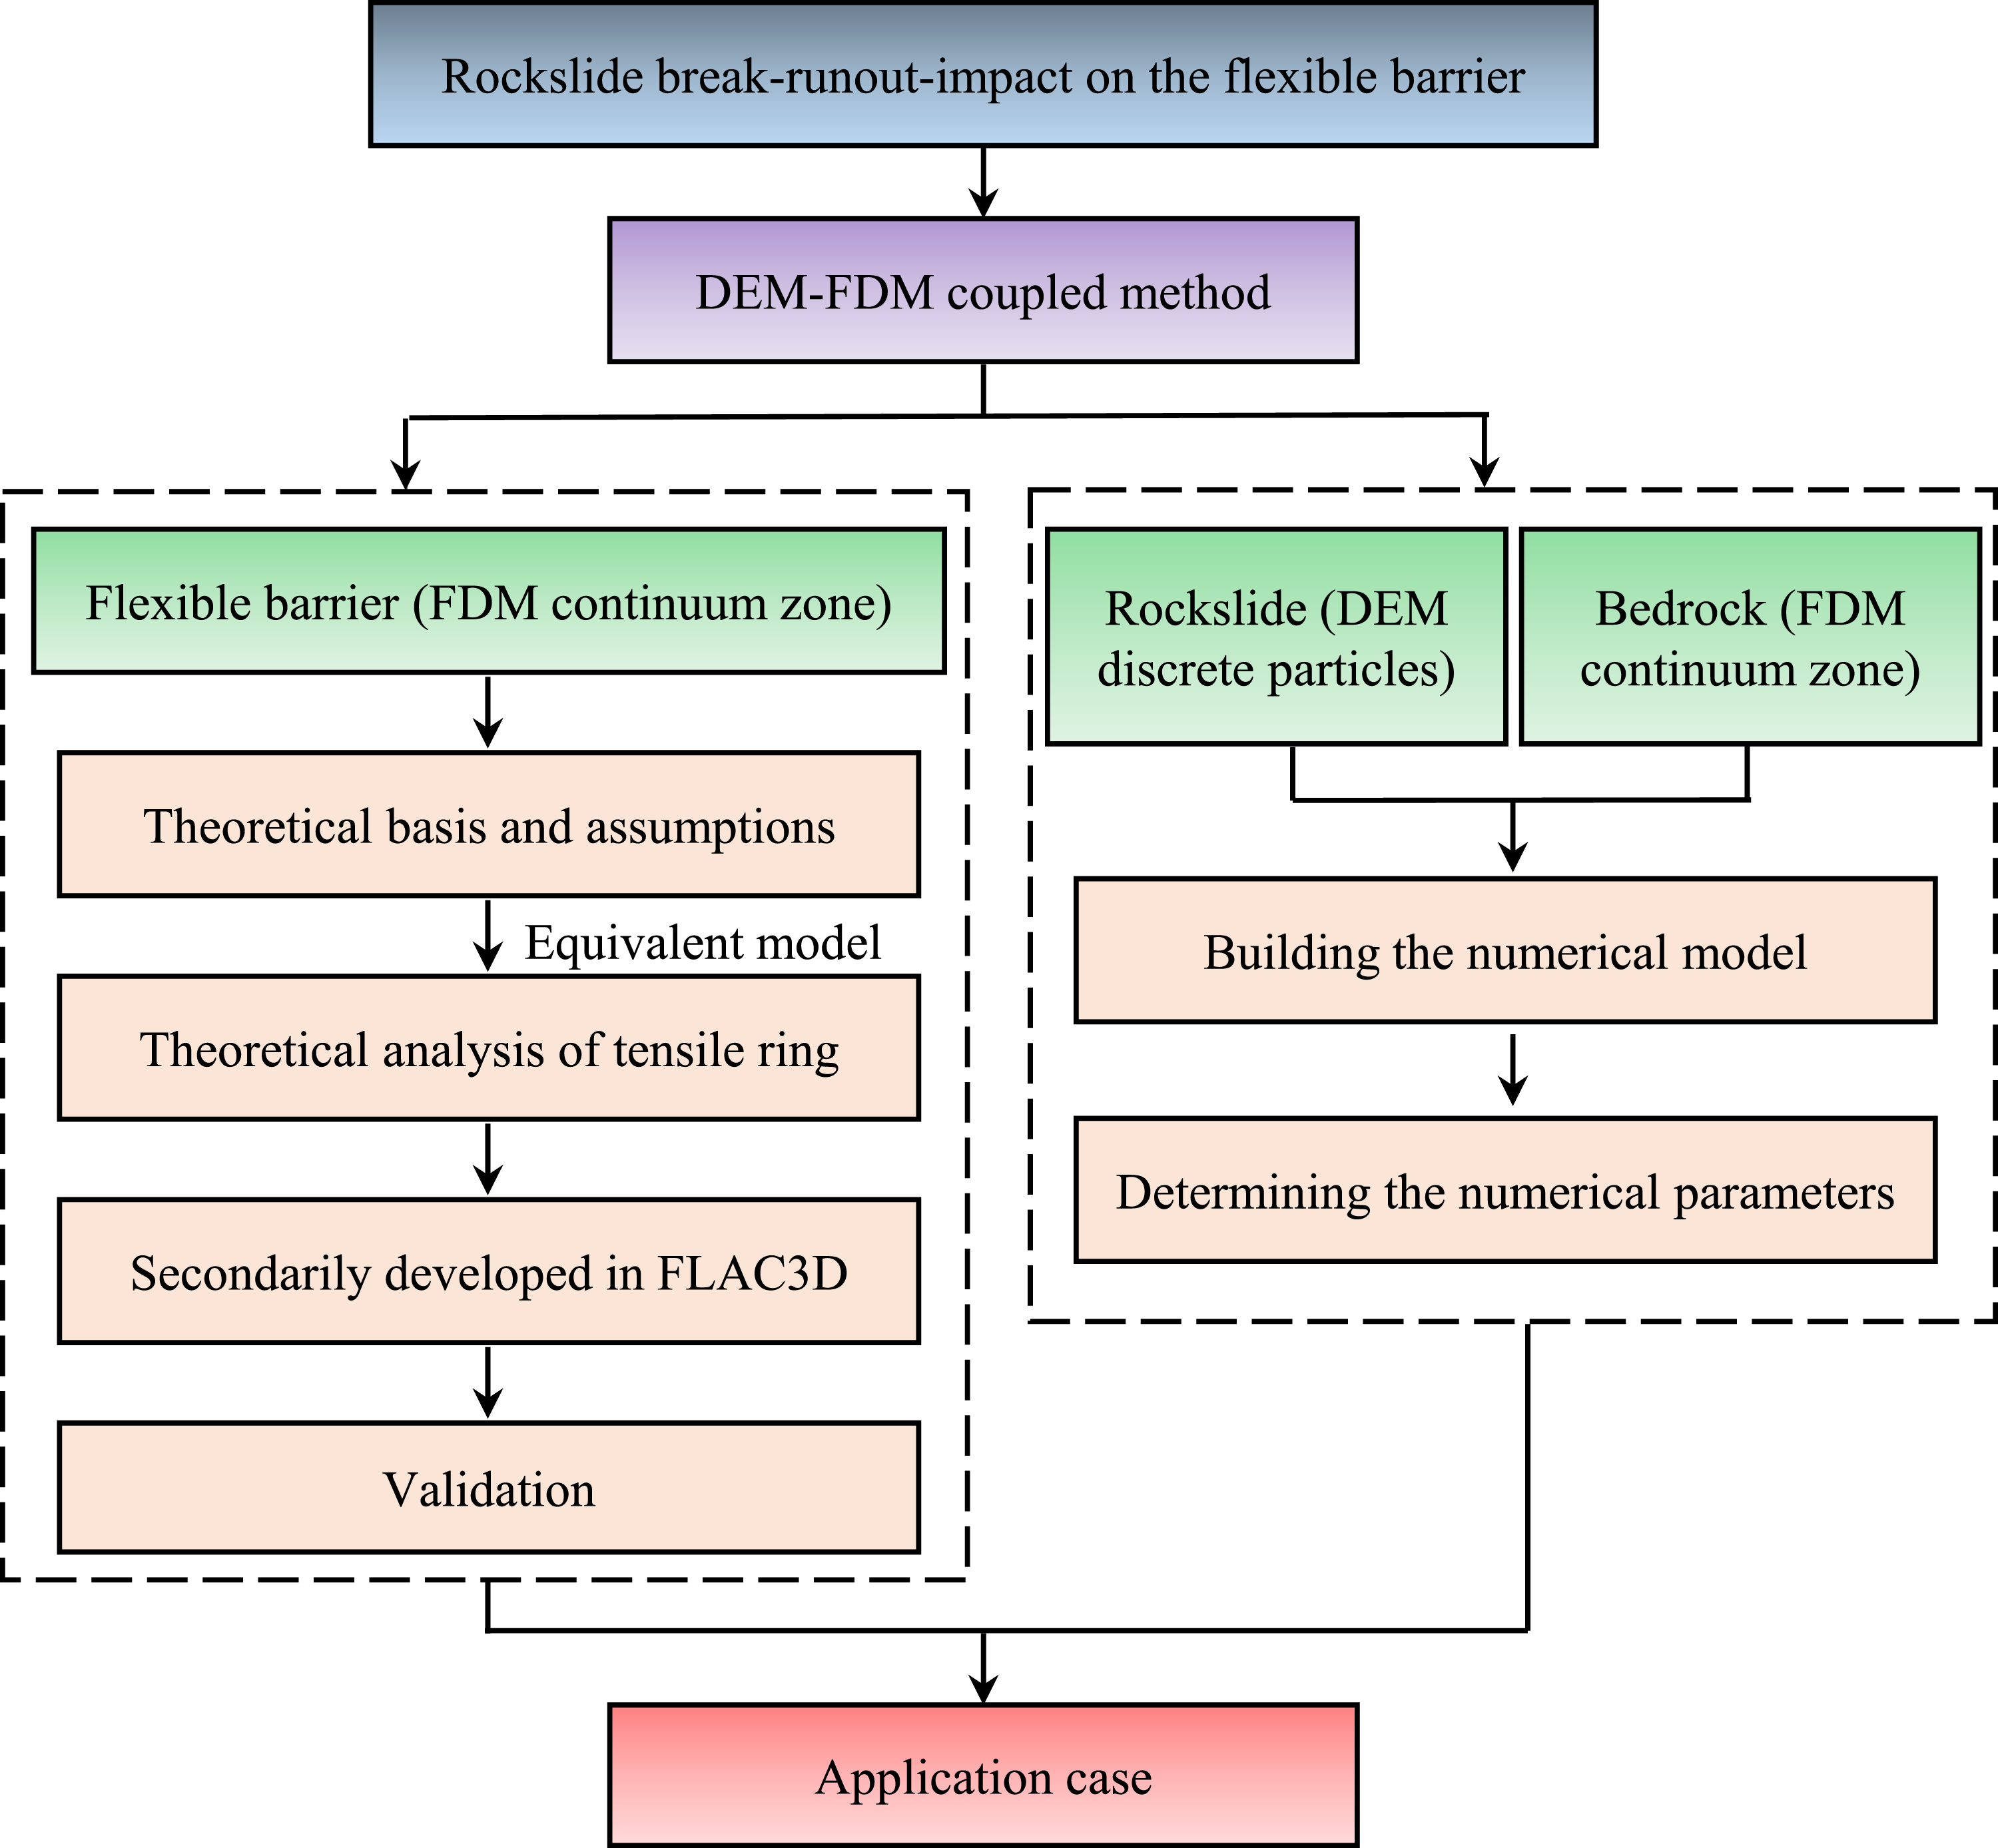
Determination of the equivalent model
Precise and equivalent numerical models were adopted to analyze the mechanical behavior of the flexible barriers. Precise numerical models explicitly represent individual components of flexible barriers, such as energy-dissipating devices (Castanon et al., 2018). However, this explicit representation often incurs significant computational overhead and cost. To address this issue, researchers have adopted equivalent numerical models to represent flexible barriers. Equivalent models simplify the complex flexible barrier structure such that the simplified representation maintains consistency with the mechanical properties, deformation behavior, and dynamic response of actual flexible barriers. For example, Tahmasbi et al. (2019) described a hybrid model of a flexible barrier in which the area impacted by rocks was designated as a beam element and the surrounding region was represented as a shell element. Other studies (e.g., Sautter et al. (2021), Mentani et al. (2018), and Dhakal et al. (2011)) have also presented a complex protection structure with a simpler surface description composed of isotropic membrane elements.
Mentani et al. (2018) confirmed that using mechanical test results of the metal rings in flexible barriers provides reasonable and reliable data for developing equivalent models. As shown in Figure 3, flexible barriers can be conceptualized as a “film” material, with the rings serving as the fundamental units constituting the “skeleton”. Equivalent model for flexible barriers.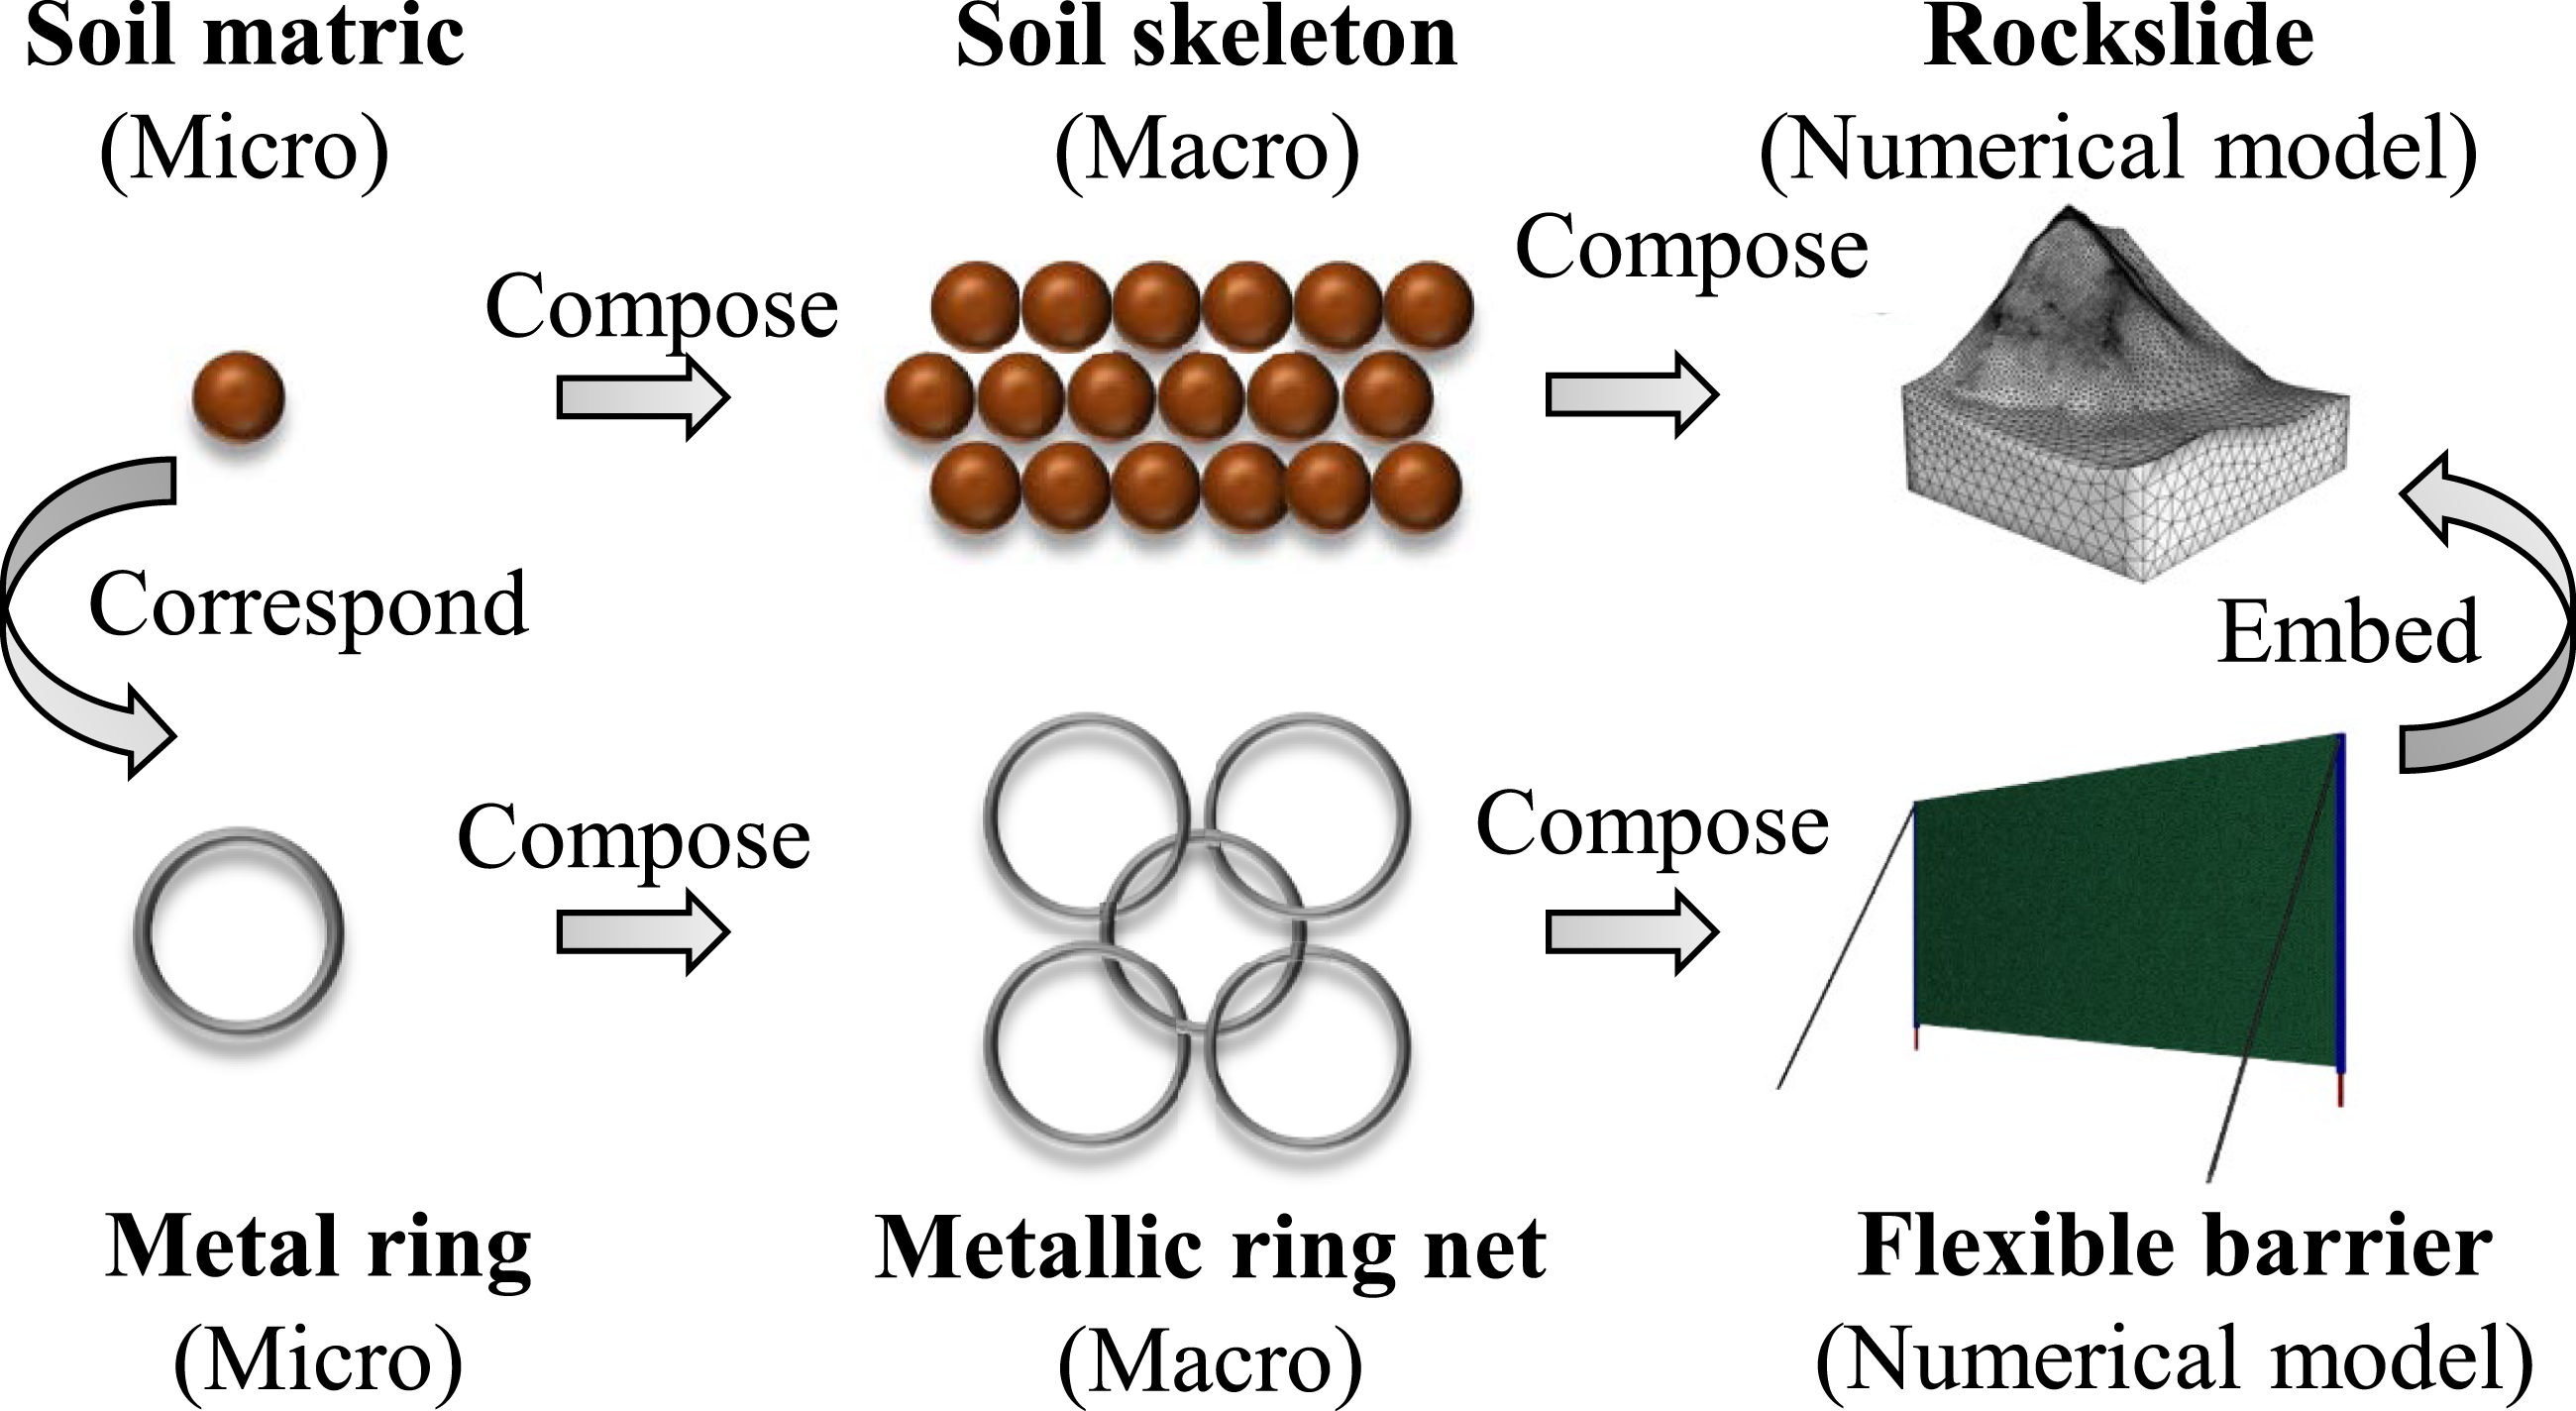
DEM-FDM coupled method
The DEM-FDM coupled method was used to simulate the actual trajectory of rockslides. Figure 4 shows the principle of the DEM-FDM coupled method (Cai et al., 2007). In FDM, force and velocity are transmitted through nodes, which can result in large deformations that are challenging to simulate accurately. Meanwhile, DEM excels at simulating large displacements, rotations, and complete separations, but typically incurs high computational costs. Therefore, the DEM-FDM coupled method leverages the strengths of each approach: bedrock and flexible barriers are modeled using FLAC3D continuum elements (FDM), while the rockslide is modeled using PFC3D discrete particles (DEM). This hybrid approach offers computational efficiency and numerical convenience. Principle of DEM-FDM coupled method.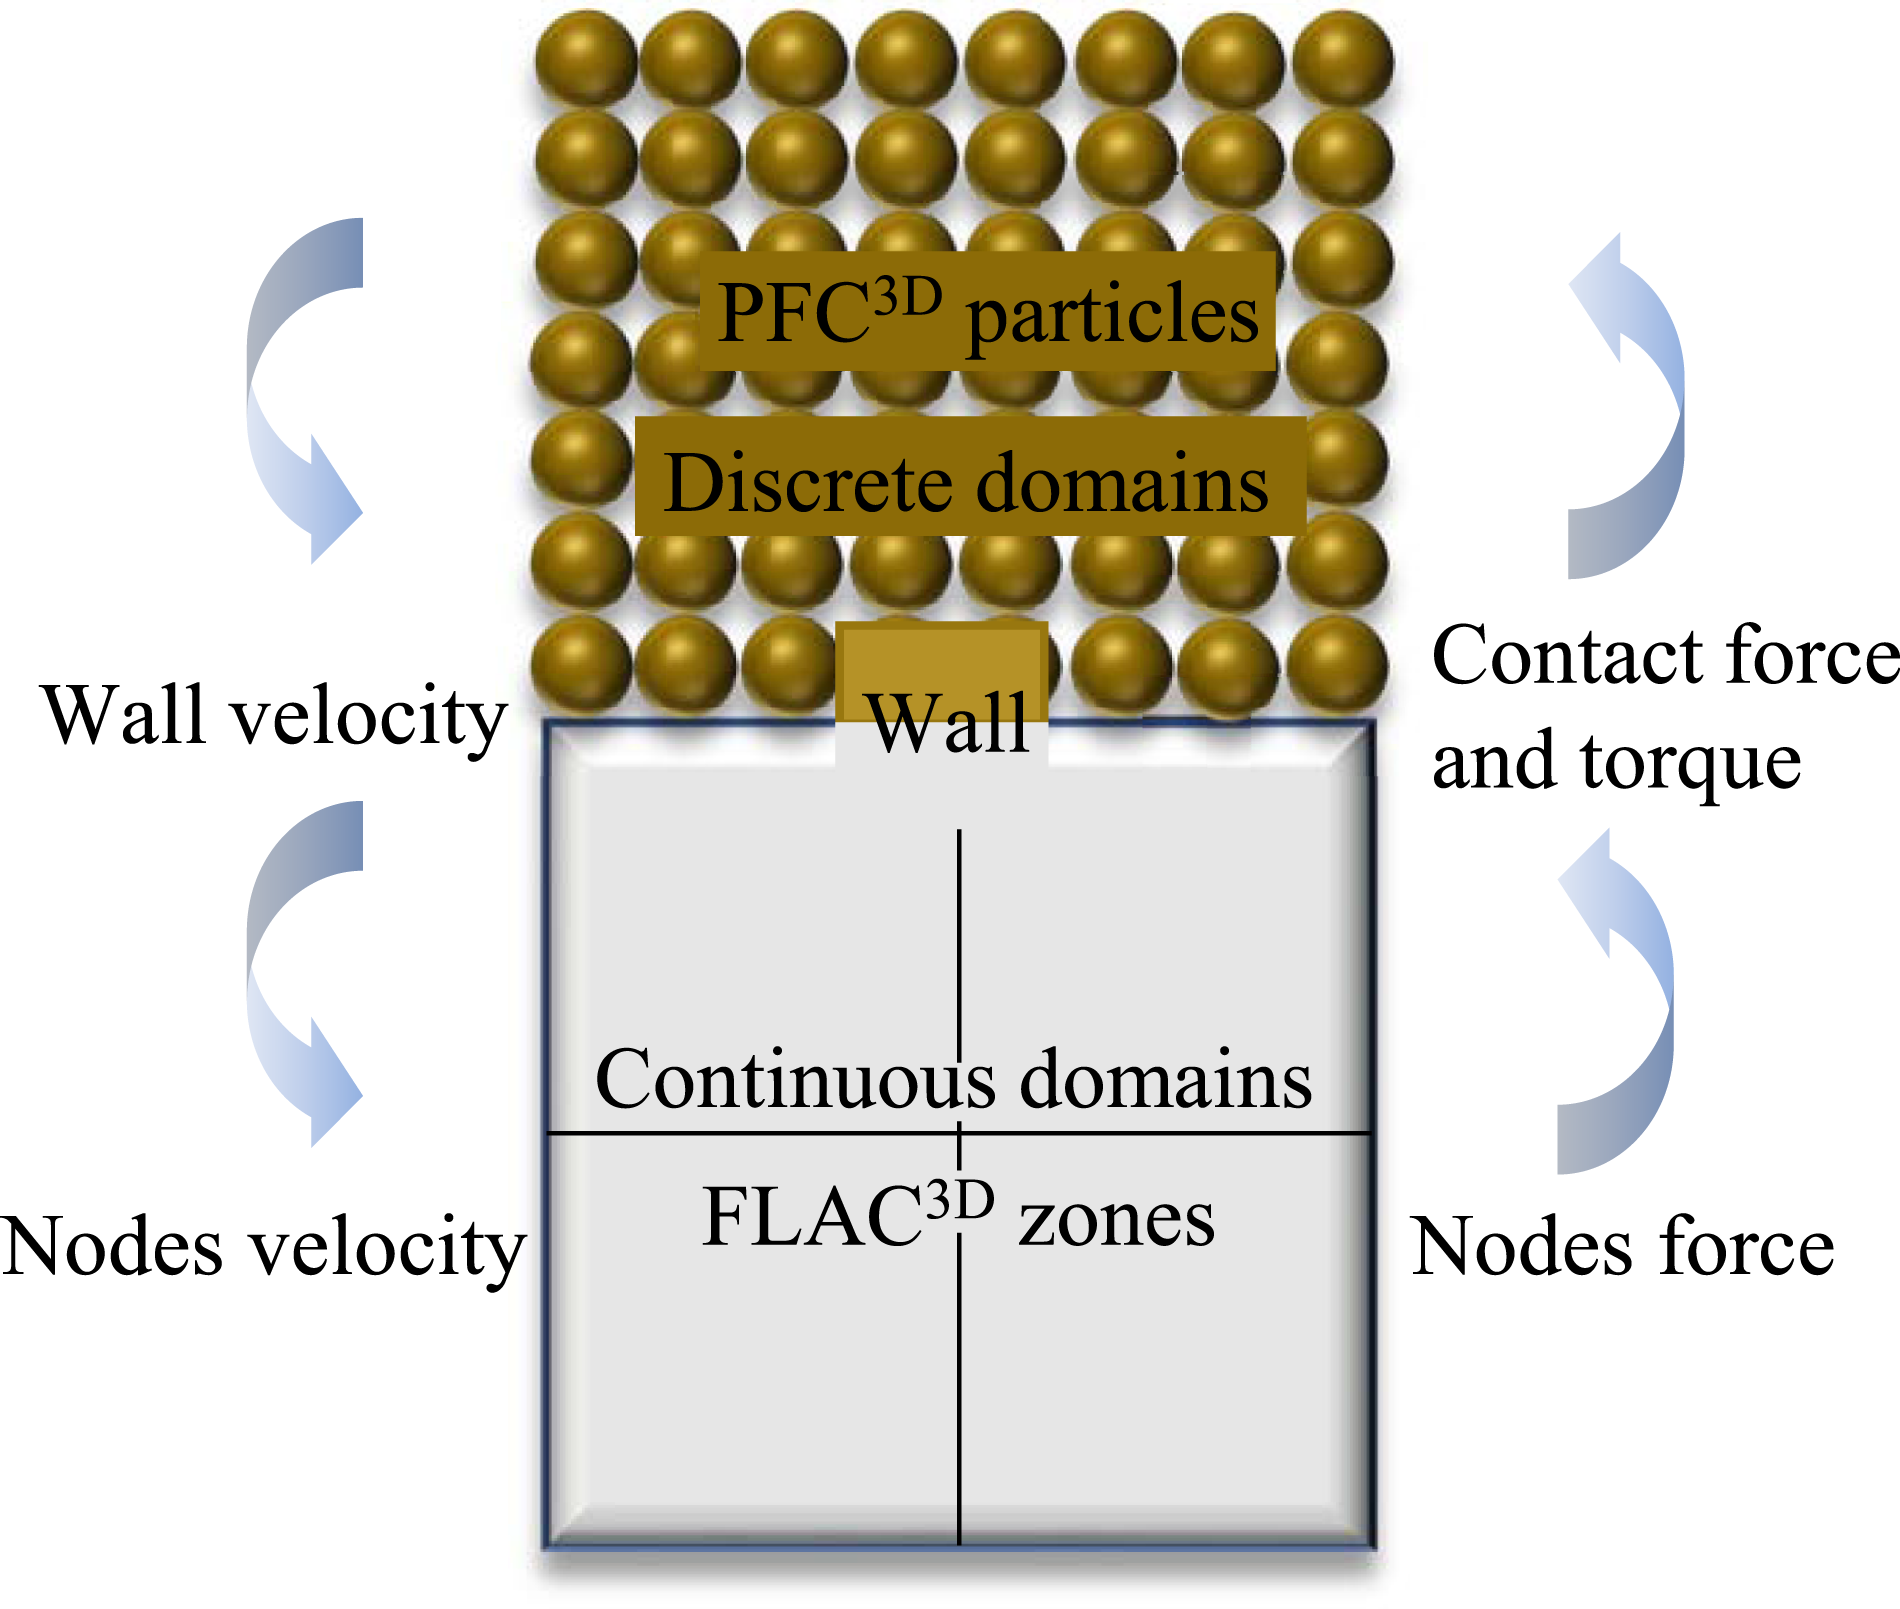
Development of theoretical and numerical model for flexible barriers
Theoretical basis and assumptions
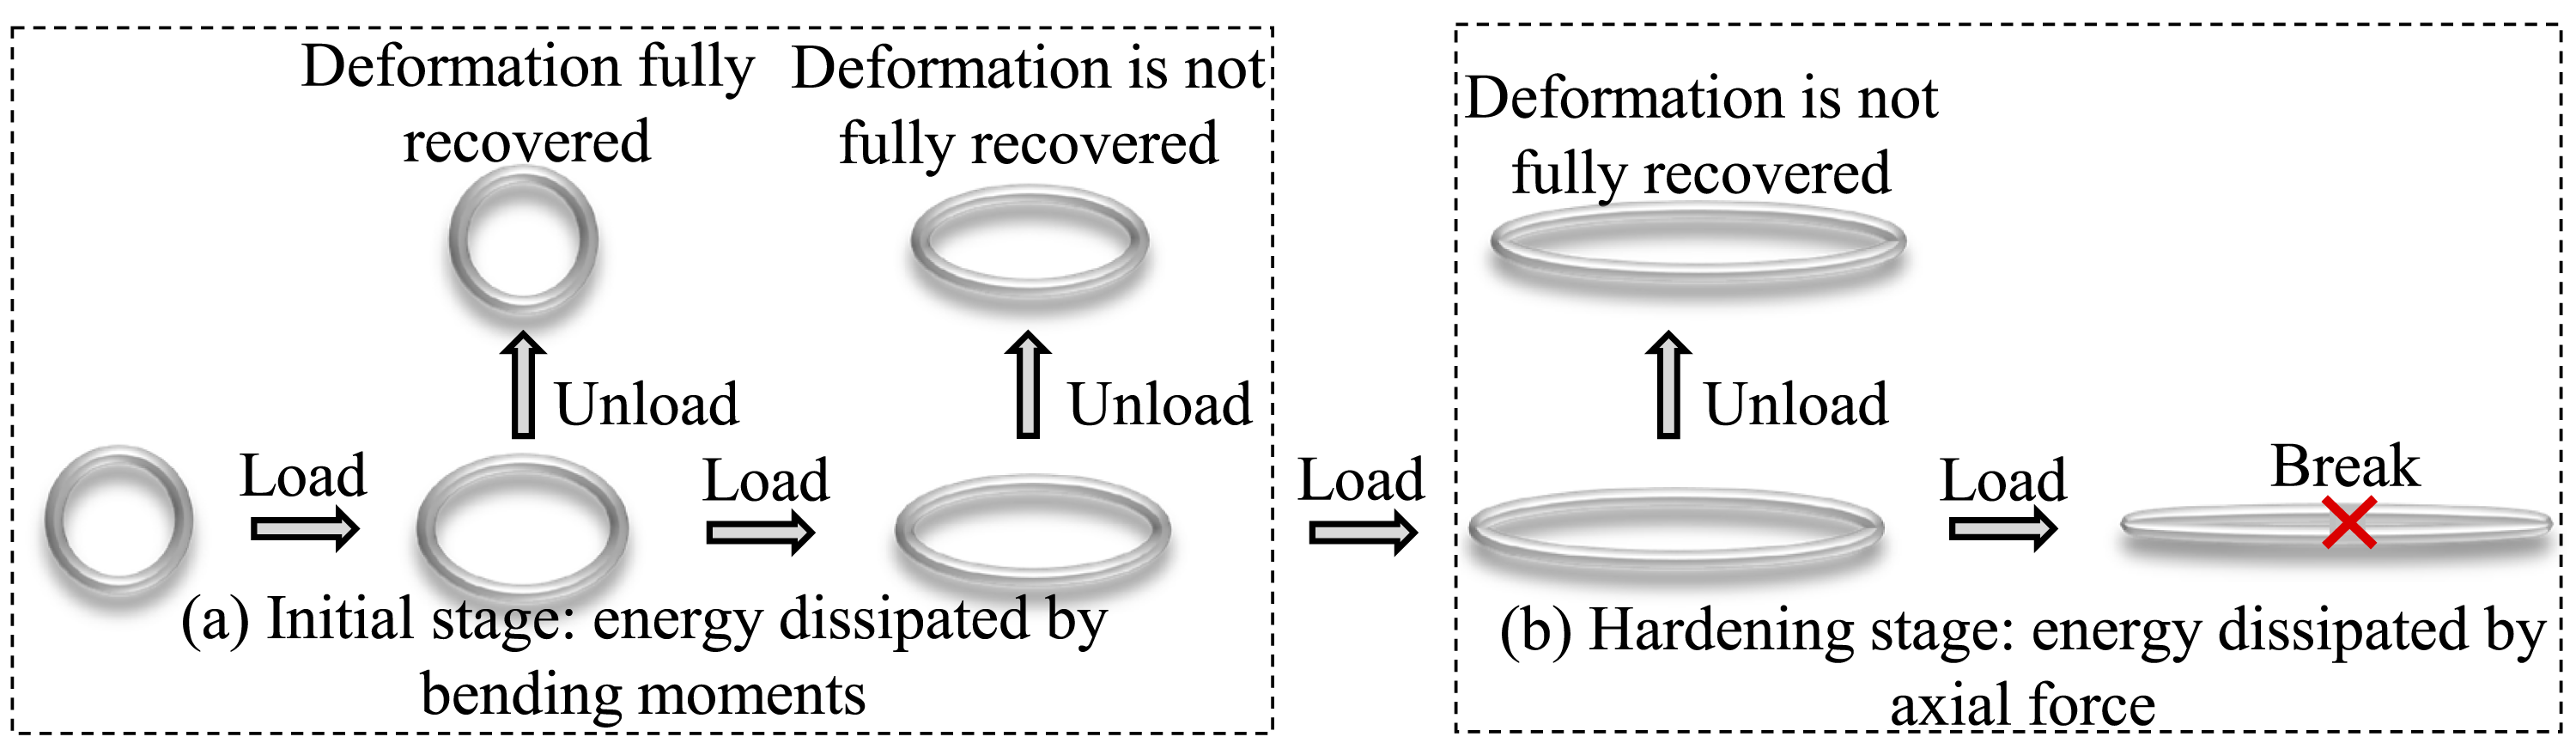
The following theoretical analysis of the ring tensile behavior is based on the experimental work of Nicot and Cambou (2001) and employs a rigid-plastic analytical framework to derive the transition between deformation stages. The theoretical analysis is based on these assumptions: (1) The ring material is idealized as rigid-perfectly plastic, neglecting elastic deformations. (2) The cross-sectional diameter d is significantly smaller than the ring radius R (d<<R), allowing it to be neglected in the geometric analysis of the neutral axis. (3) The total length of the ring remains constant throughout the deformation process. (4) The collapse mechanism is characterized by the formation of four discrete plastic hinges. (5) Segments of the ring between plastic hinges undergo rigid body motion. (6) In the collapse mechanism (Figure 7(b)), (7) The tensile response of the ring is idealized into two distinct mechanical phases: a pure bending-dominated stage where the influence of axial force is neglected, followed by a pure axial-dominated stage where the influence of bending moment is neglected.
Theoretical analysis of the tensile ring
Tensile ring test: (a) tensile loading test on a single ring, (b) experimental behavior of the ring. Deformation process of flexible barrier metal rings.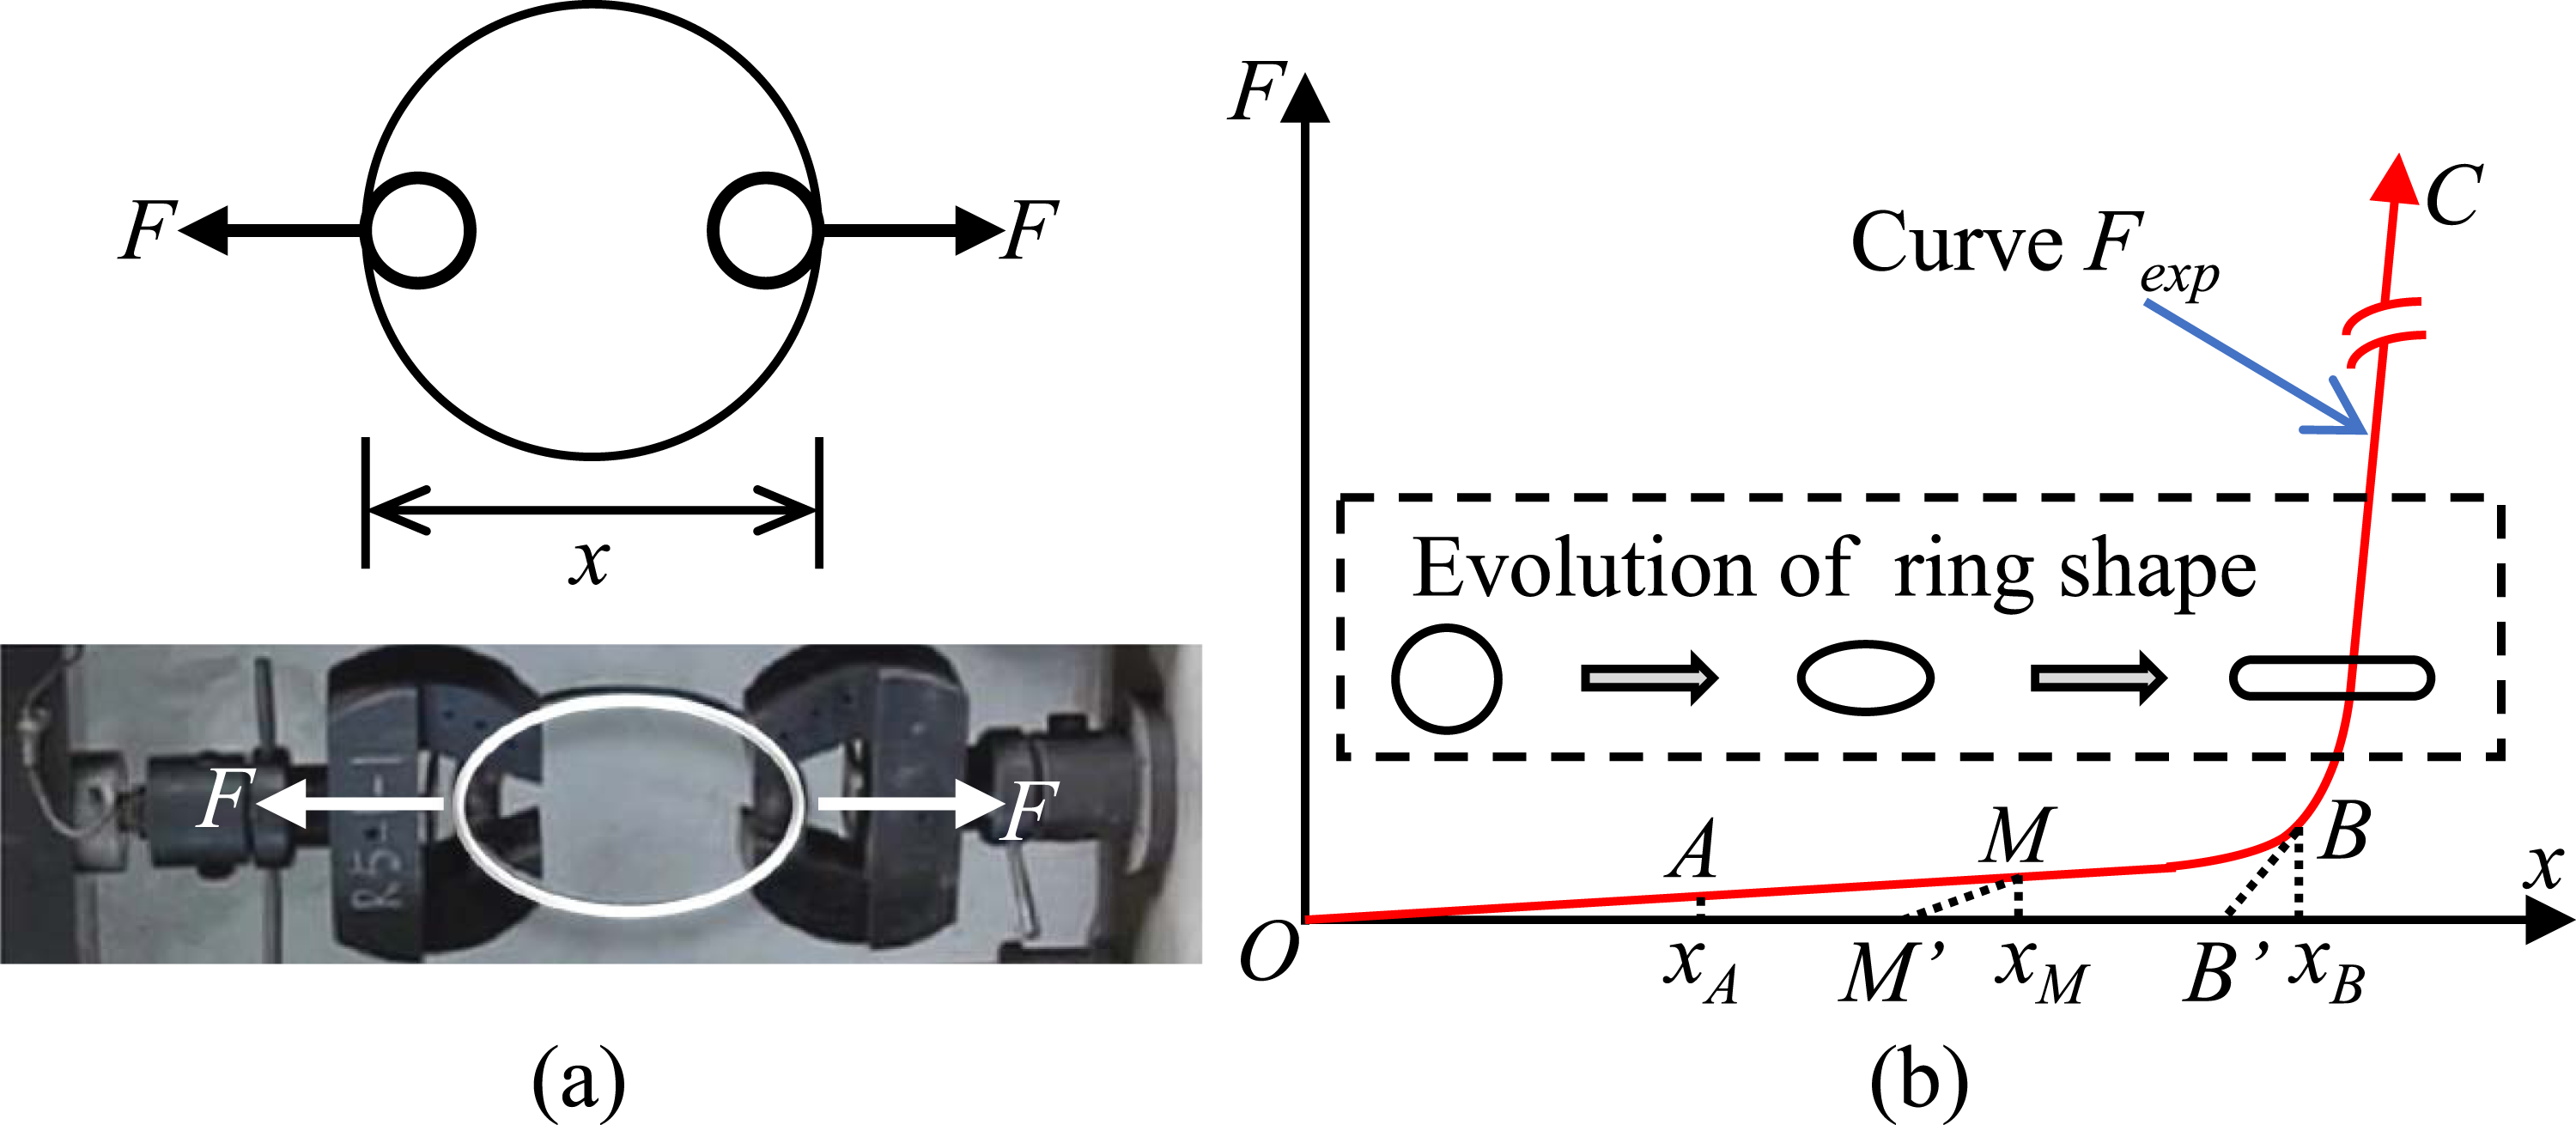
Rigid plastic ring under tension: (a) geometric model, (b) collapse mechanism.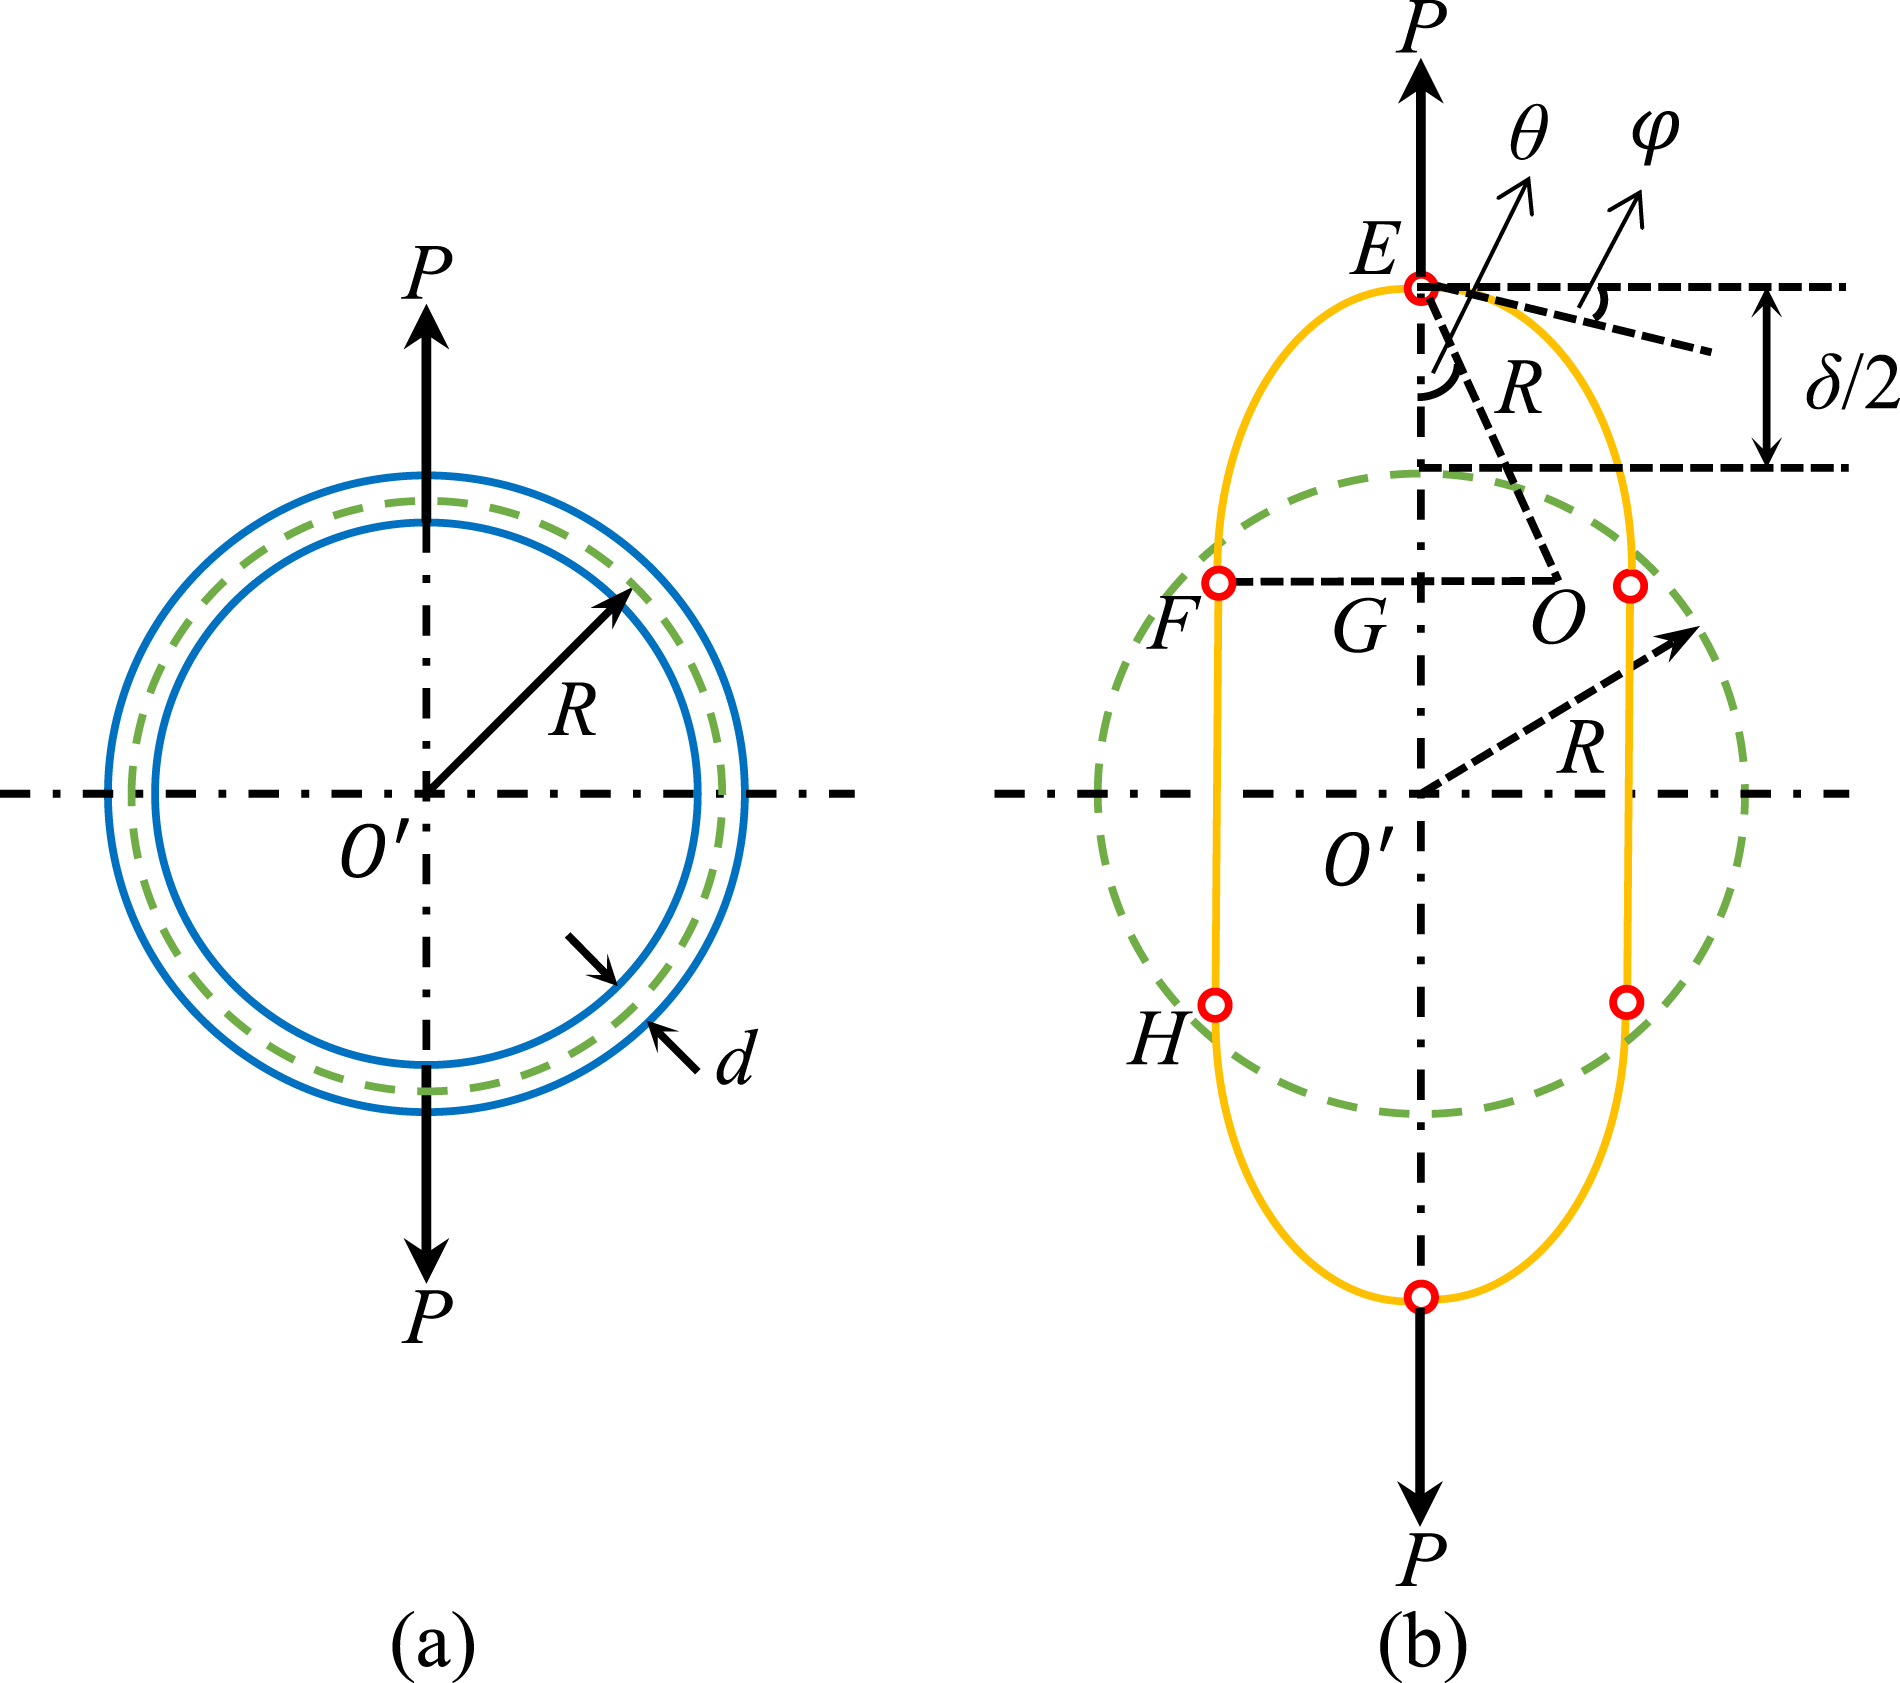
Let
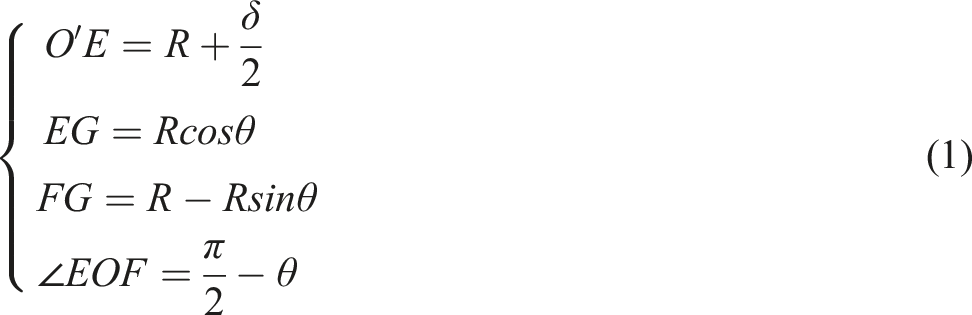

It can be obtained from equation (2):

Due to

The relationship between the displacement and radius of the ring is obtained as follows:


The transition from the initial bending-dominated stage to the subsequent axial-force-dominated hardening stage is ultimately governed by material failure due to excessive bending strain at the plastic hinges, not merely by geometric evolution. Figure 8 shows a partially enlarged view of the tensile ring. The most significant curvature change was in the position of the ring under tension. According to the large deformation theory, this point is a fixed plastic hinge, and the finite length of the plastic hinge is Partially enlarged view of the plastic hinge region.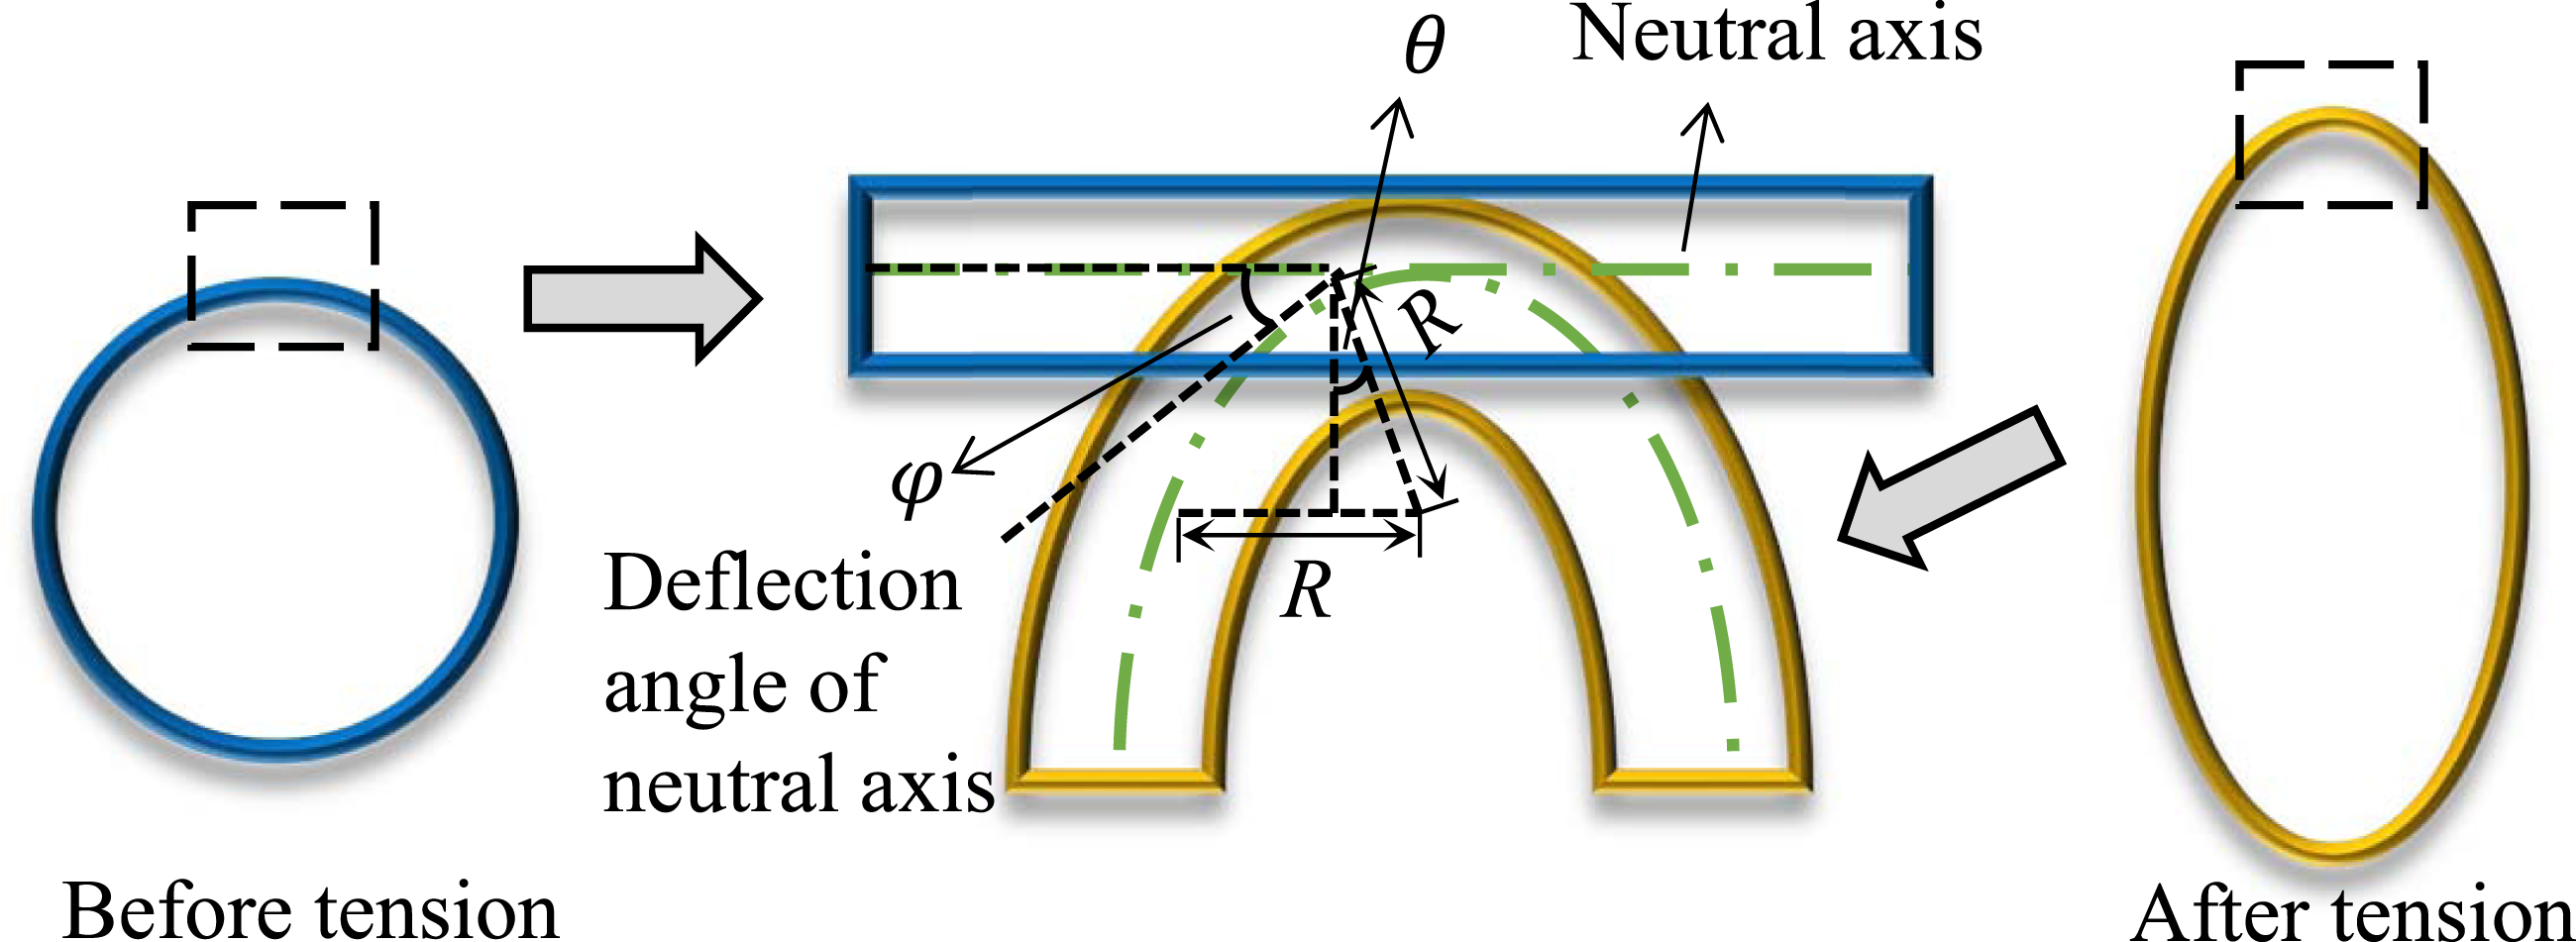

Let

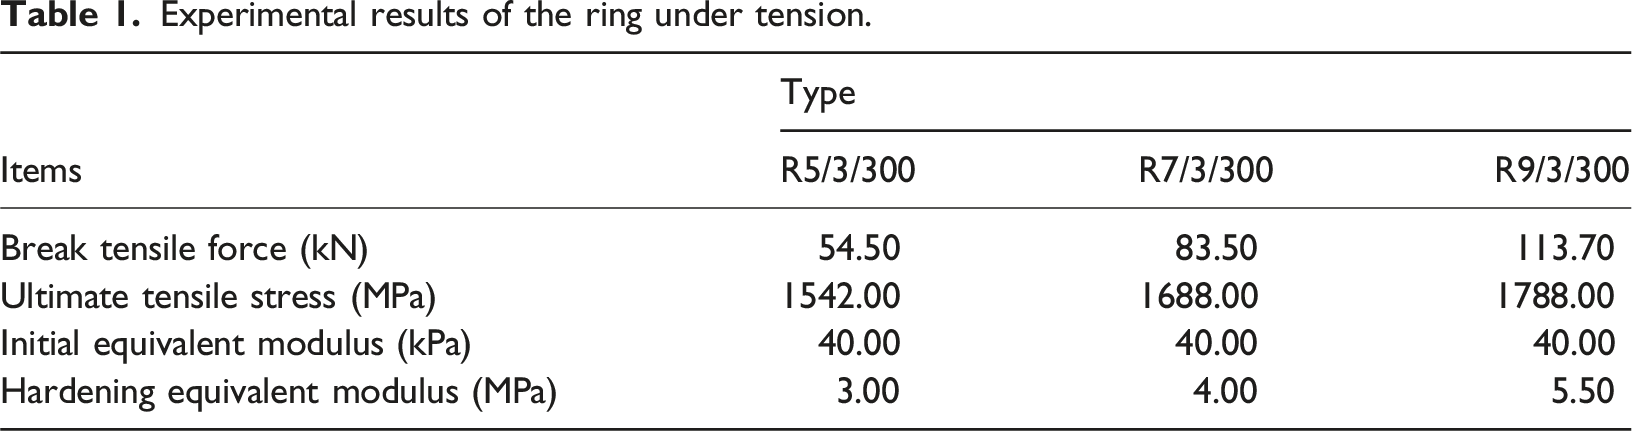
The tensile ring test of Zhao (2018) was used to verify the theoretical analysis, as shown in Figure 9(a)–(e). The results of the tensile load-displacement test are shown in Figure 10(a), where it can be observed that the critical point of the hardening stage was approximately 130 mm corresponding to Deformation process of tensile ring: (a) start, (b) bending stage, (c) tensile stage, (d) break stage, (e) location of the breakpoint. Results of tensile ring tests: (a) force-displacement curve of tensile ring; (b) stress-strain curve of the equivalent model.

Experimental results of the ring under tension.
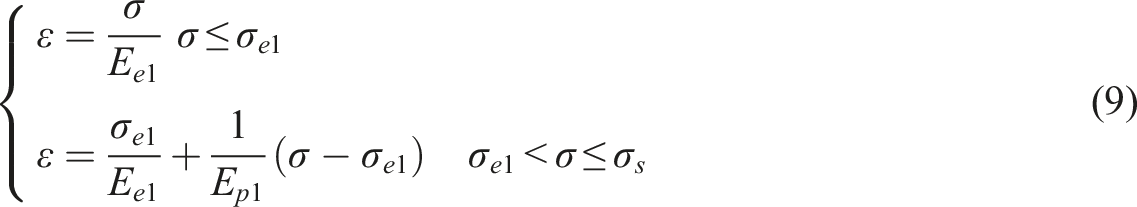

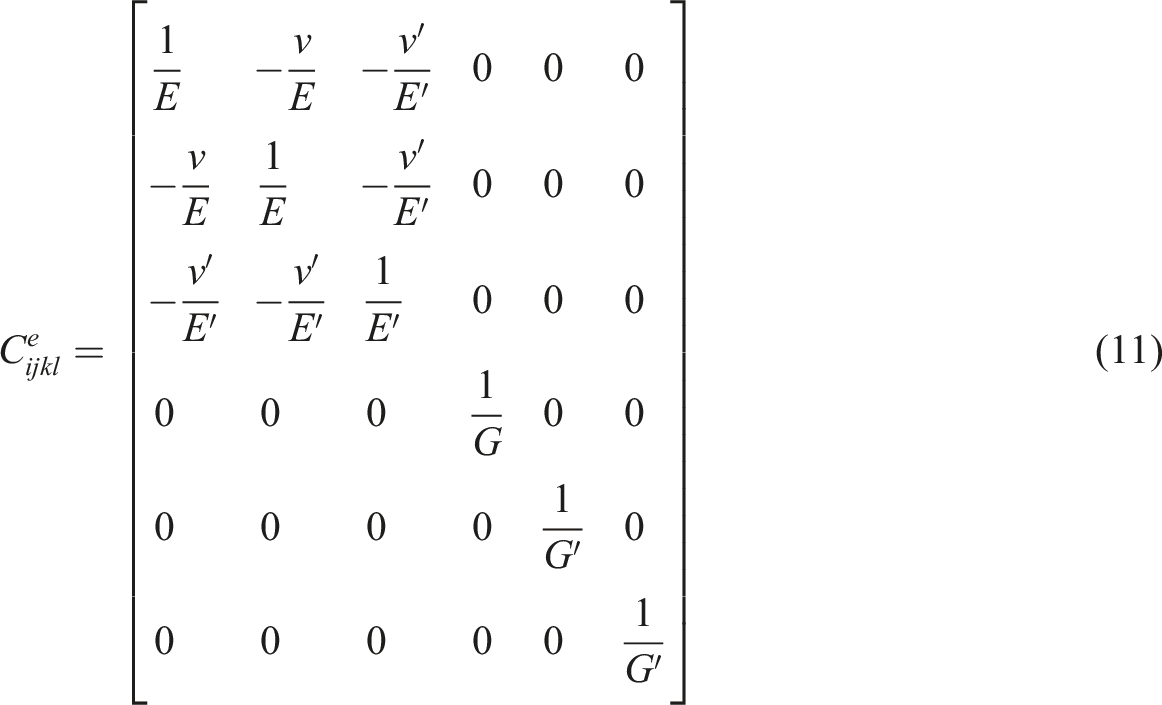
The constitutive model for the equivalent film material is consistent with the ring material in the hardening stage. Based on the Hill yield criterion for anisotropic materials, the corrected yield function of transversely isotropic materials is:

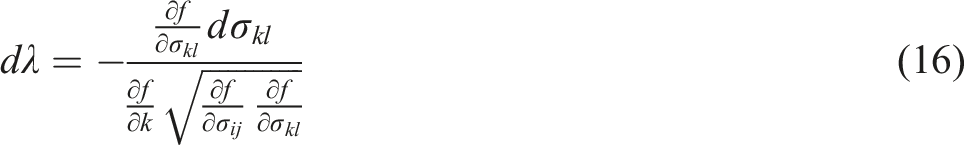
The correlation flow rule is adopted for the metal material constituting the ring. The relationship between the plastic strain increment and the yield function is as follows: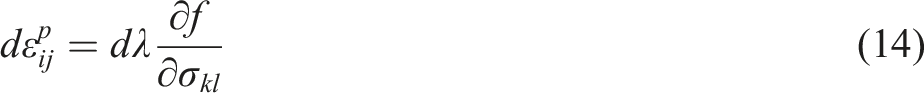

Numerical parameters
Numerical parameters of the constitutive model.

Note. The tensile ring test only occurs on homogeneous surfaces, and the parameters of the heterogeneous surfaces are lacking. The authors selected the following appropriate simulation parameters through repeated experiments: Poisson-normal = 0. E-initial-normal = Shear-normal
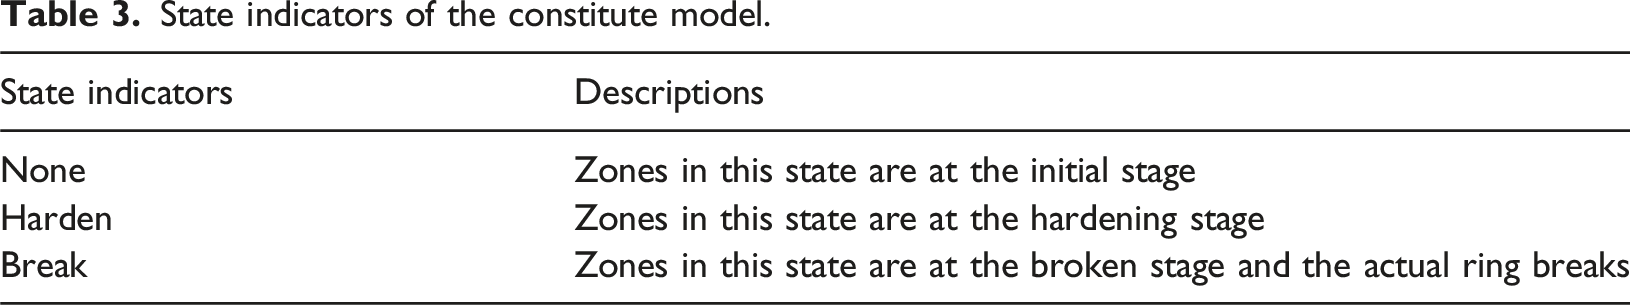
State indicators of the constitute model.
Parameter calibration and generalization
The proposed constitutive model provides a framework for simulating flexible barriers with varying ring configurations (number of rings, diameter, etc.) and material properties, which requires calibration of key parameters (E-initial-plane, E-harden-plane, Break-force) for specific ring designs. The methodology is as follows:
Numerical example for validation
Three experimental tests were simulated to verify the proposed constitutive model for the flexible barrier: a single ring under tension (Zhao 2018), multi-ring under tension (Boulaud and Douthe, 2022) and full-scale impact tests (Gentilini et al., 2012; Gottardi and Govoni, 2010).
Single ring under tension
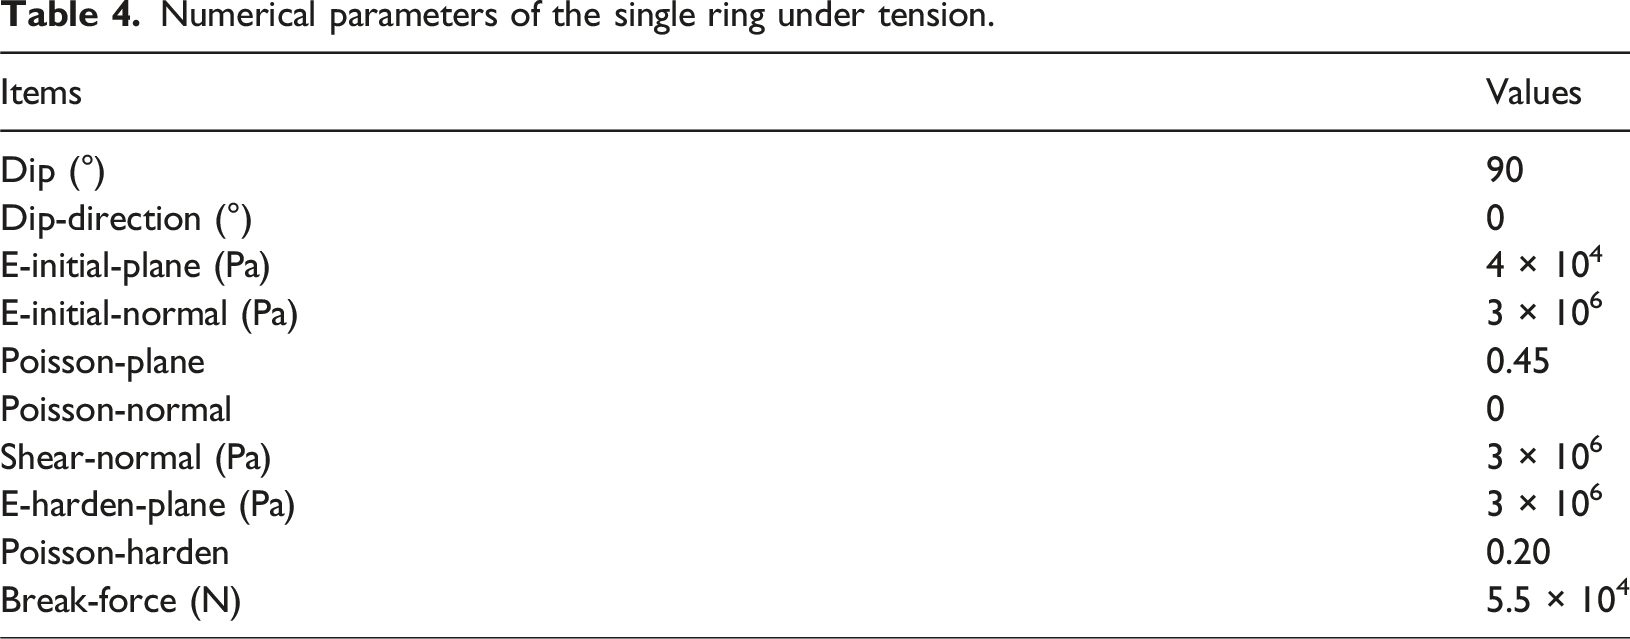
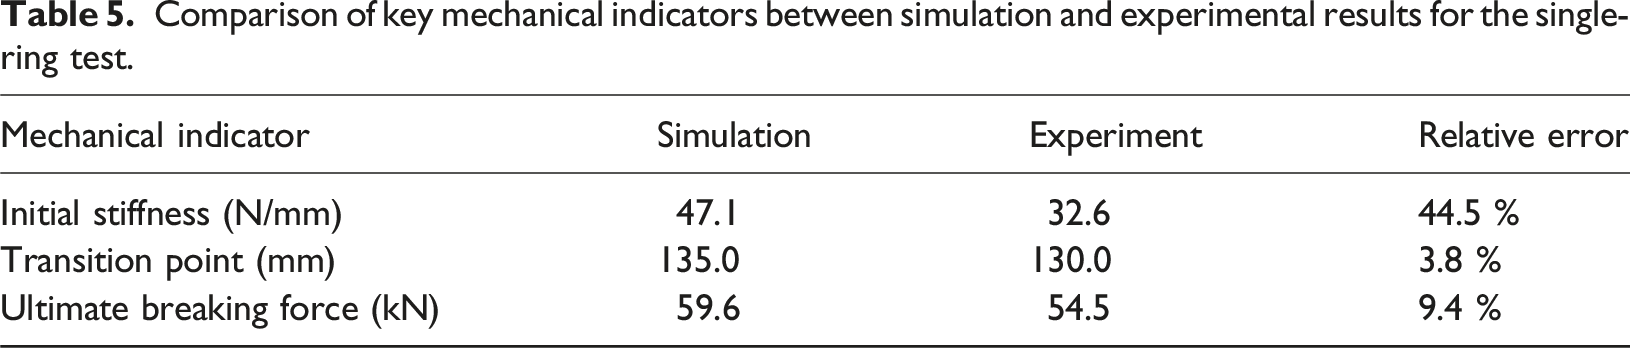
As shown in Figure 11, the size of the established numerical model was 0.3 × 0.03 × 0.3 m. The dimension in the y direction was 0.1 times that of the x and z directions, as the length in the y direction remains unaffected. The upper and lower boundaries were under tension along the diameter with a loading velocity of 8 × 10⁻⁵ m/s. The numerical parameters are listed in Table 4. A detailed comparison of the numerical and experimental force–displacement curves (Figure 11(b)) reveals differences in the precise loading path, particularly in the initial and post-transition stages. To quantitatively evaluate the accuracy of the simulation, key mechanical indicators are compared in Table 5. The numerical model shows agreement with experimental results in terms of the ultimate breaking force (9.4% error) and the displacement at the transition point (3.8% error), demonstrating its capability to accurately predict critical mechanical properties such as load-bearing capacity and the onset of the hardening stage. However, a noticeable discrepancy is observed in the initial stiffness, with a relative error of 44.5%. This deviation can be primarily attributed to the idealized boundary conditions (e.g., frictionless pinned connections) used in the simulation, which differ from the actual physical constraints (e.g., friction and minor gaps in bolted connections) in the experiment. Additionally, the neglect of elastic deformation in the adopted rigid-plastic material model further contributes to this discrepancy in the initial elastic response. Despite these minor discrepancies in the detailed loading path, the overall trend of the simulated force–displacement curve agrees well with experimental measurements. The model reproduces the characteristic two-stage mechanical behavior of the ring—namely, the initial bending-dominated stage with low stiffness, followed by the transition to a high-stiffness, axial-dominated hardening stage. The close agreement in ultimate breaking force and transition displacement, as quantitatively summarized in Table 5, confirms the validity of the proposed model for assessing the overall performance of the ring system. The single ring under tension: (a) experiment test, (b) comparison of the numerical modeling and experimental test (the black and red curve correspond to the black and red axis respectively), (c) numerical modeling, (d) deformation states of the ring. Numerical parameters of the single ring under tension. Comparison of key mechanical indicators between simulation and experimental results for the single-ring test.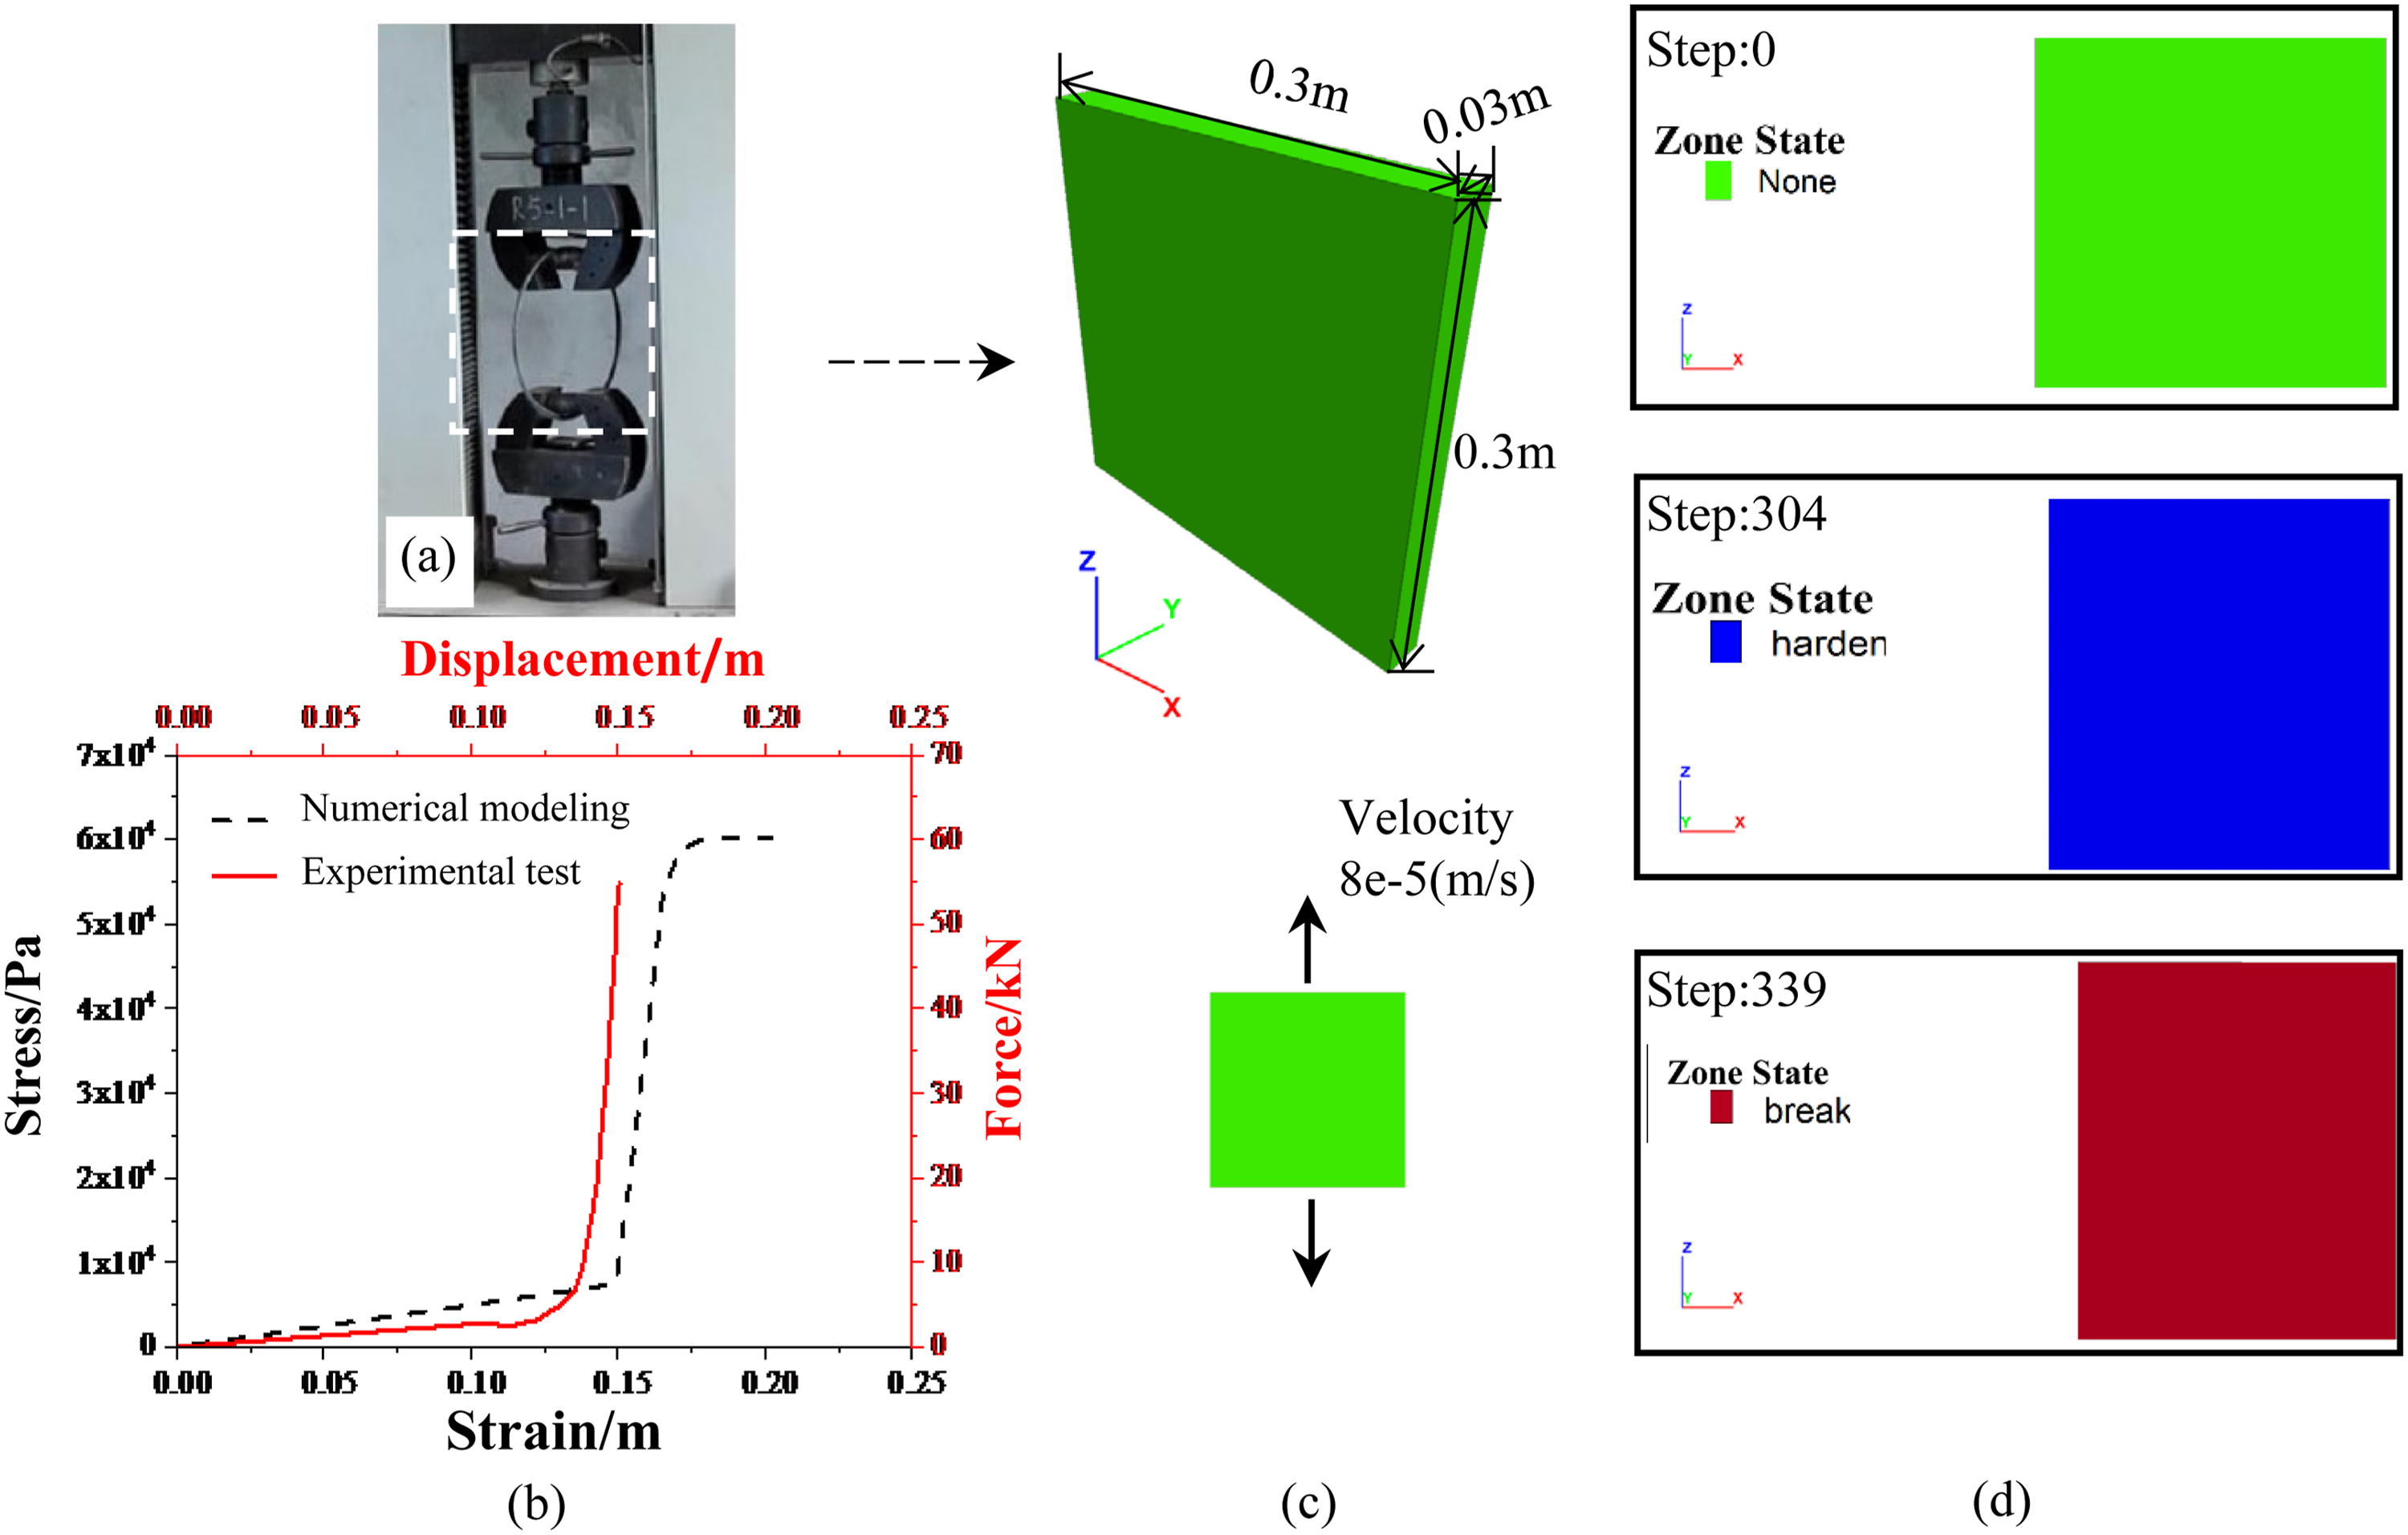
Multi-ring under tension
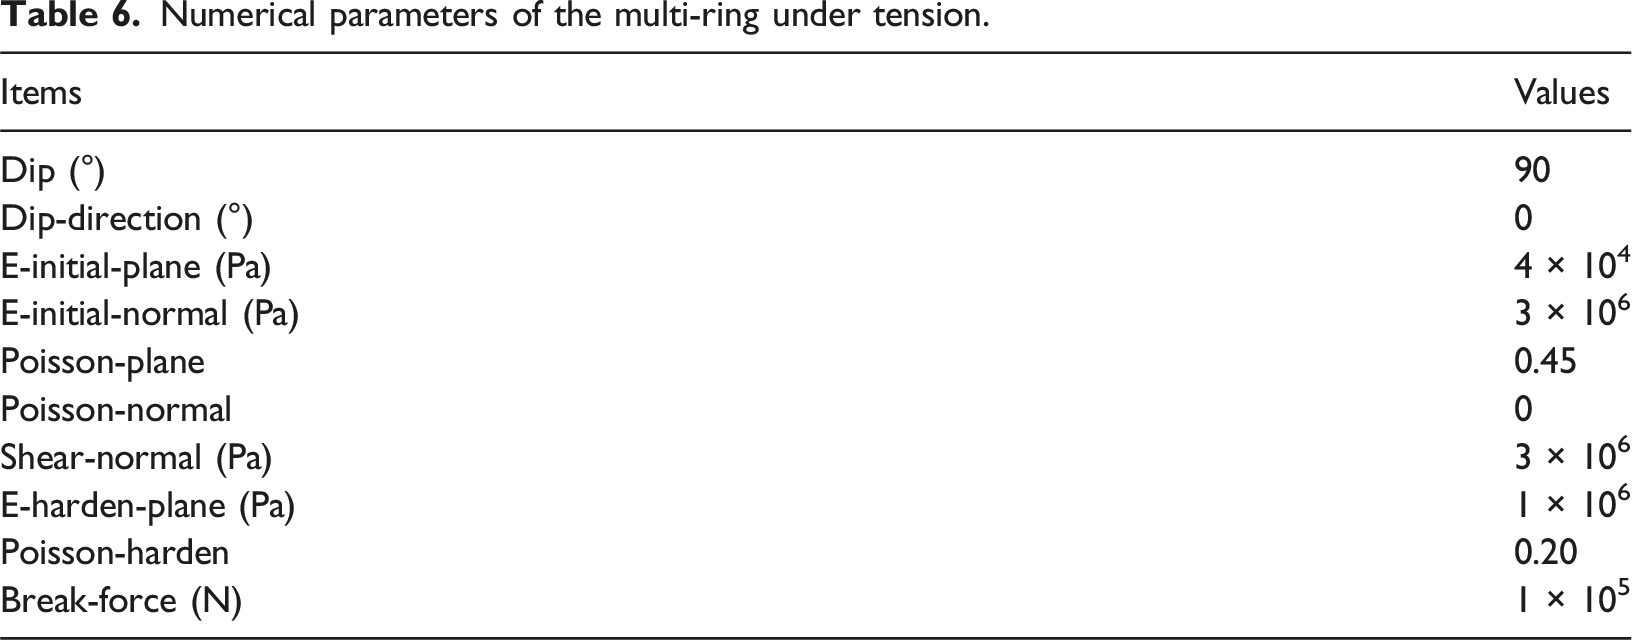
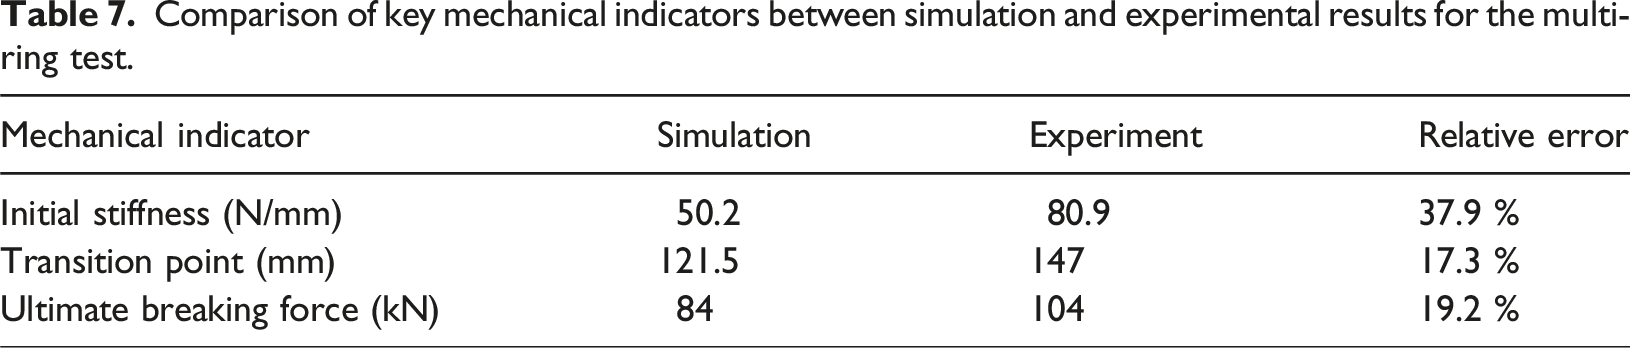
As shown in Figure 12, the multi-ring under tension consisted of a square rigid support frame with 3 × 3 rings, each with a radius of 13.5 cm. During loading, one edge of the support frame was displaced while constraining normal displacements on the opposite edge; tangential displacements were free on all boundaries. Table 6 lists the numerical parameters used in this study. A quantitative comparison of key mechanical indicators between the simulation and experimental results is summarized in Table 7. The relative errors for the ultimate breaking force and transition displacement are 19.2% and 17.3%, respectively. Although these values are higher than those observed in the single-ring test, they are considered acceptable given the greater complexity of the multi-ring system, which involves intricate ring-to-ring and ring-to-frame interactions. The most significant discrepancy is observed in the initial stiffness (37.9% error), which is consistent with the single-ring findings and can be similarly attributed to the idealized boundary conditions and material model. As shown in Figure 12(b), the transition to the hardening stage occurred at a displacement of approximately 0.15 m, which aligns broadly with the value of 0.12 m predicted by the single-ring theoretical model (Equation (8)). The minor deviation can be attributed to the idealized assumptions of the analytical model, particularly the neglect of elastic deformation and detailed contact interactions. Nevertheless, the overall mechanical behavior shows good agreement with the theoretical prediction. Despite these discrepancies in quantitative values, the numerical results reproduce the key features of the experimental response, including the characteristic two-stage behavior and the ultimate failure mode. As shown in Figure 12(d), the simulation accurately captures the progressive failure sequence, with edge rings entering the hardening state first, followed by the central ring—a pattern also observed experimentally. This consistency between simulation and experiment, particularly in capturing the essential failure mechanisms, demonstrates the ability of the proposed constitutive model to represent the essential mechanical behavior of multi-ring barrier systems. Multi-ring under tension: (a) experiment test, (b) comparison of the numerical modeling and experimental tests (the black and red curve correspond to the black and red axis respectively), (c) numerical modeling, (d) deformation states of multi-rings. Numerical parameters of the multi-ring under tension. Comparison of key mechanical indicators between simulation and experimental results for the multi-ring test.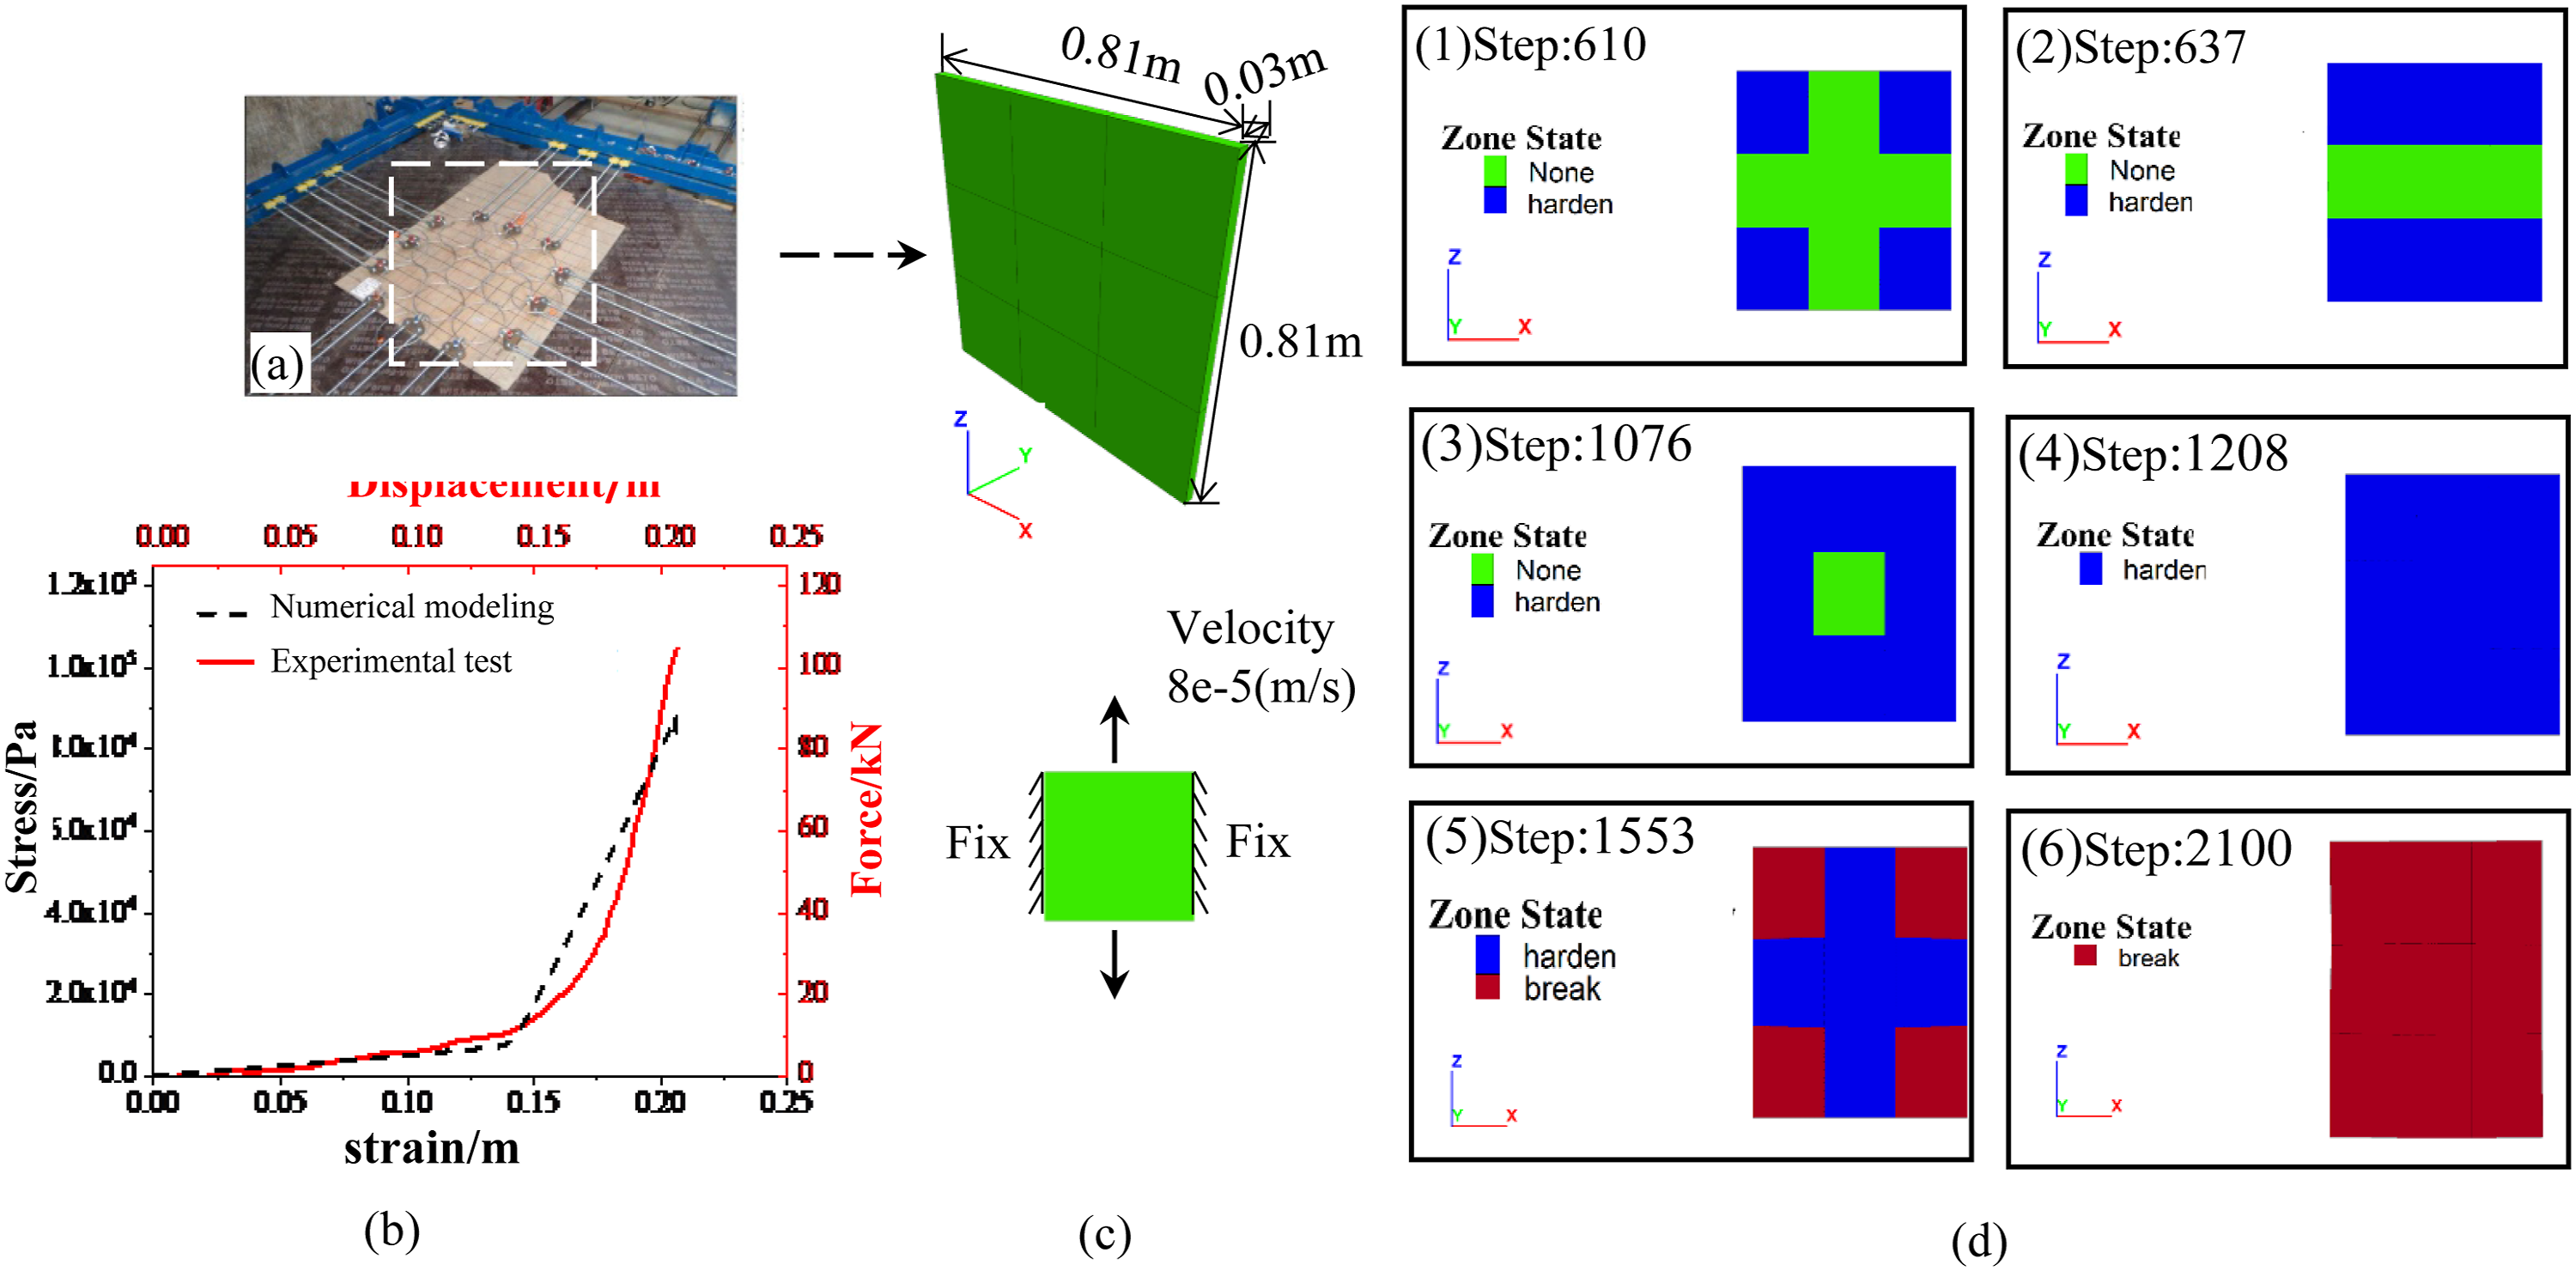
Full-scale impact tests
To further validate the proposed constitutive model and the coupled DEM-FDM approach, a simulation of a full-scale impact test was conducted and compared with field test data reported in the literature (Gentilini et al., 2012; Gottardi and Govoni, 2010) in Fonzaso, Belluno, Italy. The numerical model was configured to replicate the conditions of the referenced field test. The flexible barrier parameters were calibrated based on tensile test data of the OM CTR 50/07/A 5000 kJ flexible barrier (Gottardi and Govoni, 2010), as shown in Figure 13. The mesh size in the numerical model was set to 0.35 m to match the actual ring size of the physical barrier. The dotted line represents the experimental results and the solid line represents the fitted constitutive model curve of the flexible barrier. Therefore, the initial equivalent modulus (E1) and hardening modulus (E2) were set to 3.5 MPa and 35 MPa, respectively. Table 8 summarizes the complete set of numerical parameters used for the flexible barrier model. The isotropic and heterogeneous planes of the flexible barrier deflected during rockslide impact; therefore, the numerical parameters were simplified. Owing to the lack of tensile tests for other types of flexible barriers, these numerical parameters were estimated based on OM CTR 50/07/A. The initial modulus (E1) is designed to be 0.1 times the hardening modulus (E2). The modulus of the flexible barriers and the variation in local damping are generally positively correlated with the impact energy. Flexible barrier (OM CTR 50/07/A, 5000 kJ) tensile test: (a) experiment test; (b) comparison of the numerical modeling and experimental tests. Numerical parameters of the flexible barrier.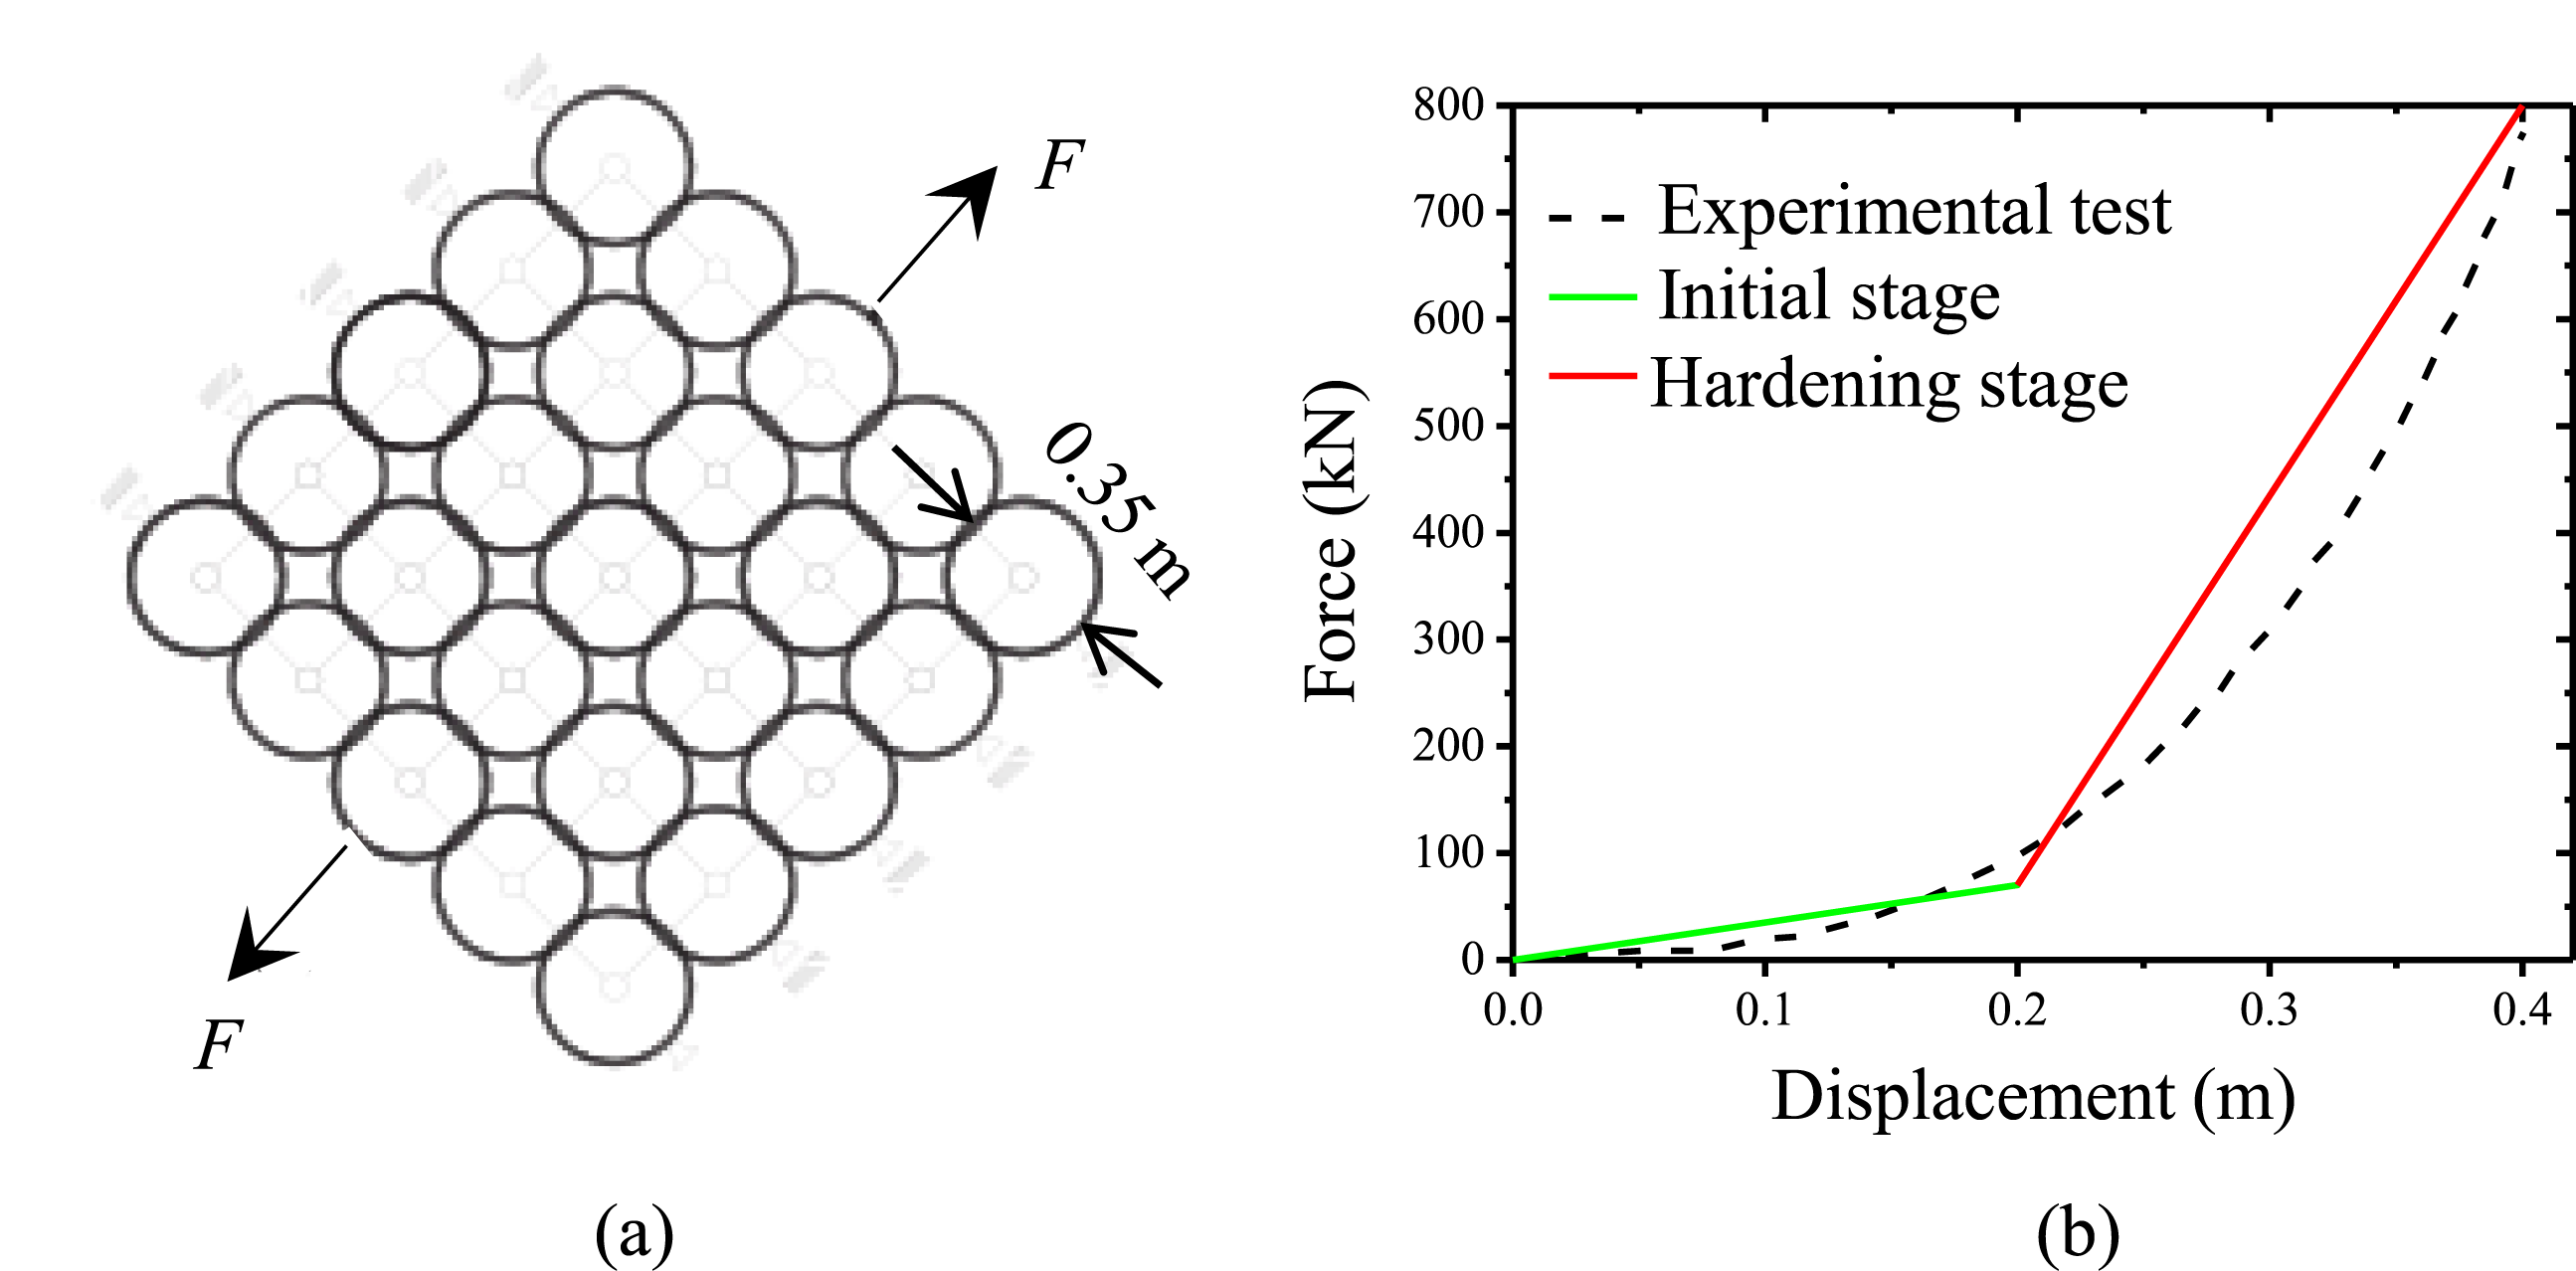
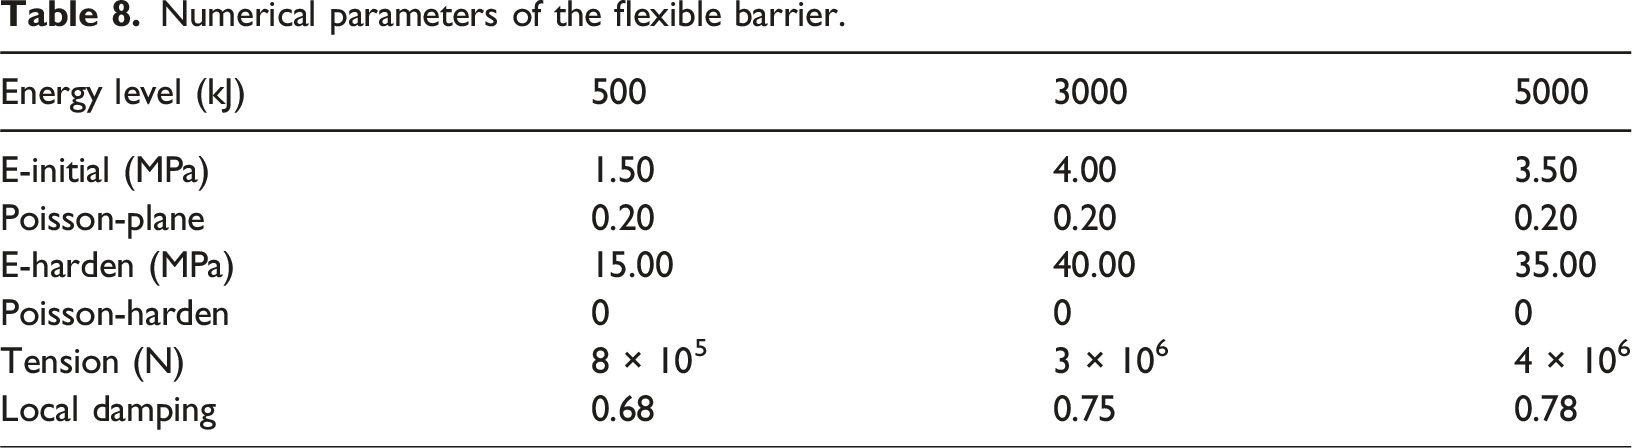
Figure 14 presents a comparison between the field test results and the numerical simulation. The model reproduces the key characteristics of the impact process, including the dynamic response of the barrier and the resulting deformation pattern. The agreement is observed between the simulated and experimental deformation values across all energy levels. For the 500 kJ impact case, both the maximum displacement (2.9 m) and final displacement (2.6 m) match exactly between simulation and experiment. Similarly, for the 3000 kJ case, both maximum (5.5 m) and final (4.9 m) displacements show perfect agreement. This exact match is also maintained in the 5000 kJ case, with both maximum (5.1 m) and final (5.0 m) displacements identical between simulation and experiment. Furthermore, the simulation accurately captures the slight rebound phenomenon of the flexible barrier observed in physical tests. The failure progression sequence observed in the simulation matches exactly with the actual field test recordings. The structural behavior reveals that the area of rings entering the hardening stage expands progressively with increasing impact energy. Under low-energy conditions, energy dissipation occurs primarily through large deformation and bending moment resistance, whereas high-energy impacts are mainly absorbed through axial force-bearing during the hardening stage. The simulation reproduces the actual propagation sequence of hardening: beginning at the impact point, extending to both ends of the flexible barrier, and finally connecting the central and end regions. This progression, consistently observed in both field tests and simulations, confirms that the most vulnerable regions in practical applications are, in order, the impact location, the fixed ends, and the diagonal areas of the flexible barrier. The concurrence between simulated and experimental failure sequences further validates the selected parameters and overall modeling methodology. Field test compared with numerical simulation.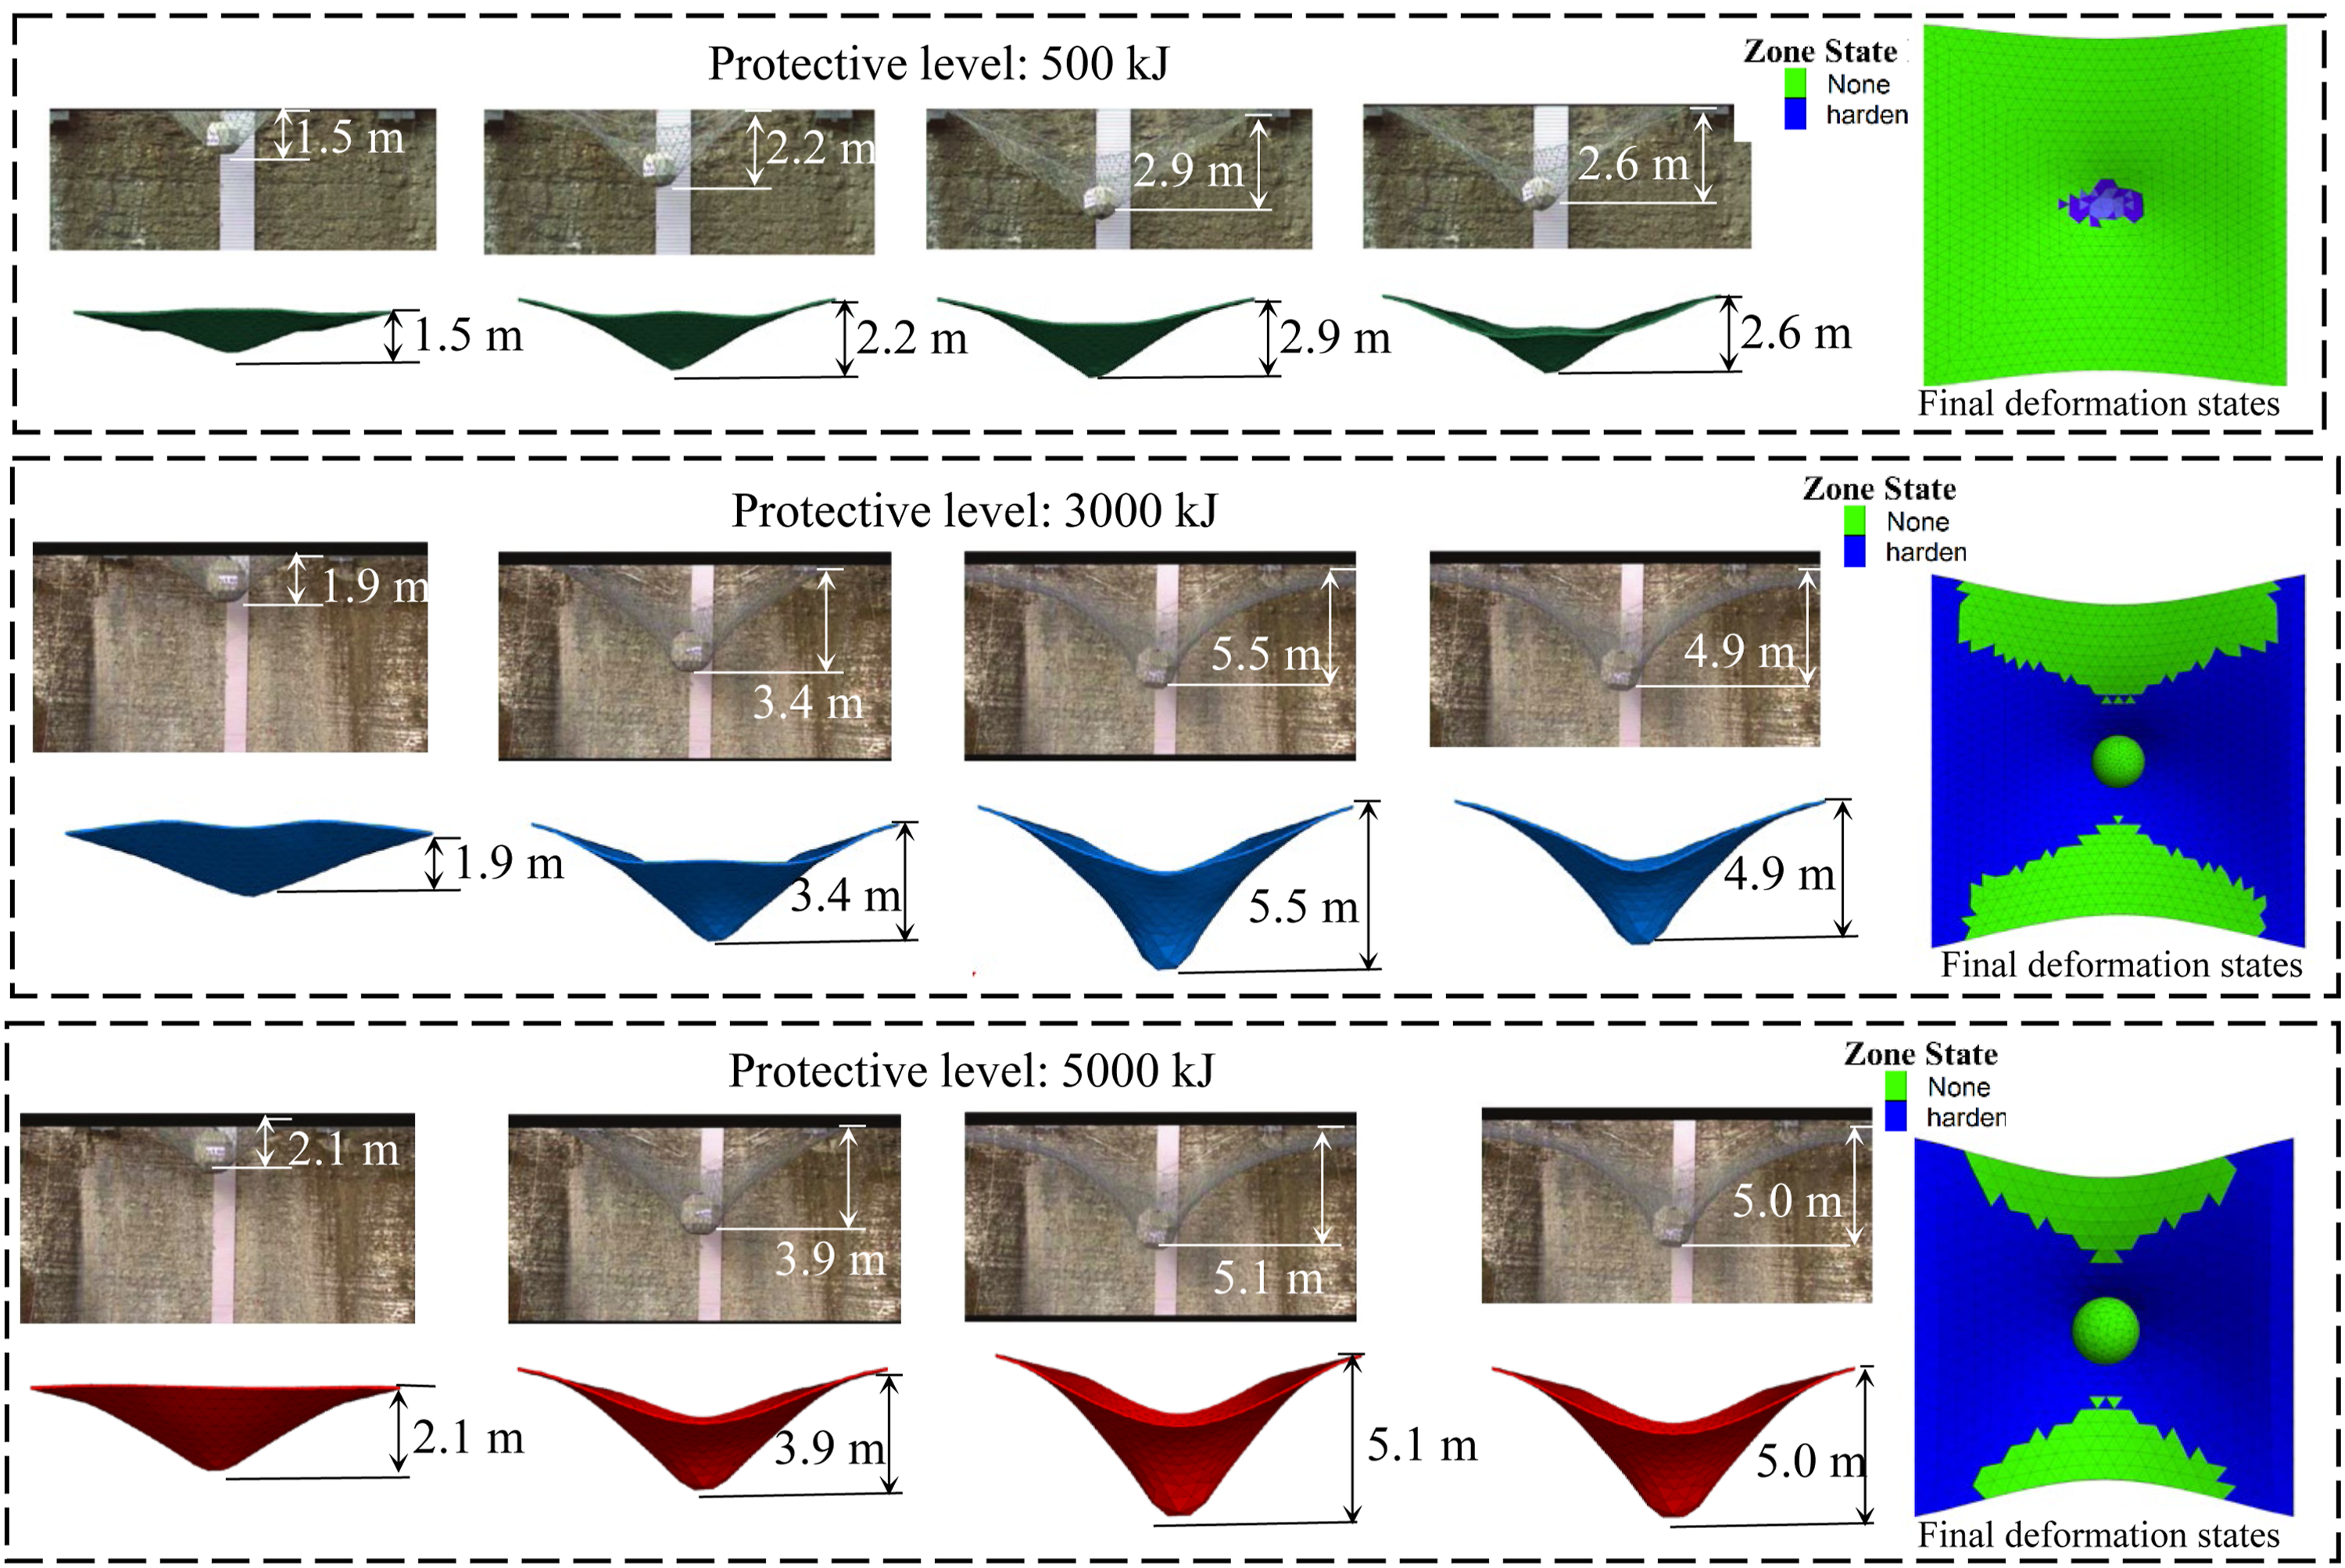
Application case
Building the numerical model
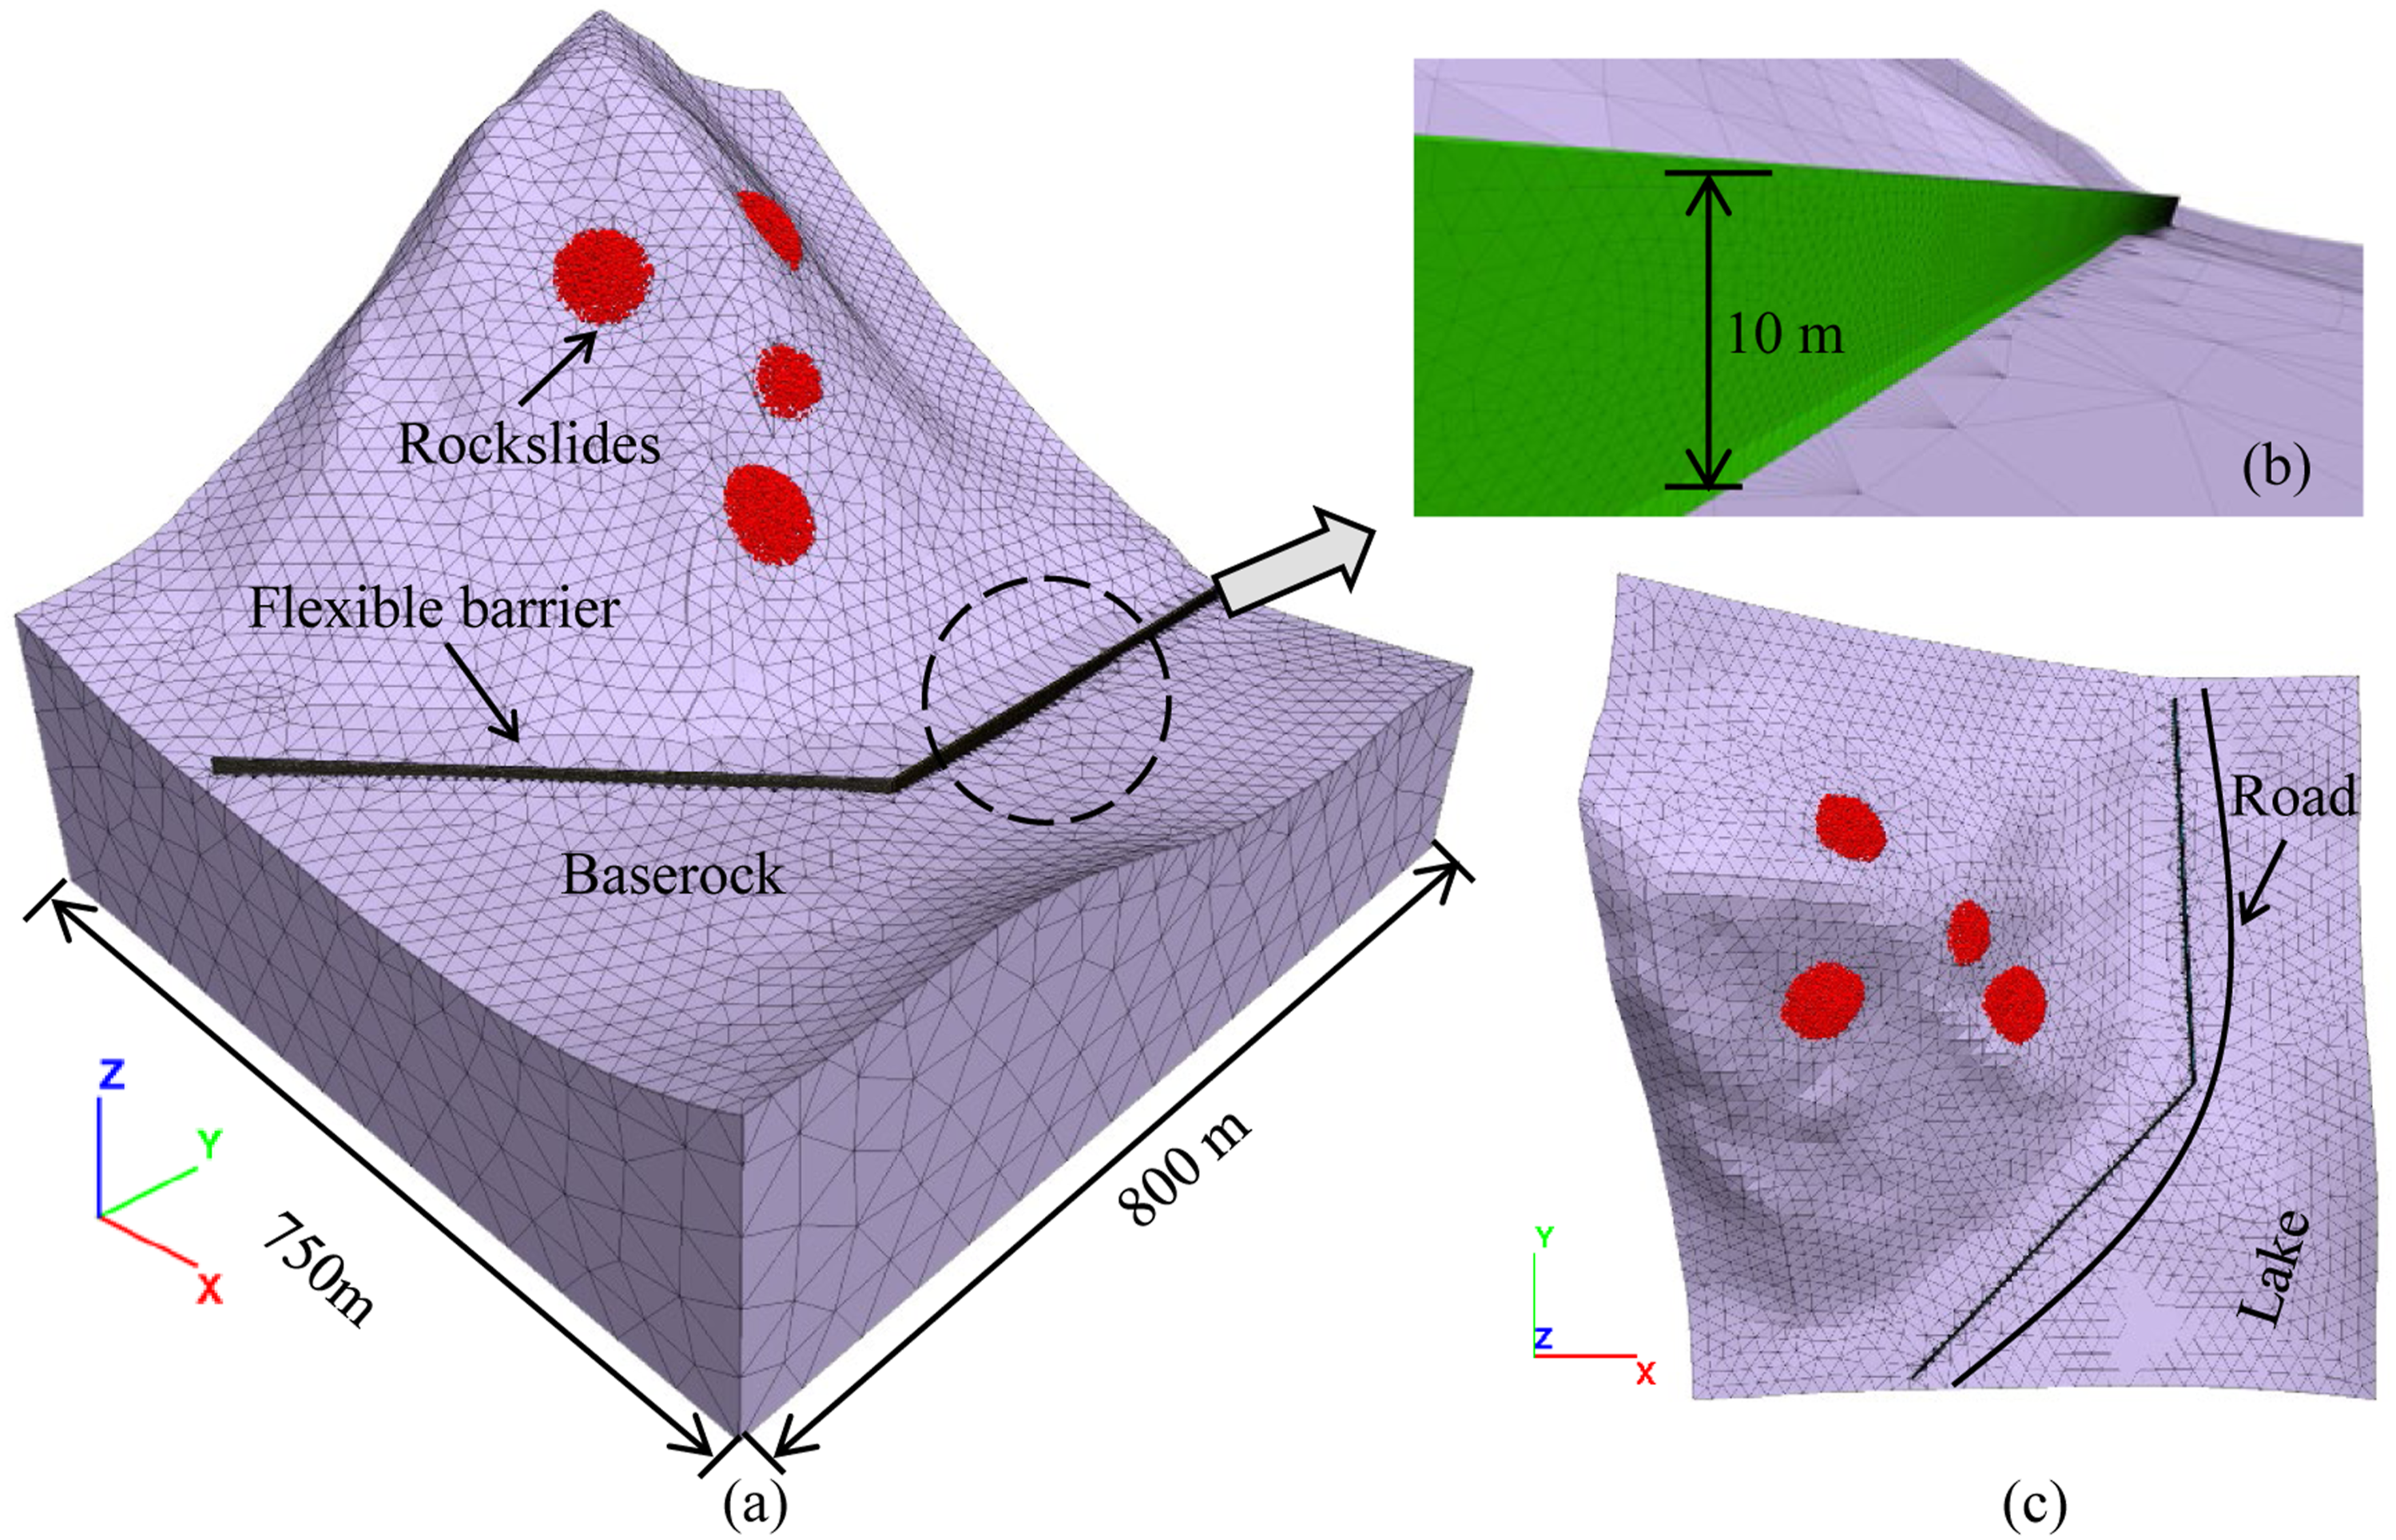
The “8.8″ Jiuzhaigou earthquake induced the formation of several perilous rock masses (Hu et al., 2019; Ling et al., 2021). The Huohua Lake perilous rock is located in the Jiuzhaigou Valley Scenic, Sichuan Province (33°13′3.20″N, 103°54′16.99″E) (Figure 15). Currently, the perilous rock is approximately 5.86 × 10⁴ m3 and can easily induce a rockslide under the action of gravity, rainfall, etc. Figure 16 shows the rockslide DEM-FDM coupled numerical model. Location of the study area. Numerical modeling of rockslides break-runout-impact on flexible barriers: (a) bird view, (b) details of flexible barriers, (c) vertical view.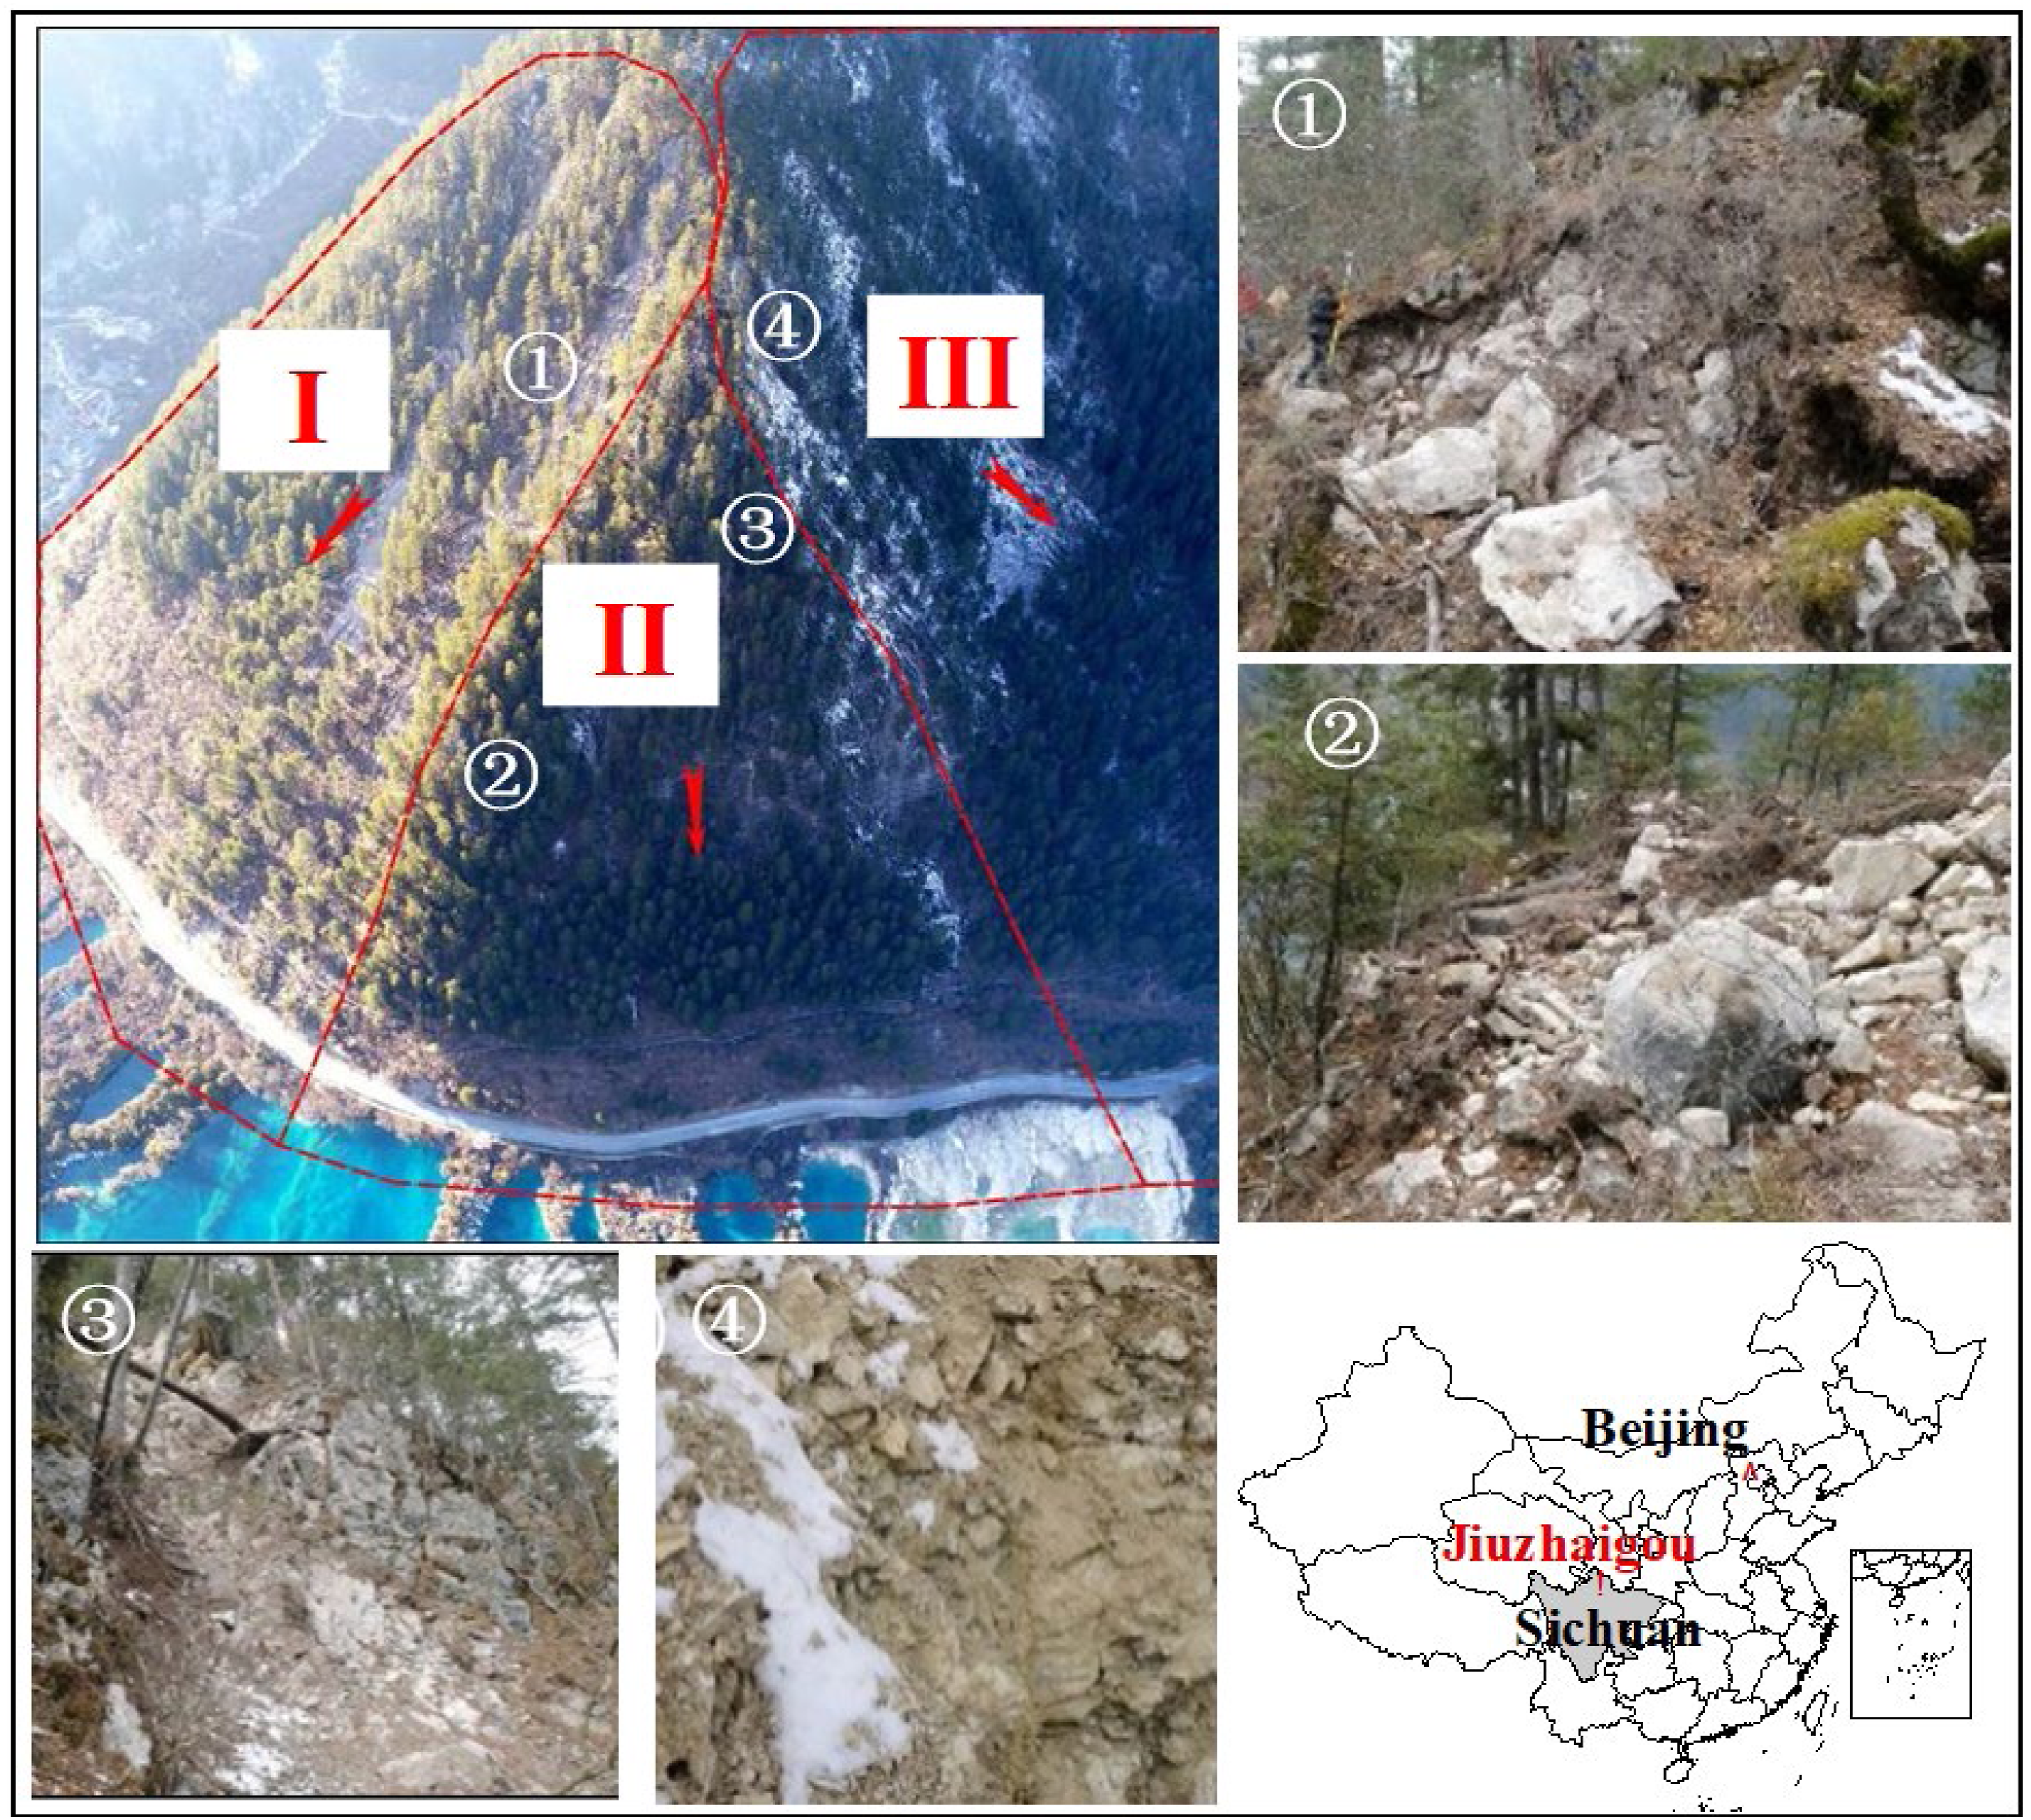
Determining the numerical parameters
The fragmentation of the rockslide mass during the falling and impact process is a critical mechanism influencing its runout behavior and impact force. In this study, the fragmentation is simulated within the DEM framework (PFC3D) using the Linear Parallel Bond Model (LPBM). This model represents the intact rock mass as an assembly of discrete particles bonded together at their contacts. The breakage of the rock is governed by the following criteria at each bond: (1) Tensile Failure: A bond breaks if the tensile stress acting on it exceeds its prescribed normal strength (σmax). (2) Shear Failure: A bond breaks if the shear stress acting on it exceeds its prescribed shear strength (τmax).
The numerical modeling of rockslide (DEM) and the bedrock (FDM).
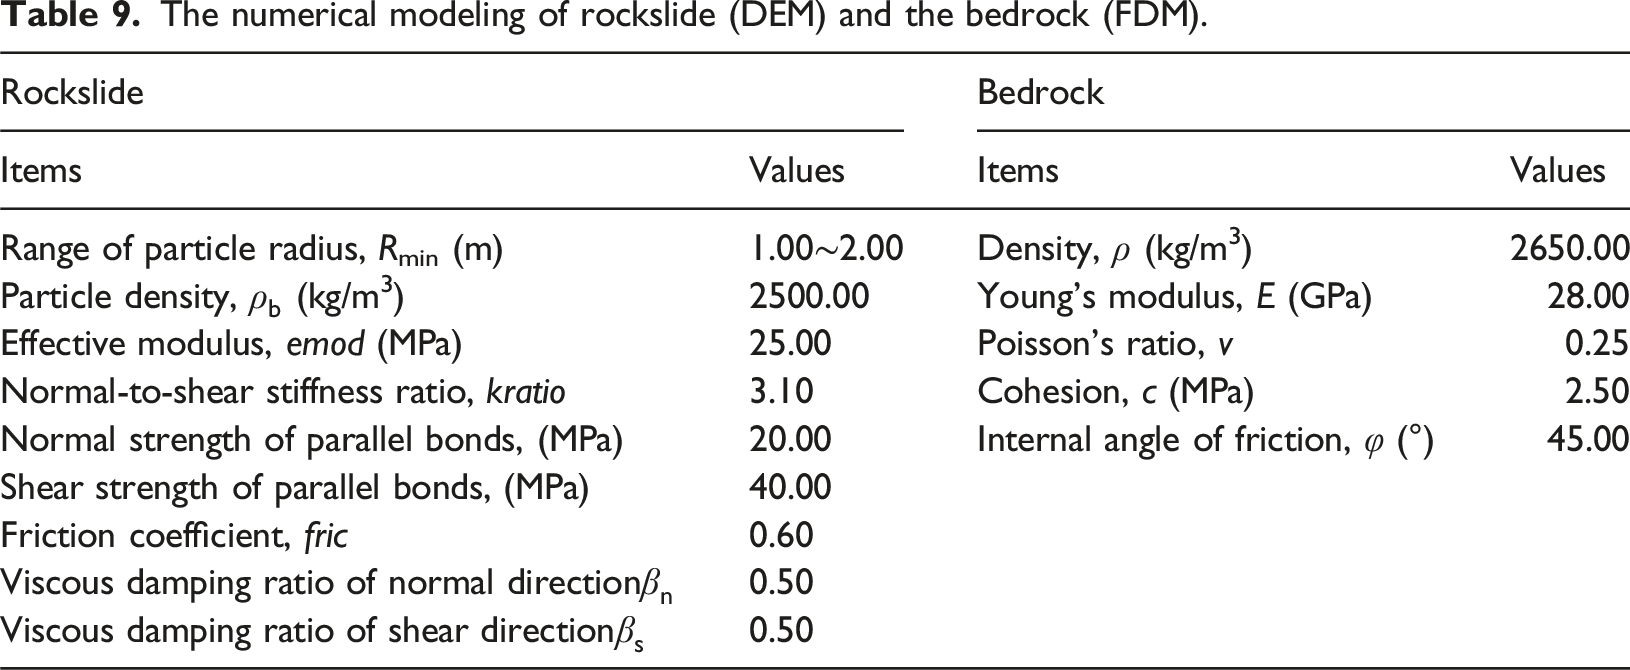
Table 7 lists the complete set of numerical parameters for the rockslide (DEM) and bedrock (FDM) used for the method verification. The parameters for the flexible barrier were adopted from the validated model presented in Table 8, which was calibrated and verified against full-scale impact test data. This ensures that the barrier component of the coupled model accurately represents the mechanical behavior of real-world protective structures.
Rockslide break-runout-impact process
Figure 17 shows snapshots of the rockslide break-runout-impact process on a 500 kJ flexible barrier. (1) At 15.5 s, the particles first impacted the flexible barrier, and the impact position quickly entered the hardening state. (2) At 16.5 s, the flexible barrier began to enter the broken state as the number of particles reaching the flexible barrier increased. However, the flexible barrier still exhibited a robust load-bearing capacity owing to the small number of broken rings. (3) At 17.0 s, the number of broken flexible barrier rings gradually increased. Numerical modeling in this study did not explicitly simulate penetration mechanisms. Therefore, observed particle passage through the barrier mesh in the simulation may indicate potential penetration in reality. (4) At 18.5 s, a significant deformation of the flexible barrier occurred and many rings were in the broken state. Rockslides break-runout-impact flexible barriers process: (a) rockslides break, (b) rockslides runout, (c) rockslides impact on flexible barriers, (d) flexible barriers break.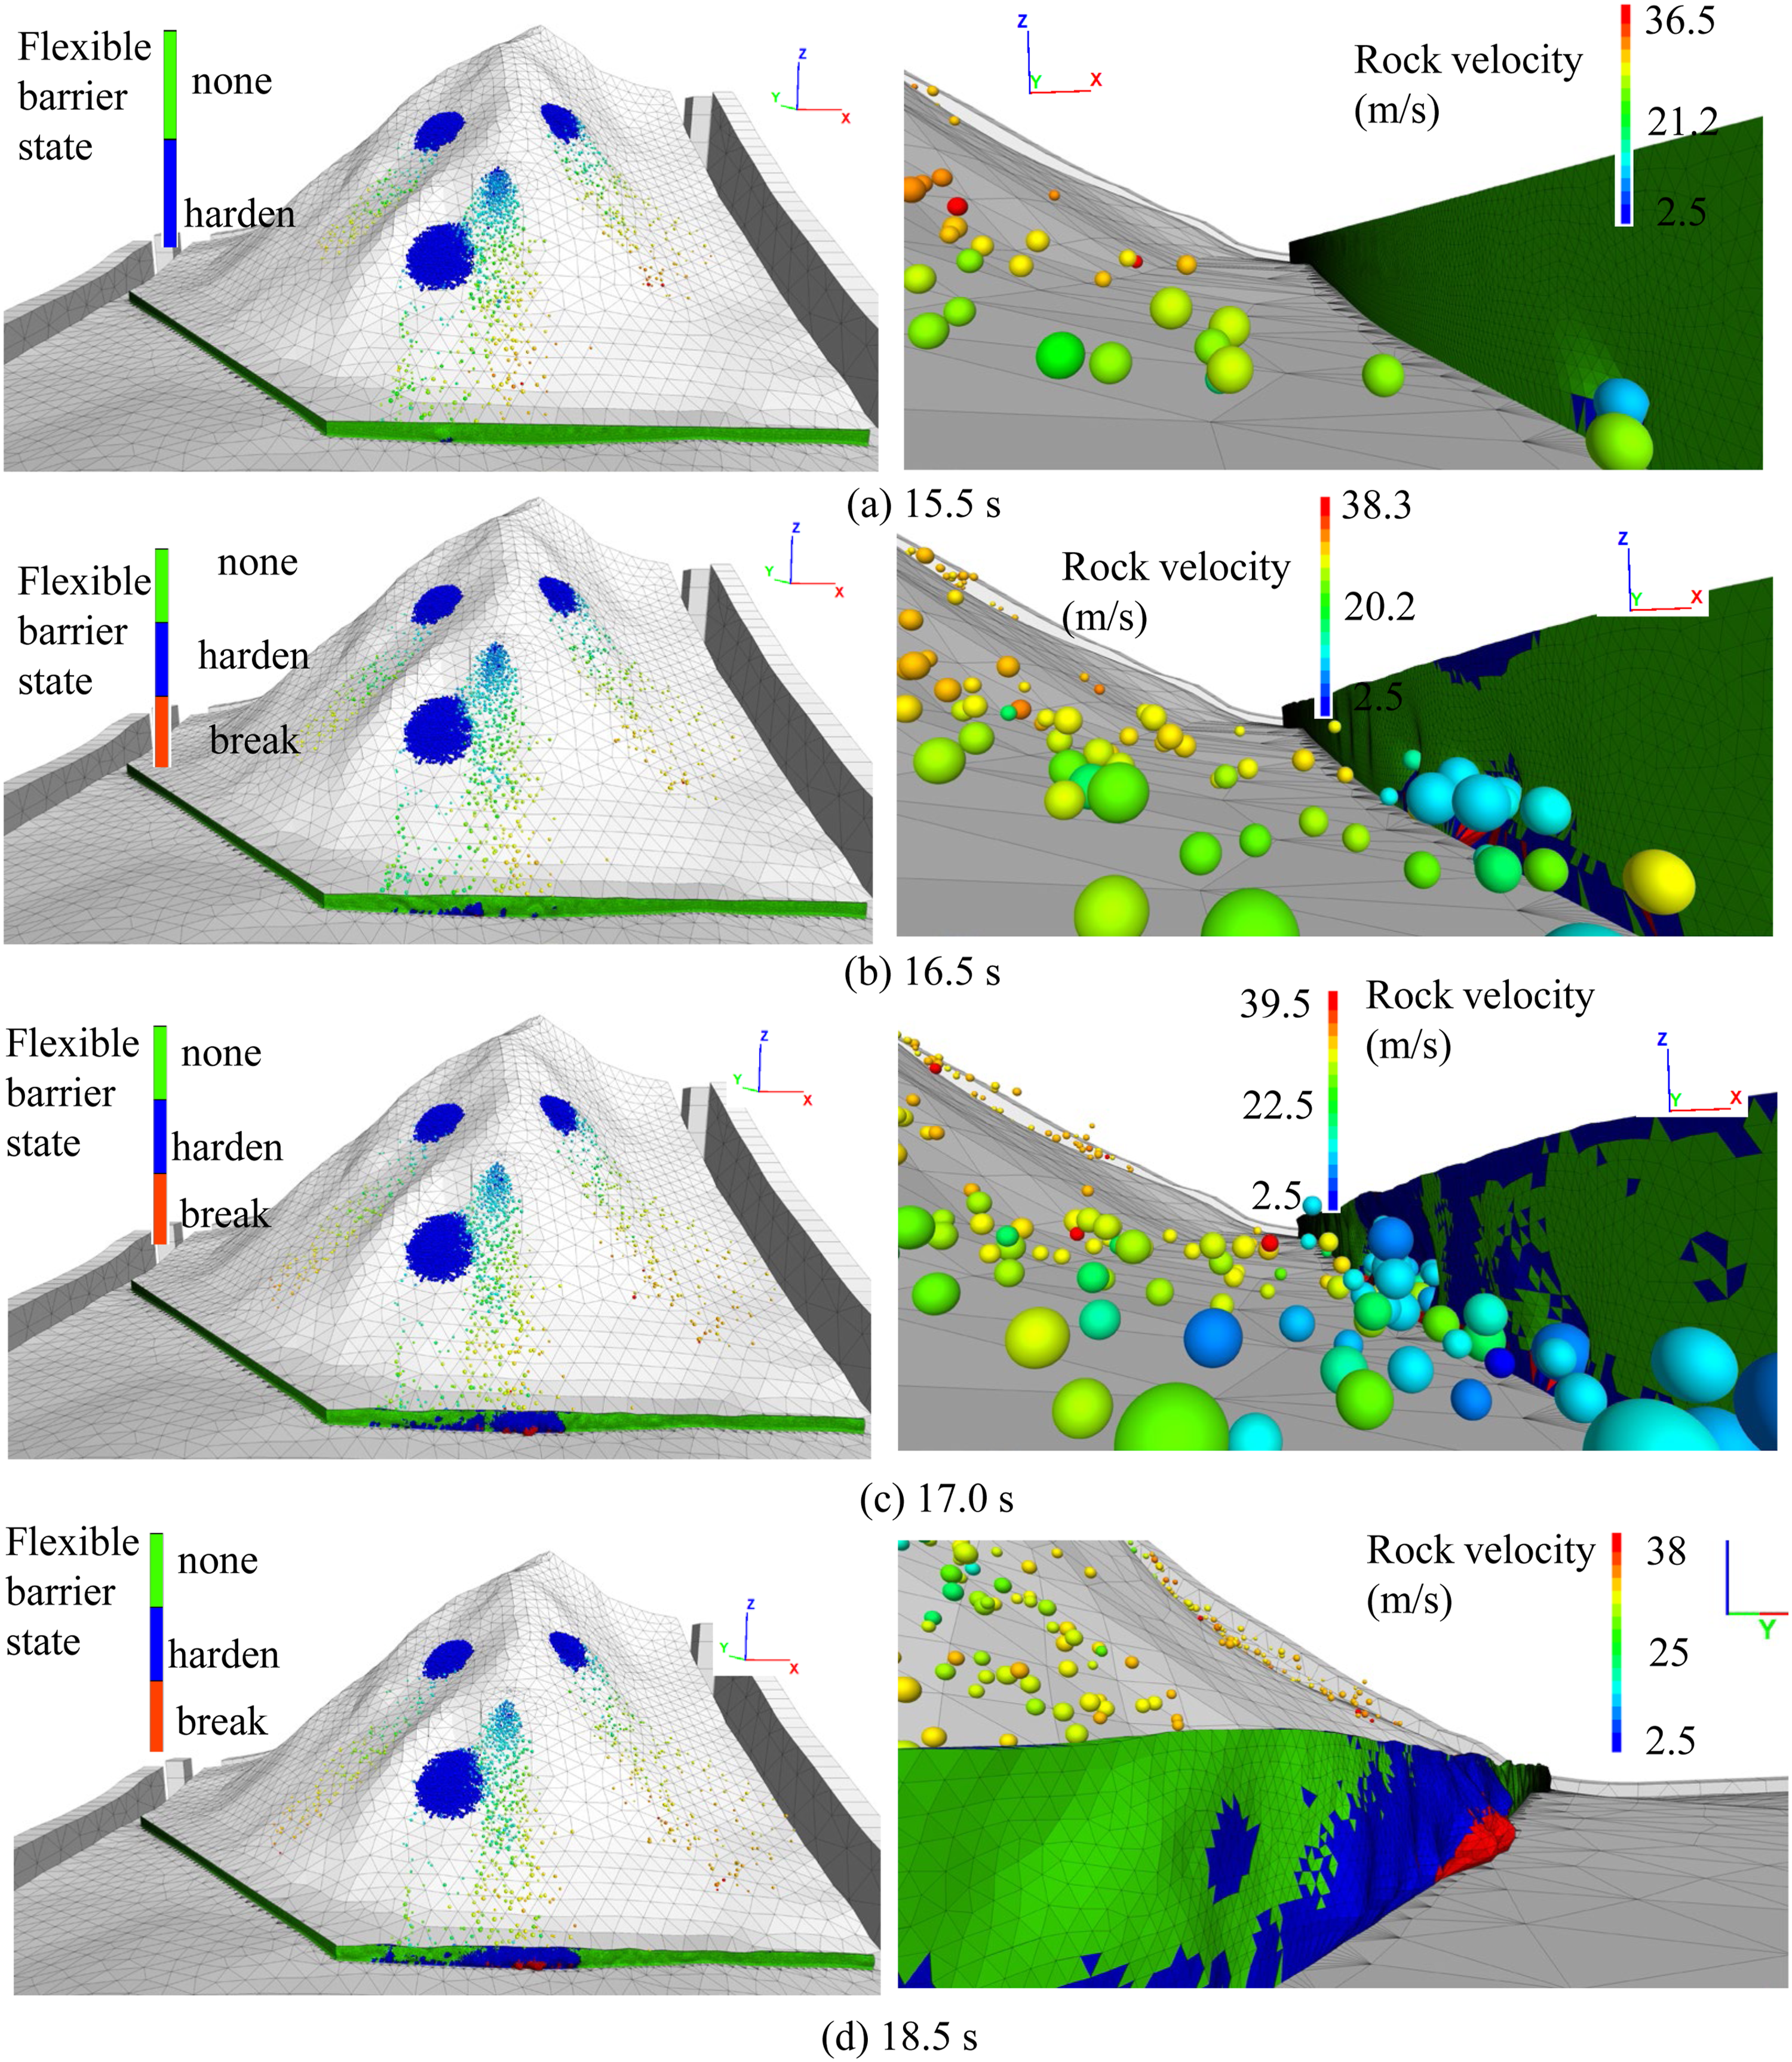
Influence of the protective level
Figure 18 shows the numerical model of the rockslide break-runout-impact on flexible barriers of 500 kJ and 5000 kJ. Compared to the flexible barriers of 500 kJ, the zones of the flexible barriers of 3000 kJ and 5000 kJ are not in the broken stage, and both can protect and control rockslides. For safety and cost efficiency, the adoption of a flexible barrier of 3000 kJ is recommended. Influence of the protective level: (a) barrier with 3000 kJ, (b) barrier with 5000 kJ.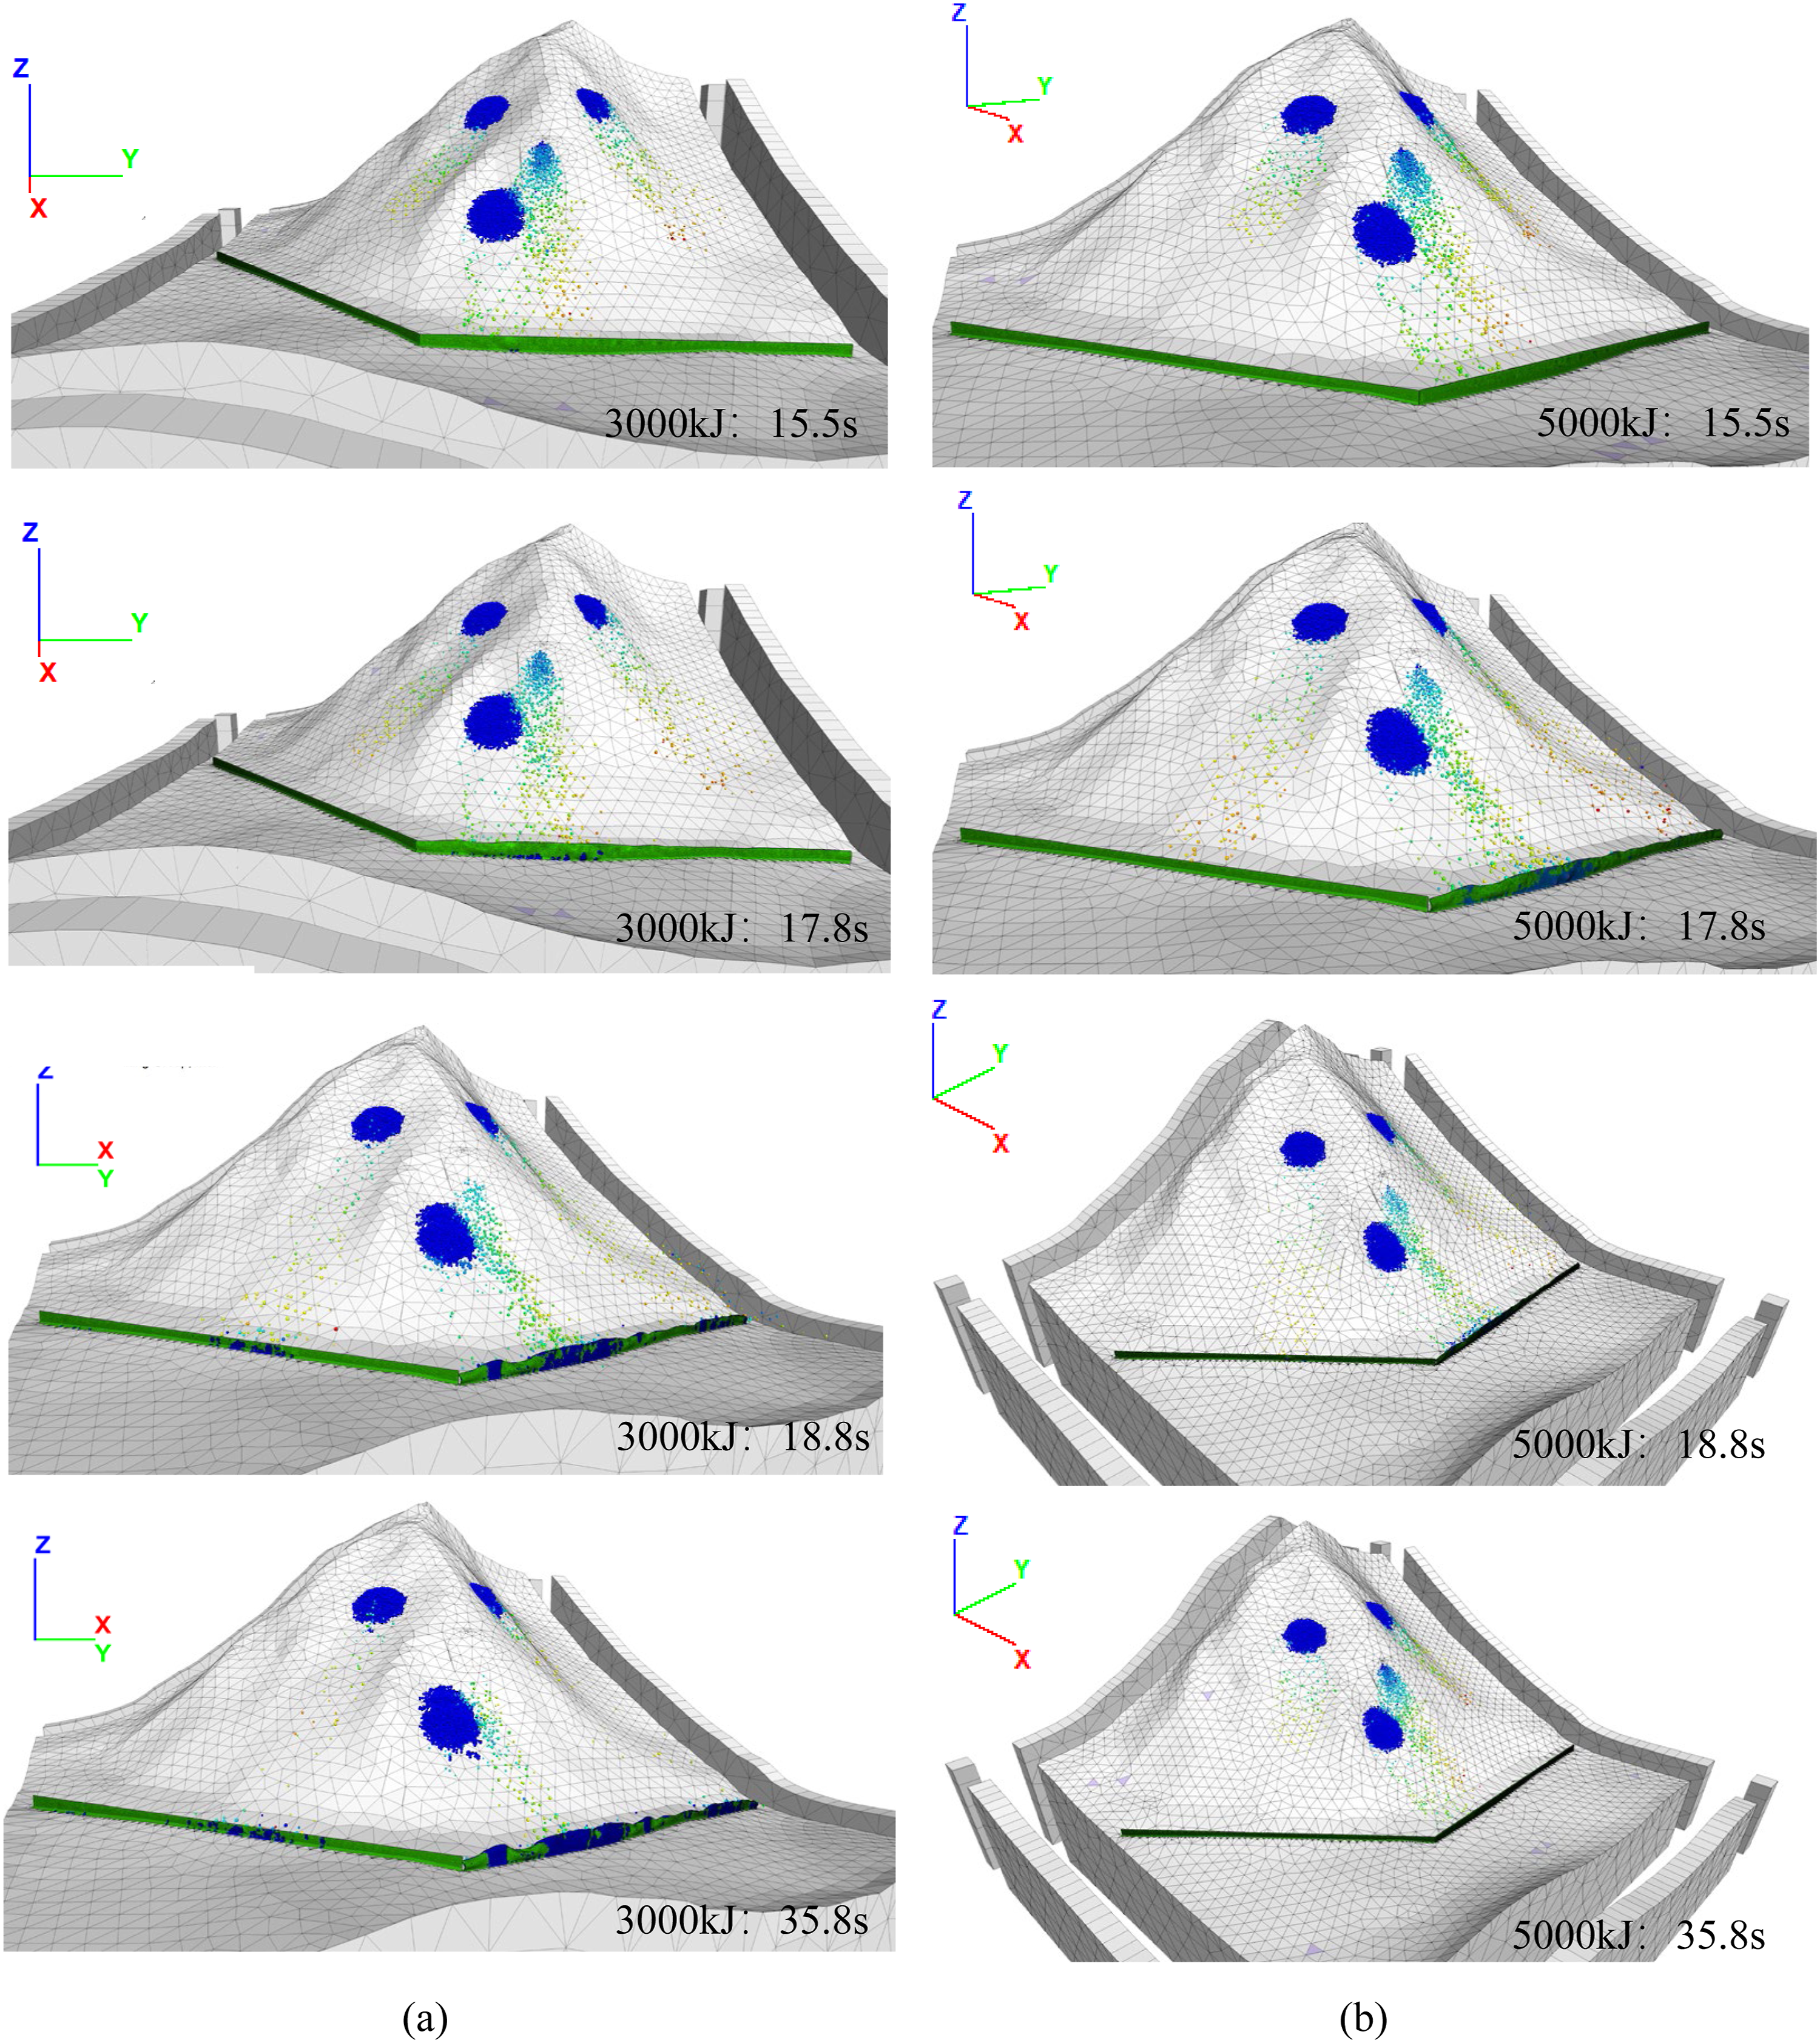
Influence of the location
The location of the flexible barrier is one of the main factors to be considered during the protection design. To this end, numerical models of three locations of the flexible barriers were conducted to investigate the influence of the location: flexible barriers near the rockslide (barrier Ⅰ), at the foot of the slope (barrier Ⅱ), and near the road (barrier Ⅲ). Barrier Ⅲ, the farthest distance allowed for installation, was constructed as described in the previous section. The selected flexible barrier energy was 3000 kJ, and all flexible barriers were vertical to the ground. As shown in Figure 19(a), the zones in the hardening state of barrier Ⅰ cover a much larger area than those of barrier Ⅲ, indicating that the barrier near the source requires lower energy capacity. As shown in Figure 19(b), the zones of barrier Ⅱ were in the broken stage. In addition, some rocks also bounce at the foot of the slope, exceeding the height of barrier Ⅱ. The numerical results indicate that barrier Ⅱ cannot effectively prevent and control the rockslides. Influence of the location: (a) near rockslides, (b) at the bottom of the slope.
Discussion and conclusion
This study has developed and validated an equivalent continuum model for simulating the entire process of rockslide break-runout-impact on flexible barriers using a DEM-FDM coupled approach. The discussion herein addresses the key findings, methodological contributions, and practical implications of this research.
Methodological advancements and validation
The proposed model bridges the gap between computationally expensive detailed simulations and oversimplified analytical models. Through theoretical derivation and experimental validation, we have established a clear mechanistic understanding of the ring’s two-stage behavior (transition from bending to axial stages), while the numerical implementation efficiently captures the system-level response of interconnected rings under complex loading conditions. The parameter calibration methodology presented in Section 2.4 enhances the model’s practical utility for different barrier designs, addressing a fundamental challenge in flexible barrier modeling.
The validation against both component-level tests (single and multi-ring tests) and full-scale impact demonstrations confirms the model’s robustness in predicting barrier performance across different scales. Particularly noteworthy is the model’s ability to reproduce the progressive failure sequence observed in multi-ring tests, where edge rings enter the hardening state before central rings, demonstrating its capacity to capture complex system-level behaviors.
Practical applications and engineering implications
The application case study demonstrates the model’s capability to inform critical engineering decisions. The analysis of energy levels (500 kJ, 3000 kJ, 5000 kJ) provides a quantitative basis for selecting cost-effective barriers, with the 3000 kJ barrier identified as optimal for the specific case study. The investigation of barrier placement reveals crucial design considerations: barriers near the source (Position I) experience reduced energy demands but may face practical installation challenges; barriers at the slope toe (Position II) risk being overtopped or failed due to high-energy impacts and rock bounce phenomena; while barriers at a protected distance (Position III) represent a balanced solution that contains the debris flow.
The model’s ability to simulate rockfall jumping over barriers represents a significant advancement over simplified methods, providing engineers with a more realistic assessment of barrier performance. This capability is particularly valuable for designing protection systems in complex terrain where rockfall trajectories may be unpredictable.
Parameterization strategy and generalization
Addressing the important question of parameter determination for different ring configurations (varying number of rings, diameters, and materials), our study proposes a systematic approach: (1) For designs with available experimental data, direct calibration using tensile tests provides the most accurate parameter determination.
(2) For preliminary design without test data, the theoretical framework (particularly the δ/D = 0.45 transition criterion) offers reliable initial estimates. (3) The initial modulus can be approximated based on ring diameter and bending theory, while the hardening modulus can be estimated from the material properties. (4) Numerical inverse analysis can further refine parameters through iterative simulation.
This hierarchical parameterization strategy ensures the model’s applicability to a wide range of flexible barrier designs while maintaining physical meaningfulness.
Limitations and future research
While the numerical results show satisfactory agreement with experimental data, several theoretical limitations must be acknowledged. The current analytical derivation remains confined to a simplified single-ring impact model and lacks a comprehensive theoretical framework for more complex mechanical states, such as multi-ring tensile interactions and full-scale barrier impact responses. Although numerical simulations effectively capture these behaviors, a corresponding theoretical explanation for system-level performance has not yet been established.
Future work will prioritize the development of theoretical models capable of addressing complex impact scenarios. Efforts will focus on formulating mechanical representations for multi-ring systems under tensile and impact loading, establishing theoretical model for flexible barrier components, and deriving analytically the force-redistribution mechanisms among rings and subsystems. In parallel, modeling capabilities will be enhanced through the integration of detailed connection elements and support systems, improved elastoplastic material constitutive laws, and collaborative frameworks for full-scale physical testing. Further research should also extend the model’s application to more complex conditions including successive impacts and varying rock size distributions.
Conclusion
The DEM-FDM coupled method with the newly developed constitutive model offers a powerful and practical tool for simulating rockslide impacts on flexible barriers. It provides scientific guidance for optimizing barrier energy capacity, installation location, and overall system design, contributing to more resilient infrastructure protection. The model’s ability to accurately capture both component-level behavior and system-level response while maintaining computational efficiency represents a significant advancement in geohazard protection engineering. The methodology and insights gained from this study not only advance the numerical simulation of flexible barriers but also provide a framework for addressing similar challenges in other engineering applications involving complex structure-fluid-solid interactions.
Footnotes
Author contributions
Funding
The author(s) disclosed receipt of the following financial support for the research, authorship, and/or publication of this article: A Project Supported by Scientific Research Fund of Zhejiang Provincial Education Department (Y202454601). This research was supported by the Joint Fund of Zhejiang Provincial Natural Science Foundation of China under Grant No. LGEY25E090019.
Declaration of conflicting interests
The author(s) declared no potential conflicts of interest with respect to the research, authorship, and/or publication of this article.
Data Availability Statement
All data generated or analyzed during this study are included in the article.