
Abstract
In contemporary military defensive systems, block stone ballistic shielding layers serve as the primary line of defense for both personnel and critical infrastructure, making the accurate prediction of projectile penetration depth essential. Current empirical and semi-empirical formulas primarily focus on mortared block stone concrete, leaving a systematic understanding of unmortared block stone structures largely unexplored. Such discrete structures pose significant challenges for continuum mechanics-based finite element methods. This study employs a discrete element bound particle model to develop meso-scale models of both mortared block stone concrete and unmortared block stone assemblies. The influence of mortar strength, aggregate strength, and aggregate size on penetration resistance is quantitatively studied. Results indicate that for high aggregate volume fractions, penetration resistance is significantly more sensitive to aggregate strength and size than to mortar strength. Furthermore, when the target thickness is less than ten times the aggregate diameter, the use of mortar or other binding materials is recommended to enhance penetration resistance. Based on a previous dimensionless framework, a new predictive model incorporating mesoscopic factors is developed. This model accurately predicts the penetration depth of rigid projectiles into various block stone ballistic shielding layers, with or without mortar, and shows strong agreement with numerical simulations.
Keywords
Introduction
Block stone is highly effective at distributing impact energy during penetration events owing to its exceptional hardness and capacity for energy dissipation, thereby significantly enhancing the penetration and explosion resistance of concrete targets (Dancygier et al., 2006; Sun et al., 2024). These properties make it a material of choice for various defensive engineering applications (Wu et al., 2013; Yang and Deng, 2016). To accurately predict penetration depth in particle scenarios, numerous empirical and semi-empirical formulas have been developed based on experimental data. For instance, several established models, including the Whiffen (1943), Rosenberg and Kositski (2016), Zhang et al. (2020) and Wu et al. (2018) formulas, have incorporated the influence of aggregate size on penetration depth in block stone concrete ballistic shielding layers. Furthermore, for intact natural rock masses, which often serve as host media for critical underground protective structures, commonly used empirical penetration formulas include the Young (1997) formula from the U.S. Sandia National Laboratories (SNL), the Bernard and Creighton (1979) formula from the U.S. Army Waterways Experiment Station (WES), and a modified version of the Soviet Белязан formula (Qian and Wang, 2009) adopted in China. In recent years, Wang et al. (2009) improved rock penetration calculations using an internal friction model based on short-wave theory, proposing a new analytical expression for projectile penetration depth into rock.
Despite their superior resistance to penetration, both block stone concrete and natural rock masses present significant challenges in terms of repair when subjected to impact loads exceeding design limits. In contrast, block stone masonry structures eliminate the need for complex pouring processes and offer natural camouflage resembling rock formations. Damage can be rapidly addressed on-site by replacing individual blocks, greatly enhancing operational flexibility and repair efficiency. Furthermore, such structures have demonstrated considerable promise in protective engineering. Through frictional contacts between blocks and inherent energy-dissipating mechanisms such as crushing, these systems effectively distribute kinetic energy, thereby reducing the load transferred to protected structures behind them (Clarke et al., 2018; Lambert et al., 2014; Su et al., 2018, 2021; Yang et al., 2024). However, there is currently no penetration depth prediction formula in the literature for this kind of ballistic shielding layer consisting of unmortared block stone masonry, which is a structure of discrete block stones stacked without mortar filling between them.
The protective performance of block stone ballistic shielding layers is predominantly influenced by block size, strength, and shape. Using discrete element models, Su et al. (Su et al., 2018, 2021) discovered that structures made up of smaller blocks significantly reduce transmitted loads to the rear. Moreover, employing high-strength spherical blocks was shown to further improve overall protective performance. Experiments studies Fang and Zhang (2014), Werner et al. (2013), Wu et al. (2015) corroborate that increasing block size and strength within certain ranges considerably reduces penetration depth. Fang and Zhang (2014), investigating randomly distributed block sizes and shapes, identified a positive correlation between penetration resistance and block size. Dancygier et al. (2006) indicated that harder aggregates offer greater resistance to penetration, a finding supported by Wu et al. (2015) and Pang et al. (2020), who showed through experiments and simulations that high-strength corundum block stones reduce penetration depth more effectively than conventional blocks.
Given the high cost, time, and complexity associated with large-scale penetration experiments, numerical methods such as the Finite Element Method (FEM) (Fang and Zhang, 2014) and the Discrete Element Method (DEM) (Zhao et al., 2021) have become indispensable for estimating penetration depth in block stone shielding layers. However, under impact loading, unmortared block stone structures are under rapid rearrangement, with blocks moving, rotating, sliding, colliding, and fragmenting in unpredictable ways, substantially altering the system’s microstructure. Hence, continuum-based FEM struggles to accurately simulate such discontinuous behaviors (Göbel et al., 2017; Mandal et al., 2021; Mayercsik et al., 2015; Wang et al., 2020) and is susceptible to mesh distortion under large deformations, compromising computational accuracy.
DEM, as a numerical method designed for discontinuous media, has distinct advantages for analyzing complex structural materials and revealing underlying mechanisms. It effectively simulates the fragmentation of block materials under impact and captures inter-fragment interactions (Nitka, 2024). Moreover, DEM typically requires fewer parameters than FEM (Thilakarathna et al., 2020), which makes it more practical and convenient. Zhao et al. (2021) simulated projectile penetration into rockfill structures using the convex polyhedron discrete element method, investigating the effects of rockfill particle size on residual velocity, penetration resistance, and deflection angle. Shiu et al. (2008) calibrated and simulated rigid projectiles penetrating reinforced concrete slabs at various velocities using DEM, finding strong agreement between predictions and experimental results, particularly regarding the influence of projectile shape. Antoniou et al. (2024) used the DEM model to accurately replicate experimentally observed damage patterns, including tunneling, scabbing, and spalling. Liu et al. (2016) compared resistance stress from the particle flow discrete element model with analytical results based on cavity expansion theory, demonstrating the model’s accuracy and applicability.
Based on these advancements, the present study employs a bound particle model to generate discrete element meso-scale models for mortared block stone concrete and unmortared block stone structures. The accuracy of the models is verified by current penetration tests. The effects of mortar strength, aggregate size, and aggregate strength on penetration resistance are systematically investigated. Finally, a comprehensive predictive formula for the depth of penetration by rigid projectiles is proposed, incorporating the influence of multiple mesoscopic factors. This formula provides a practical tool for designing and assessing protective structures, especially for unmortared block stone structures, which are easier to repair and offer natural camouflage. The findings can inform the design of military and civil protective barriers.
Meso-scale discrete element modeling
Generation and placement of aggregates
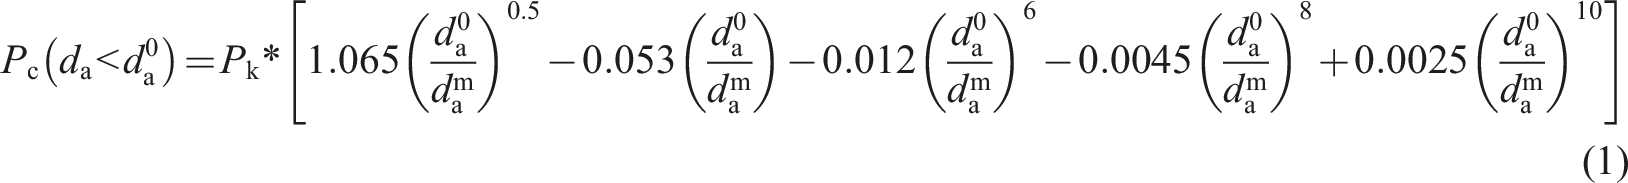
The random aggregate model effectively captures the meso-scale structure of block stone concrete (Dai et al., 2024; Lu et al., 2010), which comprises cement mortar, block stone aggregate, and the interface transition zone (ITZ) between them (Hao and Hao, 2011; Pan et al., 2015). The volume fraction of aggregate in three-dimensions must be converted into a two-dimensional area fraction to satisfy the requirements of two-dimensional modeling. This conversion is facilitated by Walraven’s formula (Wang et al., 2019; Yu et al., 2021):
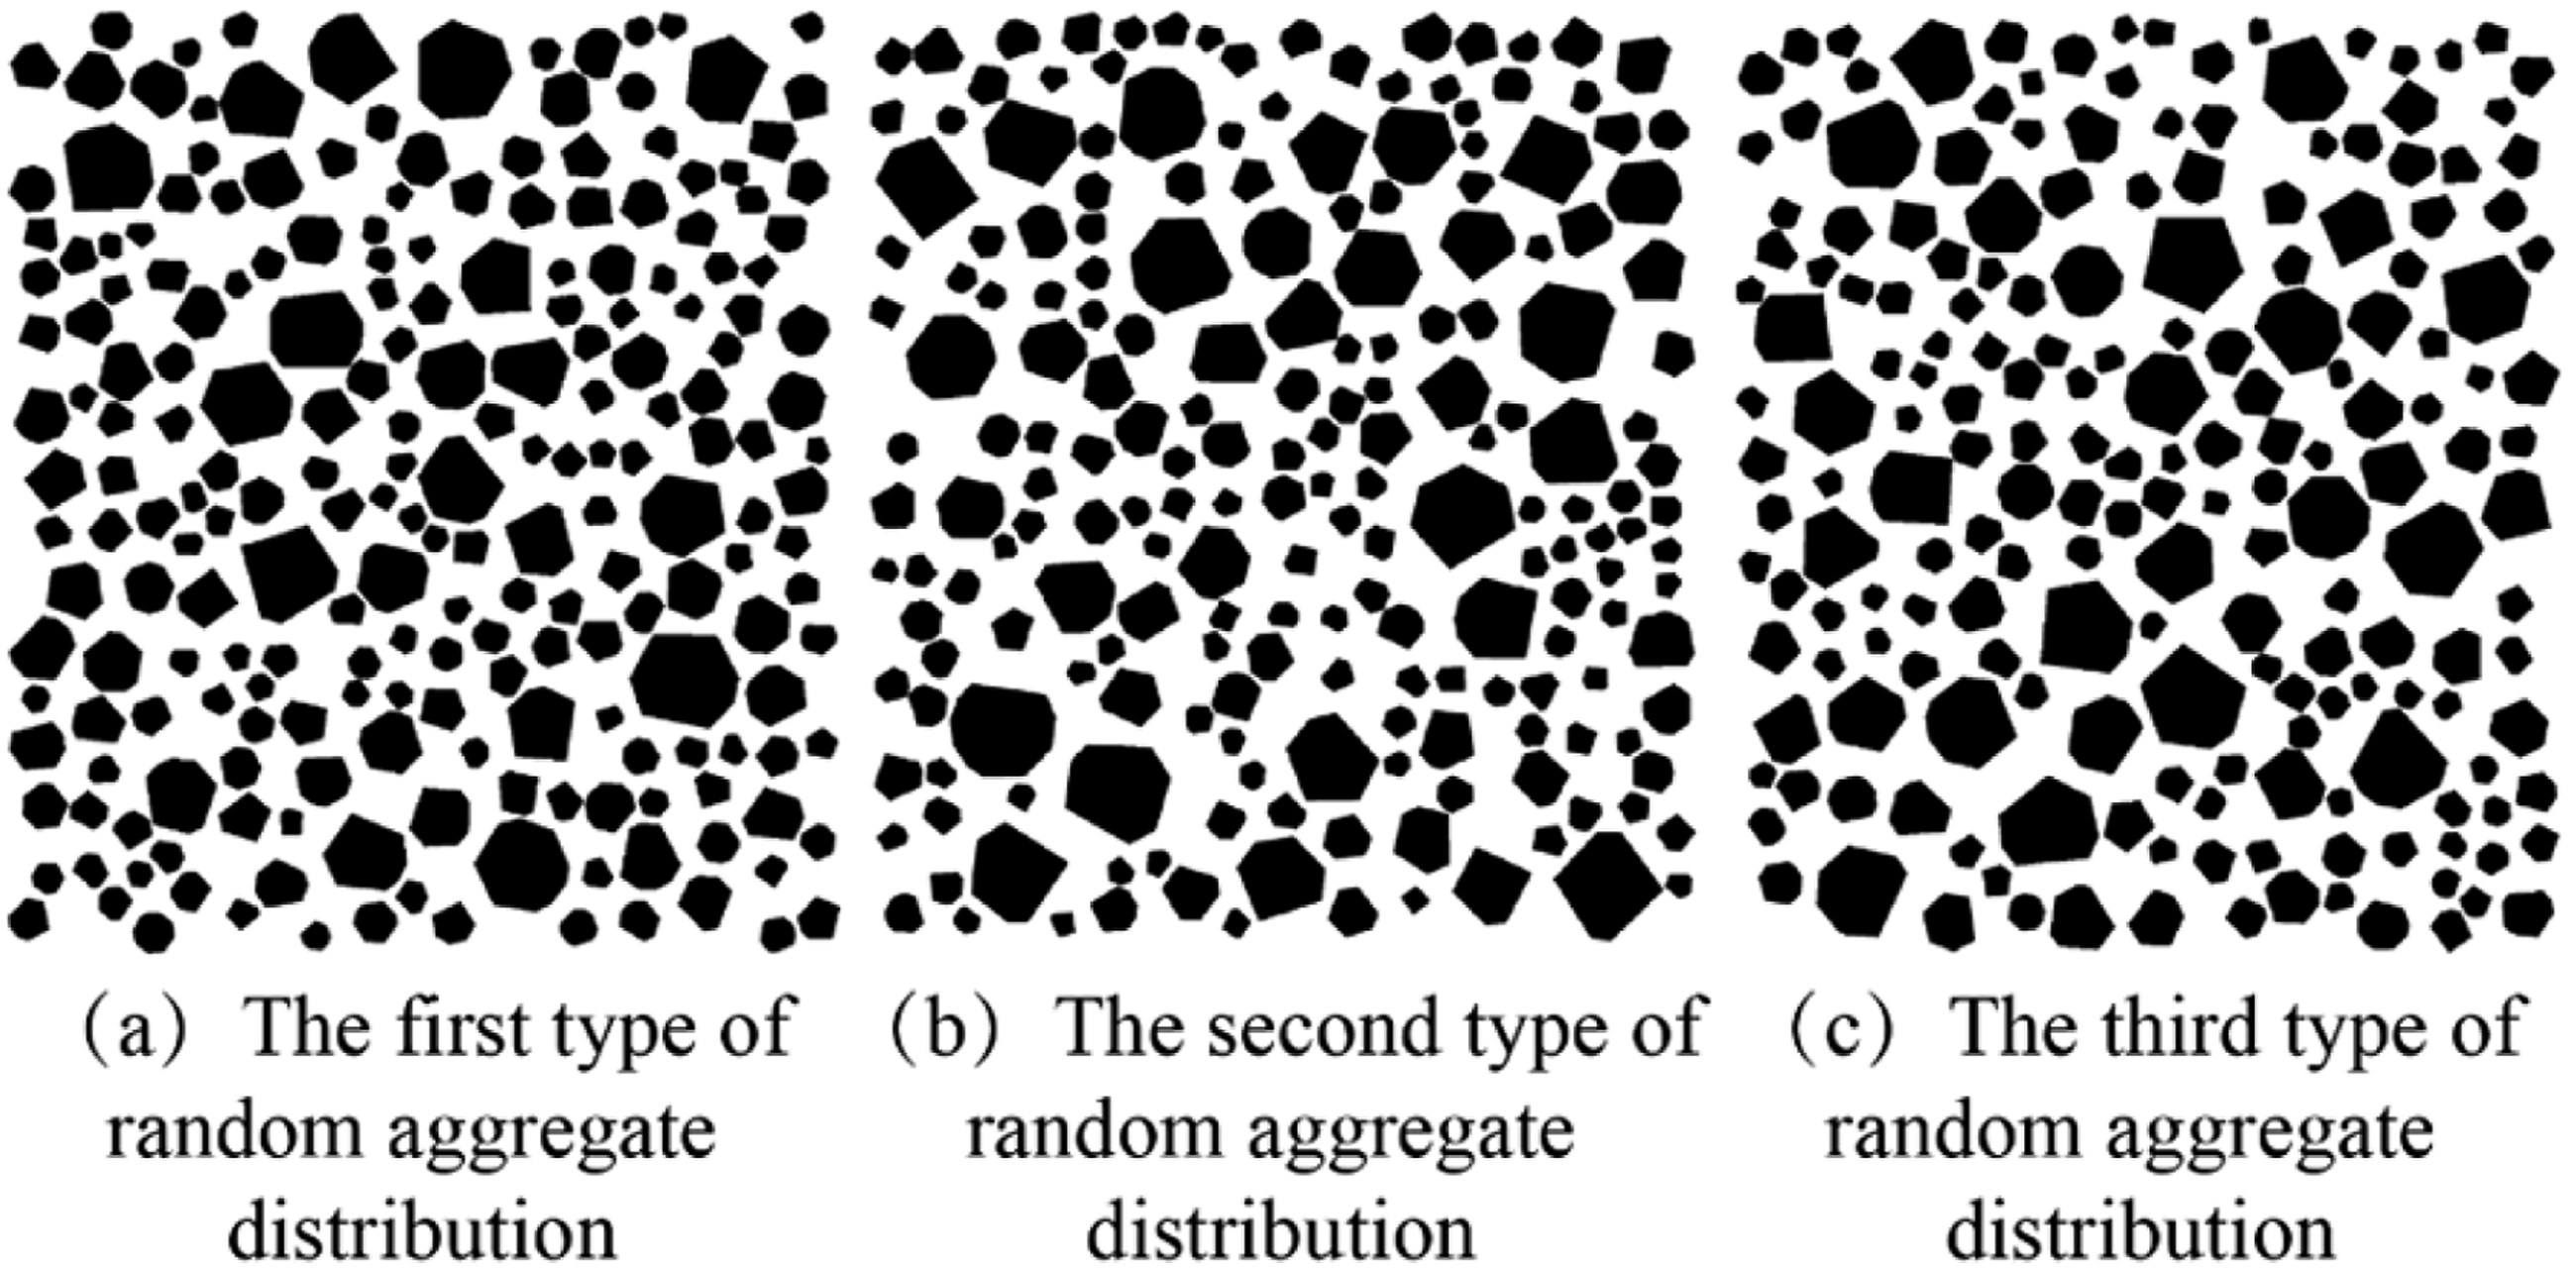
Aggregates are put into the model using the conventional “take-and-place” approach based on the Monte Carlo method, with aggregate shapes represented by random convex polygons. The process for creating and placing random aggregates is shown in Figure 1. For a model of length 150 mm, height 170 mm, and aggregate volume fraction of, the resulting aggregate distribution is depicted in Figure 2. Although the models with random shapes and distributions can replicate the complex morphology of the aggregates, it requires gravity load or vibration compaction operations when generating unmortared block stone structures. Concurrently, the randomization in the block stones’ shapes and arrangements causes a rough, uneven surface on the impact zone of the structure. In this case, the impact point of the projectile, the angle at which the projectile and the block stones collide, and the block stone arrangement are all random factors that work in concert. By significantly raising the variability and volatility of key reactions like penetration depth, it obscures the patterns of the influence of aggregate strength and diameter on penetration depth. Process for placing random aggregates. Distribution model of random aggregate.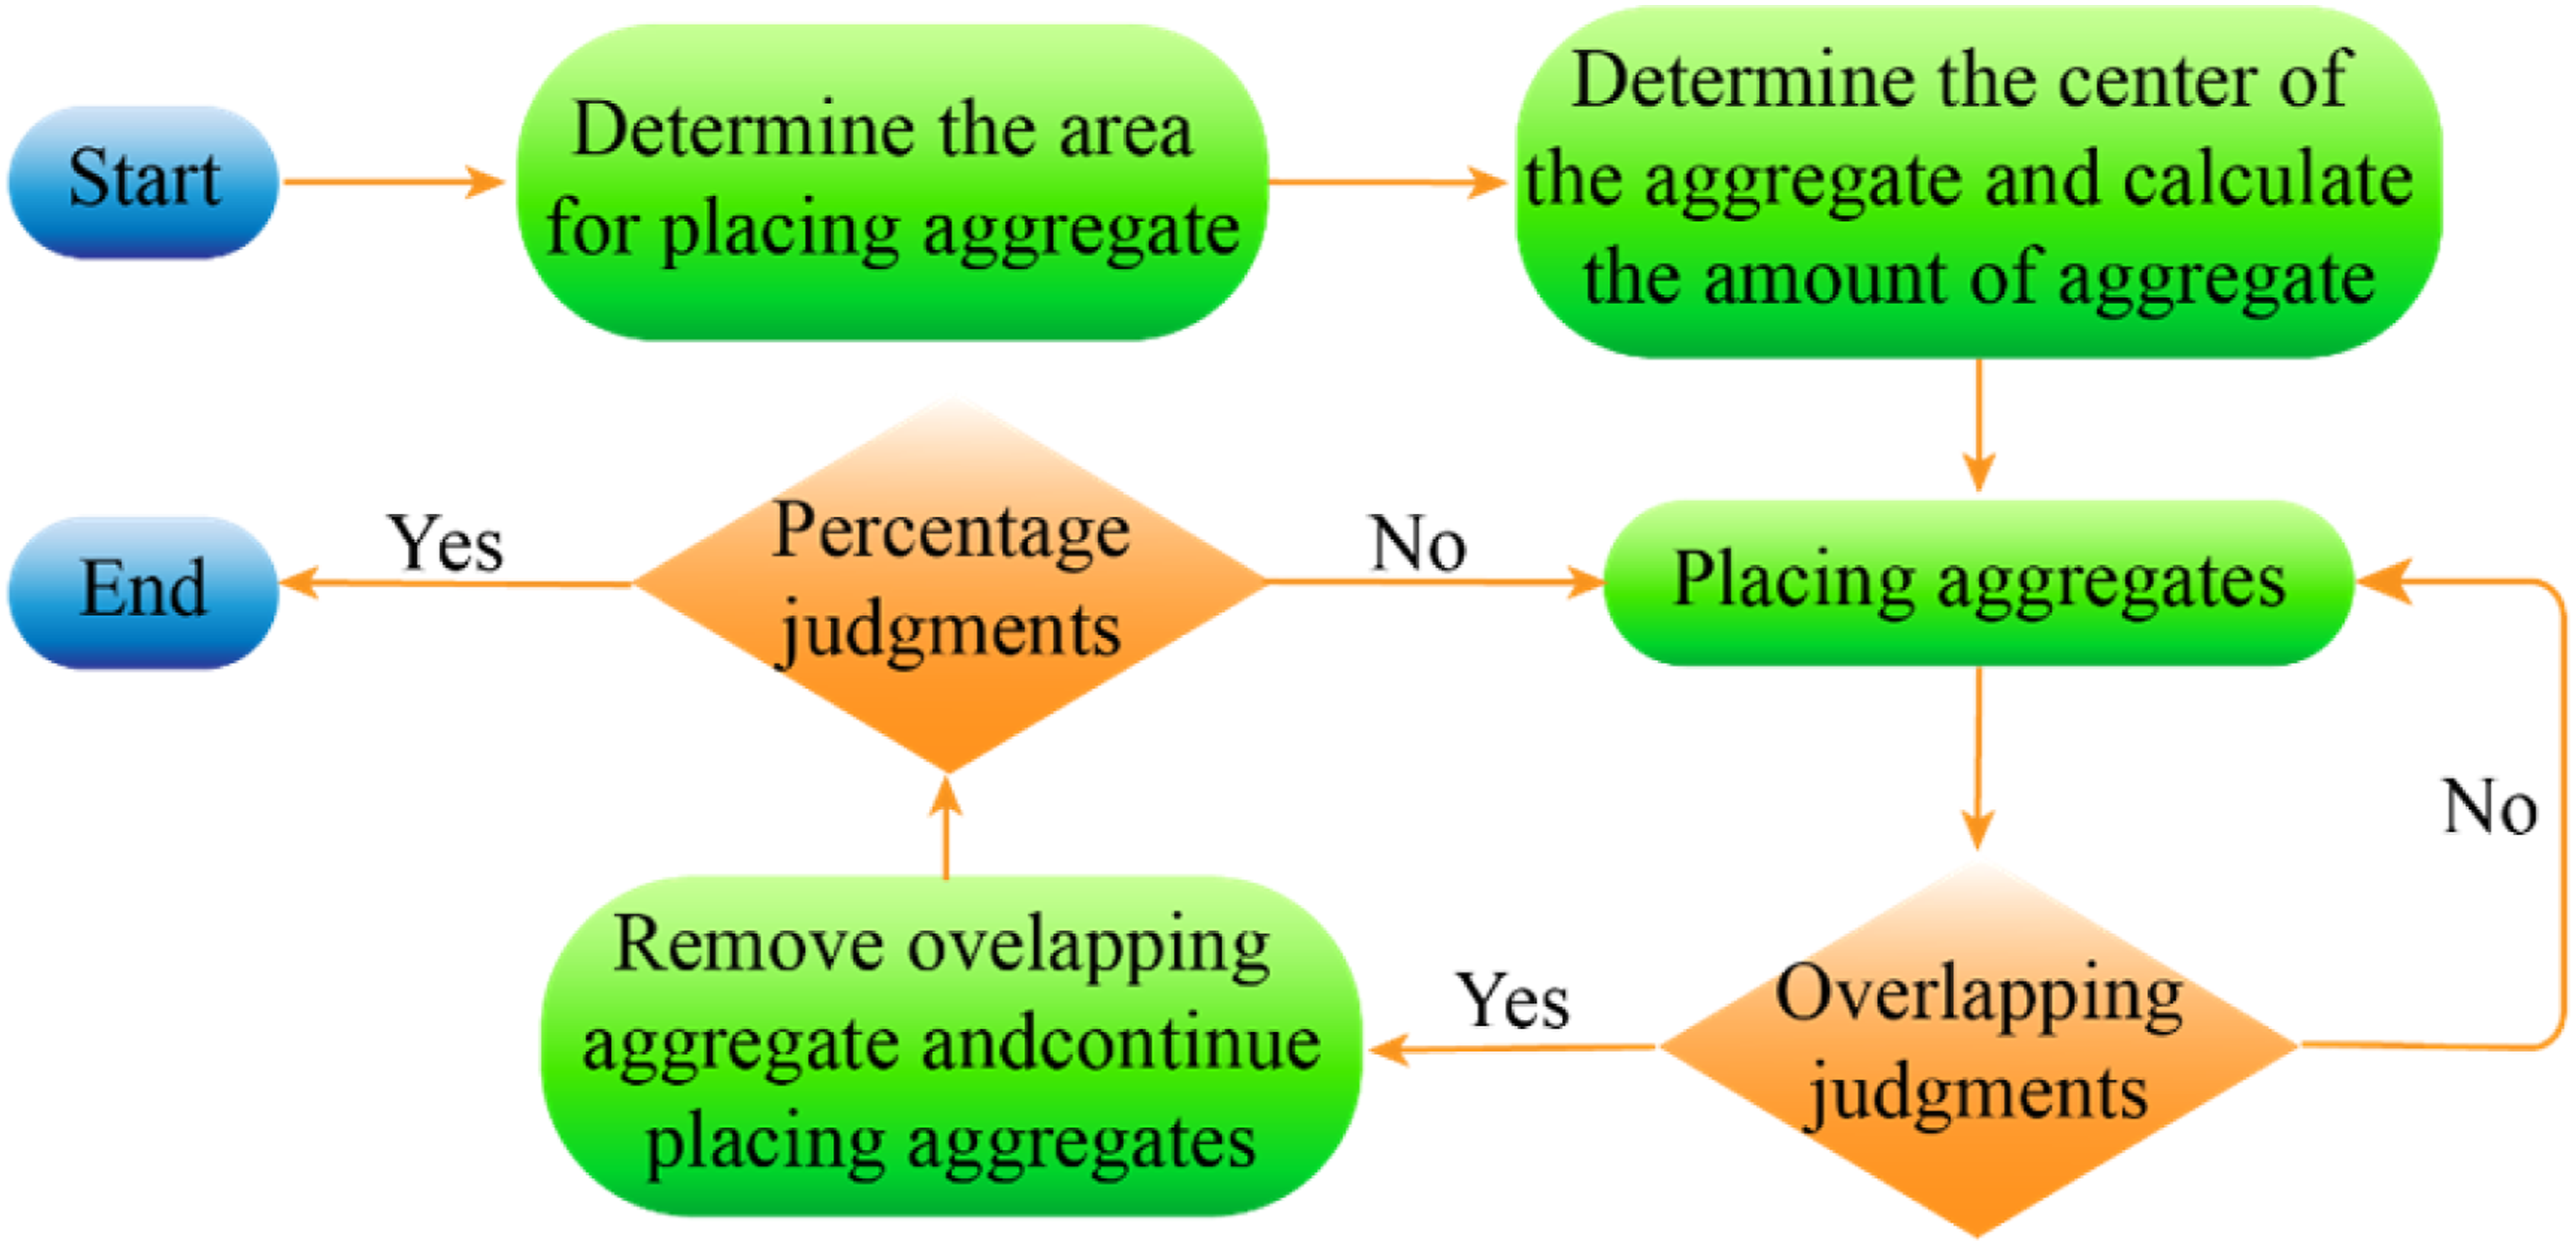
This study uses a simplified hexagonal close-packed model of circular block particles, with the particular arrangement shown in Figure 3, to eliminate the effects of random disturbances. Theoretically, the highest packing density possible for circular particles in two dimensions is represented by hexagonal compacting (Chang and Wang, 2010). By skipping the complicated computational and compaction procedures needed to create high-volume-fraction random models, this method instantly creates a stable, highly dense initial accumulation structure. Schematic diagram of hexagonal arrangement.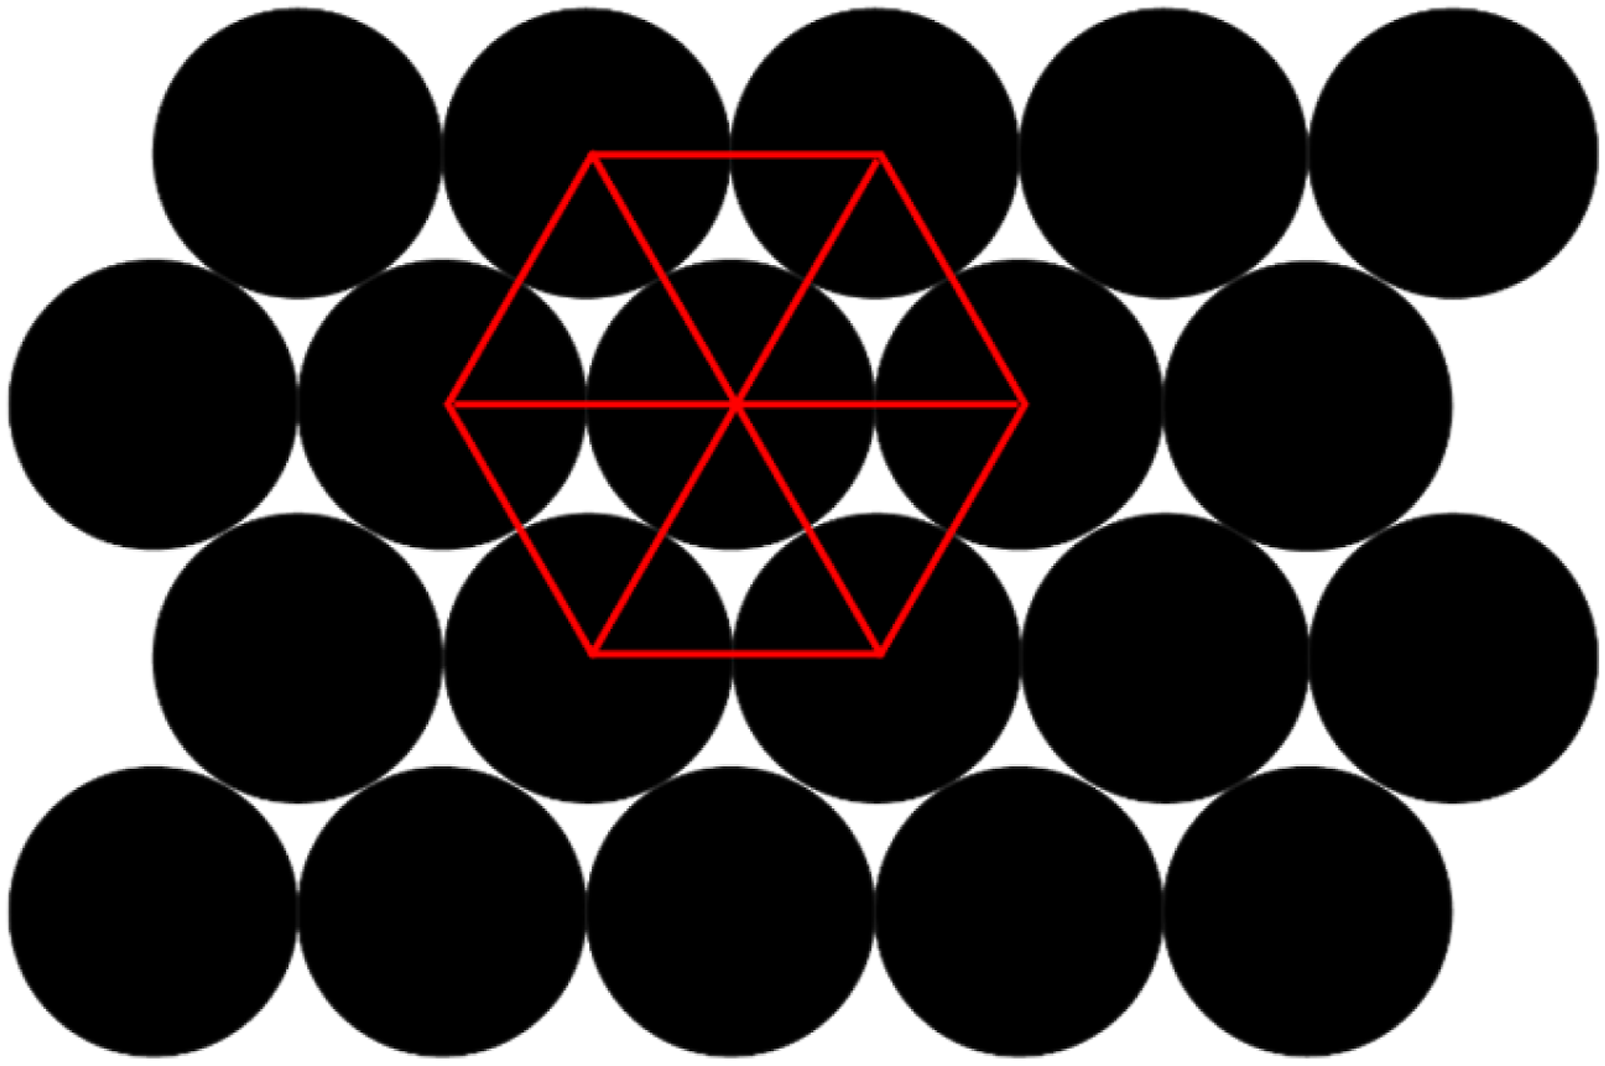
Modelling of crushable aggregates using clusters
Considering the block stone experiences violent crushing during projectile penetration, this research models aggregates as crushable clusters. The particles within a cluster exhibit minimal or no overlap, and when subjected to a sufficient external force, the bonds between particles break, leading to crushing of the cluster (Zhang et al., 2022). This modeling technique accurately captures the mechanical behavior of block stones during penetration, producing simulation results that closely align with reality. It should be mentioned that clusters cannot be created directly because they are essentially a combination of multiple bonded particles rather than a fundamental unit. As illustrated in Figure 4, the aggregate spatial positions are first identified based on the previously generated aggregate model. The rigid aggregate units are removed and replaced with crushable clusters, completing the reconstruction of the block stone aggregate model. Cluster replacement sample.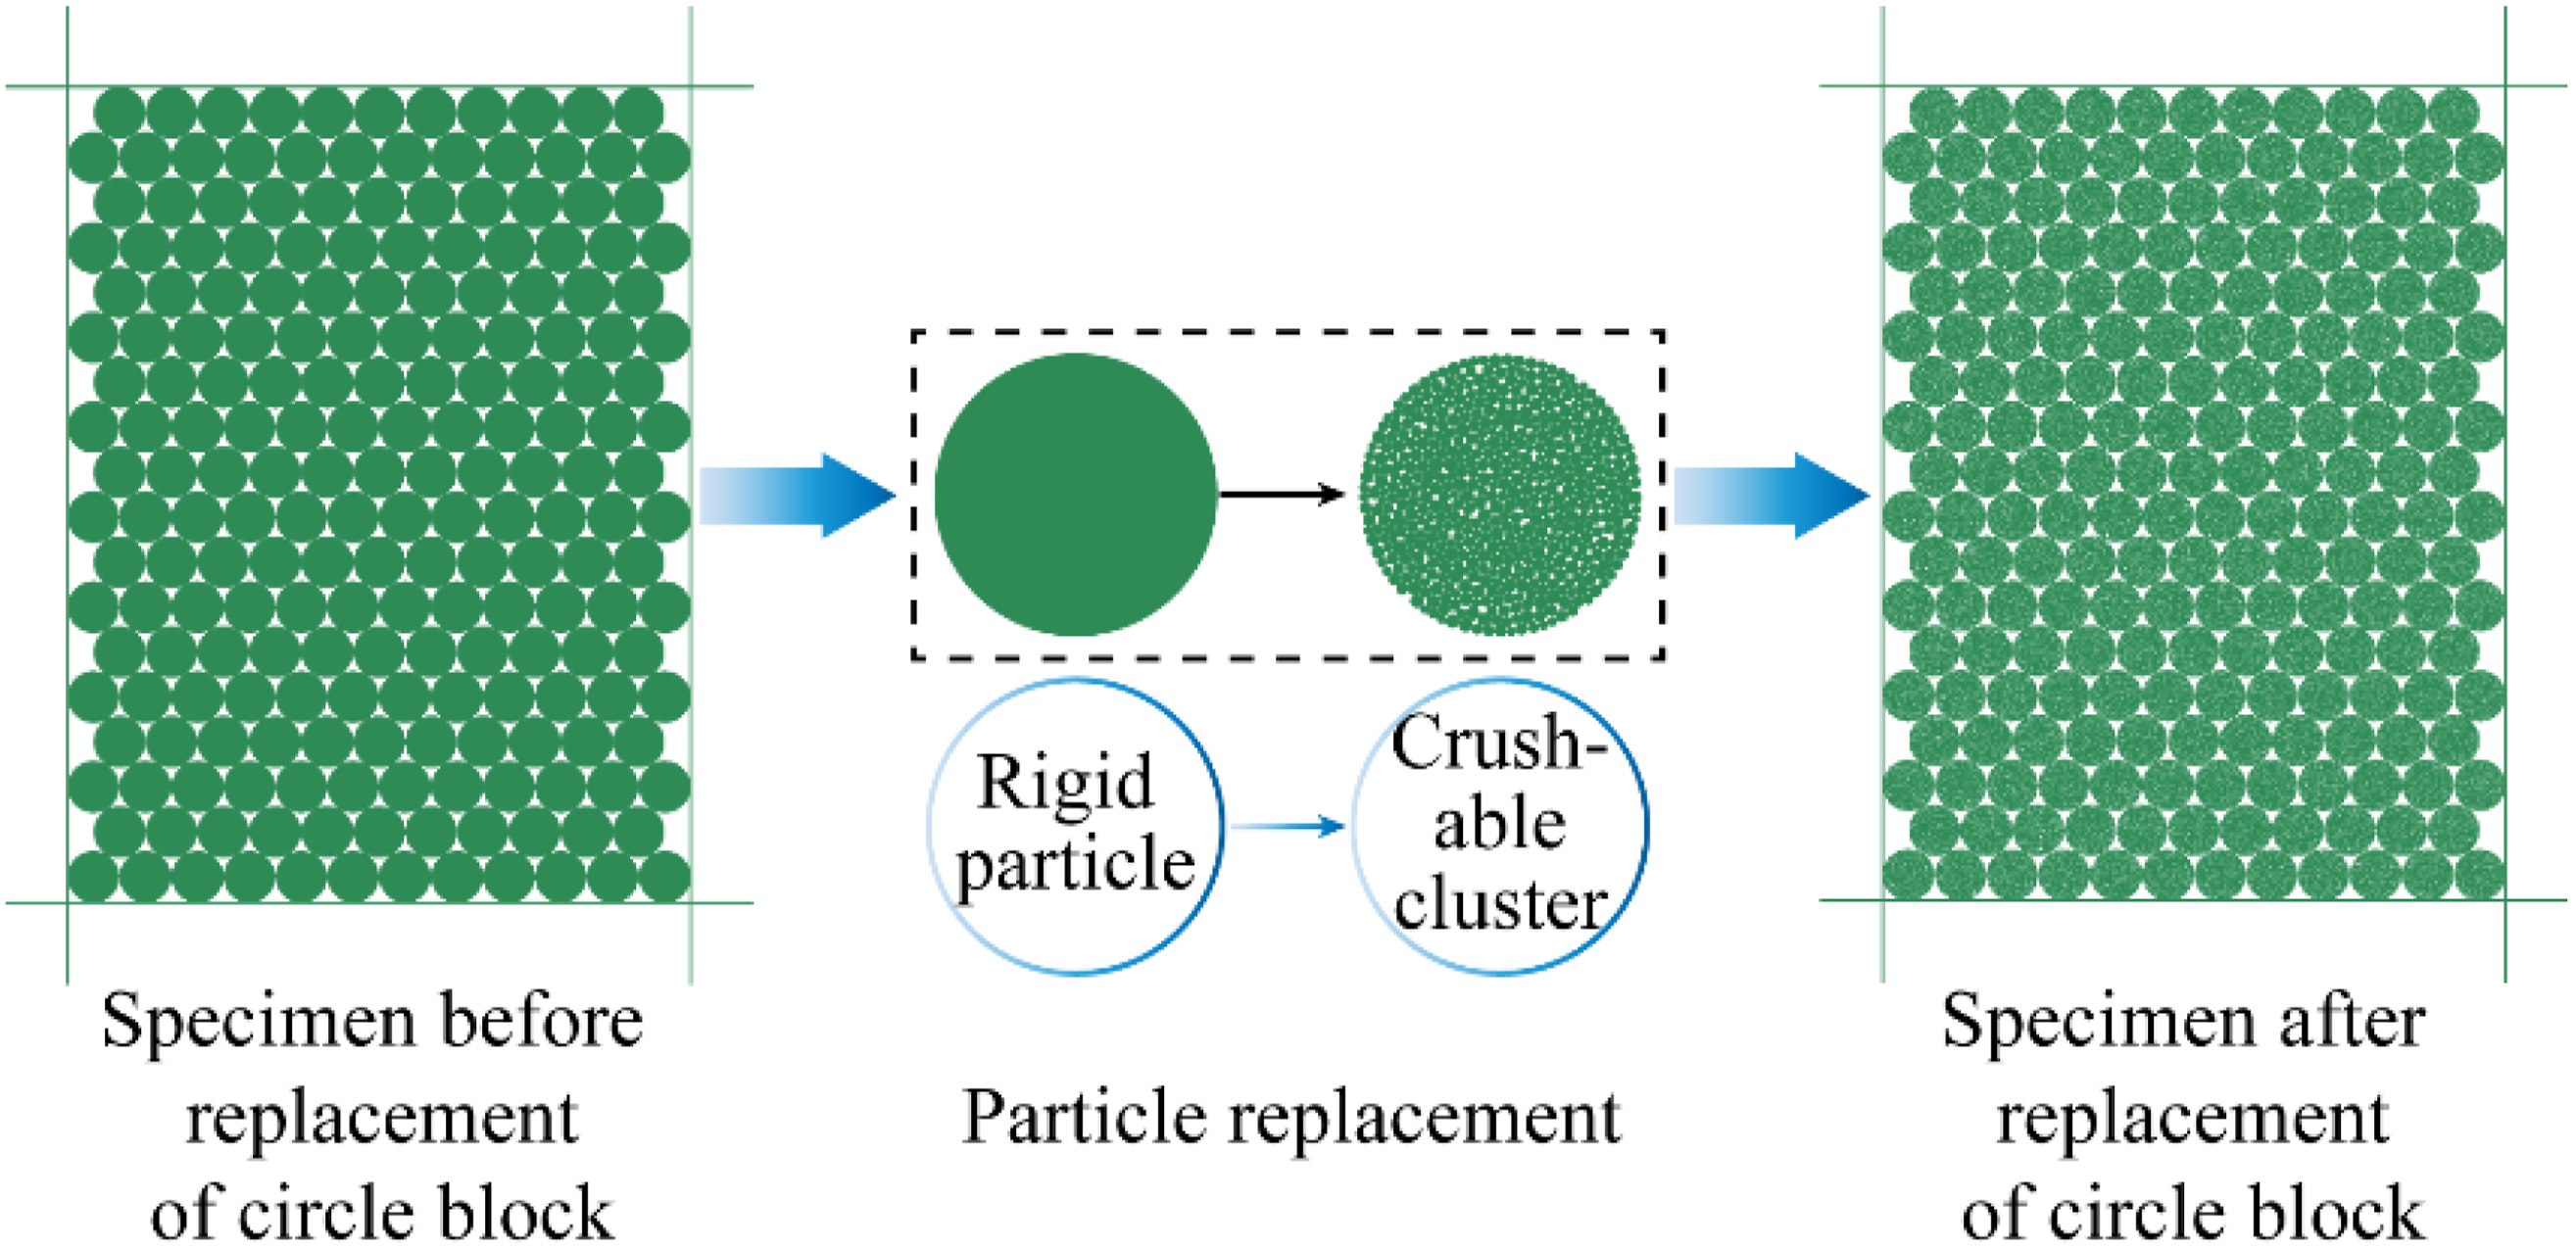
The linear parallel bond model (LPBM) is employed to simulate the interactions between particles within cluster aggregates. This model can resist compressive, shear, and tensile forces, and transmit moments (Potyondy and Cundall, 2004), making it suitable for brittle materials such as concrete and block stone. The LPBM mechanism consists of two sets of springs: a parallel bond spring and a linear contact spring, both with constant normal and shear stiffness. Figure 5 illustrates the basic structure of the LPBM, where: gs is the contact surface gap, kn is the linear contact normal stiffness, ks is the linear contact shear stiffness, Basic structure of the linear parallel bond model:(a) Unbond (linear model);(b) Bond (linear parallel bond model).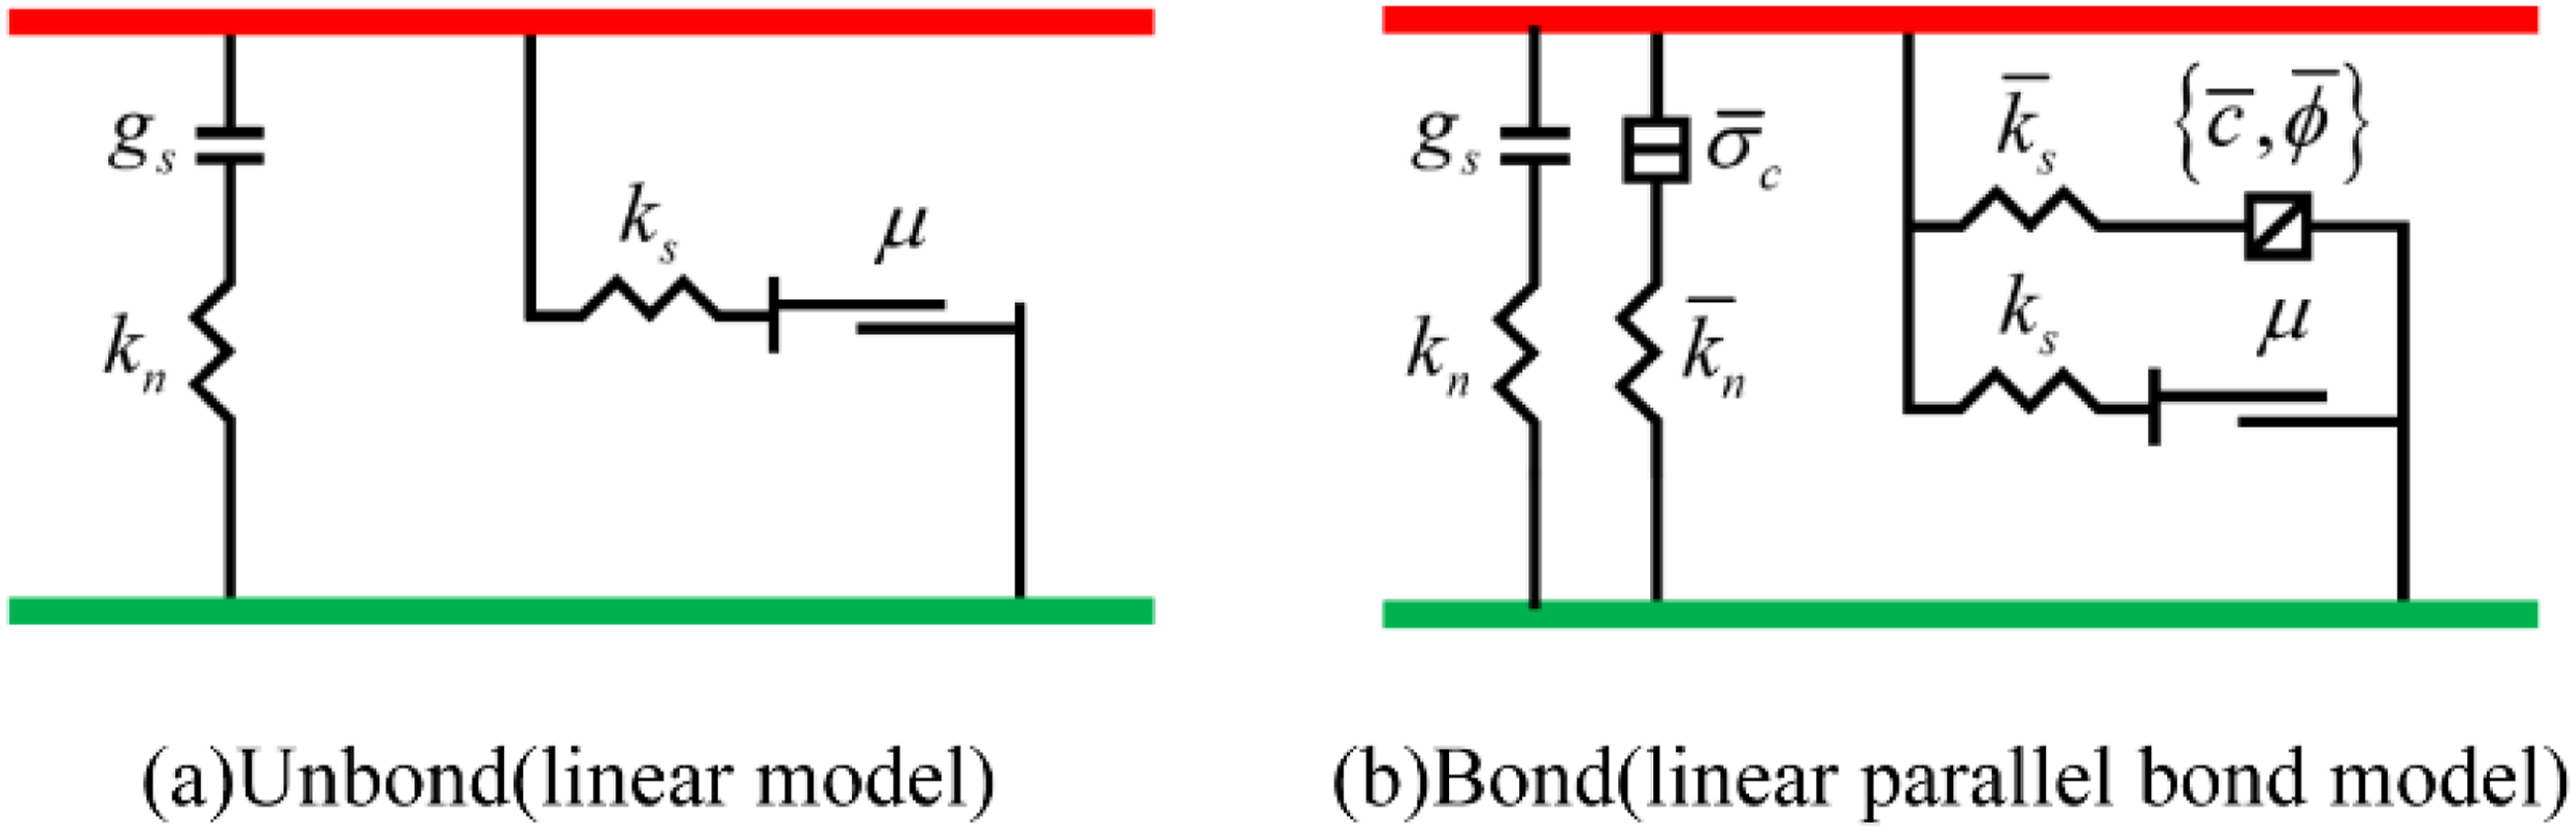
The force-displacement law for the parallel-bond force Force-displacement law for the parallel bond force and moment:(a) Normal force versus parallel-bond surface gap;(b) Shear force versus relative shear displacement;(c) Twisting moment versus relative twist rotation;(d) Bending moment versus relative bend rotation.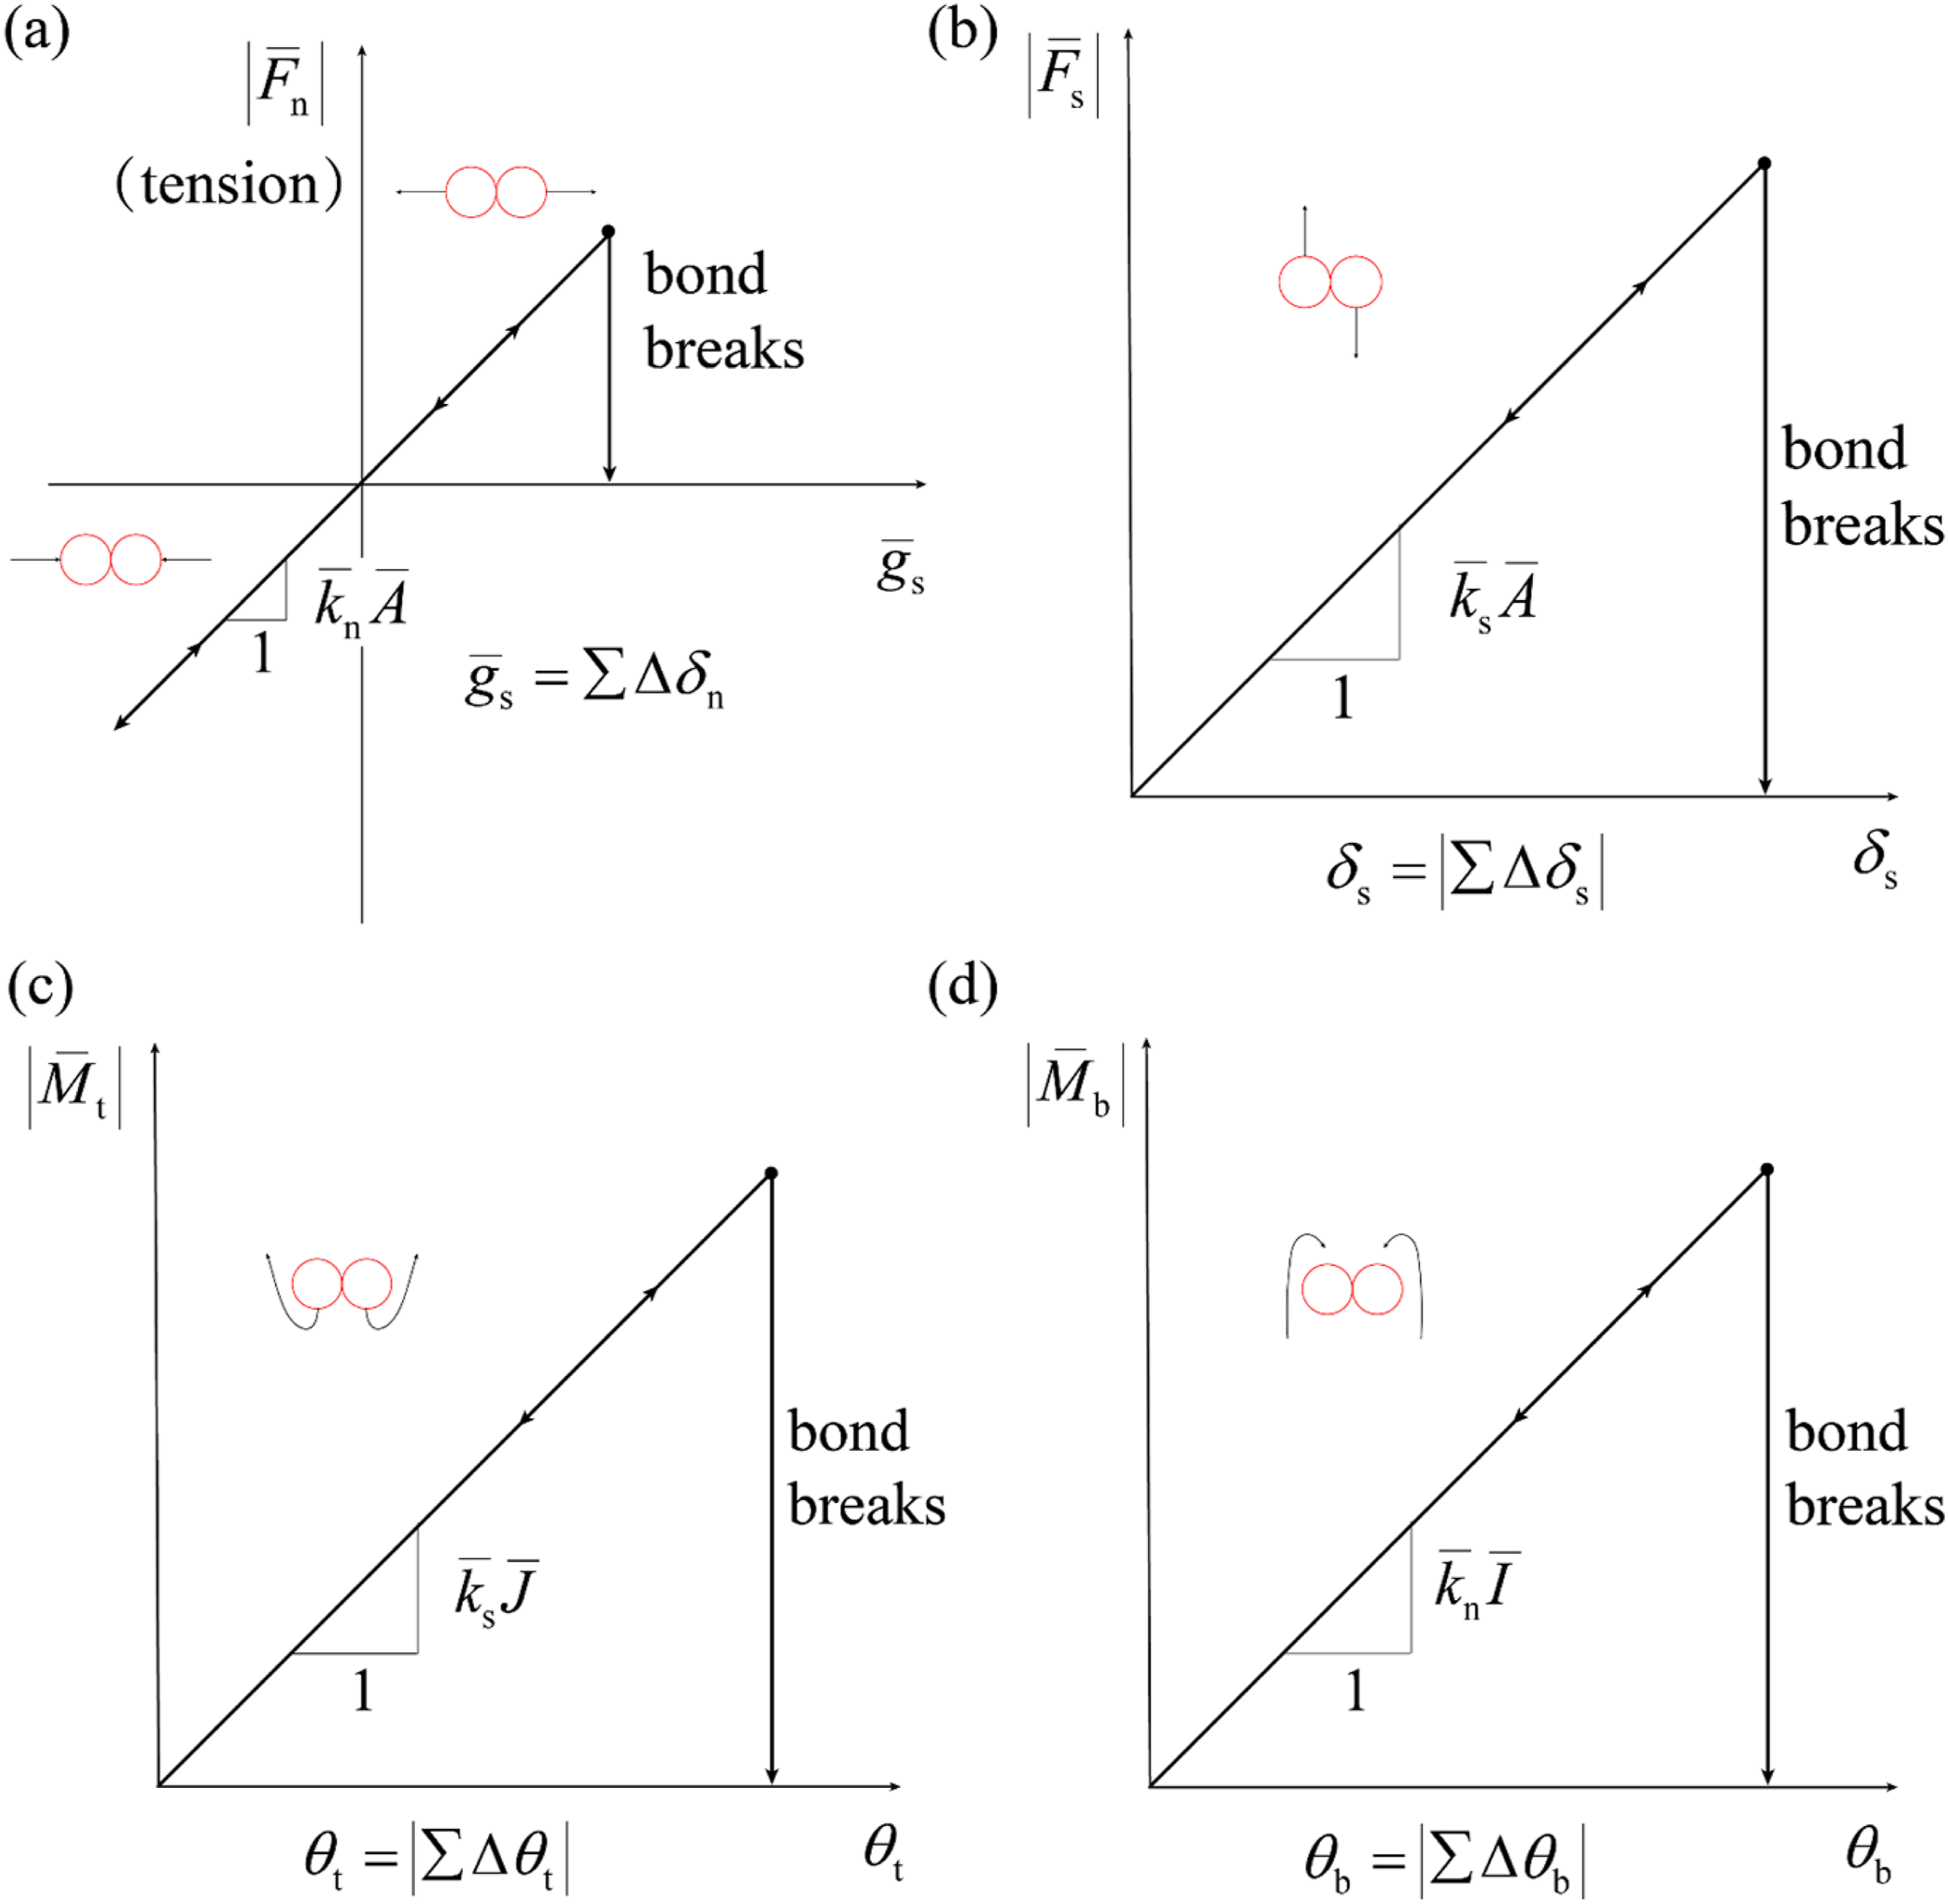
If the force or moment exceeds the corresponding bond strength, the parallel bond breaks, and the contact model degenerates into a linear model (LM, Figure 5(a)). The increments of

Modeling of mortar matrix and ITZ
In the discrete element model of concrete, the material is treated as a three-phase composite composed of aggregate, mortar, and the ITZ between them (Hao and Hao, 2011; Pan et al., 2015). After generating the crushable cluster aggregates, the remaining spaces are filled with mortar particles to form a complete meso-scale model of block stone concrete. Particles with radii between 0.2 mm and 0.32 mm are uniformly distributed outside the aggregate outlines and within the rectangular boundary of the geometric model. The contact between mortar particles is also modeled using the parallel bond model. If the research focuses on unmortared block stone structures, the mortar generation step can be omitted, as the mechanical behavior relies entirely on the contact friction and geometric interlocking between block stones (Çaktı et al., 2016).
The ITZ is a thin zone (20 μm–100 μm) surrounding the aggregate surface, characterized by high water content, porosity, and Ca(OH)2 concentration. Due to its relatively low strength, it is often regarded as the weakest phase in concrete (Elsharief et al., 2003). Its very thinness poses a modeling challenge: using large particles distorts the model, while using small particles increases computational cost. Furthermore, it is difficult to determine macroscopic mechanical properties of the ITZ through laboratory tests. Therefore, in simulations, the ITZ is commonly represented by assigning weakened mortar mechanical parameters, typically ranging from 30% to 80% (Chen et al., 2023; Nitka and Tejchman, 2018; Suchorzewski et al., 2017; Zhou et al., 2022) of the mortar strength. In this work, the ITZ is characterized by weakened interfacial contact connections between aggregate and mortar particles. The resulting meso-scale discrete element model of concrete is shown in Figure 7. The cross-section from the clip box reveals the meso-composition: region I for aggregate, region II for mortar, and region III for ITZ. The final concrete model integrates 108,503 particles and 296,953 interactions. The DEM numerical model of concrete.
Model calibration and calculation of penetration results
The numerical simulations of rigid projectile penetration into a meso-scale concrete target are conducted using the Particle Flow Code (PFC). This section describes the calibration methodology for the meso-scale contact parameters and the approach for calculating penetration simulation results.
Calibration of meso-mechanical parameters
The penetration tests conducted by Zhang et al. (2004) are replicated numerically within PFC. The largest aggregate size in the experimental setting was 20 mm, and the volumetric fraction of granite aggregate in NC40 concrete was approximately 41%. In the simulations, aggregates smaller than 5 mm are considered part of the mortar matrix, while those between 5 mm and 20 mm are treated as uniformly distributed coarse aggregates. An ogive-nosed projectile with a diameter of 12.6 mm, a length of 23.93 mm, a caliber-radius-head (CRH) of 2.5, and a density of 7800 kg/m3 is used in both the experiment and numerical simulations (Figure 8). This study focuses on the penetration resistance of concrete at an initial projectile velocity of 600 m/s (less than 800 m/s), where the projectile can be reasonably treated as rigid (Forrestal et al., 1996, 2003). Accordingly, the projectile is modeled as a rigid block. Schematic diagram of projectile.
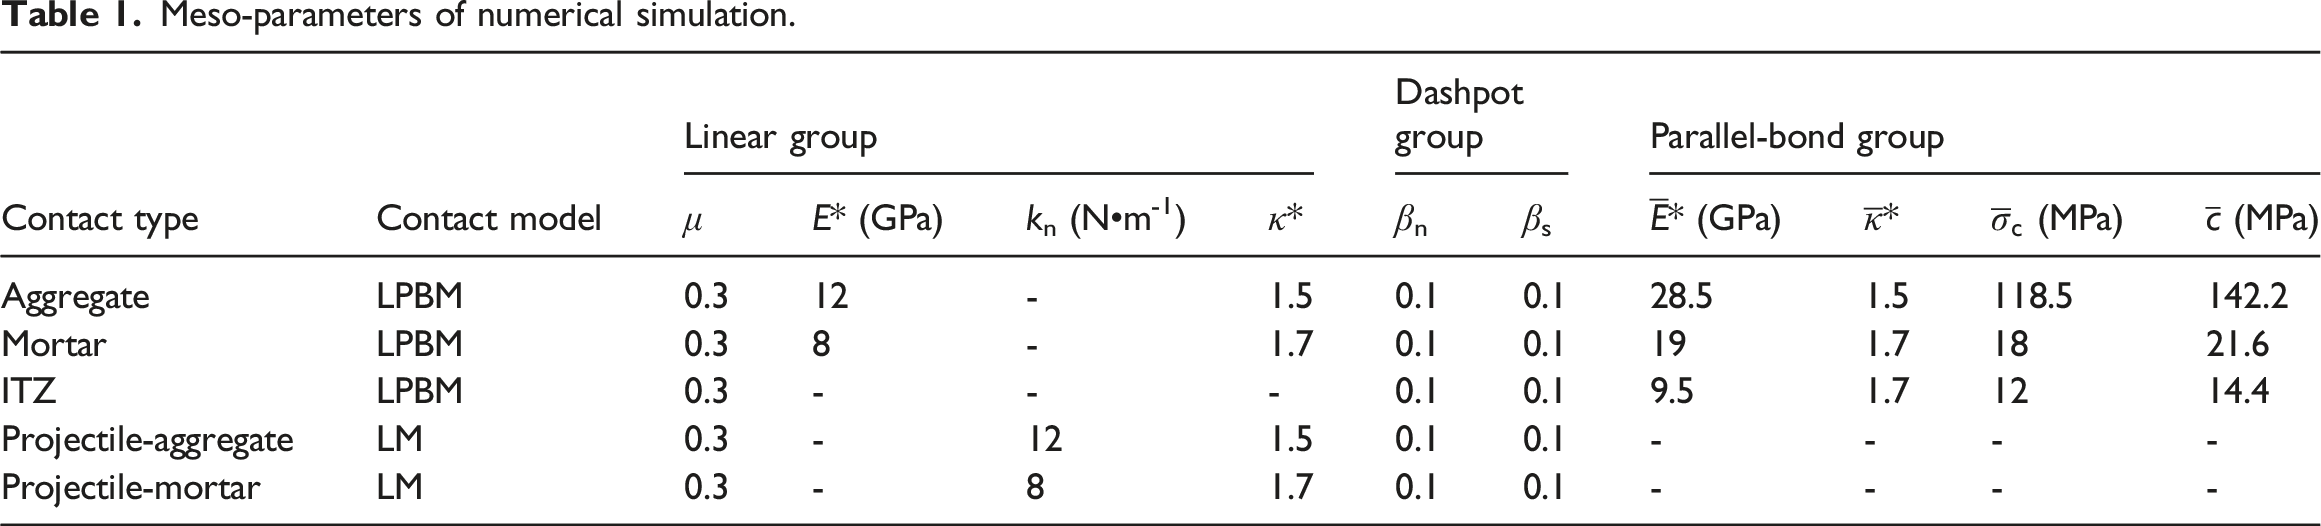
Meso-parameters of numerical simulation.
As shown in Figure 9, the simulation results capture significant interface cracking between aggregate and mortar due to the low mechanical strength of the ITZ, which acts as the weak link during penetration. Aggregates near the penetration path exhibit extensive fragmentation, accurately represented by the crushable cluster model. To mitigate the influence of randomness, each set of conditions is simulated under three distinct random aggregate distributions (as shown in Figure 2). A comparison between experimental and numerical simulation penetration depths is presented in Table 2. The percentage error in penetration depth is controlled within 2% for all three impact velocities, confirming the accuracy of the numerical model in predicting penetration depth. Penetration experiment and numerical simulation results:(a) Numerical simulation result for NC40-1;(b) Numerical simulation result for NC40-2;(c) Numerical simulation result for NC40-3. Experimental and numerical simulation results of the depth of penetration.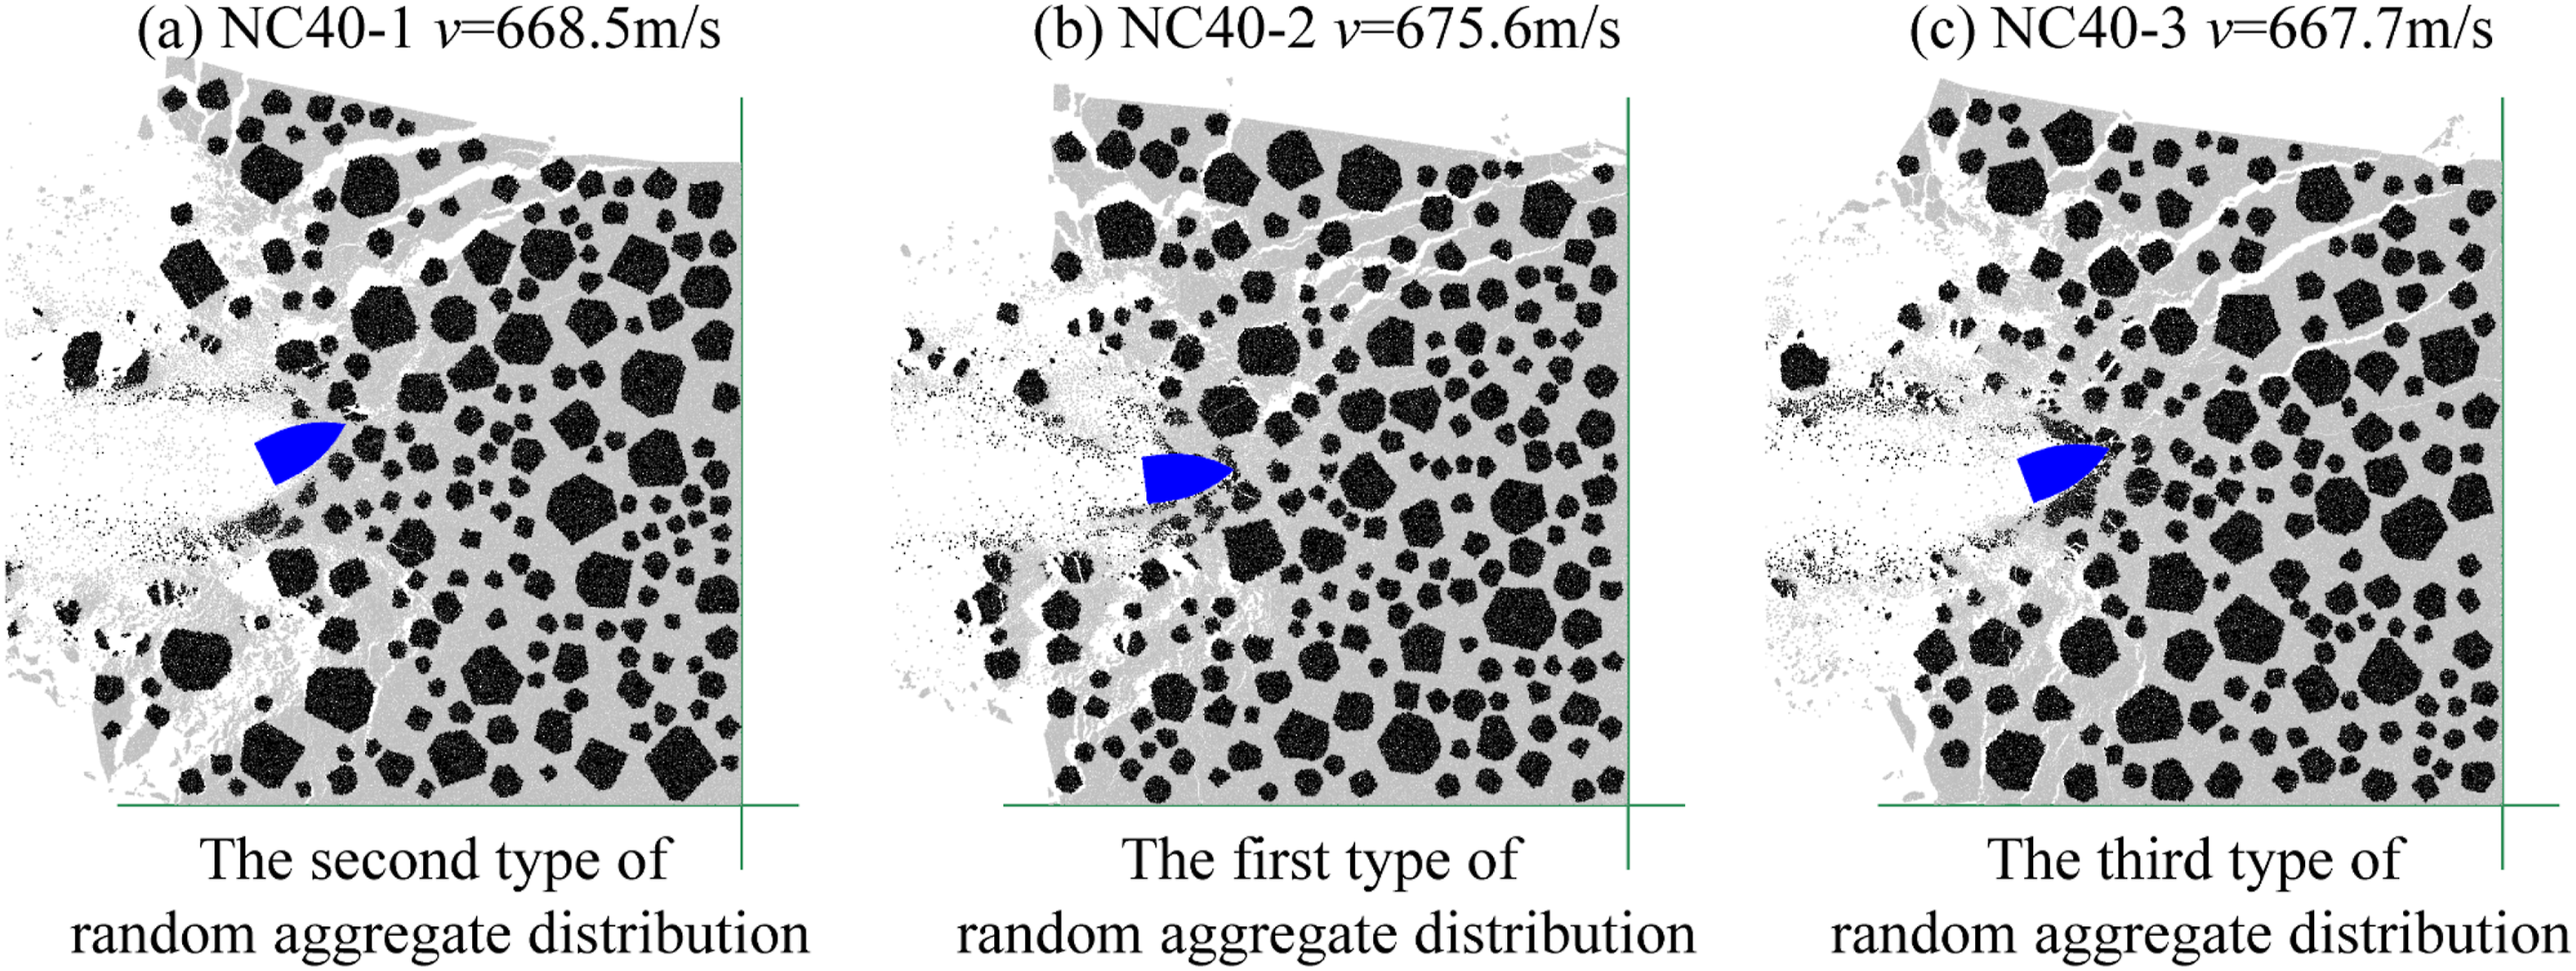

There is a boundary effect when a projectile penetrates the concrete target plate. However, the influence of the lateral boundary on the penetration process can be disregarded if the projectile velocity is less than 800 m/s and the target-to-projectile diameter ratio is approximately 30 (Deng et al., 2017; Liu et al., 2018; Xue et al., 2017). To satisfy this condition, the target size is increased to a height of 400 mm and a width of 300 mm. The resulting target-to-projectile diameter ratio (d = 12.6 mm) exceeds 30. Additionally, the coarse-grained method is used to increase the particle size by two times (0.4 mm ∼ 0.64 mm) in order to ensure computational accuracy and efficiency (Zhao and Feng, 2022). After scaling the meso-parameters of the contacts according to the literature of Feng and Owen (2014), the resulting number of particles exceeds 100,000 for the unmortared block stone structure and 120,000 for the block stone concrete. The final values of the meso-parameters remain consistent with those in Table 1.
Calculation of penetration resistance R
Based on the cavity expansion theory and the Forrestal penetration depth model (Forrestal et al., 1994), Li and Chen (2003) developed a semi-analytical dimensionless formula for rigid projectile penetration into concrete: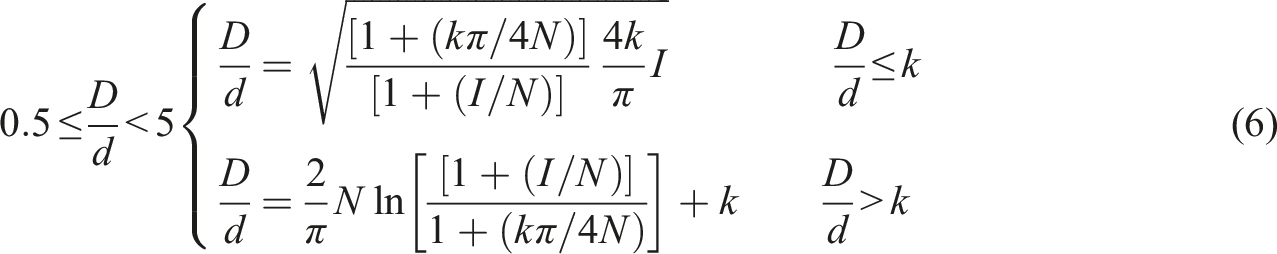
The impact function I and geometry function N are defined as:
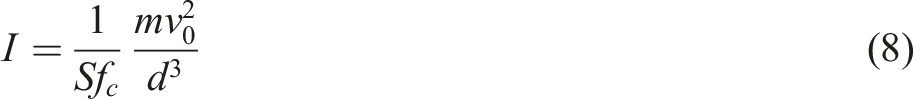
In this study, the resistance R is utilized in place of Sfc to examine the effects of mortar strength, aggregate strength, and aggregate size on penetration resistance. Combining equations (6) and (8) yields R for deep penetration (
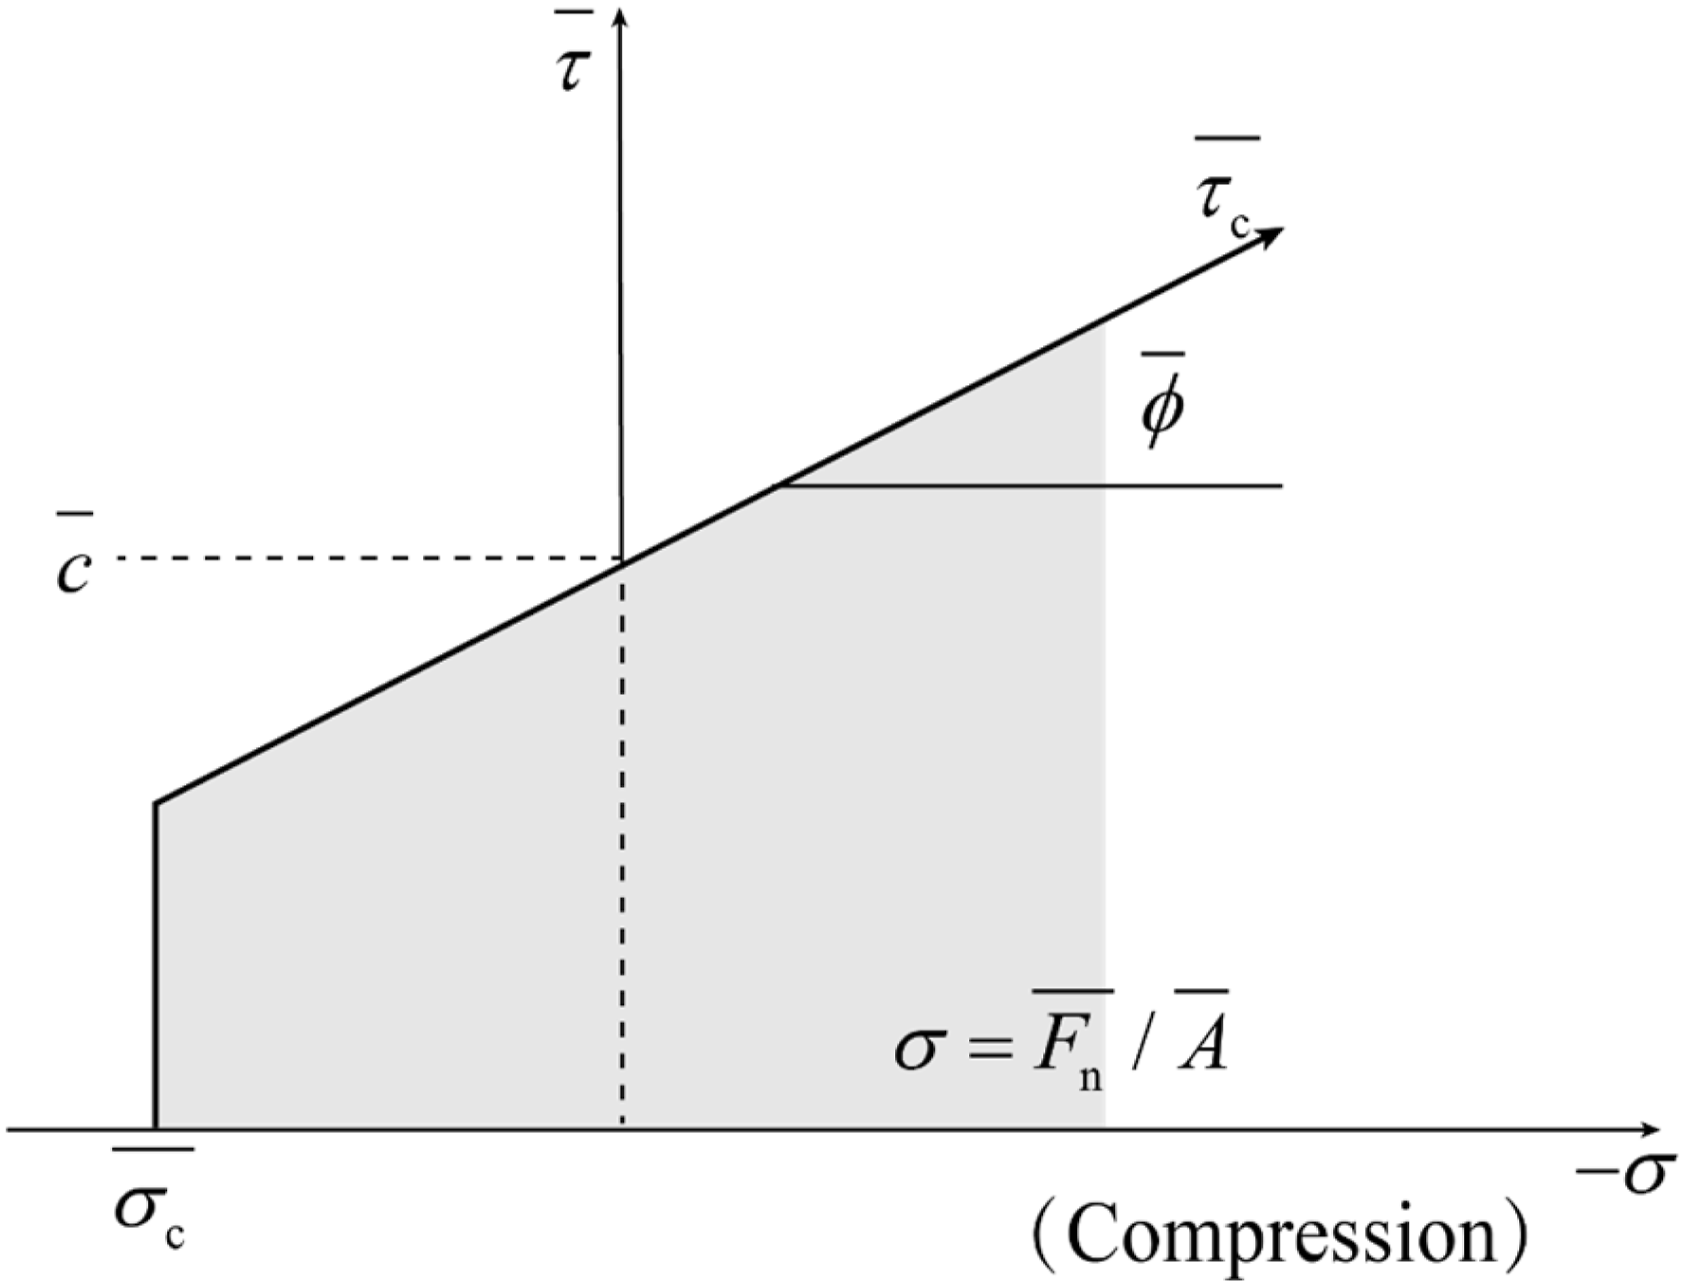
The mortar strength and aggregate strength used in the study refer to their unconfined macroscopic compressive strength, respectively. However, the macroscopic material strength and the meso-parameters calibrated in the discrete element model, which represent the particle contact characteristics, are not directly related. Therefore, particle parallel-bond strength cannot be directly used to study R. However, Yang et al. (2006) and Zhao et al. (2012) proposed the theoretical formulas between meso-parameters and macroscopic material strength according to the theoretical analysis combined with the numerical simulation method, and the case study confirmed the reliability of the correlative relations. Research indicates that the macroscopic compressive strength is mainly determined by the bound stress ratio of particles Failure envelope for the parallel bond.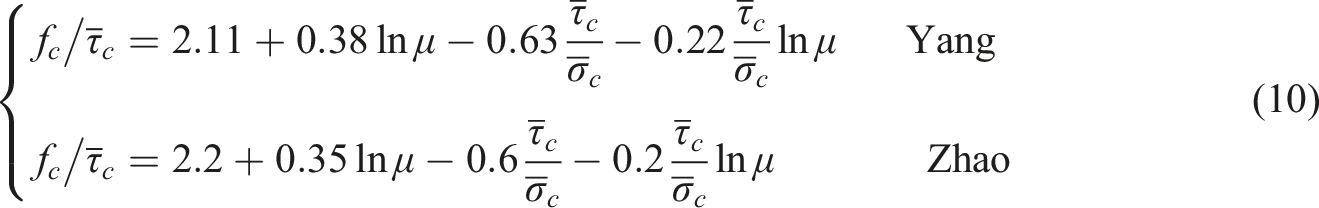


According to Table 1, the material’s uniaxial compressive strength is 1.3 times its bond shear strength since the bond stress ratio from the calibration is 1.2 and the friction coefficient is 0.3. The calibrated aggregate strength of 185 MPa aligns with the experimentally measured granite strength (Zhang et al., 2004), and the calibrated mortar strength is determined to be 28 MPa.
Parametric analysis of penetration resistance
Based on the validated meso-scale concrete model and calibrated contact parameters, a systematic parametric study is conducted to investigate the influence of mortar strength, aggregate strength, and aggregate-to-projectile size ratio on the penetration. Throughout this analysis, the projectile parameters, including diameter, CRH, mass, and impact velocity, are held constant.
Effect of mortar strength (fmor)
The influence of mortar strength on penetration resistance R is examined through simulations conducted with aggregate strengths of 80 MPa, 120 MPa, and 185 MPa (Kamani and Ajalloeian, 2019), with corresponding parallel-bond shear strengths of 61.5 MPa, 92.2 MPa and 142.2 MPa. Five mortar strength levels are considered: 0 MPa, representing an unmortared block stone structure, where the model contained no mortar particles and hence the corresponding parallel-bond shear strength is regarded as 0 MPa; and 12 MPa, 16 MPa, 28 MPa, and 40 MPa, representing block stone concrete with varying mortar quality (Peng et al., 2018), with corresponding parallel-bond shear strengths of 9.3 MPa, 12.3 MPa, 21.6 MPa, and 30.9 MPa. The projectile velocity is 600 m/s for the simulation, and the aggregate-to-projectile size ratio da/d is 2. To ensure statistical reliability, each penetration simulation is repeated three times with different random particle distributions.
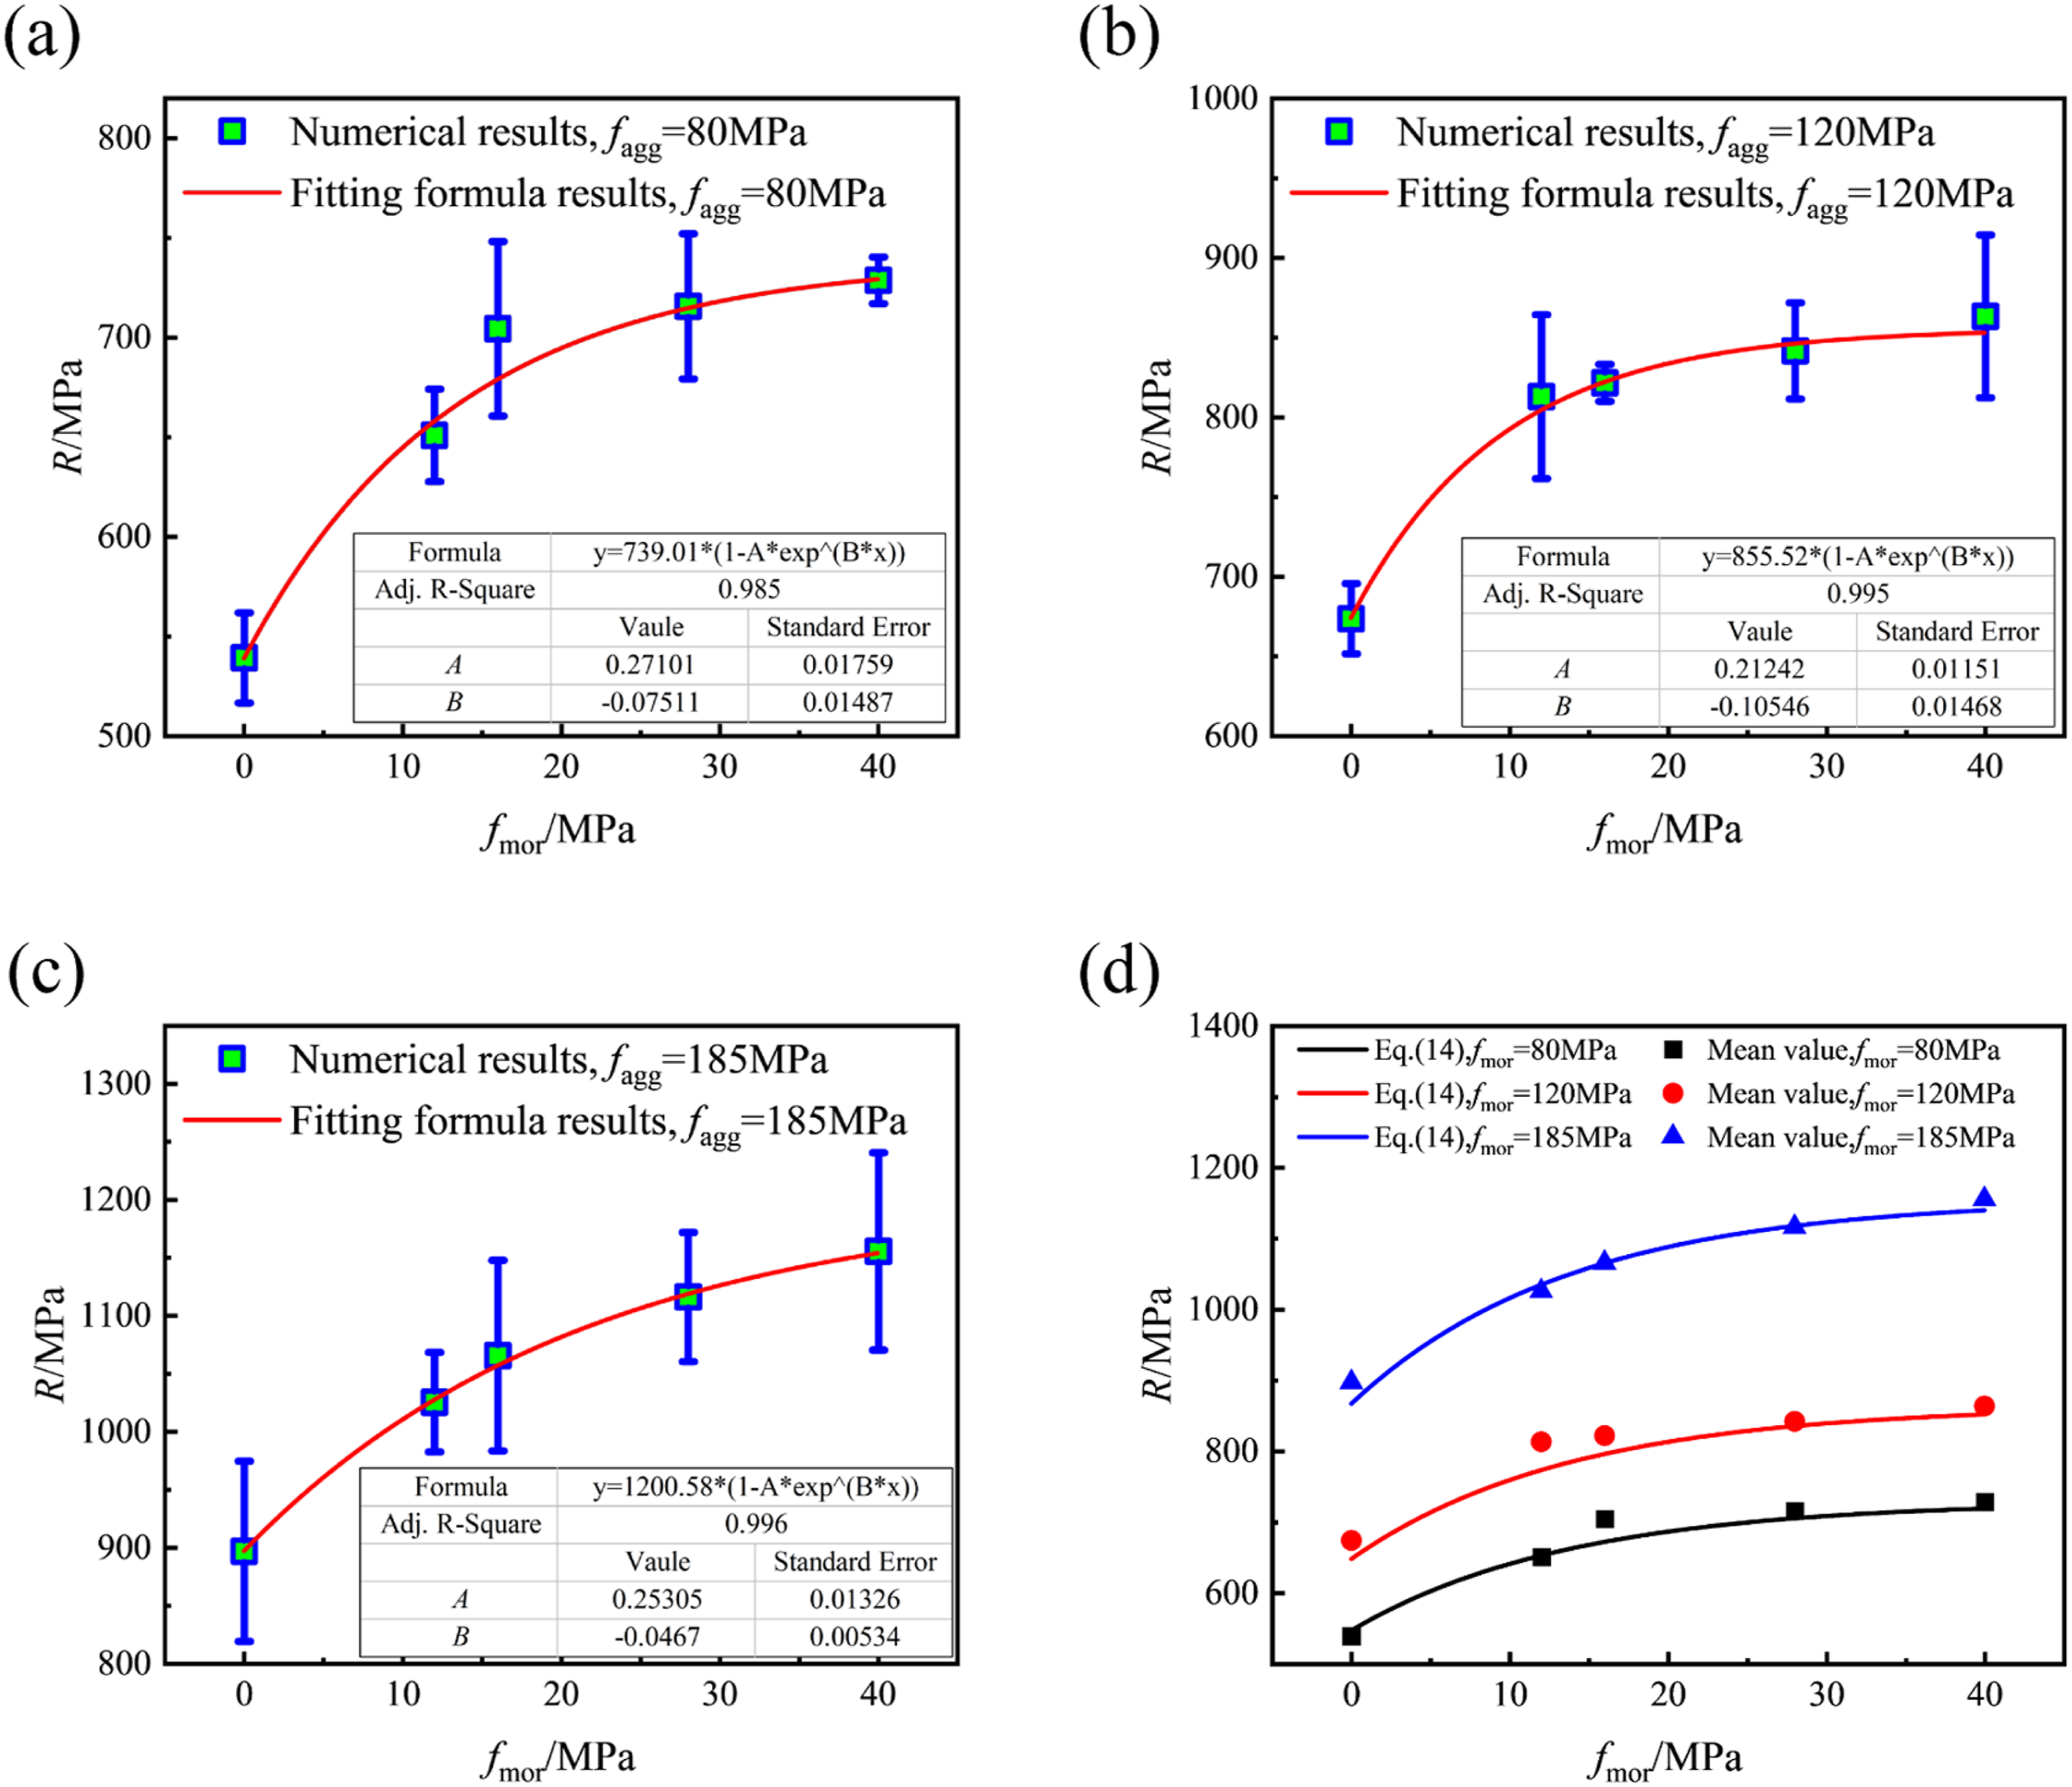
Data fitting analysis reveals a consistent trend across all three aggregate strength levels (Figure 11(a)-(c)): the penetration resistance R increases with increasing mortar strength fmor, and the gradient of R diminishes at higher strength values. The relationship between R and fmor for targets with different aggregate strengths can be described by a unified empirical expression: Relationships between R and mortar strength fmor:(a) fagg = 80 MPa;(b) fagg = 120 MPa;(c) fagg = 185 MPa;(d) Comparisons of R obtained by numerical simulation and equation (14). Determination of coefficients in equation (14).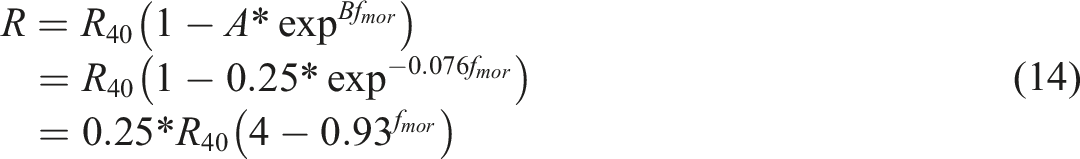
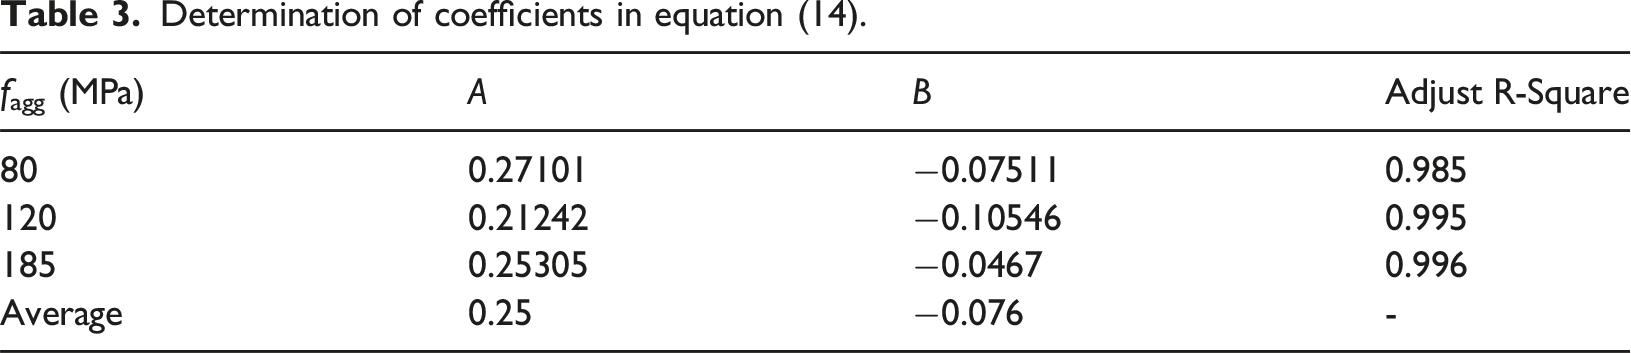
Effect of aggregate strength (fagg)
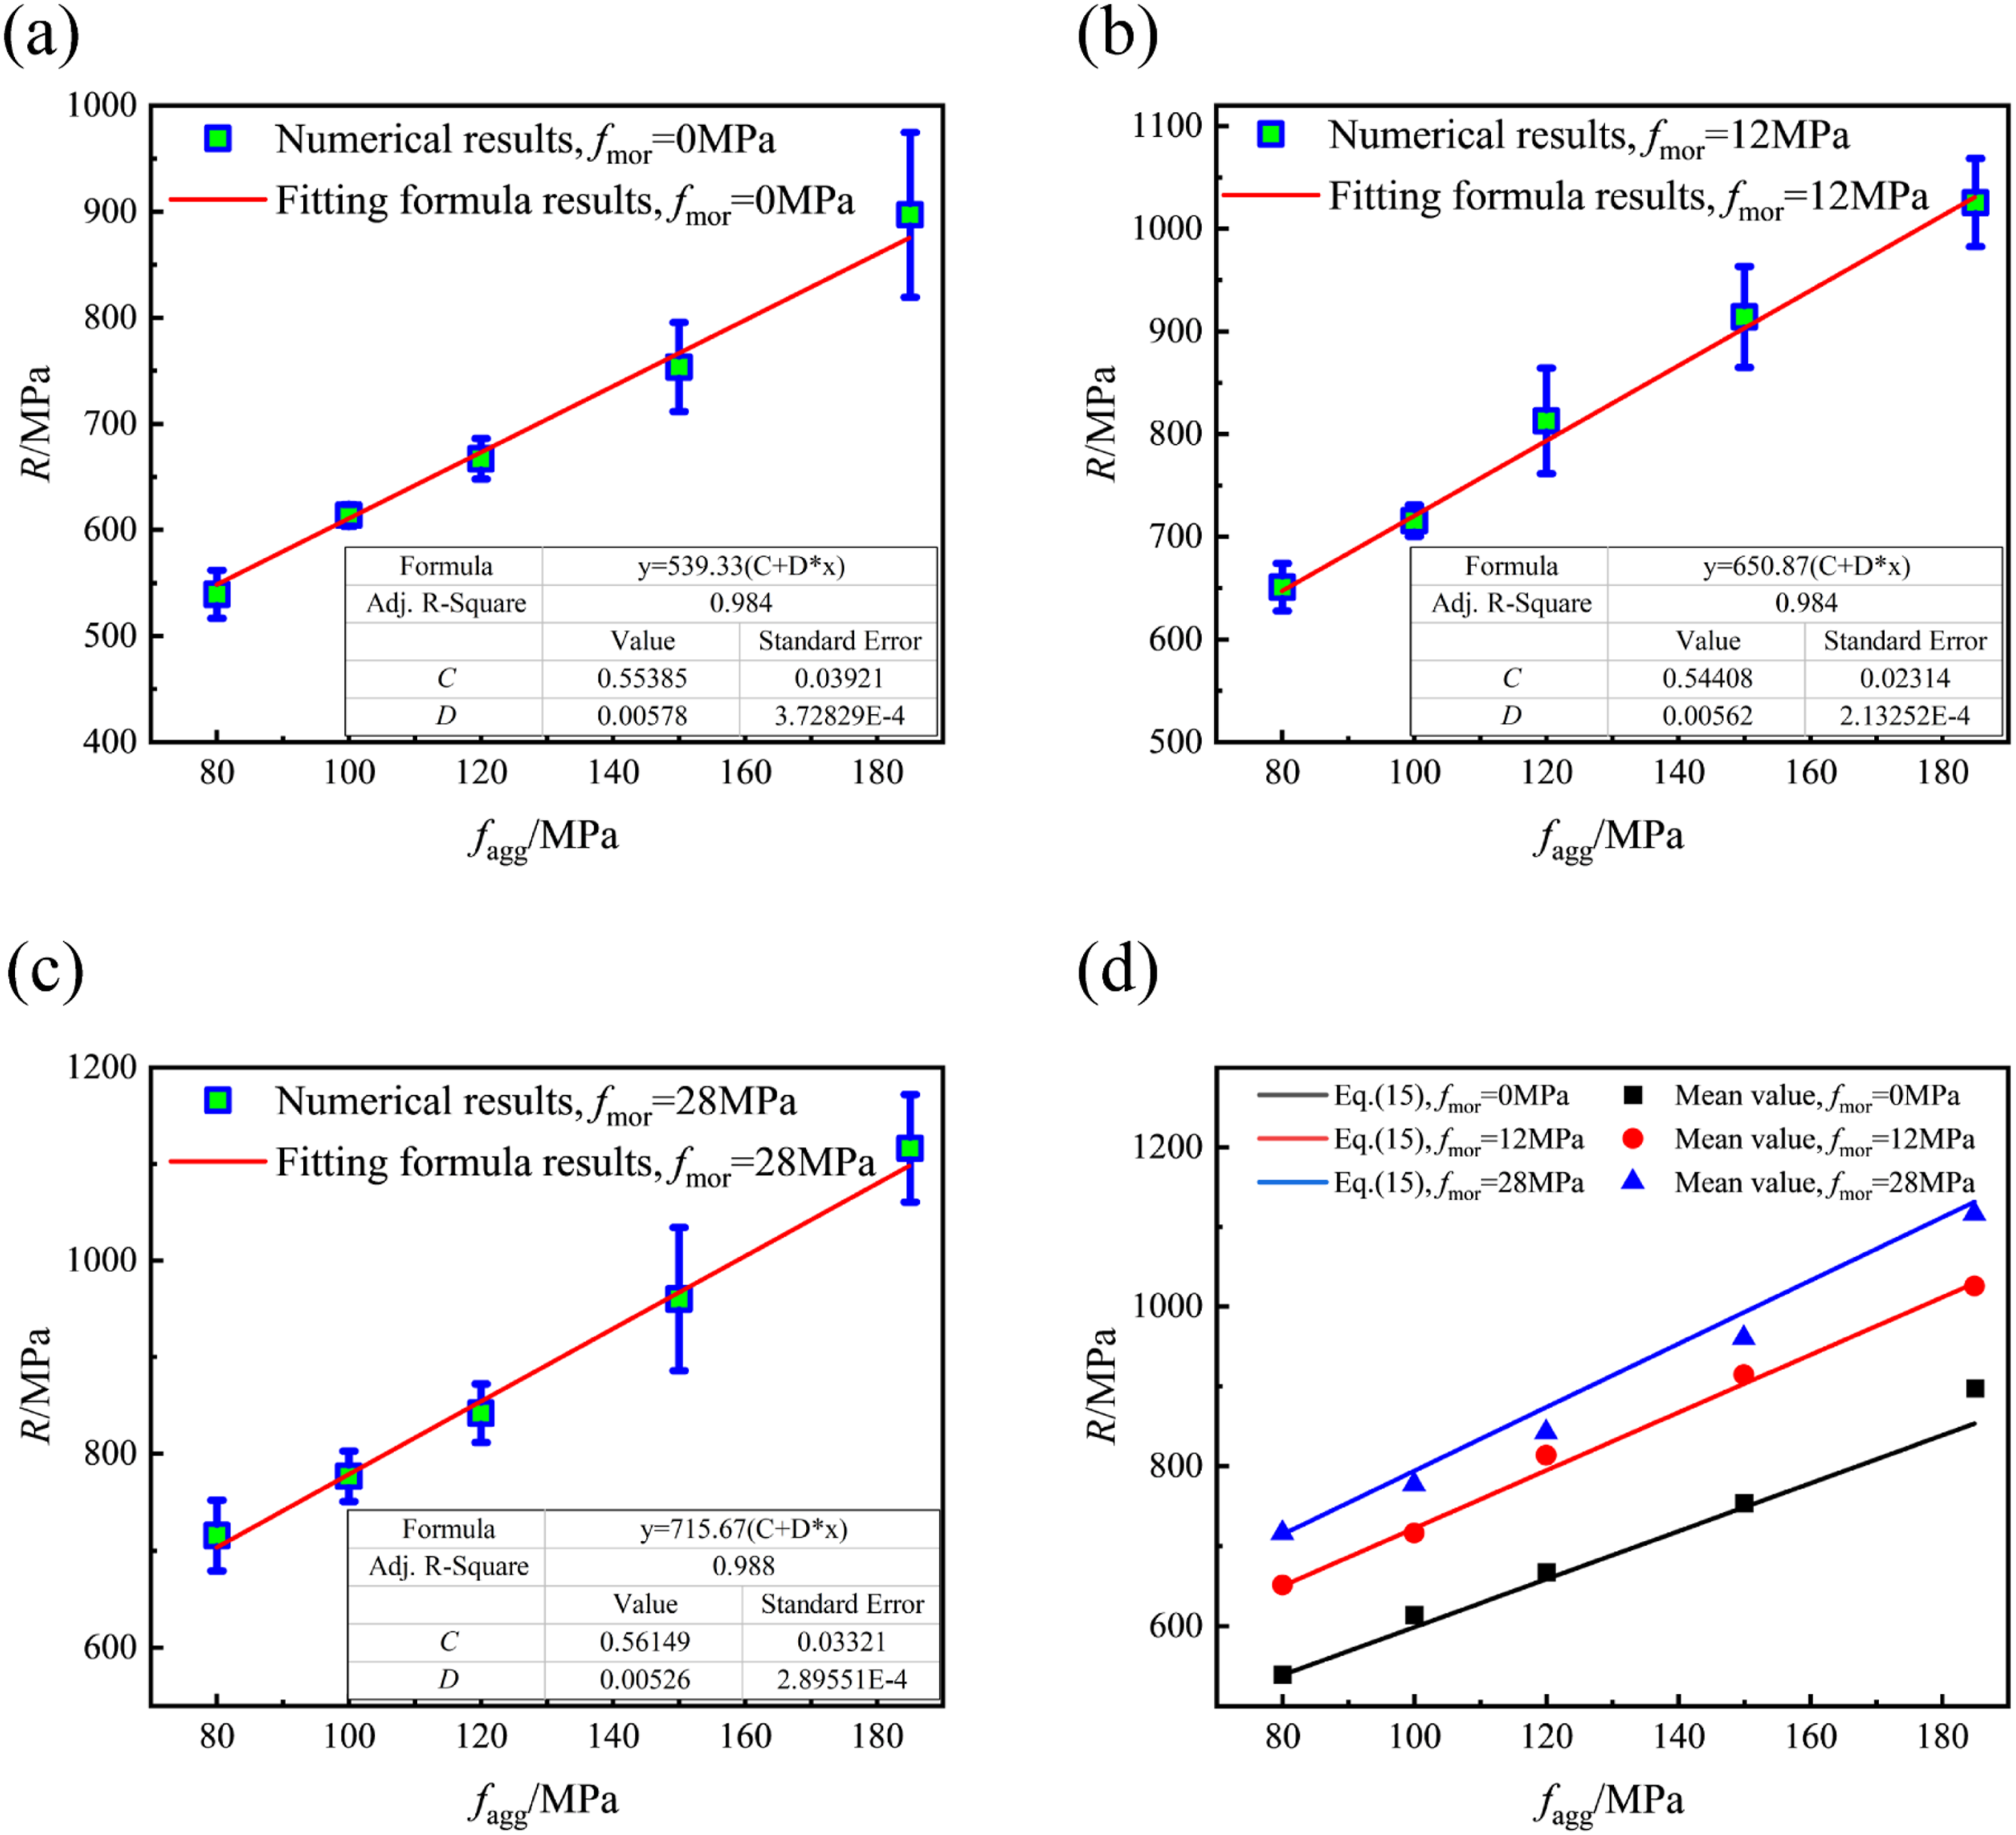
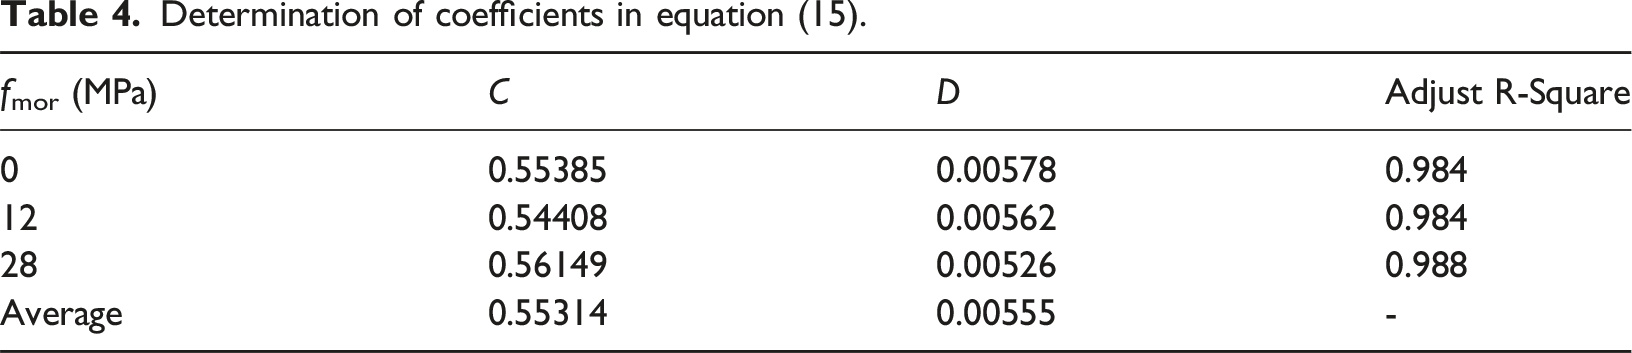
Penetration simulations are conducted on targets with five different aggregate levels (80 MPa, 100 MPa, 120 MPa, 150 MPa, and 185 MPa, with corresponding parallel-bond shear strengths of 61.5 MPa, 76.9 MPa, 92.2 MPa, 115.3 MPa, and 142.2 MPa) under three mortar conditions (0 MPa, 12 MPa, and 28 MPa, with corresponding parallel-bond shear strengths of 0 MPa, 9.3 MPa, and 21.6 MPa). Each configuration is simulated three times with random aggregate distributions, with a projectile velocity of 600 m/s and da/d = 2. The results are shown in Figure 12, indicating that for a fixed mortar strength, the penetration resistance R increases linearly with aggregate strength. This relationship can be generalized by the following formula for targets with different mortar strengths: Relationships between R and aggregate strength fagg:(a) fmor = 0 MPa;(b) fmor = 12 MPa;(c) fmor = 28 MPa;(d) Comparisons of R obtained by numerical simulation and equation (15). Determination of coefficients in equation (15).
Effect of aggregate-to-projectile size ratio (da/d)
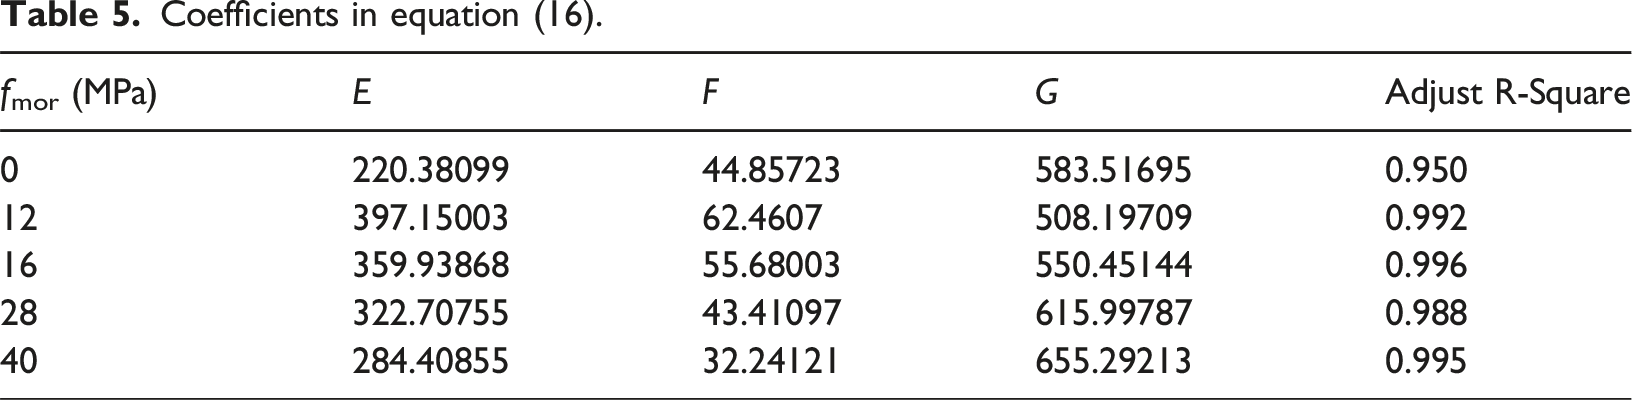
This section investigates the effect of the aggregate-to-projectile size ratio on penetration resistance. Numerical simulations are conducted for targets with various mortar strengths (0 MPa, 12 MPa, 16 MPa, 28 MPa, and 40 MPa, with corresponding parallel-bond shear strengths of 0 MPa, 9.3 MPa, 12.3 MPa, 21.6 MPa, and 30.9 MPa) and size ratios (0.5, 1, 2, 3, and 4). Each penetration test is simulated three times at random using samples with fagg = 185 MPa and a projectile velocity of 600 m/s. Figure 13 shows the relationship between R and da/d under different mortar strengths. The unified formula is: Relationships between R and ratio of aggregate size to projectile diameter da/d:(a) fmor = 0 MPa;(b) fmor = 12 MPa;(c) fmor = 16 MPa;(d) fmor = 28 MPa;(e) fmor = 40 MPa.
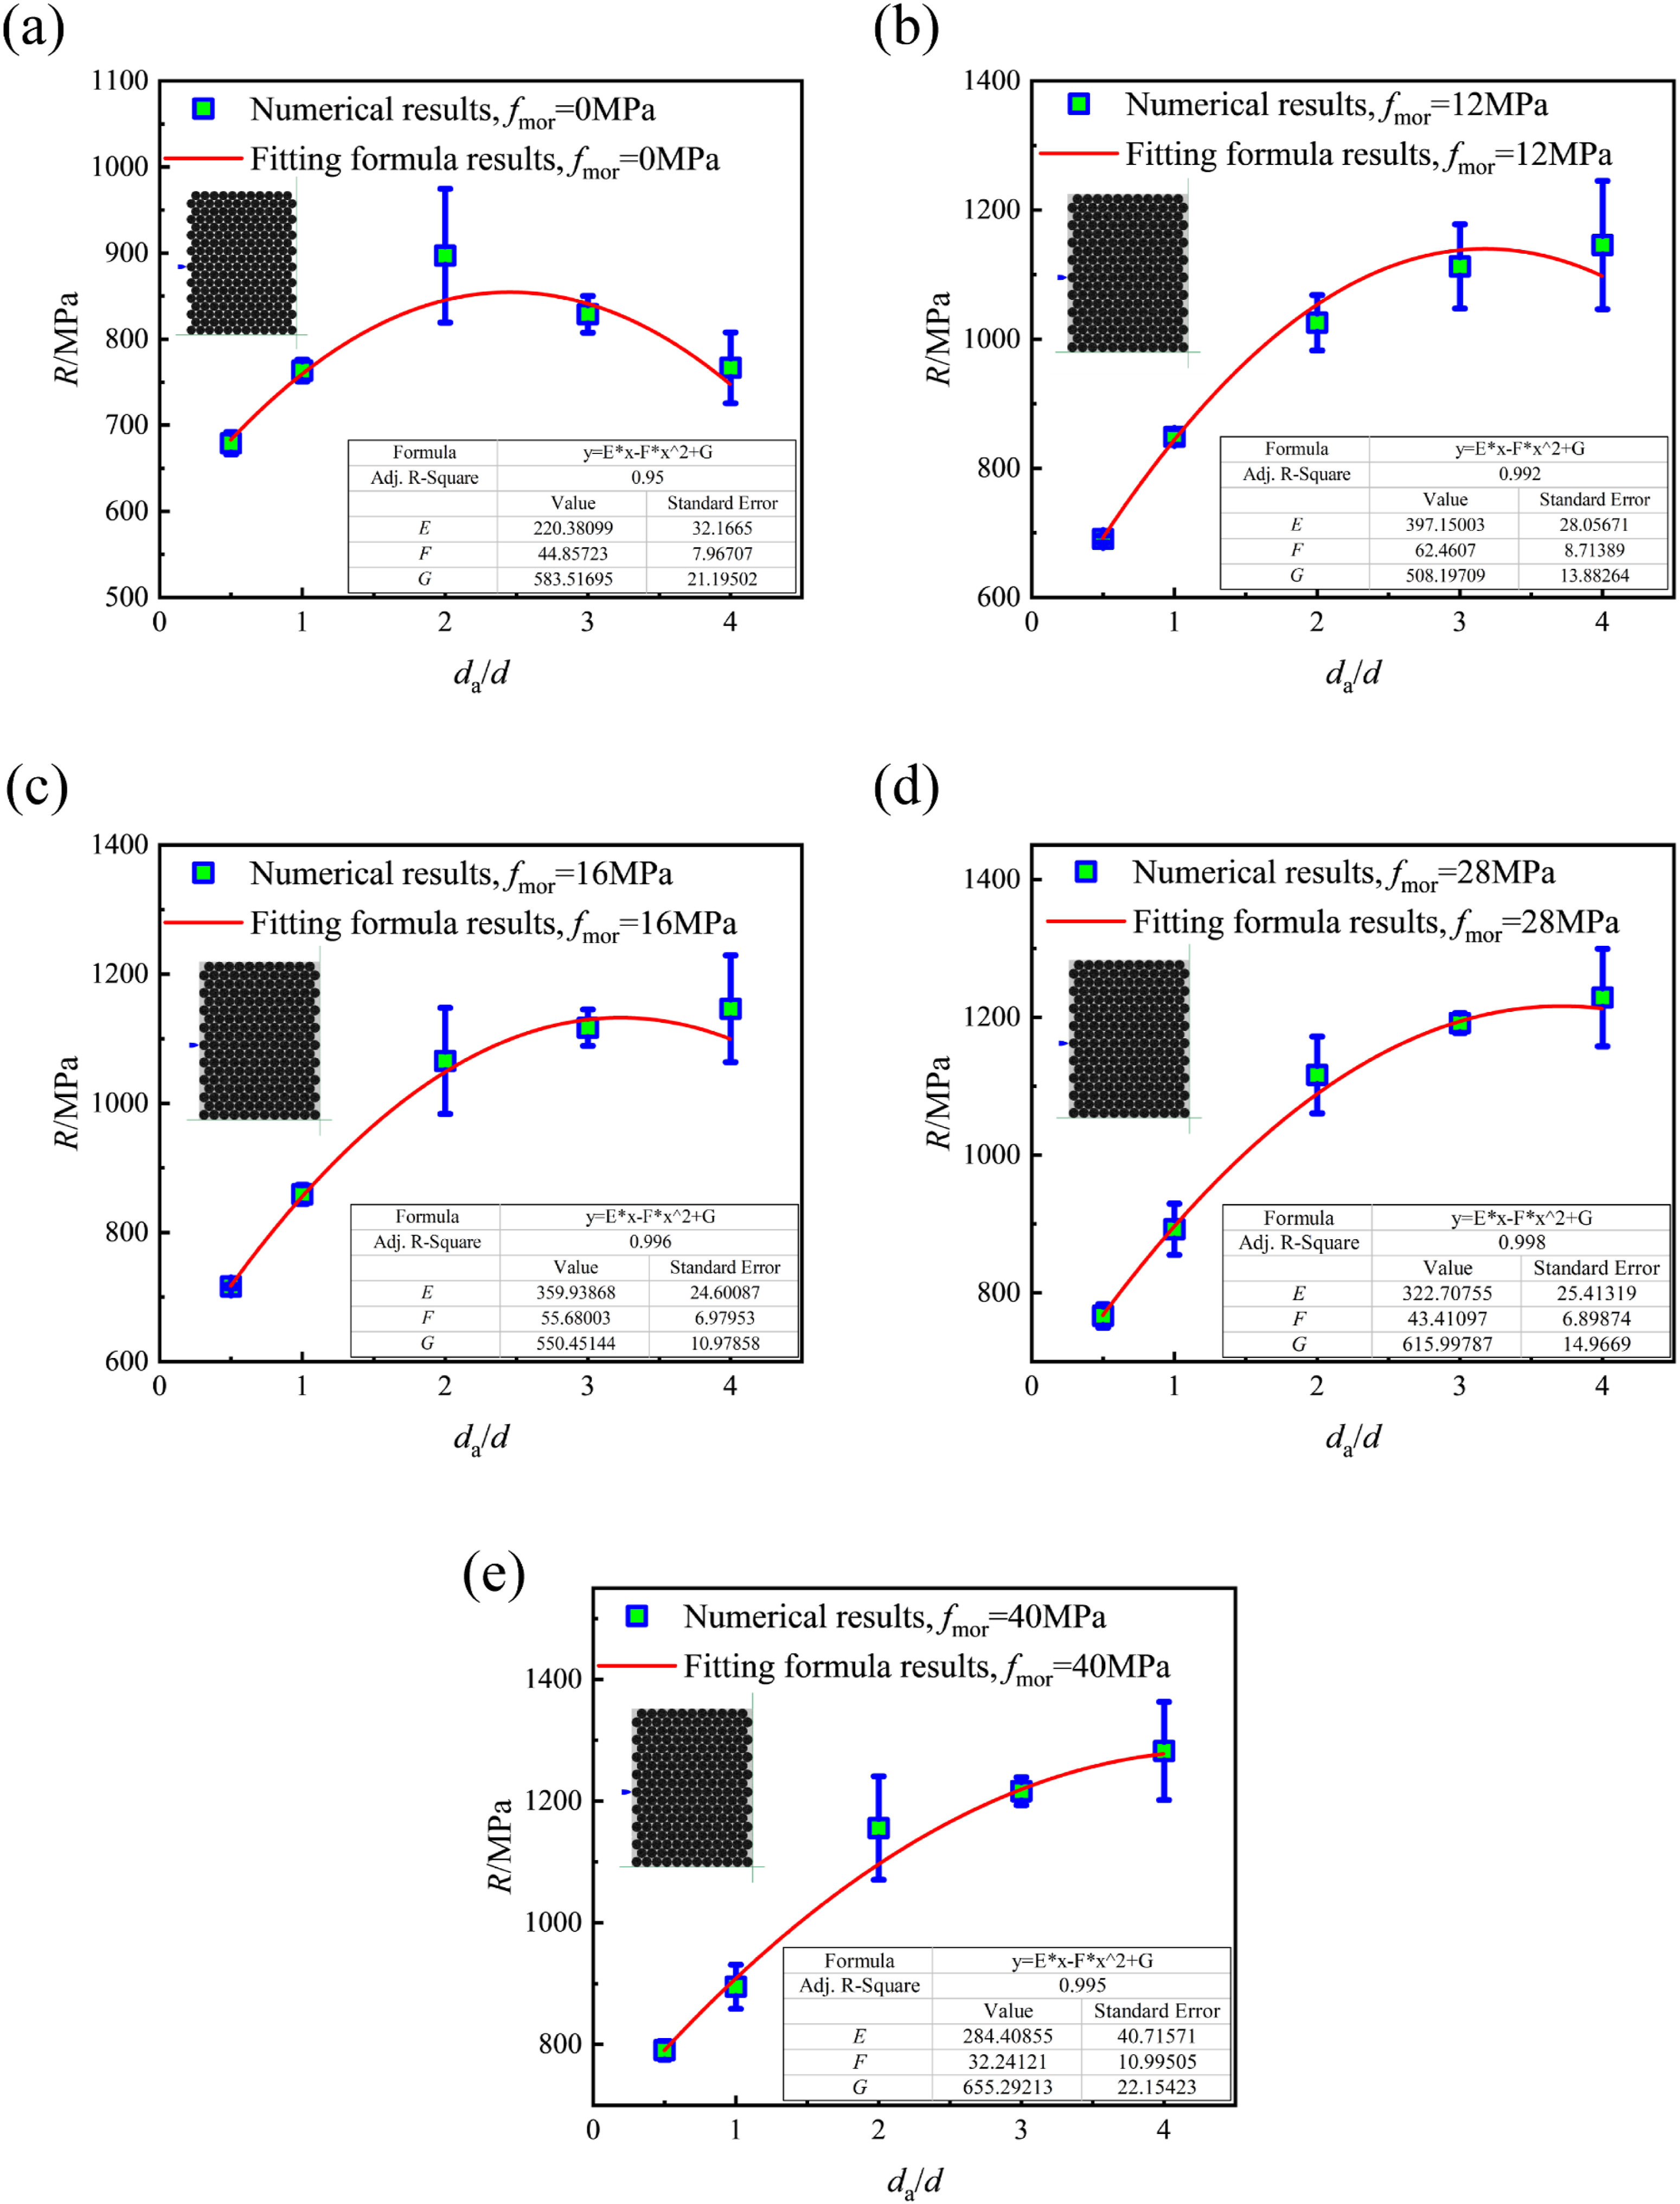
Figure 13(a) reveals a key finding for unmortared block stone structures (fmor = 0 MPa): the penetration resistance peaks at a da/d ratio of approximately 2.5, which corresponds to roughly one-tenth of the target thickness. Beyond this optimal size, the stability of the interlocking aggregate skeleton decreases, and the interlocking effect weakens, leading to a reduction in penetration resistance. Therefore, it is advised to employ mortar or other bonding materials to consolidate the block stones in order to obtain greater shielding effects when the target’s thickness is less than ten times the aggregate diameter. Bonding materials improve shielding effectiveness by filling voids between aggregates, increasing the density and structural integrity of the layer, and providing additional weak constraint mechanisms.
Coefficients in equation (16).
Development of a generalized penetration depth formula
The combined effects of the mortar strength fmor, the aggregate strength fagg, and the aggregate-to-projectile size ratio da/d on penetration resistance R are investigated in this section. Rather than acting independently, these three factors interact through complex coupling mechanisms that collectively determine the value of R. Consequently, a simple linear superposition of individual factors is insufficient to capture the mapping relationship between R and these parameters. It is expected that the quantitative correlations between R and various influencing factors are constructed using quadratic polynomial functions, which appropriately depict this intricate interplay, as follows:
For this study, equation (17) can be expressed as:
According to equation (14), the influence of mortar strength on R, denoted as x1, is expressed as:

Similarly, the influence forms of aggregate strength x2 and the size ratio x3 on R, derived from equations (15) and (16), are given by:

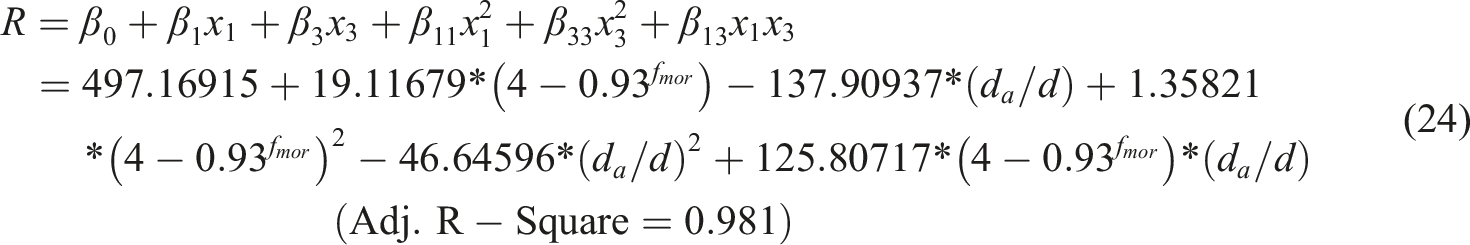
To assess the predictive capability of these coupled relationships, a quadratic polynomial function is employed to fit the correlations between R and the paired parameters (fmor, f
agg
) and (fmor, da/d). The results of fitting are displayed in Figures 14 and 15. All surface equations have Adj. R-Square values greater than 0.9, suggesting that the function can accurately depict the nonlinear coupling interactions between the variables. The following formulas are derived from the fitting: Relationships between R and mortar strength fmor and aggregate strength fagg. Relationships between R and mortar strength fmor and ratio of aggregate size to projectile diameter da/d.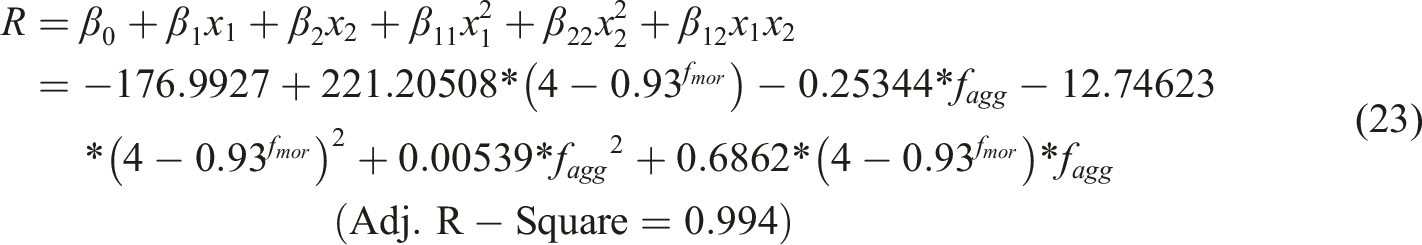
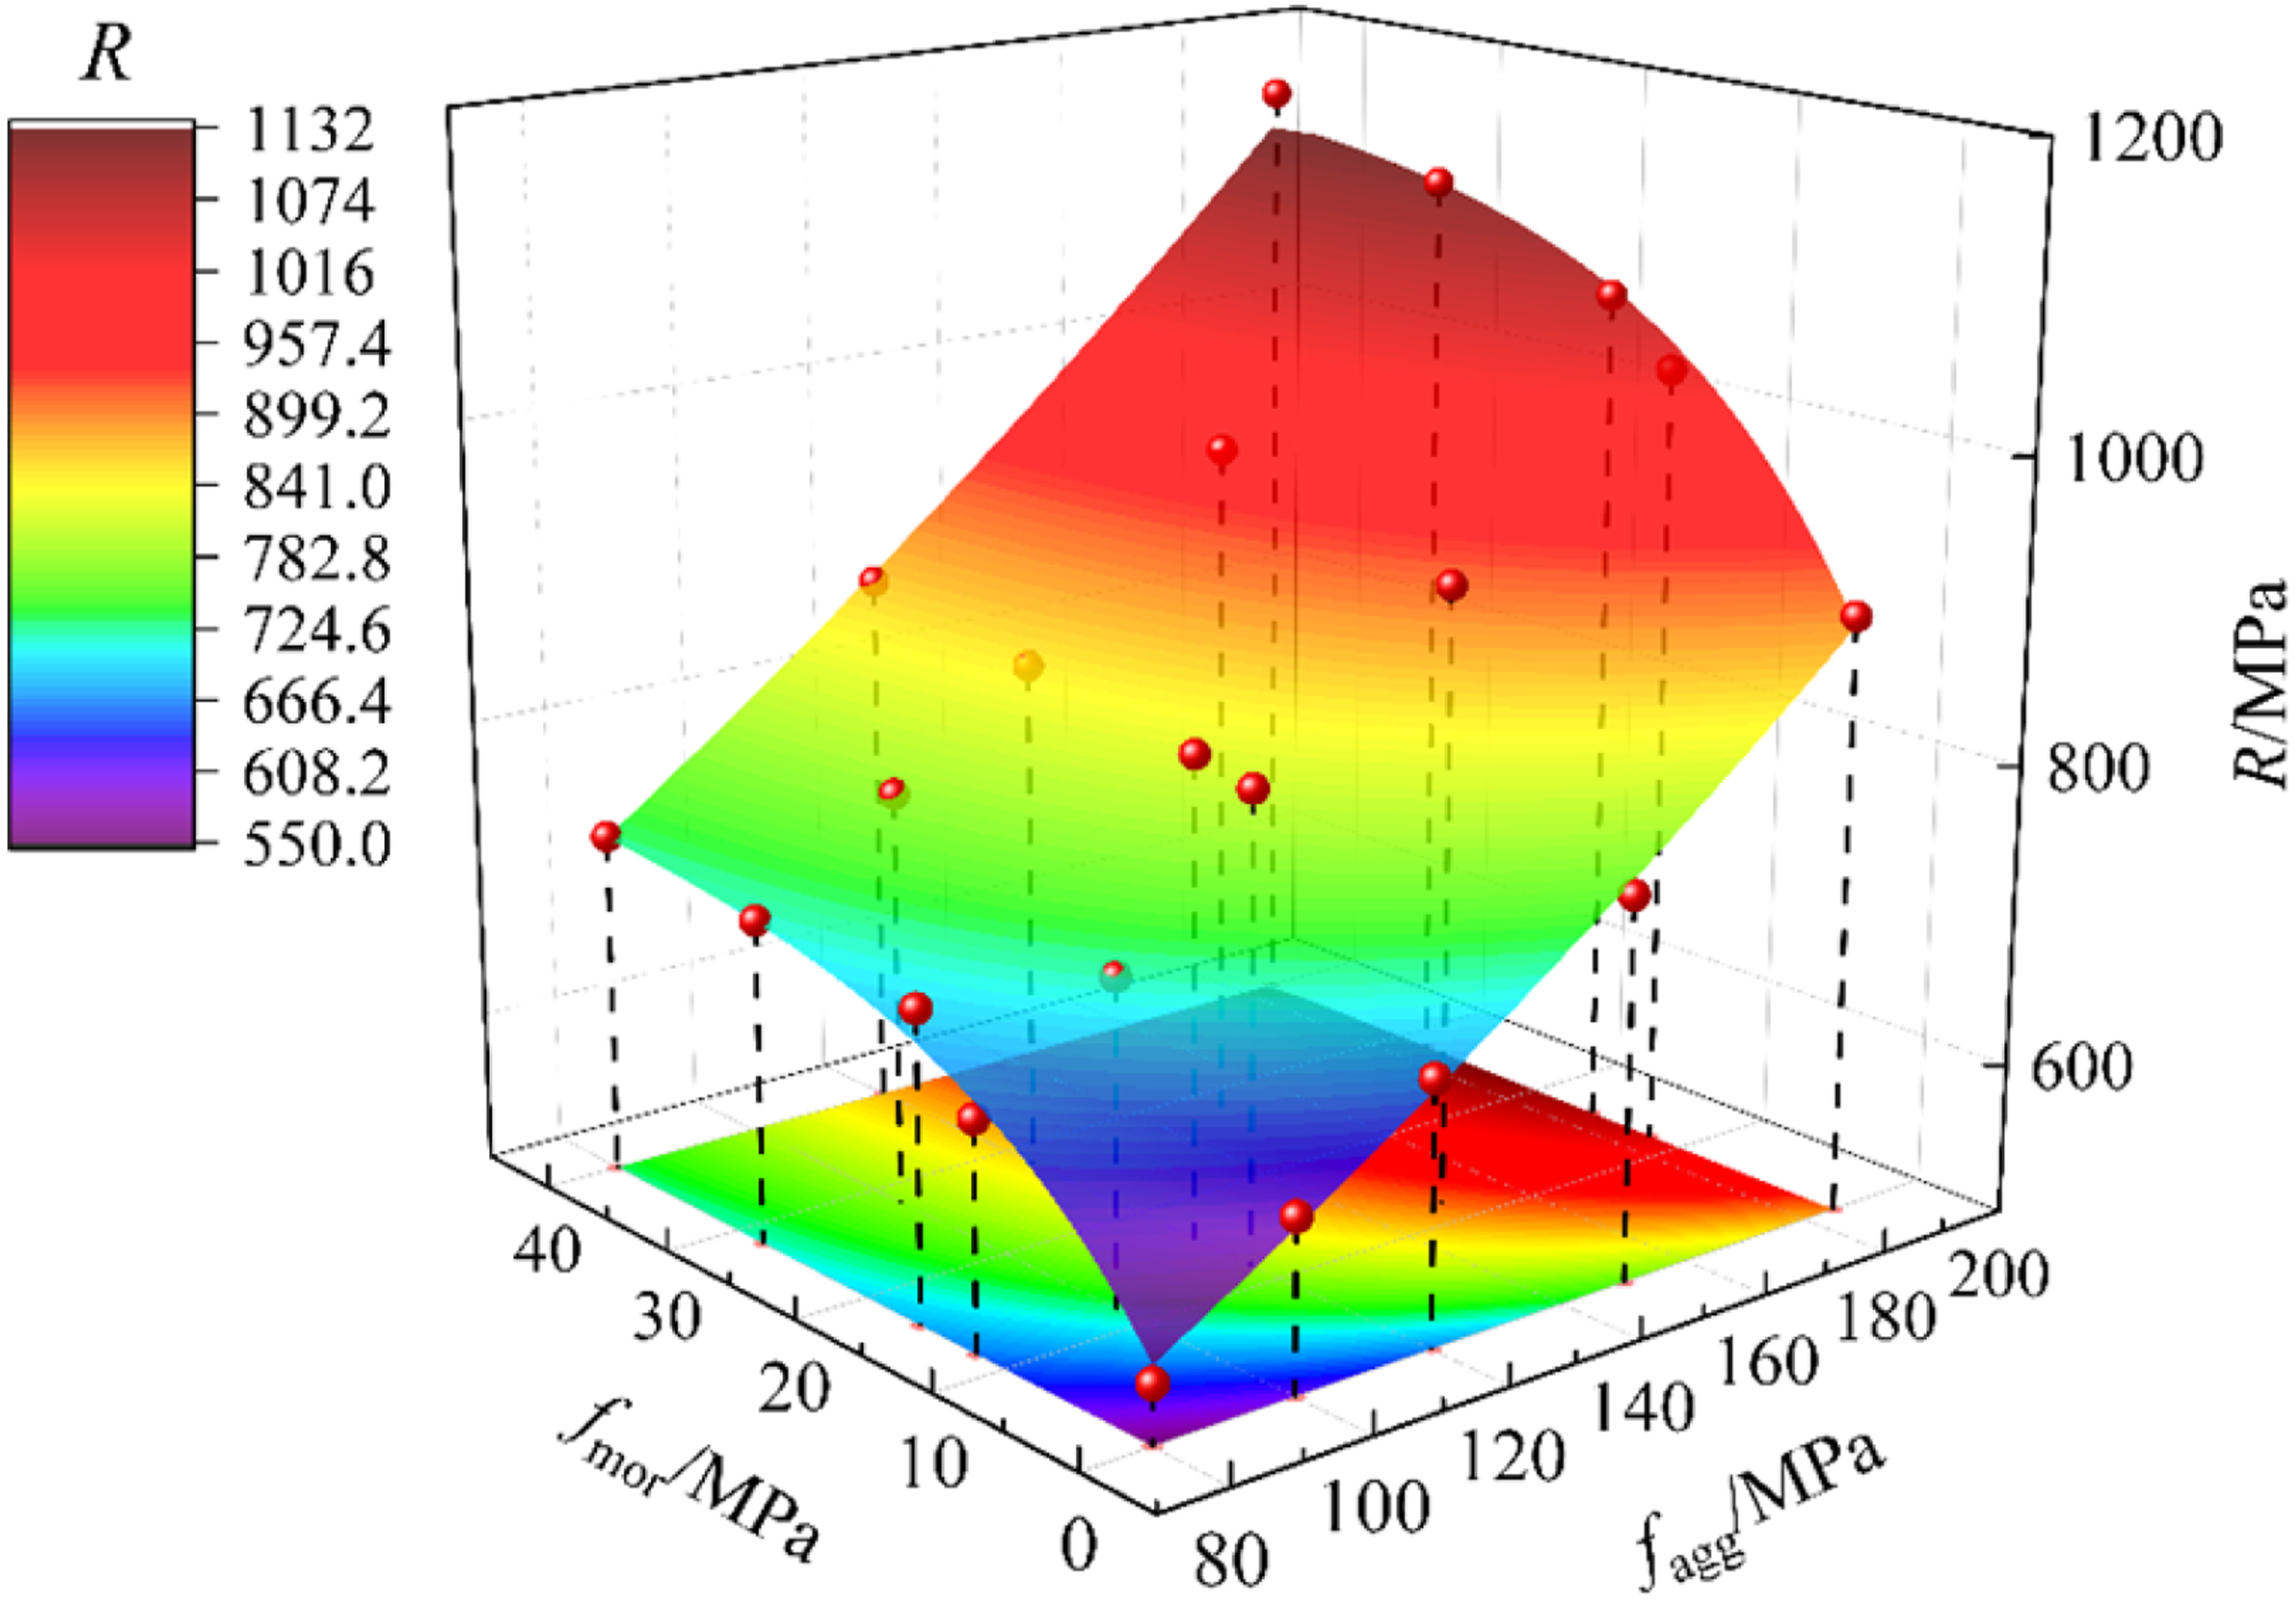
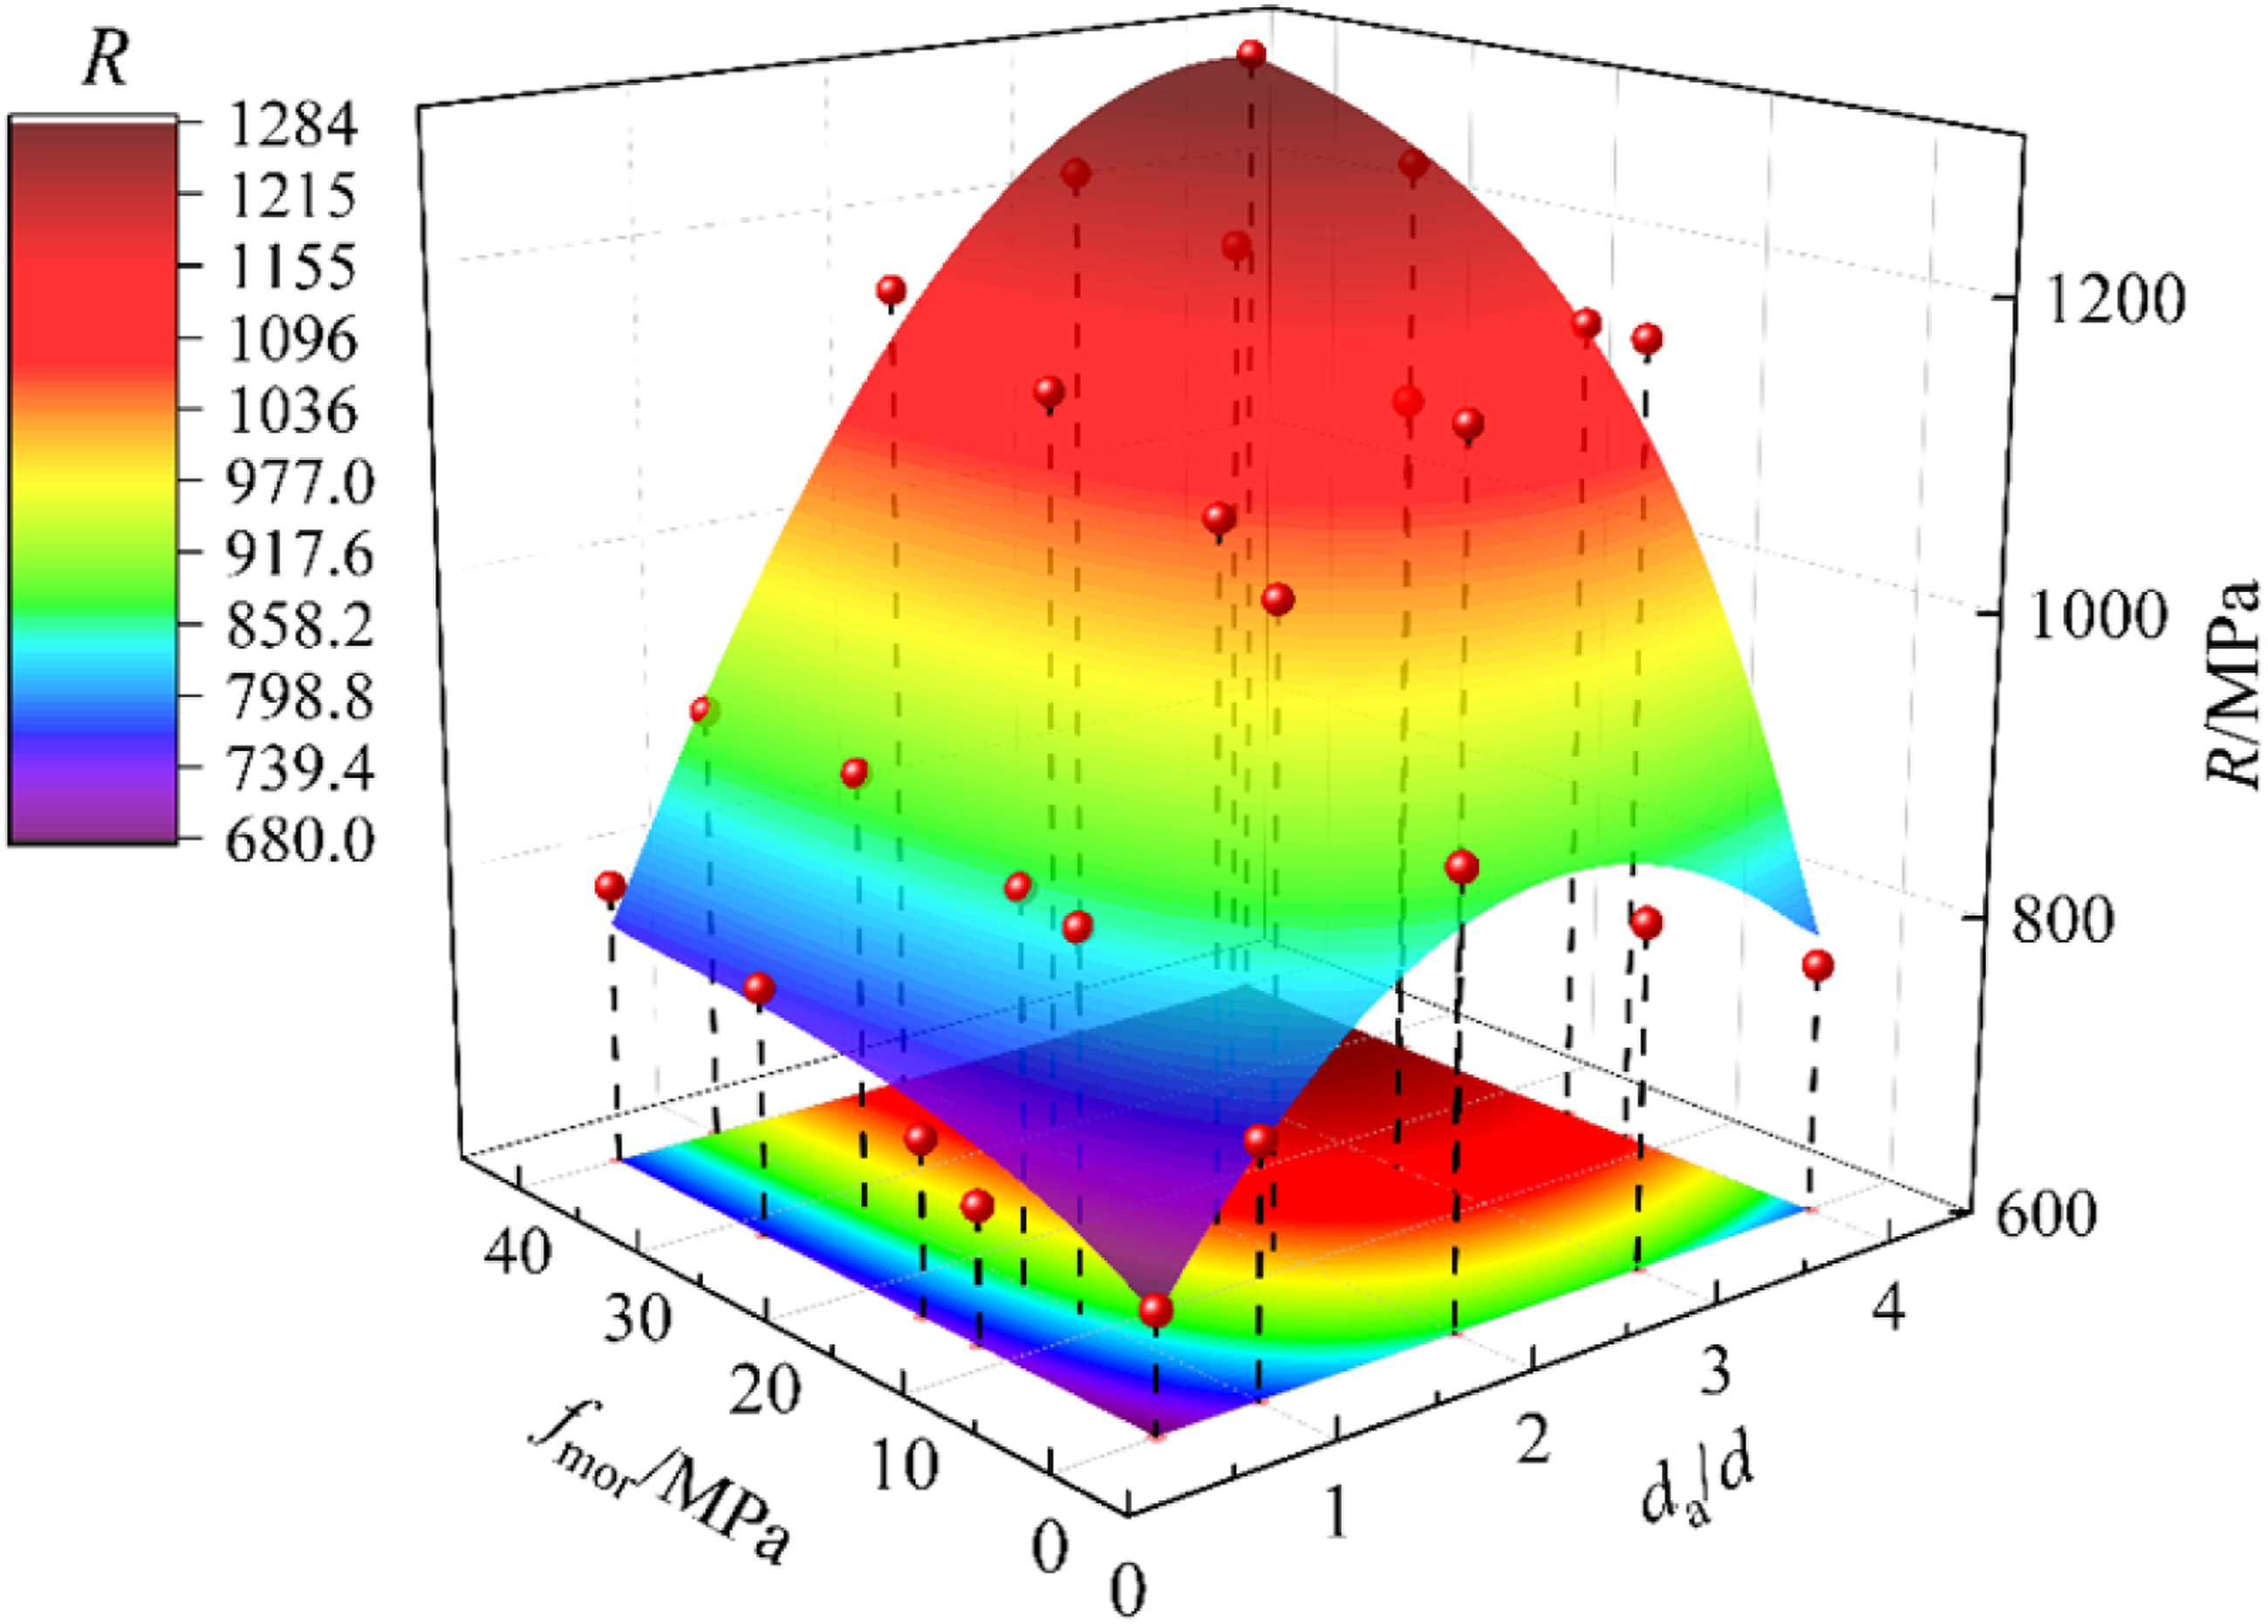
The penetration resistance R of the concrete target is found to increase monotonically with the increase in the mortar strength, the aggregate strength, and the ratio of aggregate size to projectile diameter, as illustrated in Figures 14 and 15, with the exception of the unmortared block stone structure target (fmor = 0 MPa). Additionally, it is observed that f
agg
and da/d have far stronger enhancing effects on R than fmor does. To quantitatively assess the sensitivity of these three parameters to R, the referenced parameter for each variable is taken as fmor = 12 MPa, fagg = 80 MPa, and da/d = 0.5, respectively. The parameters under discussion are 12 MPa ≤fmor≤ 40 MPa, 80 MPa ≤ fagg ≤ 185 MPa, and 0.5 ≤da/d ≤ 4. As seen in Figure 16, the amplifications of R can be computed as Ramp = R/Rref based on the numerical results in Chapter 4, where Rref is the concrete penetration resistance that corresponds to the referenced parameter of the variable being discussed (Zhang et al., 2020). Comparisons on the Ramp of concrete with different influencing parameters.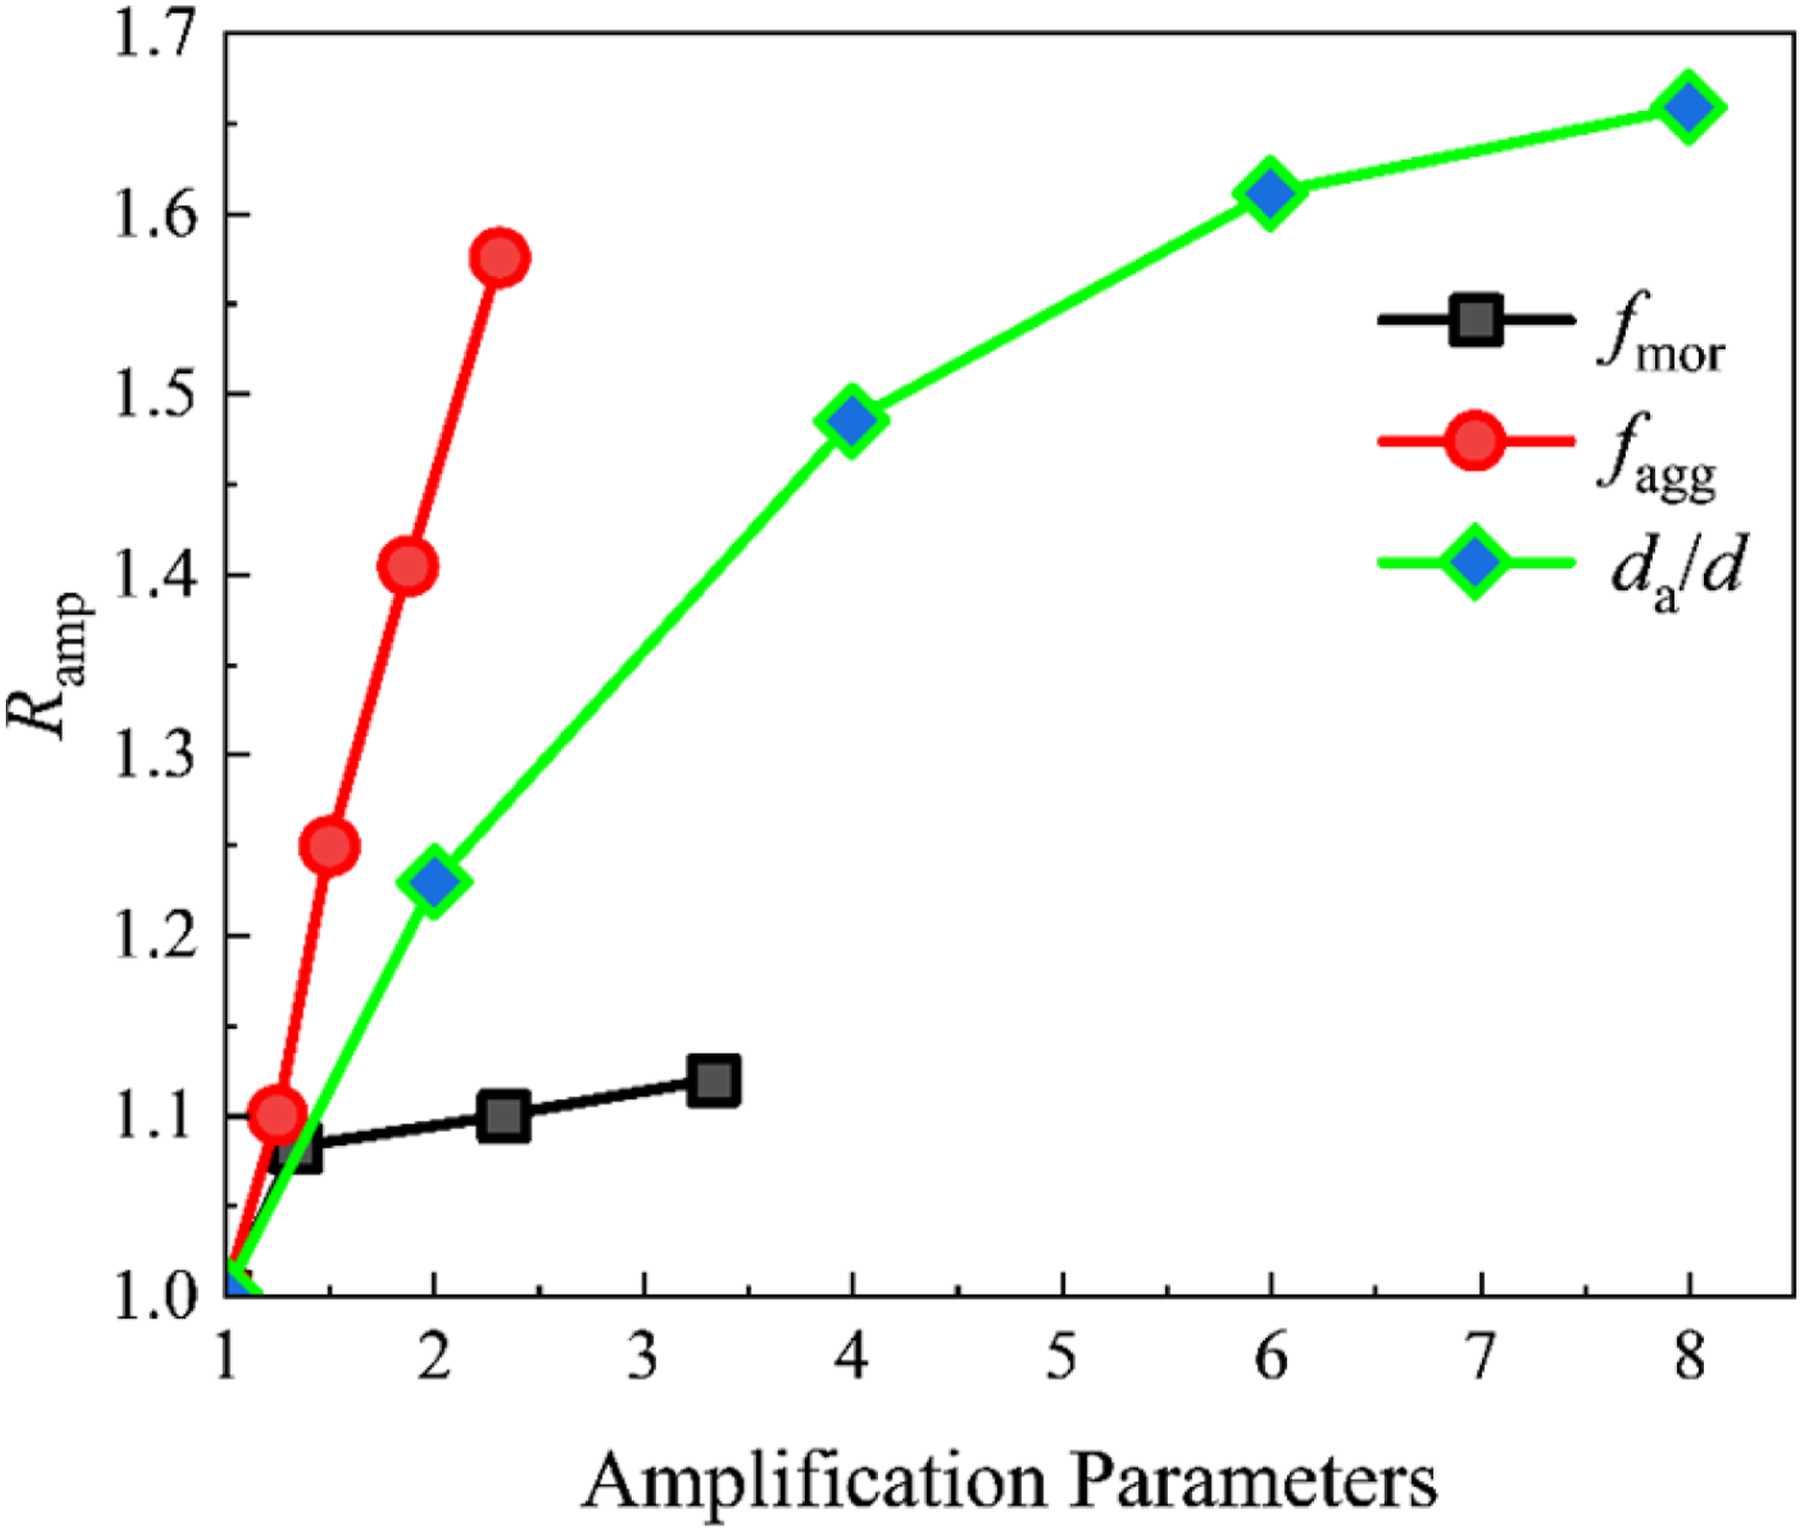
It can be seen from Figure 16 that R enhances with the increase of fmor, fagg, and da/d. fagg is the most sensitive factor on R, whereas fmor has the least significant sensitivity to R among the three considered variables. This conclusion aligns with the findings of the investigation shown in Figures 11 and 12. The findings, however, contradict the finding of Zhang et al. (2020) that “da/d is the least sensitive to R.” This discrepancy is explained by variations in the research participants and ranges of parameters: Zhang et al.’s study concentrated on regular concrete with aggregate volume fractions between 30% and 75%, while the concrete targets in this study are rockfill masonry with aggregate volume fractions exceeding 80%, where the mortar volume fraction is substantially lower than that of regular concrete. The significant increase in aggregate volume percentage is thought to have caused aggregate properties (such as aggregate strength and ratio of aggregate size to projectile diameter) to have a more pronounced impact on R. Additionally, its enhancement in R is exceeded by that of fagg and fmor when da/d is increased to more than six times the reference value. This is because, as aggregate particle size grows and approaches the target size, the target gradually transforms from a concrete composite material to a rock medium, which is thought to result in a noticeable increase in penetration resistance R.
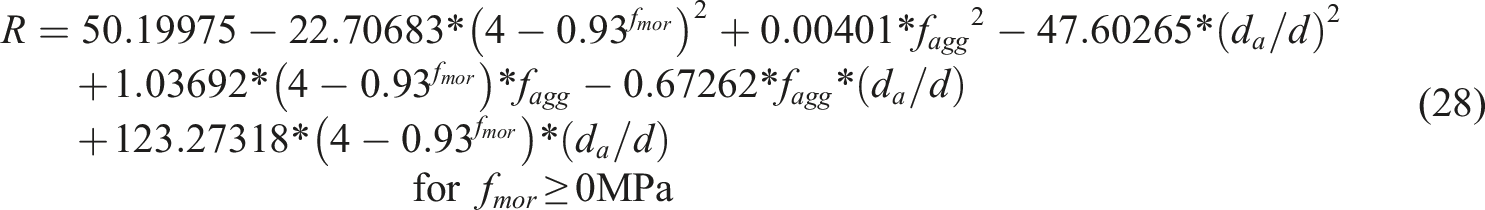
The following is the prediction formula for R based on the verified influence factor: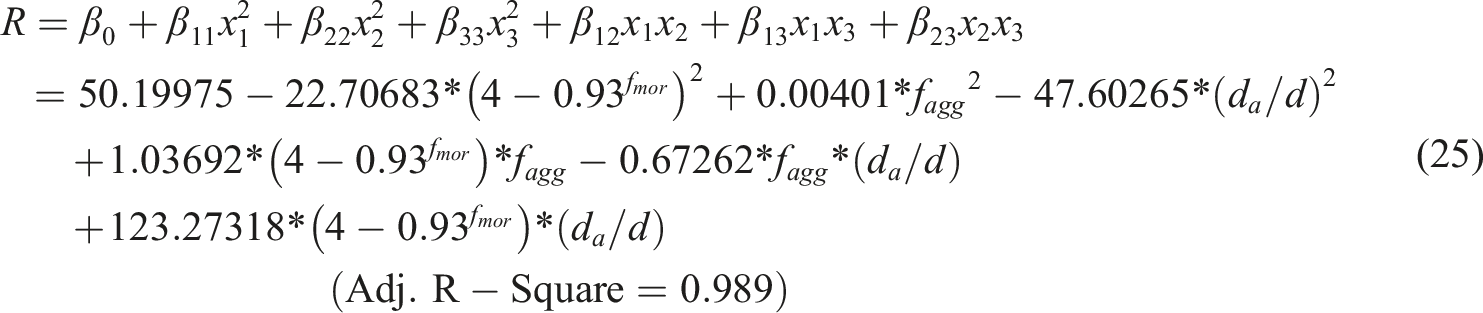
Nonlinear coupling properties among variables are efficiently captured by the formula that eliminates linear terms

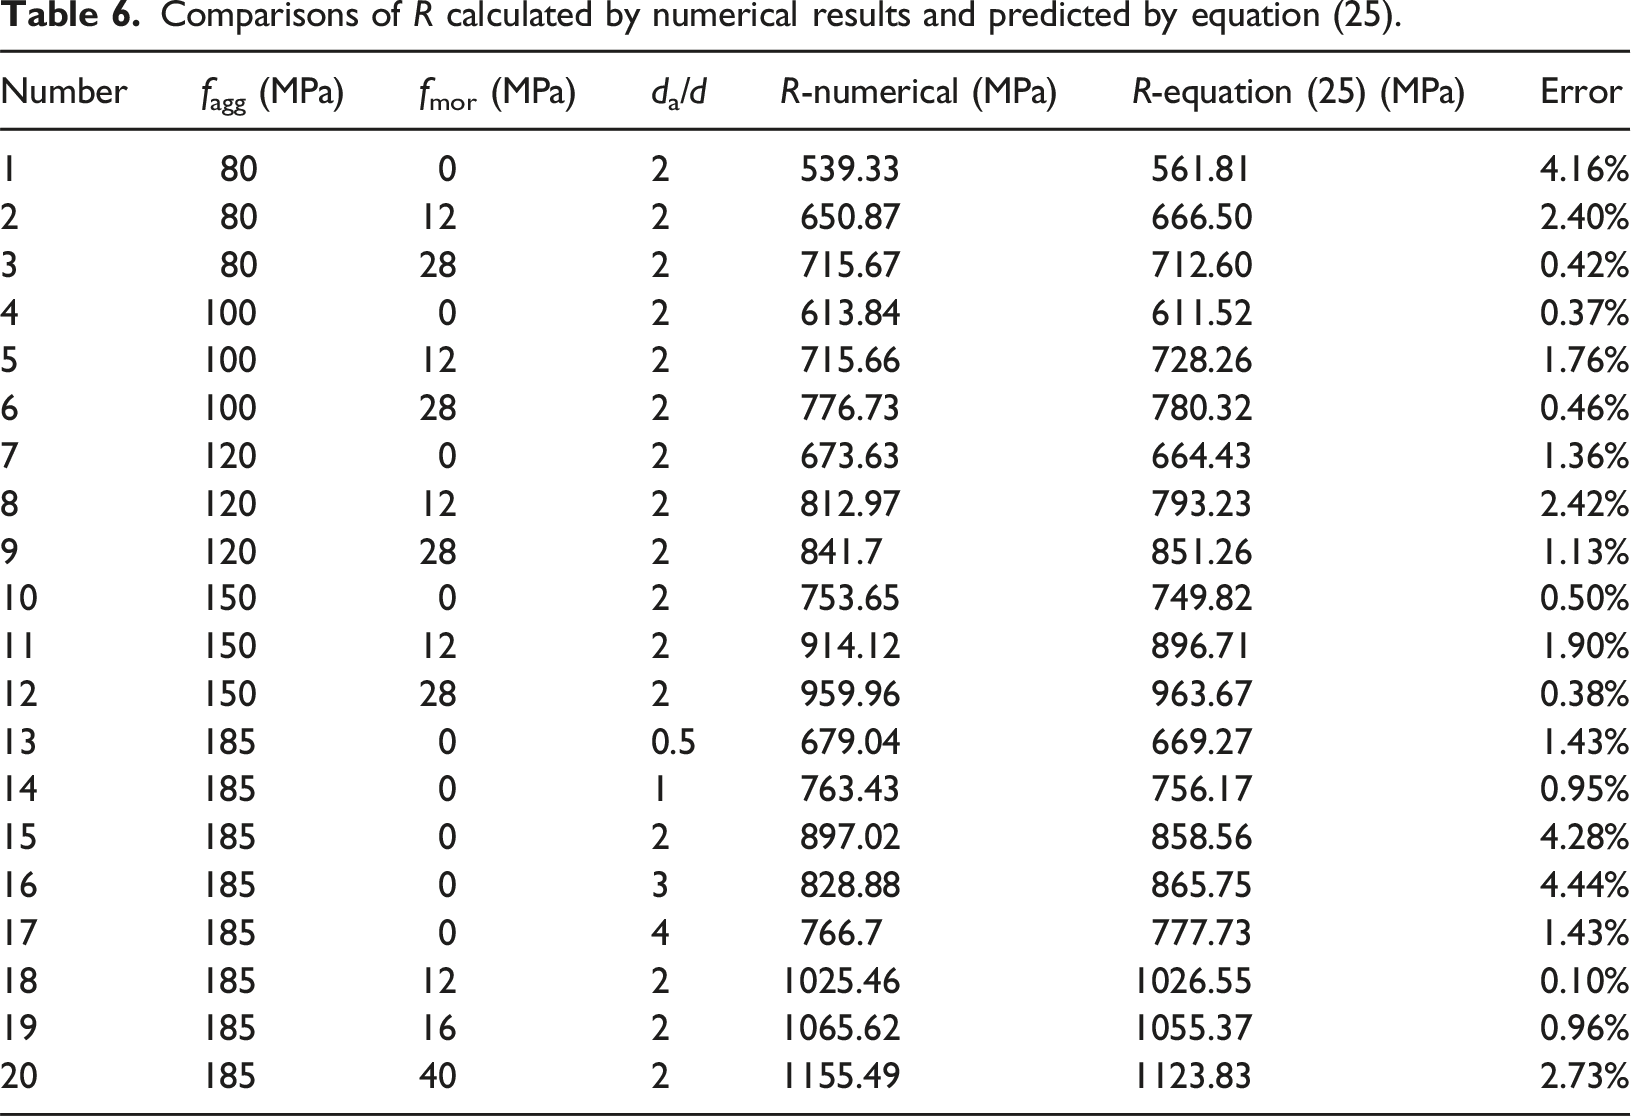
Comparisons of R calculated by numerical results and predicted by equation (25).
Conclusion
This study investigates the penetration resistance of both mortared block stone concrete and unmortared block stone structures. The discrete element meso-scale approach is used to capture the distinct discontinuous nature of block stone assemblies. The effects of mortar strength fmor, aggregate strength fagg, and aggregate-to-projectile size ratio da/d on the target penetration resistance R is systematically analyzed. The main findings of this research are summarized as follows. (1) A three-phase meso-scale concrete model, comprising aggregate, mortar, and ITZ, is established using the discrete element method. The model is validated by comparing the predicted penetration depths of rigid projectiles into block stone concrete targets with experimental data, confirming its accuracy in simulating penetration resistance. (2) Three formulas are derived to describe the relationships between R and three variables (fmor, fagg, and da/d). The R of block stone concrete increases with increasing fmor, fagg, and da/d. Among these factors, fagg exhibits the highest sensitivity to R, while fmor demonstrates the least influence. (3) For unmortared block stone structures, the penetration resistance R reaches its maximum when the aggregate size is approximately one-tenth of the target thickness. When the target thickness is less than ten times the aggregate diameter, it is recommended to employ mortar or other binding materials to consolidate the block stones, thereby enhancing blast and impact resistance. (4) Semi-empirical formulas incorporating the effects of three variables (fmor, fagg, and da/d) on R are proposed to predict the penetration depth of both mortared block stone concrete and unmortared block stone structures. The formula demonstrates high agreement with numerical results, with prediction errors within 5%, providing a reliable and generalized tool for the design and assessment of protective structures.
The real shape and multi-directional stress propagation properties of block stones in 3D space cannot be adequately reproduced by the 2D discrete element model used in this work due to planar simplification assumptions. Future work will develop a 3D meso-scale model incorporating actual spatial distributions and irregular block geometries to study rotation, collision, and fragmentation mechanisms during penetration, further validating and refining the proposed predictive formula.
Footnotes
Author contributions
Yuting Luo: Conceptualization, Data curation, Investigation, Methodology, Software, Writing–original draft. Tingting Zhao: Conceptualization, Funding acquisition, Methodology, Resources, Validation, Writing–review & editing. Zhongyuan Li: Investigation, Writing–review & editing. Jinyuan Huang: Validation, Visualization, Writing–review & editing. Zhiyong Wang: Funding acquisition, Supervision, Writing –review & editing.
Funding
The authors disclosed receipt of the following financial support for the research, authorship, and/or publication of this article: This work is supported by the National Natural Science Foundation of China (12102294, 12202303, 12272257), the Shanxi Scholarship Council of China (2022-067), and the Zhejiang Engineering Research Center of Intelligent Urban Infrastructure (IUI2023-YB-04), the Natural Science Foundation of Shanxi Province (202503021211003).
Declaration of conflicting interests
The authors declared no potential conflicts of interest with respect to the research, authorship, and/or publication of this article.