Terminal ballistics models are typically calibrated with data from projectile impacts into single-material-single-layer (monolithic) targets. Such models fail to consider the complexities of layered and spaced armor configurations, which are commonplace in force-protection applications. Approaches leveraging existing monolithic terminal ballistic models have been developed to approximate such configurations, estimating overall response by superimposing the individual layer responses. A Monte Carlo (MC) superposition method is proposed for modeling the () of A36 steel layered and spaced armor configurations against fragment-simulating projectiles (FSPs). Its performance was examined relative to four existing superposition methods from literature, using experimental data. Each superposition methodology was applied on two underlying terminal ballistics models for the layers, demonstrating their ability to leverage existing monolithic terminal ballistic models. The proposed MC superposition methodology consistently yielded the lowest error regardless of the underlying terminal ballistics model.
Terminal ballistics research is concerned with interactions between projectiles and targets, which are inherently complex, multivariate, and stochastic in nature since these interactions depend on projectile and target geometries, material properties, and impact conditions (Aptukov, 1990; Backman and Goldsmith, 1978; Ben-Dor et al., 2005; Ben-Dor et al., 2019; Wilkins, 1978). Target and projectile interactions with stop/perforation or pass/fail results are a quantal response problem (ARL, 2012; ARL, 2014; DARCOM, 1983), where the transition between projectile partial penetration (PP) to complete penetration (CP) does not occur at a discrete striking velocity. Instead, a zone of mixed results (ZMR) is frequently observed, where repeated tests at constant velocity levels result in a ratio of CP to PP outcomes, with the likelihood of CPs increasing with the velocity level. Because of this, ballistic perforation characterization is often based on response percentiles, with 50% being the most common.
The velocity is a stochastic parameter in terminal ballistics representing the speed in the ZMR at which the probability of perforation is 50% for a specific projectile-target pair. The enables quantitative benchmarking and comparison of protection performances between different armors against a specific projectile, or vice versa (BRL, 1992; Cunniff, 2014). From a kinetic energy balance standpoint, the is an indicator of energy threshold for target defeat. The experimental procedure for obtaining the is specified by the Department of Defense (DoD) MIL-STD-662F testing standard (DoD, 1997). MIL-STD-622F is the result of data reduction techniques and many decades of ballistic research since WWII and assumes a normal distribution of critical velocities. Other methodologies for calculation exist and require varying numbers of shots (D&PS, 1954; D&PS, 1957). Among them is the method of building probability curves based on the frequency of CPs at various velocity intervals (Delsasso et al., 1941; White, 1946) using 150 or more shots (D&PS, 1954), which makes it experimentally expensive and uncommon.
The main projectiles of interest in characterization are typically small arms ammunition and fragment-simulating projectiles (FSPs). Primary fragments emanating from rockets, artillery, and mortar (RAM) rounds pose a significant threat in military and force protection applications. These fragmenting munitions use high explosive detonations to break up and accelerate warhead casing ejecta or pre-formed fragments. RAM warheads produce fragments with varying materials, geometries, masses, and velocities, all of which affect their penetration ability (DoD, 1990). Full-scale arena tests for warhead fragmentation are costly, and acquiring warheads or manufacturing surrogates can be prohibitive. To address this, FSPs were designed to replicate the terminal ballistic effects of primary fragments with consistency in a ballistic laboratory setting (ATEC, 1983). FSPs come in standard discrete masses and diameters, manufactured in accordance with MIL-DTL-46593B (DoD, 2006).
Structural steels are a common material used in protective structures and retrofits (DoD, 2008a; DoD, 2008b; DoD, 2008c; FEMA, 2006; FEMA, 2011). Several models have been developed over time to predict terminal ballistic effects of primary fragments on mild steel targets (Ben-Dor et al., 2019). Common model types used in weapon effects research include empirical, analytical, and high-fidelity numerical models (Reed et al., 2002). Development of terminal ballistic models commonly relies exclusively on terminal ballistic data for single-material-single-layer (monolithic) targets, where both the projectile and the target are in pristine, undamaged conditions. This approach captures the baseline response of projectile-target pairs, isolates the effects of the main driving variables, and diminishes error sources. However, due to the weight of steel panels, they are often stacked to achieve a layered armor with the desired thickness while maintaining practicality during transport and installation. In protective applications, layered and spaced armor configurations are commonplace and add complexities that are not captured in monolithic target tests and models. Layered armors consist of one or more layers of materials in contact with each other. Spaced armors are essentially layered armors that contain a separation, i.e., an air gap, between two or more layers. These types of armor configurations can occur by design when the goal is to leverage and combine different material properties and induce behaviors that disrupt projectile penetration effectiveness. They can also occur by coincidence due to the projectile’s trajectory and obstacles in its path.
A substantial body of research has been published on the layering and spacing of armor materials. Ben-Dor et al. (2019) provide a comprehensive review of this work and the current state of the art. Due to contradictory results, a consensus on the effects on armor ballistic properties has not been established (Ben-Dor et al., 2006). The effects of spacing, layering, and the order of layers are ultimately highly dependent on the target material, projectile material and geometry, and impact conditions (Ben-Dor et al., 2019). Understanding the contributions of these variables yields improved terminal ballistic models. Since typical monolithic terminal ballistic models cannot account for the effects of layered and spaced armor configurations on their own, a common practice for estimating terminal ballistic effects on multi-material layered and spaced armors is to superpose the individual layer effects calculated by the monolithic models. Such approaches usually assume (1) the projectile interacts with one layer at a time, (2) target layers do not interact with one another, and (3) pristine projectile impacts at each layer, meaning there is no projectile mass loss nor projectile deformation when the projectile impacts the next layer. Several methods for performing this analytical superposition are available in the literature and rely on the law of conservation of energy. Ben-Dor et al. (2019), Kasano and Abe (1997), Recht and Ipson (1963), and Rosenberg and Dekel (2016) describe a root-sum-squared (RSS) layer superposition methods for non-plugging, spherical-nosed, and blunt-nosed projectiles. The method recommended in DoD design guidance in both the UFC 3-340-02 (DoD, 2008a) and UFC 4-023-07 (DoD, 2008c) is a successive calculation of residual velocities for each layer in the configuration, using the previous layer’s exit conditions as the impact conditions for the next, and solving for the highest first-layer striking velocity that yields a last-layer residual velocity of zero.
The Monte Carlo (MC) method is a computational technique that is often a cost-effective alternative to expensive or impractical experimental procedures. Since the 1940s, MC simulations have been used to analyze the probabilistic response of complex systems (Metropolis and Ulam, 1949). An advantage of the MC method is its ability to represent these systems using deterministic models, introducing variance by means of random sampling of input variables through numerous trial repetitions to simulate the effects on overall system behavior. Johnson et al. (2014) leveraged the MC method in the field of ballistics to assess the uncertainty in resulting from different sequential sensitivity testing methods, estimators, and stopping criteria, and determine their efficiency and accuracy. Riley et al. (2012) used MC simulations to assess the impact of starting velocity, total number of shots, and armor performance on the uncertainty of performance estimates. Davis et al. (2021) used MC simulations to evaluate the perforation probability of a single impact by a small-caliber ammunition against live-fire shoot house containment systems. The use of MC simulations in these studies demonstrates the applicability of the method to explore and characterize complex terminal ballistic probabilistic behaviors.
This paper presents an enhanced layer superposition method to estimate the of spaced steel armor configurations against FSPs. The method leverages MC simulations, using deterministic monolithic terminal ballistic models and probability curve estimation from CP frequencies in the ZMR. The objectives of this research were to (1) evaluate the performance of the MC layer superposition methodology relative to other fast-running layer superposition methods from literature and (2) prove accurate solutions are determined for spaced armor configurations using existing monolithic terminal ballistic models.
Experimental setup and results
In this investigation, ASTM A36 mild steel is the target material. A36 is a low-carbon steel specified by the American Society for Testing and Materials (ASTM) Standard Specification A36/A36M standard carbon structural steel (ASTM, 2019). The United States Army Corps of Engineers Engineering Research Development Center (ERDC) Ballistics Facility conducted several test series investigating the for several spaced armor configurations during the 2012 to 2021 period. These experiments were conducted in accordance with MIL-STD-662F, and the values were calculated using the four-shot ballistic limit (2 PPs and 2 CPs within an 18 m/s span constraint). A 0.51 mm thick 2024 T3 aluminum witness panel was placed 152 mm behind and parallel to the target. The determination of PP or CP was based on perforation of the witness panel. This CP criterion provides a protection ballistic limit (V50PBL); however, the term will be used going forward. Residual mass data was not collected in any of the tests. The A36 layer plates were dimensioned 305 mm square. The steel plates were securely clamped to a metal frame capable of adjusting the spacing distance in between, as presented in Figure 1. The average hardness for the A36 plates was 83.1 on the Rockwell B hardness scale, corresponding to a Brinell hardness (BHN) of 159.
Target frame for spaced armor configurations. The plate on the left is held at a fixed location, while the location of the plate to the right is adjustable to create the desired air gap. The target frame is clamped to the table to prevent it from sliding upon ballistic impacts.
The FSP projectiles were manufactured in accordance with MIL-DTL-46593B. The FSPs were launched from rifled Mann barrels using a small-caliber gun system. The experiments were all performed at an impact obliquity angle of 0 deg. Four Oehler Model 57 infrared photoelectric velocity screens connected to two chronographs were placed downrange before the target to measure projectile striking velocity. The distance between screens was 762 mm. Two primary velocities were calculated, using the first and third screens and using the second and fourth screens. The average deceleration was calculated from and over the distance . The distance from the third screen to the target face varied with the configuration being tested, ranging from 1397 to 1954 mm. Jordan and Naito (2014) present a general schematic of this ballistic laboratory setup. The projectile striking velocity was calculated by linearly extrapolating the deceleration over using the following equation:
Two Phantom v710 high-speed cameras operating at a sample rate of 8300 fps were placed perpendicular to the projectile trajectory, one in front and the other behind the target. High-speed digital video cameras served as backup for striking velocity measurements and to determine striking yaw angle. Shots with a striking yaw angle exceeding 5 deg were discarded per MIL-STD-662F.
Table 1 presents the experimental matrix and specifies the FSP projectile diameter, the armor configuration tested, and the experimental V50. The notation used for armor configurations in this study denotes thicknesses of solid armor layers as numbers outside of parentheses, while numbers inside parentheses indicate the corresponding air gap distances separating those layers. The notation is arranged so it’s read in the same direction the projectile traveled. Note that cases 1, 10, 11, and 15 did not generate a value due to either system limitations or specific project goals. The inequality stated in these cases is the highest velocity shot without achieving CP, and the is expected to be equal or higher.
Two underlying monolithic terminal ballistic models, referred to here as the THOR and ERDC models, were used to evaluate the performances of the layer superposition methods discussed below. Two additional models from the DoD United Facilities Criteria (UFC) documents UFC 3-340-02 (DoD, 2008a) and UFC 4-023-07 (DoD, 2008c) were also studied but are not presented in this document due to their low accuracy in modeling experimental data for baseline A36 single-layer targets (Rios, 2021).
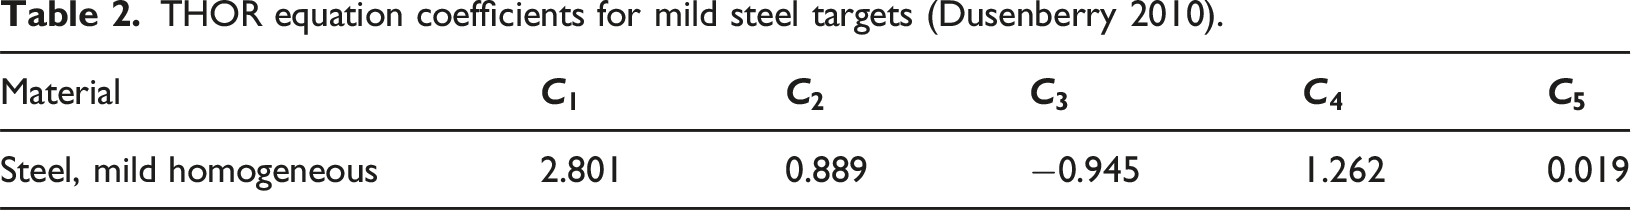
The THOR empirical equations developed by the Ballistics Research Laboratory (BRL) in the 1960s (Dusenberry, 2010) are perhaps the most popular empirical models for fragment terminal ballistics. These equations can model the resistance to perforation by mild steel fragments of several non-metallic (BRL, 1963) and metallic (BRL, 1961) materials of military relevance. Each material available in the THOR models is characterized by ten constants, through . Constants through are used to calculate residual fragment velocity, while through are for residual fragment mass. The current MIL-DTL-46593B requires FSPs to be manufactured from 4337H or 4340H steel with a Rockwell C scale hardness of 30 (DoD, 2006), making them less deformable and less prone to mass loss during penetration relative to the SAE 1020 mild steel used in the fragment simulators for the THOR experiments. For this reason, it was assumed that no significant mass loss was incurred by the FSPs for the configurations examined. This assumption is defense-conservative and is closer to what has been observed in previous A36 plate versus FSP experiments at ERDC. Table 2 presents the THOR coefficients for calculating fragment residual velocity for mild steel targets.
THOR equation coefficients for mild steel targets (Dusenberry 2010).
Material
Steel, mild homogeneous
2.801
0.889
−0.945
1.262
0.019
THOR’s fragment residual velocity equation is as follows:
where is the residual velocity in m/s, is the striking velocity in m/s, is the plate thickness in m, is the fragment presented area in m2, is the fragment mass in kg, and is the impact obliquity angle in deg.
Solving equation (2) for the striking velocity with the residual velocity equal to zero transforms the relationship to:
where is the deterministic limit velocity for perforation in m/s. In this study, this limit velocity is assumed to approximate the .
The U.S. Army ERDC developed empirical terminal ballistic models for and residual velocity from historical data of FSPs against A36 plates. These models use similarity methods (Baker et al., 1991; White, 1946) for scaling ballistic data of different FSP calibers, impact obliquity angles, and target thicknesses into a single curve for regression analysis.
The ERDC model is as follows:
where is the PBL in m/s, is the fragment diameter in m, is the plate thickness in m, is the fragment mass in kg, and is the projectile obliquity in deg.
The residual velocity model is:
where is the residual velocity in m/s, is the velocity in m/s, and is the striking velocity in m/s.
where for the ith configuration layer, is the residual velocity in m/s, is the striking velocity in m/s, and is the layer’s in m/s, and where the value of term depends upon the respective underlying assumptions discussed next.
This superposition method describes perforation by rigid, non-plugging projectiles, for which . The assumption means that perforation imposes a fixed kinetic-energy loss of , and for impact velocities above the threshold the projectile exits without additional mass loading, momentum sharing, or velocity attenuation by the target, which means no target material plug is produced and there is no projectile mass loss. Solving the energy balance for the overall armor yields the following expression:
where is the configuration in m/s, is the number of layers in the configuration, and is the for the ith configuration layer m/s.
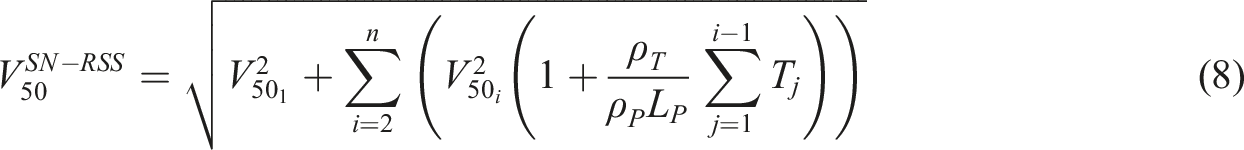
This method considers a spherical-nosed projectile that causes the formation of a target material plug upon layer perforation, where , where is the plug mass and is the layer index. The exponent results from the conservation of energy, where the plug mass is accelerated by the projectile and there is no additional dissipation beyond the energy loss associated with the threshold. The plug is assumed to have the same diameter as the projectile and to fuse with the projectile before impacting the next layer, and for the plug thickness is assumed to be the same as the plate thickness (Rosenberg and Dekel, 2016). The overall armor yields the following expression:
where , is the for the ith layer in m/s, is the total number of layers, and are the target and projectile densities, respectively, assumed to be 7850 kg/m3 for both the A36 and 4340 steels of interest in this work, is the projectile length in m, and is the thickness of the jth configuration layer (previous layer) in m.
This method considers a cylindrical blunt projectile that causes the formation of a target material plug upon layer perforation and energy loss due to plastic impact, where . The exponent change from to 1 results from a conservation of momentum instead of energy. The same plug diameter and fusing assumptions as the previous method hold. The plug thickness is assumed to be the same as the plate thickness. The overall armor yields the following expression:
where is the configuration in m/s, is the for the ith layer in m/s, is the total number of layers, and are the target and projectile densities previously detailed, is the projectile length in m, and is the thickness of the jth configuration layer (previous layer) in m.
Successive striking and residual velocity superposition (VS−VR)
The successive application of the residual velocity terminal ballistic equations is the recommended method in UFC 3-340-02 Section 5-49.3 (DoD, 2008a) and UFC 4-023-07 Section 5-3.4.2.1.2 (DoD, 2008c) for dealing with multiple plate penetration problems. In this method, the fragment striking velocity upon each intermediate layer is the residual velocity after perforation of the previous layer. This model makes two defense-conservative assumptions: (1) the fragment remains intact during the penetration with no mass loss, and (2) the fragment does not deviate from a straight-line path as it crosses layer interfaces. The maximum striking velocity resulting in zero residual velocity at the last layer yields perforation limit velocity. This method’s general steps are summarized by the following:
where is the residual velocity, represents the layer residual velocity terminal ballistics model, is the striking velocity, is the configuration layer number, and is the total configuration layer number.
Monte Carlo methodology
This study introduces an MC methodology to estimate the of spaced armor configurations. The method is built upon the successive VS−VR superposition and is enhanced by adding considerations for capturing projectile trajectory and impact orientation alterations and velocity decay due to drag in air gaps. These considerations replicate the effects of physical variations that occur during ballistic testing. This enhanced superposition is executed in MC simulations, where variability is introduced into key input variables in the underlying deterministic terminal ballistics models. The simulations generate a virtual quantal response from which the perforation likelihood can be estimated as a function of striking velocity.
Simulation setup
Because of the high dimensionality of the problem, subscript notation is used in this study for the simulation variables. The indices , , and denote velocity level, repetition number, and configuration layer number, respectively. Simulation setup requires defining the following values and conditions:
a. FSP: projectile mass and diameter
b. Armor configuration: number of layers ; , and their respective terminal ballistics models, thicknesses , and air gap distances .
c. Initial striking velocities: number of velocity levels , velocity levels to simulate , and number of repetitions per velocity .
d. Initial impact conditions: initial impact obliquity and yaw angles
e. MC details: MC variables with their respective probability distributions for sampling.
Scenarios in layered and spaced armor penetration
The simulation projectile striking and residual velocities and impact obliquity and yaw angles at the layer level are represented respectively by:
The projectile striking and residual velocities at the overall configuration level are represented by and , respectively. The selected FSP impacts the first layer at the overall configuration striking velocity . The overall configuration residual velocity is the residual velocity at the last layer in the configuration . If the projectile is stopped at any layer, then . Using this methodology, FSP penetration at any individual layer is assumed to fall within one of the following three scenarios. These scenarios are modular and can be successively superposed for each armor layer to approximate the overall terminal ballistic effects.
a. First layer impact ():
The projectile impacts the first layer of thickness at an initial striking velocity , initial projectile obliquity angle , and initial projectile yaw angle . The result is perforation at a residual velocity . Figure 2 shows a visualization of the first-layer impact scenario.
b. Air-gapped layer impact ():
First layer impact scenario for spaced and layered armor modeling. (1) first layer impact, (2) first layer perforation.
The projectile perforated the previous layer with a residual velocity . Upon exit, its trajectory is altered to a new obliquity angle and starts tumbling. The tumbling projectile travels across an effective air gap distance, experiencing velocity decay due to drag forces and decaying to the new striking velocity , which is lower than , and is calculated as follows:
where is the effective air gap distance after the previous layer in m, is the actual air gap thickness after the previous layer in m, is the new obliquity angle in radians, is the projectile drag coefficient, is the air density (assumed to be 1.23 kg/m3), and is the projectile mean presented area in m2. A value of 1.20 (U.S. Air Force, 1993) is used for calculations in this study.
In calculating the mean presented area for an FSP, its geometry is simplified to that of a right-circular cylinder (RCC) and calculated as follows:
where is the presented area in m2 as a function of yaw angle in radians, is the projectile diameter in m, and is the projectile length-to-diameter ratio equal to 1.17 for FSPs (ARL, 2008).
The mean presented area of a tumbling RCC is calculated from equation (14):
where is the mean presented area in m2, is the presented area in m2, and is projectile yaw in radians. Due to the symmetry of an RCC, the average presented area is obtained using yaw angles from 0° to 90°.
Finally, due to tumbling, the projectile impacts the current layer of thickness at a new yaw angle of and perforates the plate with a residual velocity . Figure 3 shows a visualization of the air-gapped layer impact scenario.
c. Contact layer impact ():
Air-gapped layer impact scenario for spaced and layered armor modeling. (1) exit from previous layer, (2) obliquity angle alteration, (3) velocity decay and yaw angle alteration, and (4) layer perforation.
In the case of layers in contact, the projectile impacts the layer of thickness at a striking velocity , projectile obliquity angle , and projectile yaw angle , resulting in perforation with a residual velocity . Figure 4 shows a visualization of the contact layer impact scenario.
Contact layer impact scenario for spaced and layered armor modeling. (1) exit from the previous layer and (2) contact layer perforation.
Terminal ballistic models with limited input variables
Not all terminal ballistic models directly consider all variables needed for the proposed methodology. To address this limitation, these variables are incorporated indirectly by transforming to other common model inputs, with the constraint that at a minimum the projectile diameter and the layer thickness must be among the original model input variables. The transformations are as follows:
a. Effective thickness (): The effective thickness can substitute the layer thickness variable to approximate the effect of the obliquity angle when not explicitly considered by the terminal ballistics model. This trigonometric transformation represents the increased layer material thickness penetrated by the projectile due to its obliquity and assumes no obliquity change during the layer penetration process:
where is the effective thickness in m, is the layer thickness in m, and is the projectile obliquity angle in deg.
b. Equivalent diameter (): The equivalent diameter transformation approximates the effect of the projectile yaw angle when neither the yaw angle nor the presented area is explicitly considered by the terminal ballistics model. The RCC-presented area as a function of yaw is calculated and transformed to an equivalent circle of the same area to solve for its diameter:
where is the equivalent diameter in m, and is the presented area in m2 calculated using equation (14).
Random variable sampling
This investigation focused on introducing variability to the obliquity and yaw angles. The angle of obliquity for is a parameter that is relatively easy to set in the ballistic laboratory and is assumed to be bounded by . The angle of yaw for exhibits more variability; per MIL-STD-662F, the maximum allowable yaw angle is ; anything exceeding this is considered an unfair hit and discarded from the calculation. In the “Air-gapped layer impact” scenario, the modified obliquity angle is assumed to be bounded by . In the “Air-gapped layer impact” scenario, the projectile is assumed to be tumbling at a random angular velocity. Due to symmetry, the final orientation upon impact with the successive layer can be anything from a normal impact (yaw angle of ) to a side-on impact (yaw angle of ). Since the exact probability distributions describing obliquities and yaws are unknown in this study, uniform distributions were used as uninformative priors. Table 3 presents the key variables that are randomly sampled in the MC simulations.
MC random variables and assumed sampling distributions.
Random variables
Probability distribution
Obliquity
Yaw
Estimating V50
The target configuration is tested virtually for the velocity levels in . Randomness is introduced by running repetitions per velocity level, where the key random variables are sampled from their predefined distributions in each repetition. The MC quantal response is obtained after simulations. A VS-VR analysis is performed for each respective layer , and layer results are superposed using the scenarios previously described. For every velocity level and repetition , the overall configuration’s striking and residual velocities, and , are recorded. Values in are converted to Boolean residual velocities based on whether the shot resulted in CP or PP. Negative residual velocities are not physically possible, so this conversion is as follows:
The variability introduced by the random sampling will produce a virtual ZMR. Like the experimental approach, the virtual ZMR bounds are determined from the minimum velocity that yielded a CP and the maximum velocity that yielded a PP:
All the striking velocities within the ZMR that resulted in CP are:
The median velocity in is the MC for the overall configuration ():
Results
convergence study
This study used a ranging from 1 to 3000 m/s at 1 m/s level increases (). A convergence study was performed to determine an appropriate . The study was performed using the case of a 12.7 mm FSP against a 6.35 (1016) 6.35 mm configuration. The underlying terminal ballistics model used was the ERDC model. Nine values for from 5 to 50,000 were examined. The stabilized around at a value of 1105 m/s. The value of was used for the rest of this study. Additionally, this value kept the runtime at less than 1 min per calculation, which is desirable for fast-running applications.
MC methodology performance
The four superposition methodologies were implemented with each of the two underlying terminal ballistics models to estimate the for the 16 experimental cases shown in Table 1. While values were estimated for cases 1, 10, 11, and 15, these values were not considered when quantifying the performance of the respective methodologies. Each superposition methodology’s performance was calculated for each underlying terminal ballistics model using as a metric the mean absolute percentage error (MAPE) of the estimated relative to . Tables 4 and 5 present the estimated , , and MAPE for each methodology using the THOR and ERDC models, respectively.
Results for methodologies applied with the THOR terminal ballistics model.
Layers terminal ballistics model: THOR
Case
FSP diameter [mm]
FSP mass [g]
Armor configuration [mm]
[m/s]
Armor configuration V50 [m/s] for respective layer superposition method
NP-RSS
SN-RSS
BN-RSS
VS−VR
MC
1
7.62
2.85
6.35 (1016) 6.35
≥1910
968
1127
1357
1378
1895
2
12.7
13.41
6.35 (0) 6.35
1153
550
606
677
783
846
3
12.7
13.41
6.35 (13) 6.35
1143
550
606
677
783
1065
4
12.7
13.41
6.35 (25) 6.35
1201
550
606
677
783
1066
5
12.7
13.41
6.35 (51) 6.35
1155
550
606
677
783
1066
6
12.7
13.41
6.35 (76) 6.35
1125
550
606
677
783
1066
7
12.7
13.41
6.35 (89) 6.35
1083
550
606
677
783
1066
8
12.7
13.41
6.35 (140) 6.35
1084
550
606
677
783
1067
9
12.7
13.41
6.35 (1016) 6.35
1109
550
606
677
783
1072
10
12.7
13.41
9.53 (89) 6.35
≥1636
683
751
850
956
1254
11
12.7
13.41
6.35 (89) 9.53
≥1645
683
775
891
957
1354
12
12.7
13.41
7.94 (76) 6.35
1379
615
677
763
870
1162
13
12.7
13.41
7.94 (89) 6.35
1288
615
677
763
870
1163
14
12.7
13.41
6.35 (89) 7.94
1415
615
689
783
871
1211
15
12.7
13.41
15.9 (76) 6.35
≥2197
974
1054
1202
1288
1616
16
20
53.78
6.35 (1016) 6.35
651
329
350
376
468
640
MAPE
52.06%
47.27%
41.08%
31.84%
8.81%
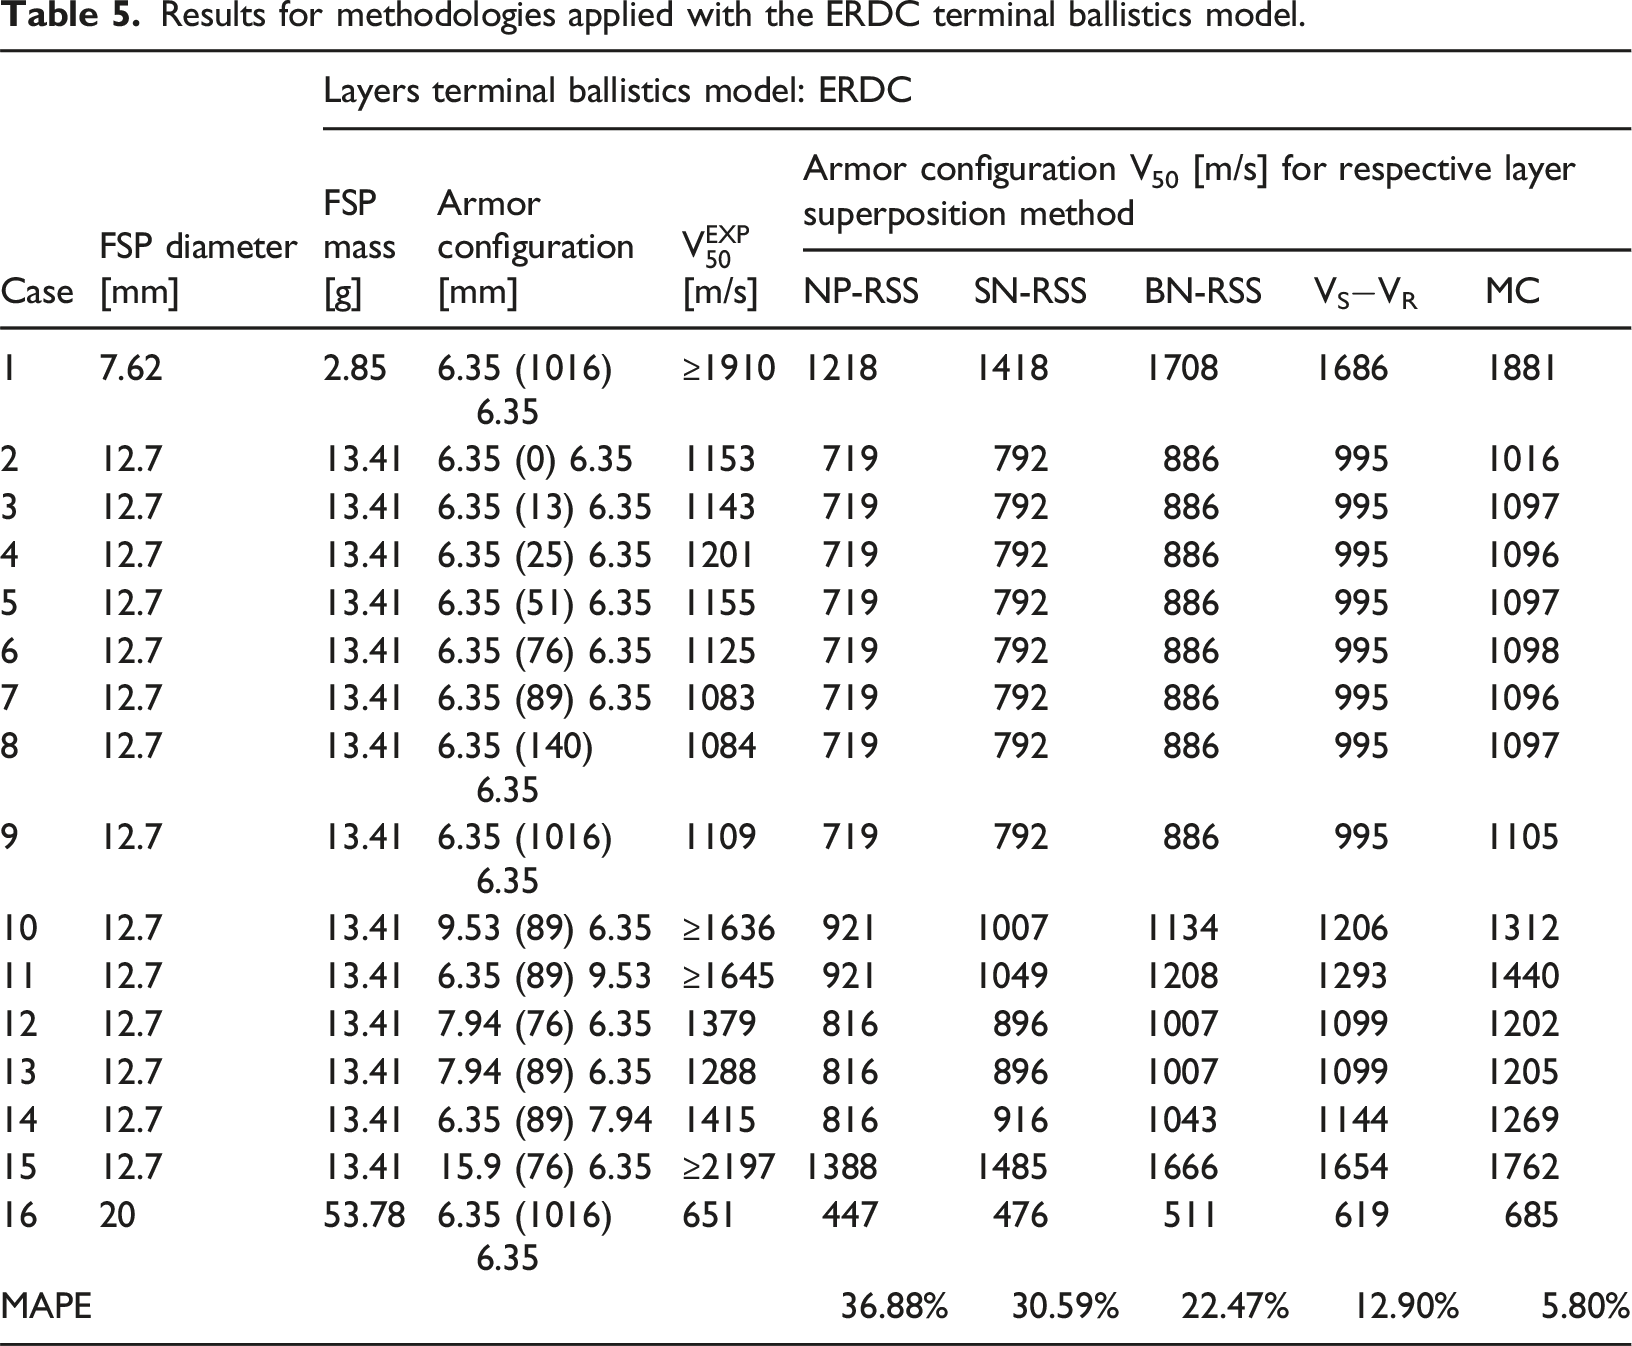
Results for methodologies applied with the ERDC terminal ballistics model.
Layers terminal ballistics model: ERDC
Case
FSP diameter [mm]
FSP mass [g]
Armor configuration [mm]
[m/s]
Armor configuration V50 [m/s] for respective layer superposition method
NP-RSS
SN-RSS
BN-RSS
VS−VR
MC
1
7.62
2.85
6.35 (1016) 6.35
≥1910
1218
1418
1708
1686
1881
2
12.7
13.41
6.35 (0) 6.35
1153
719
792
886
995
1016
3
12.7
13.41
6.35 (13) 6.35
1143
719
792
886
995
1097
4
12.7
13.41
6.35 (25) 6.35
1201
719
792
886
995
1096
5
12.7
13.41
6.35 (51) 6.35
1155
719
792
886
995
1097
6
12.7
13.41
6.35 (76) 6.35
1125
719
792
886
995
1098
7
12.7
13.41
6.35 (89) 6.35
1083
719
792
886
995
1096
8
12.7
13.41
6.35 (140) 6.35
1084
719
792
886
995
1097
9
12.7
13.41
6.35 (1016) 6.35
1109
719
792
886
995
1105
10
12.7
13.41
9.53 (89) 6.35
≥1636
921
1007
1134
1206
1312
11
12.7
13.41
6.35 (89) 9.53
≥1645
921
1049
1208
1293
1440
12
12.7
13.41
7.94 (76) 6.35
1379
816
896
1007
1099
1202
13
12.7
13.41
7.94 (89) 6.35
1288
816
896
1007
1099
1205
14
12.7
13.41
6.35 (89) 7.94
1415
816
916
1043
1144
1269
15
12.7
13.41
15.9 (76) 6.35
≥2197
1388
1485
1666
1654
1762
16
20
53.78
6.35 (1016) 6.35
651
447
476
511
619
685
MAPE
36.88%
30.59%
22.47%
12.90%
5.80%
The performance calculations show the MC superposition methodology consistently brings estimation closest to the experimental value regardless of the underlying terminal ballistics model. This was also the case with the UFC 3-340-02 and UFC 4-023-07 underlying monolithic terminal ballistic models not presented in this study. In these two cases, the MC superposition also yielded the lowest error among the methods with MAPEs of 31.60% and 22.31%, respectively.
Conclusions
This investigation introduced an MC approach to modeling the of layered and spaced A36 armor configurations against FSPs. The performance of the MC method was evaluated relative to four layer superposition methodologies from the literature. The objective of the study was not to assess the intrinsic accuracy of any individual terminal ballistic model, but rather to examine the relative performance of the superposition frameworks when applied to multi-layer targets. Although the underlying terminal ballistic models employed are known to provide reasonable predictions for monolithic targets under appropriate impact conditions, conventional superposition methods rely on idealized, deterministic formulations that capture only a subset of the relevant penetration physics. These approaches neglect stochastic effects which are known to influence experimental outcomes in layered and spaced armor systems and which the proposed MC framework seeks to represent. If the underlying terminal ballistic model itself is not accurate for the monolithic material, predictive accuracy cannot be achieved regardless of the superposition method used. Two independent underlying terminal ballistics models were used to show that relative performance advantage was not model-specific. Simulation results converged at repetitions per velocity, using a velocity level resolution of 1 m/s. This number resulted in fast-running calculations of under 1 min. The performance for each method was evaluated relative to the experimental data. The MC method yielded the lowest error among the methodologies, with a MAPE of 8.81% for the THOR terminal ballistic model and 5.80% for the ERDC model. Overall, the next best superposition methodology was the VS−VR methodology, validating the DoD guidance.
Additional research is required to identify and incorporate additional random variables relevant to the problem. Characterizing the probability distributions that best model the random variables will boost the accuracy of the methodology. Additionally, validating the accuracy of the variance of the MC quantal response will be necessary to determine percentiles other than 50%. Future work could also include exploring the validity of the method for other projectile types and geometries, and for non-zero initial obliquity angles. Optimizing the algorithm to balance the striking velocity resolution and the number of simulations per velocity value could further increase performance. Finally, although this method shows excellent preliminary agreement when modeling multi-material layered and spaced armor configurations, further study is required to assess the applicability of the method for these configurations.
Footnotes
ORCID iDs
Daniel H. Rios-Estremera
Matthew W. Priddy
Jesse A. Sherburn
Funding
The authors disclosed receipt of the following financial support for the research, authorship, and/or publication of this article: This research was funded by the U.S. Army Corps of Engineers ERDC. Any opinions, findings, and conclusions expressed in this presentation are those of the writers and do not necessarily reflect the view of ERDC. ERDC also conducted the ballistic testing presented herein.
Declaration of conflicting interests
The authors declared no potential conflicts of interest with respect to the research, authorship, and/or publication of this article.
References
1.
AptukovVN (1990) Penetration: mechanical aspects and mathematical modeling. Strength ofMaterials22(2): 230-240. Available at:https://doi.org/10.1007/BF00773243
2.
ARL (2008) ARL-TR-4427 Ballistic Performance Testing of Aluminum Alloy 5059-H131 and 5059-H136 for Armor Applications. U.S. Army Research Laboratory.
3.
ARL (2012) ARL-TR-6022 Quantal Response: Practical Sensitivity Testing. Army Research Laboratory.
4.
ARL (2014) ARL-TR-7088 Quantal Response: Estimation and Inference. Army Research Laboratory.
5.
ASTM (2019) ASTM A36/A36M-19 Standard Specification for Carbon Structural Steel. ASTM International.
6.
ATEC (1983) TOP 2-2-722 Test Operations Procedure: Fragment Penetration Tests of Armor. ATEC.
7.
BackmanMEGoldsmithW (1978) The mechanics of penetration of projectiles into targets. International Journal of Engineering Science16: 1–99. https://doi.org/10.1016/0020-7225(78)90002-2
8.
BakerWEWestinePSDodge FranklinT (1991) Similarity Methods in Engineering Dynamics: Theory and Practice of Scale Modeling. 2nd edition. Elsevier Science Publishing Company Inc.
9.
Ben-DorGDubinskyAElperinT (2005) Ballistic impact: recent advances in analytical modeling of plate penetration dynamics - a review. Applied Mechanics Reviews58: 355–371. https://doi.org/10.1115/1.2048626
10.
Ben-DorGDubinskyAElperinT (2006) Effect of air gaps on the ballistic resistance of ductile shields perforated by nonconical impactors. Journal of Mechanics of Materials and Structures1(2): 279–299. https://doi.org/10.2140/jomms.2006.1.279
11.
Ben-DorGDubinskyAElperinT (2019) Engineering Models in High-Speed Penetration Mechanics and Their Applications. World Scientific Publishing Company.
12.
BRL (1961) TR-47 the Resistance of Various Metallic Materials to Perforation by Steel Fragments; Empirical Relationships for Fragment Residual Velocity and Residual Weight. Ballistic Research Laboratories.
13.
BRL (1963) TR-51 the Resistance of Various Non-Metallic Materials to Perforation by Steel Fragments; Empirical Relationships for Fragment Residual Velocity and Residual Weight. Ballistic Research Laboratories.
14.
BRL (1992) Terminal Ballistics Test and Analysis Guidelines for the Penetration Mechanics Branch. BRL.
15.
CunniffPM (2014) A method to describe the statistical aspects of armor penetration, human vulnerability and lethality due to fragmenting munitions. In: Proceedings 28th international symposium on ballistics.Atlanta, GA, 22-26 September 2014.
16.
D&PS (1954) Methods of Computing Ballistic Limits from Firing Data. Development and Proof Services.
17.
D&PS (1957) The Accuracy and Reproductibility of Several Methods for Obtaining Ballistic Limits of Armor. Development of Proof and Services.
18.
DARCOM (1983) DARPCOM-P 706-103 Engineering Design Handbook: Selected Topics in Experimental Statistics with Army Applications. US Army Materiel Development and Readiness Command.
19.
DavisBGThompsonJMorningstarW, et al. (2021) Risk evaluation of ballistic penetration by small caliber ammunition of live-fire shoot house facilities with comparison to numerical and experimental result. International Journal of Protective Structures12(4): 417–436. https://doi.org/10.1177/2041419620988553
20.
DelsassoLARobertsonHPSmythHD (1941) On the Probability of Penetration of Armor Plate. Office of Scientific Research and Development, National Defense Research Commitee.
21.
DoD (1990) TM 5-1300 the Design of Structures to Resist the Effects of Accidental Explosions. DoD.
22.
DoD (1997) MIL-STD-662F Department of Defense Test Method Standard V50 Ballistic Test of Armor. Department of Defense.
23.
DoD (2006) MIL-DTL-46593B Detail Specification: Projectile, Calibers .22, .30, .50, and 20 mm Fragment-Simulating. Department of Defense.
24.
DoD (2008a) UFC 3-340-02 Structures to Resist the Effects of Accidental Explosions.Department of Defense.
25.
DoD (2008b) UFC 4-020-01 DoD Security Engineering Facilities Planning Manual. Department of Defense.
26.
DoD (2008c) UFC 4-023-07 Design to Resist Direct Fire Weapons Effects. Department of Defense.
27.
DusenberryDO (2010) Handbook for Blast-Resistant Design of Buildings. John Wiley & Sons, Inc.
28.
FEMA (2006) Risk Management Series: Design Guidance for Shelters and Safe Rooms. Federal Emergency Management Agency.
29.
FEMA (2011) FEMA-426/BIPS-06, 2nd Ed. Reference Manual to Mitigate Potential Terrorist Attacks Against Buildings. Federal Emergency Management Agency.
30.
JohnsonTHFreemanLHesterJ, et al. (2014) A comparison of ballistic resistance testing techniques in the department of defense. IEEE Access2: 1442–1455. https://doi.org/10.1109/access.2014.2377633
31.
JordanJBNaitoCJ (2014) An experimental investigation of the effect of nose shape on fragments penetrating GFRP. International Journal of Impact Engineering63: 63–71. https://doi.org/10.1016/j.ijimpeng.2013.08.002
32.
KasanoHAbeK (1997) Perforation characteristics prediction of multi-layered composite plates subjected to high velocity impact. In: Proceedings from the eleventh international conference on composite materials: volume II, Queensland, Australia, 14-18 July 1997, pp. 522–531. Australian Composite Structures Society.
ReedHLKlopcicTJDeitzPH, et al. (2002) Fundamentals of Ballistic Vulnerability/Lethality Assessment. Defense Systems Information Analysis Center.
36.
RileyMARiceKDForesterAL (2012) Assessment of uncertainty in ballistic response estimates obtained from ballistic limit testing. In: Personal Armor Systems Symposium (PASS),Nuremberg, Germany, September 17-20, 2012.
37.
RiosDH (2021) Modeling the Ballistic Limit of Fragment Simulating Projectiles Impacting A36 Mild Steel Spaced Armor Configurations. Mississippi State University.
U.S. Air Force (1993) ESL-TR-92-40 Reliability-Based Analysis and Design Methods for Reinforced Concrete Protective Structures. U.S. Air Force Civil Engineering Support Agency.
40.
WhiteMP (1946) Effects of Impact and Explosions. Office of Scientific Research and Development.