



Abstract
The gas pipeline is considered as the most potentially hazardous component in the urban utility tunnel. In current work, a numerical model, developed in LS-DYNA, utilizing Arbitrary Lagrangian-Eulerian (ALE) algorithm, accounts for both fluid characteristics of explosion gases and mechanical behavior of structures. Through the analyses of shock wave pressure, structural displacement and effective stress in the square dual-chamber utility tunnel, it is determined that the most vulnerable damage zones under gas explosion loads are located at the inner corners and outer walls of the gas chamber, and their peak effective stresses are 4.875 MPa and 4.363 MPa, respectively. The peak pressure decreases from 0.314 MPa at 6 m from the ignition source to 0.215 MPa at 30 m, with a decreasing ratio of 31.53%. The response of bending utility tunnels with varied bending angles subjected to gas explosion loads are thoroughly examined. Compared with the baseline pressure of straight section of tunnel (0.255 MPa), the pressure gradually increases with the bending angle. The pressure reaches 0.301 MPa for 90° bend, with an increasing ratio of 18%. The displacement is 8.86 mm for the straight section, but it increases to 10.36 mm for the 90° bend. At smaller bending angles of 15° and 30°, the damage area is distributed more evenly, and the overall damage level is relatively slight. However, at larger bending angles of 45°, 60° and 90°, the damages are mainly concentrated in the front and at the bends.
Keywords
Introduction
With the rapid advancement of urbanization, the stable supply of urban infrastructure, including water, electricity, gas, telecommunication, and drainage has been recognized as essential for the normal operation of cities. The scientific and rational layout of gas pipeline to ensure the reliable and safe energy supply has been identified as a critical issue in urbanization construction (Wu et al., 2021). As an integrated and intelligent solution for urban infrastructure, a novel approach of the installation of gas pipeline into the utility tunnel is widely adopted. The gas pipeline is considered as the most potentially hazardous component in the urban utility tunnel. The leakage, diffusion and explosion accidents may be triggered in utility tunnel (Ding et al., 2024). As a confined and elongated space, the underground utility tunnel poses a greater risk than the directly buried pipeline (Cao et al., 2022) in the event of gas explosion.
Historical accidents highlight the severity of such risks. On August 1, 2014, a gas explosion triggered by a gas leak occurred across several streets in the Qianzhen District of Kaohsiung City, Taiwan, China, resulting in 32 fatalities and 321 injuries (Yan et al., 2020). Additionally, an accident involving distribution cables, tram network power supply cables, and gas pipelines—characterized by an explosion and subsequent gas fire—took place in Turin, Italy (Piccinini et al., 2009). Therefore, preventing damage induced by gas explosions within buried utility tunnels is of critical importance.
Several scholars have investigated the behaviors of gas explosion in confined spaces through experiments (Prochazka and Jandekova, 2020; Yan et al., 2021; Yang et al., 2021). Zhao et al. (2022) carried the gas explosion tests in a scaled utility tunnel, finding that increasing the length of the compartment and the number of auxiliary obstacles in the compartment increased the explosion overpressure. Cao et al. (2024) found that the explosion pressure in utility tunnel followed a power function with the propagation distance. Qiu et al. (2021) investigated the overpressure evolution of methane explosion shock wave in pipeline with varied curvature and derived an expression for the shock wave overpressure attenuation coefficient. Li et al. (2024) examined the impact of relative humidity on the explosion characteristics of methane-air premixed gas in a 30° curved utility tunnel, finding that the 70% relative humidity showed the optimal explosion pressure suppression in the 30° curved tunnel. Tang et al. (2025) explored the effects of transverse and longitudinal concentration gradients of methane-air mixture on gas explosion characteristics in a square pipeline, including flame structure, propagation velocity, pressure, and temperature. Wu et al. (2023) investigated the effect of transverse concentration gradient on the ventilated explosion of non-uniform methane/air mixture, finding that as the concentration gradient increased, the pressure oscillation became stronger. Noted that most previous experiments were carried out with a scale-sized tunnel, thus, the accurate parameters of gas explosion could not easily recorded by these tests.
In recent years, researchers have adopted the numerical methods to study the tunnel structural explosions (Kasilingam et al., 2021; Mai et al., 2024), particularly in the field of gas explosions (Yang et al., 2025). For instance, Wang et al. (2024) used the TNT equivalence method to simulate the explosion in a natural gas pipeline according to the LS-DYNA software. Mussa et al. (2017) investigated the failure behavior of underground box-frame utility tunnel subjected to the ground explosion. The Arbitrary Lagrangian-Eulerian (ALE) algorithm was applied to simulate the propagation of explosion pressure wave through the soil. Zhu et al. (2024) suggested that the interaction between explosion shock wave and structure could be effectively addressed using the ALE algorithm. Yang et al. (2018) used a fully coupled Eulerian-Lagrangian method in AUTODYN to examine the dynamic response and failure processes of shallow-buried box bending impacted by the ground explosion. Wang et al. (2021) simplified the gas explosion loads into a trilinear model to analyze the effects of load intensity, concrete strength, reinforcement strength, and cross-sectional geometry. The results indicated that gas explosion with a high overpressure peak loads could cause severe tunnel damage and internal partition failure.
In summary, the previous research on the structural dynamic response commonly models the gas explosion as the point-source explosion using the equivalent TNT method (Wang et al., 2024). Although this approach is suitable for gas cloud explosion far from the structure i.e., external gas explosion, its accuracy diminishes for the internal gas cloud explosion of the utility tunnel because the fluid dynamics of explosive gas is ignored. Moreover, some researchers apply the fixed triangular explosion pressure curve to study the dynamic response (Wang et al., 2023), yet this method neglects the effect of fluid-structure interaction (FSI) on the dynamic characteristics of explosion pressure. Furthermore, most investigations on gas explosion are conducted using the straight tunnel (Li et al., 2024) or the rectangular tunnel (Xue et al., 2021), with less consideration of square and bending tunnels, which commonly exist in the practical applications. Eventually, the previous research on structural damage is mostly limited to the fixed points or local areas, but less work concentrates on the distribution characteristics of the tensile and compressive regions of the overall tunnel structure.
Therefore, in this study, a coupled flow-solid numerical model based on the ALE algorithm is constructed to accurately characterize the dynamic response of integrated utility tunnel under the effect of natural gas explosion (Gao et al., 2025). The bending and square tunnels are included. The overall damage area of the utility tunnel is carefully divided, so the damage situation of the utility tunnel is explicit. This study aims to reveal the mechanisms of shock wave propagation and structural mechanical response, which provide a theoretical support for the safety protection of urban utility tunnel.
Numerical model based on FSI
Material models and parameters
Physical parameters of mixed gas model.

Physical parameters of air.

Physical parameters of concrete material.

Physical parameters of reinforcement steel.

Physical parameters of soil.

Model validation
The numerical model is verified by the experiments of the blast resistance of chamber partition walls (slabs) against gas explosion (Yang et al., 2021). In the validation experiment by Yang et al., the explosion load was generated using a 9.5% methane-air mixture, ignited by an electric detonator. The tunnel had internal dimensions of 20,000 mm × 1600 mm × 600 mm, and the entire tunnel volume was filled with the explosive gas mixture. As illustrated in Figure 1, the crack propagation paths in the numerical simulation are highly consistent with those observed in the actual experiment. The crack labeled as “a” is attributed to the simplified configuration of the constraint plates. When the impact force of shock wave acts on the concrete specimen, the displacement is restricted by the constraint plates, forming the crack. And the maximum concrete displacement in simulation is 59.31 mm, which is almost equal to the experimental measurement of 54.73 mm, with a relative error of 8.3%. The difference between experimental and numerical result is attributed to several factors. First, the methane-air mixture is fully homogeneous in the numerical simulation, whereas the mixture might stratify due to the density difference in the experiment. Moreover, the numerical model incorporates the smooth and adiabatic assumptions, neglecting the roughness of the tunnel walls. The aforementioned comparisons indicate that the numerical model demonstrates a high accuracy in capturing the mechanical behavior of the concrete slab, as well as revealing the dynamic response of utility tunnels under gas explosion. Comparison of concrete damage contours and displacement between numerical and experimental results (Yang et al., 2021).
It should be noted that the validation experiment involves isolated concrete slabs, while the current study models a complete tunnel–soil system. The purpose of this validation is to verify the accuracy of the material constitutive models, the ALE coupling algorithm, and the numerical schemes under gas explosion loading, rather than to replicate the exact structural configuration. The same concrete material model has been extensively validated for underground structures in previous studies (Pan et al., 2024; Wang et al., 2021), and the ALE method is well-established for fluid–structure interaction problems in buried tunnels (Mussa et al., 2017; Qian et al., 2021; Xue et al., 2021; Zhou et al., 2024). Therefore, the validated numerical schemes provide a reliable foundation for the full-scale tunnel simulations presented in this study.
Wu (2003) conducted full-scale explosion experiments in a test roadway using a 200 m3 methane–air premixed gas with a concentration of 9.5%. The test tunnel had a cross-sectional area of 7.2 m2 and a total length of 200 m, with one end sealed by an explosion-proof door and the other end left open, simulating explosion propagation under heading face conditions. Figure 2 compares the peak overpressure variation with distance obtained from three experimental runs, theoretical predictions, equivalent TNT method results, and the present numerical simulation (*MAT_HIGH_EXPLOSIVE_BURN model and linear polynomial EOS) results. As shown in the figure, the current numerical results are generally in good agreement with the experimental data, with slight overprediction observed in some local regions. This discrepancy is mainly attributed to the assumption of rough wall conditions rather than ideal smooth rigid walls in the model, leading to slightly conservative predictions. In contrast, the equivalent TNT method significantly overestimates the overpressure in the near-field region while exhibiting excessively rapid attenuation in the far-field. This indicates that the TNT equivalency method is inadequate for accurately capturing the propagation characteristics of gas explosions in confined spaces and it is therefore not suitable for precise simulation of such scenarios. Comparison of peak overpressure between experimental results and numerical simulation.
Model building of dual-chamber utility tunnel
The study focuses on the typical square double-chamber integrated utility tunnel structure (Wang et al., 2021). In this study, the methane-air mixture is modeled as a stoichiometric mixture with a methane concentration of 9.5% by volume, which represents the most explosive condition. The ignition source is located at the center of the explosive gas volume (2 m × 2 m × 5 m) positioned at one end of the tunnel, as shown in Figure 3. The mixture is assumed to be uniformly distributed and quiescent prior to ignition. It should be noted that the current model does not explicitly simulate flame propagation or combustion chemistry. Instead, the *MAT_HIGH_EXPLOSIVE_BURN model treats the entire gas volume as a detonating high explosive with pre-defined detonation properties. This simplification assumes that the mixture undergoes instantaneous detonation upon ignition, which represents a worst-case scenario for structural response analysis. While this approach may overpredict the initial loading rate compared to deflagration-dominated events, it provides a conservative estimate for structural design purposes and has been widely used in previous studies focusing on structural response (Chi et al., 2021; Zhang et al., 2014). The FSI method is used to establish the comprehensive soil-tunnel-air-methane model (Qichen et al., 2021), as shown in Figure 3. The air, gas, and soil are represented using ALE meshes, while the tunnel structure is represented with the Lagrangian meshes. The Eulerian and Lagrangian meshes are coupled through the *CONSTRAINED_LAGRANGE_IN_SOLID model. For the boundary conditions, the XOZ plane is set to the geometric symmetry plane. The non-reflecting boundary conditions are used on the left, right, and bottom sides of the soil model to simulate the infinite length of the soil spatial characteristics. Schematic of the dimensions of the numerical model (unit: cm).
To eliminate the computational errors caused by the large mesh size, a mesh convergence test is conducted for the established model. The displacement and the peak pressure 6 m from the ignition source are selected as the evaluation criteria, as shown in Figure 4. From the perspective of balancing computational accuracy and efficiency, the overall mesh size of the model is controlled at 10 cm × 10 cm × 10 cm. Mesh convergence of gas explosion inside the utility tunnel.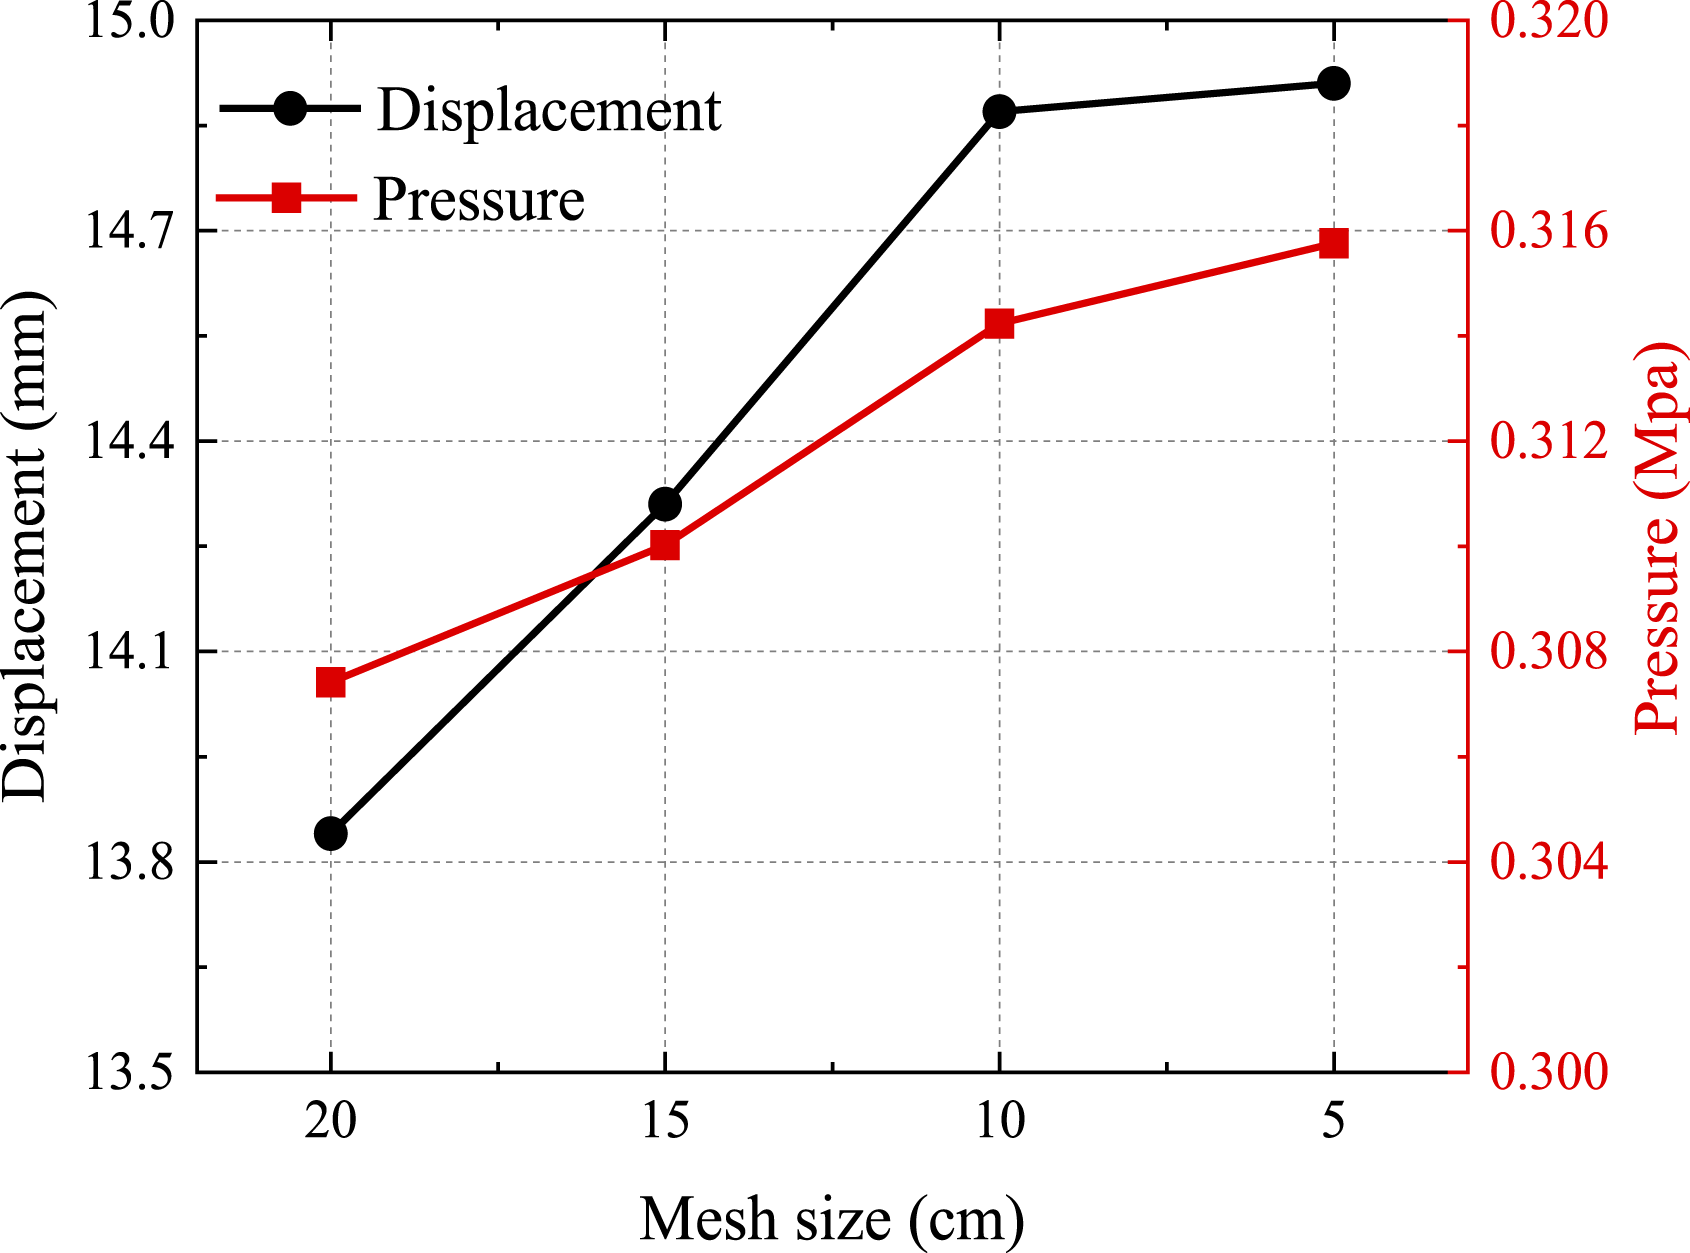
Results and discussion
Underground straight utility tunnels
Explosion pressure
Figure 5 illustrates the pressure distribution along the axial cross-section of the tunnel. The findings indicate that, in the early stages of the explosion, the pressure near the ignition point is significantly higher than that in the surrounding region. As the explosion develops, the pressure progressively diminishes, and it eventually stabilizes. Once ignition, the explosive gas rapidly releases energy, drive the surrounding air to generate an initial shock wave. As the explosion progresses, the tunnel walls play a critical role in altering the propagation behavior of the pressure wave through wave reflection. Near the tunnel’s axis, the reflected wave interacts with the primary explosion wave, creating a new high-pressure zone. However, since the reflected wave travels in a direction opposite to the primary explosion wave. The shock wave energy gradually disperses, leading to a reduction in the radial oscillation. As the shock wave front propagates into the surrounding environment, the rarefaction wave caused by the movement of the explosion product also propagates. This process is accompanied by a sharp drop in gas density, forming a localized low pressure region, particularly near the ignition source. Evolution of explosion pressure in the utility tunnel from an axial section view.
Figure 6 presents the pressure-time history at each measurement point along the Z axis of the tunnel. The initial shock wave generated by the gas explosion causes a significant pressure fluctuation near the explosion source. As the explosion wave propagates towards the tunnel walls, the reflected wave is formed. In the region between 10 m and 16 m from the ignition position, the interaction between the reflected wave and the primary wave results in a double-peak phenomenon. The first pressure peak is caused by the direct shock wave, while the second peak is the result of the superposition of the reflected wave and the primary shock wave. The secondary peak is generally considerably smaller than the first peak. As the explosion wave propagates along the tunnel, the influence of the reflected wave weakens. After several peaks, the superposition effect of the reflected wave and the primary shock wave weakens, resulting in a single peak waveform. As the explosion wave propagates over a longer distance, the pressure-time history transitions from the originally complex, multi-peak waveform to the stable, single-peak waveform. The peak pressure decreases from 0.314 MPa at 6 m from the ignition source to 0.215 MPa at 30 m, with a decreasing ratio of 31.53%. This indicates that the explosion pressure significantly decreases with the increasing distance. Pressure time diagrams for different measurement points.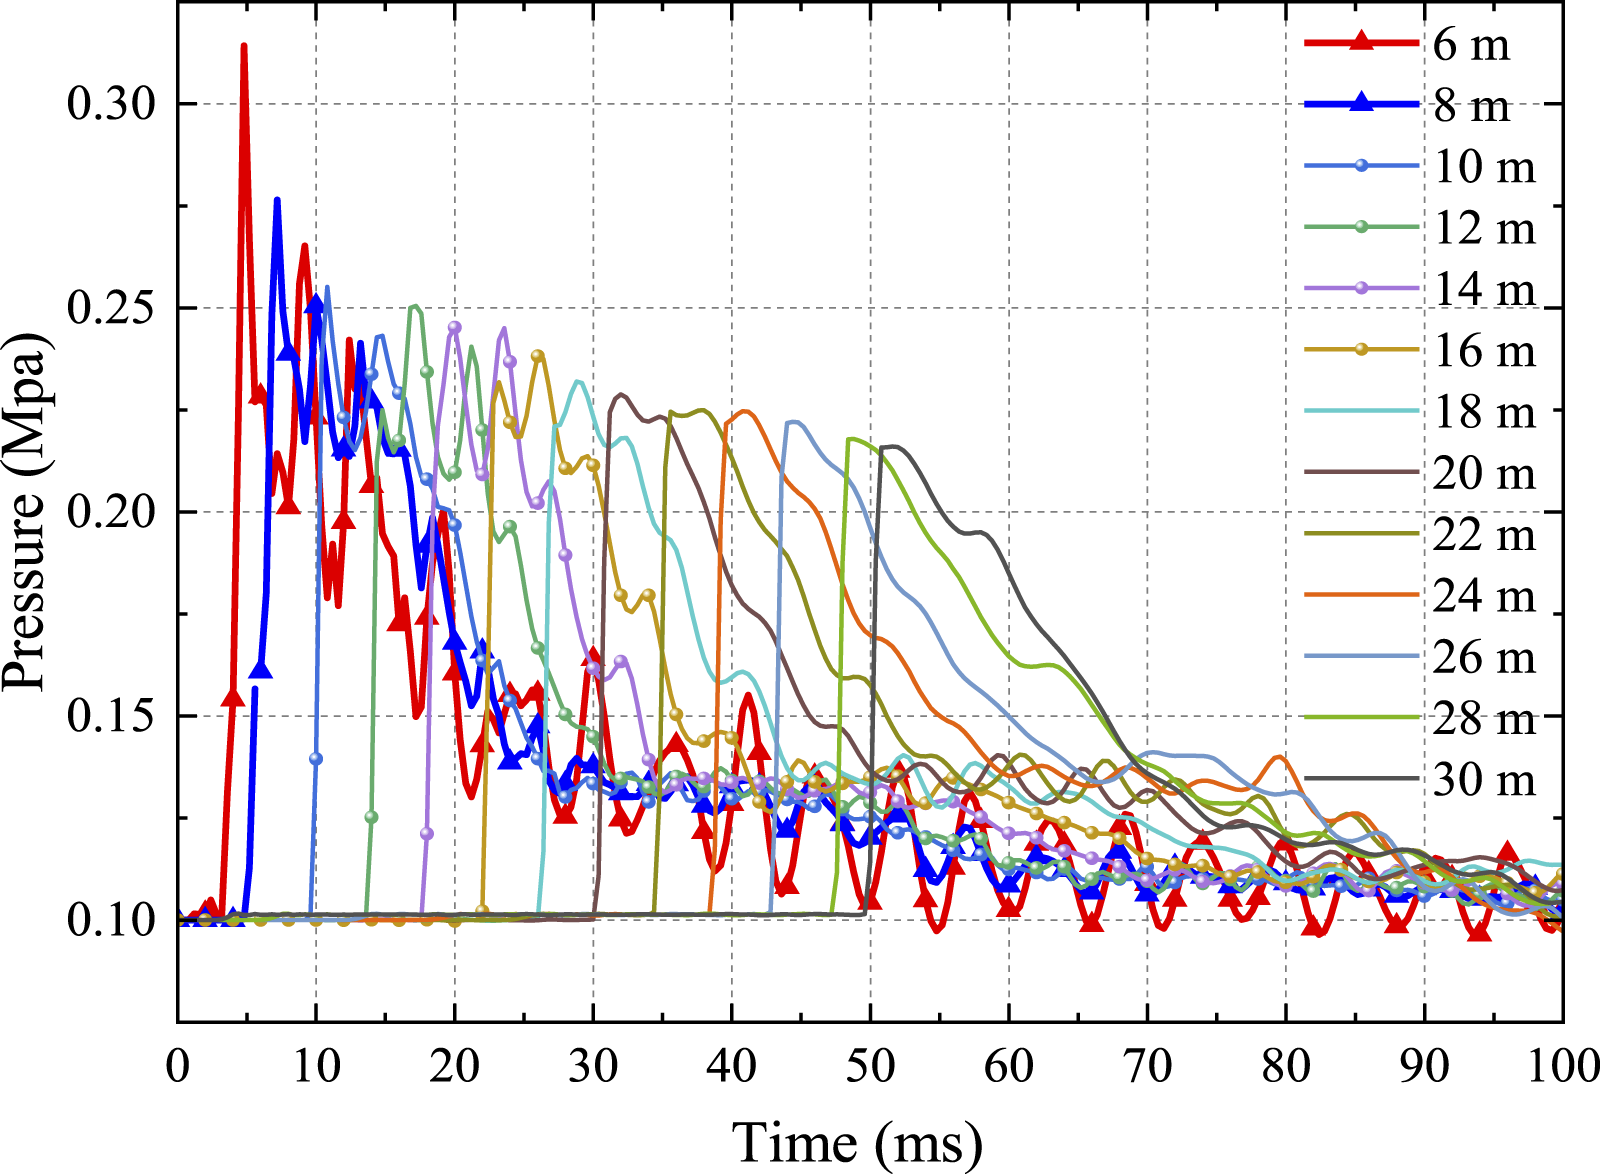
Displacement and velocity response
Figure 7 shows the distribution and displacement time diagrams for different measurement points The L2 shows a very small displacement, with a maximum value of only 0.75 mm, directed along the negative X-axis. The maximum displacement at the L1 is 14.87 mm, also along the negative X-axis. The maximum displacement at the R1 is 2.93 mm, while the T1 shows a maximum displacement of 5.11 mm, both directed along the positive Y-axis. The maximum displacement at the U1 is 2.18 mm, directed along the negative Y-axis. Distribution and. Displacement time diagrams for different measurement points.
During the initial stage of the explosion, the overpressure load on four walls leads to a rapid increase in displacement. The displacement response is primarily controlled by the first overpressure peak. However, due to the partial burial of the tunnel in the soil, the environmental difference along the four walls results in different displacements at each measurement point. For the L1, the surrounding material is air with no special displacement constraints, so the maximum displacement is primarily governed by the explosion overpressure, and the material’s elastic characteristics cause the displacement to gradually decrease afterward. The displacement evolution for the T1 shows that during the initial explosion load, the structure experiences a rapid increase in displacement. Subsequently, due to inertia and the restriction from the upper 3-m soil layer, the displacement reaches a peak and then decreases. The displacement evolutions of U1 and R1 indicate that the wall structure vibrates under the explosion load. However, due to the natural frequency and damping characteristics of the structure, and the strong support from the bottom and right soil layers, the displacement of bottom wall is limited.
As shown in Figure 8, the time histories of the resultant displacement, X-direction displacement, and X-direction velocity are measured at two points A and B locating at the wall center of the natural gas cabin. The Z-axial distance between the measurement points and the ignition source is 10 m. The results show that the resultant displacement is primarily dominated by the X-displacement. The X-velocity curves indicate that the movement directions of the left and right walls are opposite. Time histories of resultant displacement, X-displacement, X-velocity of points A and B.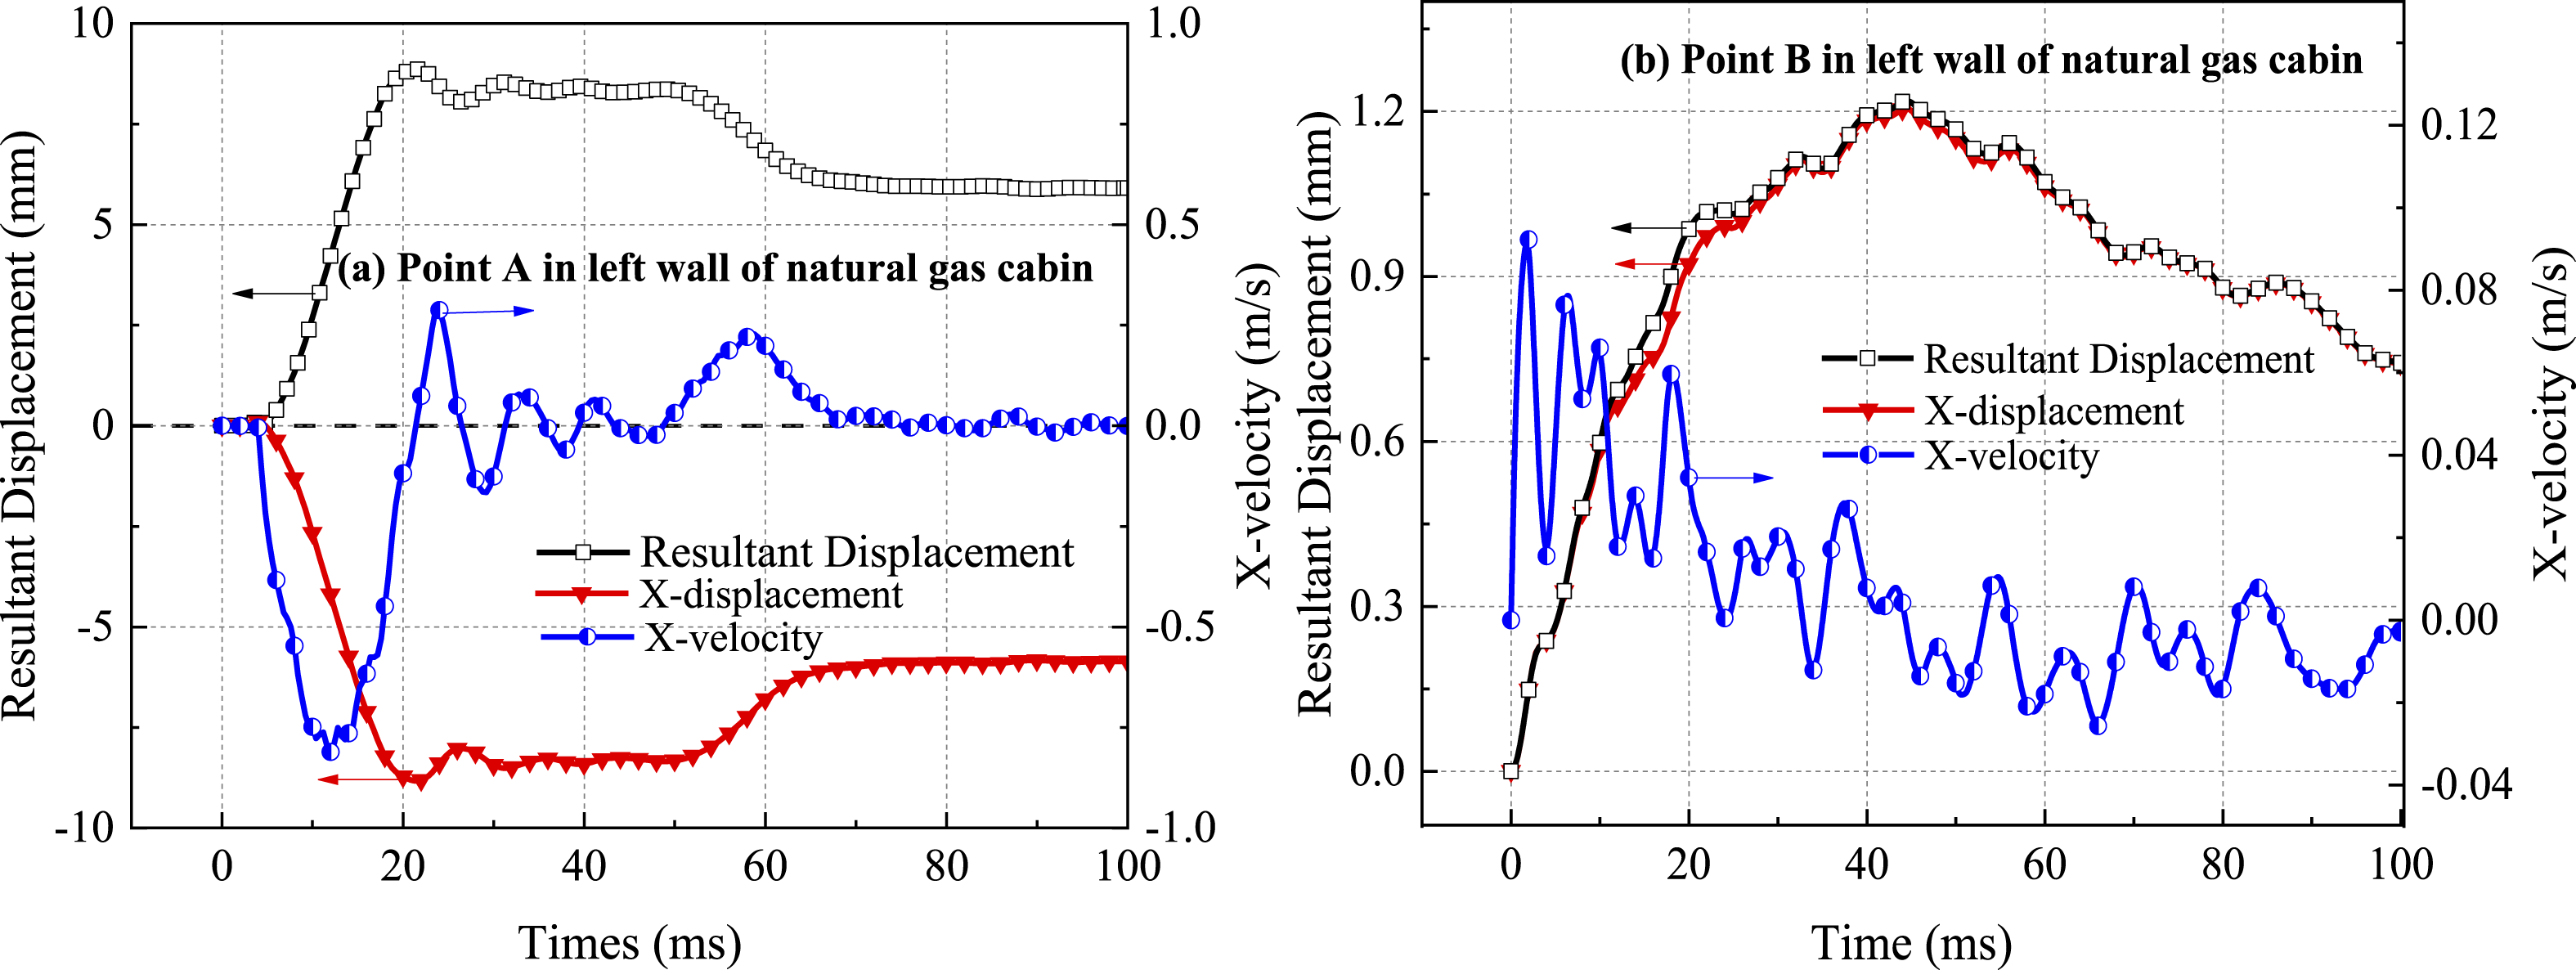
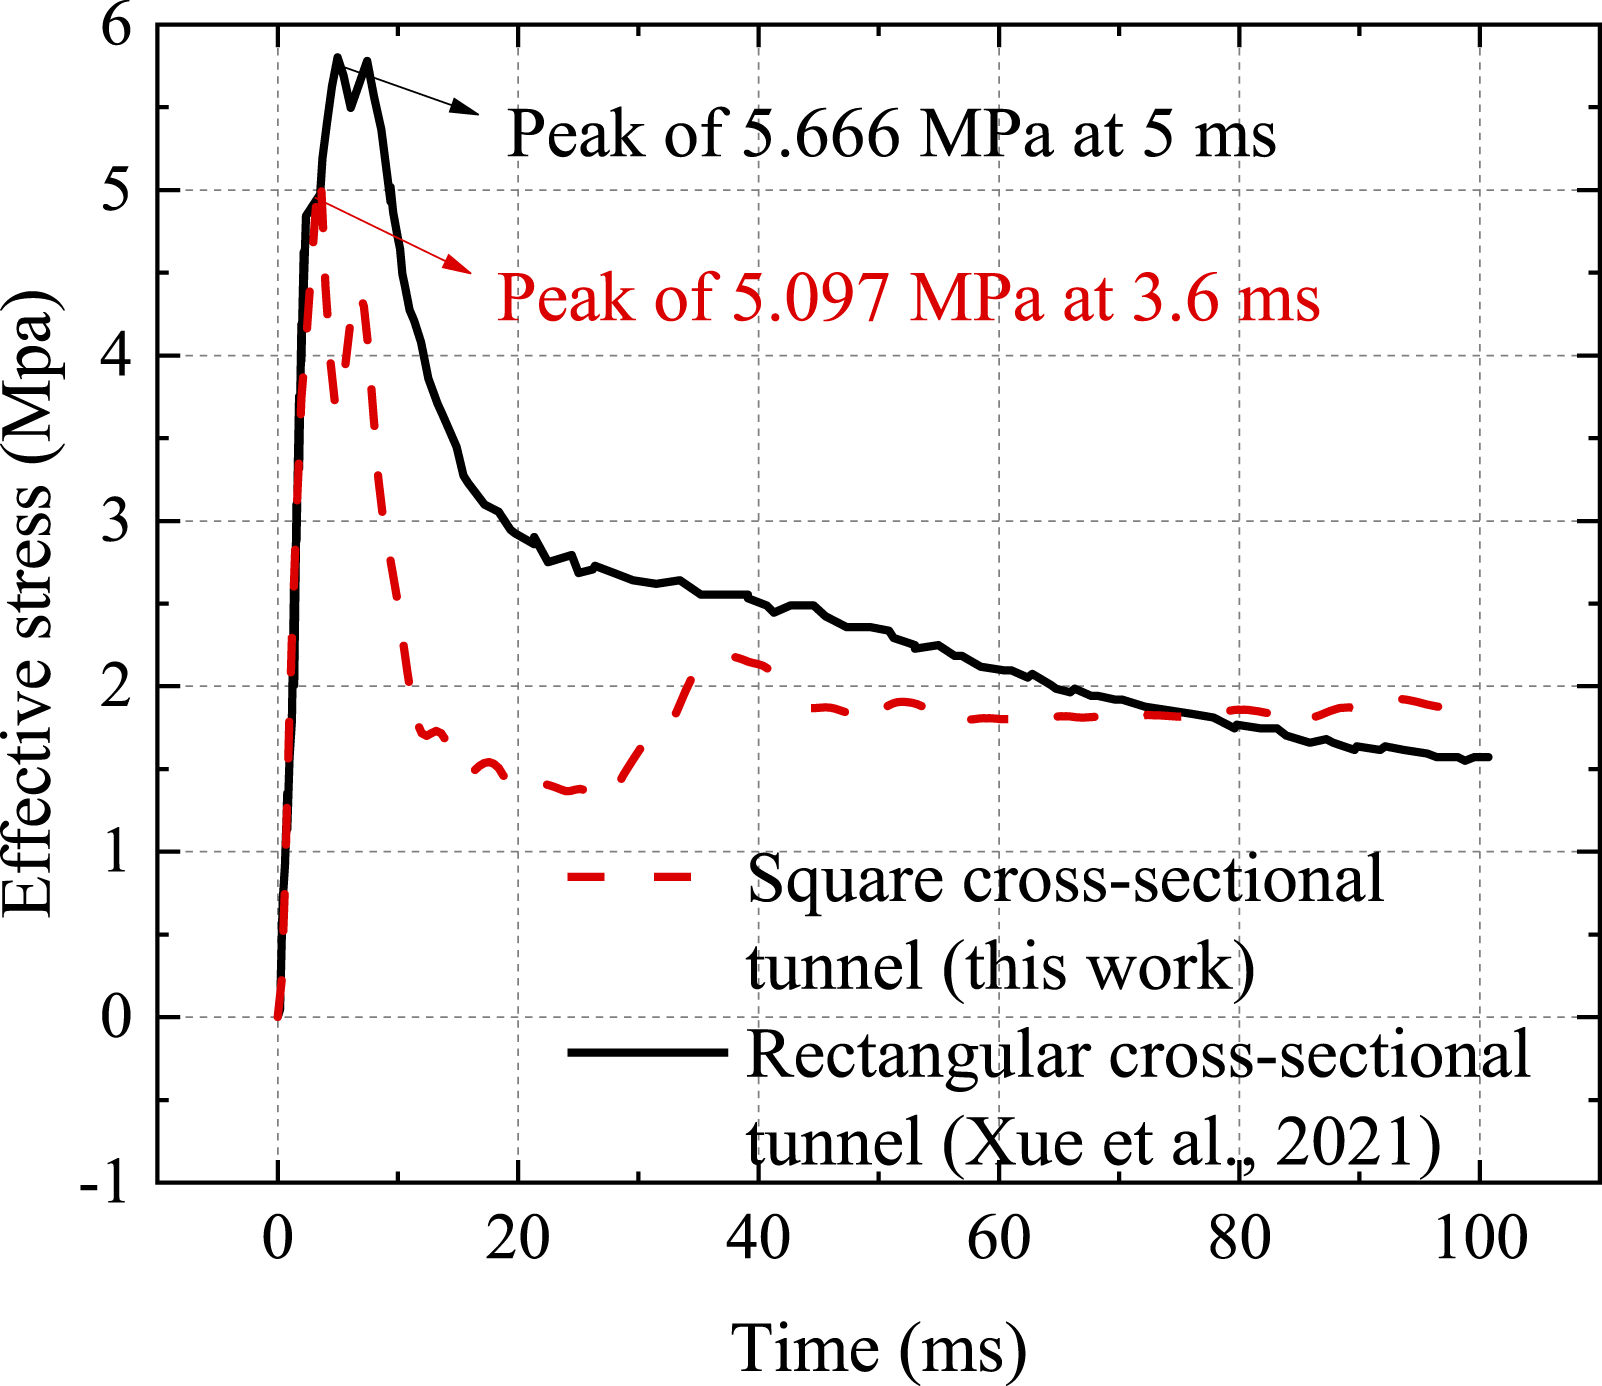
As shown in Figure 9(a), the deformation trend of the structure is clearly depicted by the dashed line and the specific direction of motion is represented with the arrows. Noted that the inner and outer walls are subjected to compressive and tensile stresses, respectively. The inner corner experiences the tensile stress, while the outer corner bears the compressive stress. Figure 9(b) illustrates the distribution characteristics of the tensile and compressive regions of the overall tunnel structure. The stress distribution of the structure shows the obvious regional differences. Figure 9(c) demonstrates the effective strain damage region of the tunnel. It is well-known that the concrete is strong in compression, but weak in tension. Therefore, the failure of concrete occurs in the tensile regions. The theoretical and numerical damage distributions are highly consistent, which validates the reliability of the current simulating method. The load distributes evenly in the square-sectional tunnel owing to the geometric symmetry, causing a uniform damage distribution. In contrast, the rectangular-sectional utility tunnel exhibits a stronger stress concentration along the longer side due to its geometric asymmetry, resulting in more severe damage in such a direction (Xue et al., 2021). Compared with that of rectangular dual-chamber tunnel. As shown in Figure 10, after the explosion, the Von Mises stress at the corner of square tunnel quickly attains the peak of 5.097 MPa at 3.6 ms, whereas the stress attains the peak of 5.666 MPa at 5 ms. For the square cross-sectional tunnel, the length of the square tunnel side is equivalent, so the pressure wave simultaneously arrives and superimposes at the corner. This results in an instantaneously high-stress concentration area. Trends in physical properties of tunnels under gas explosion. Comparison of effective stresses in square and rectangular cross-sectional tunnels.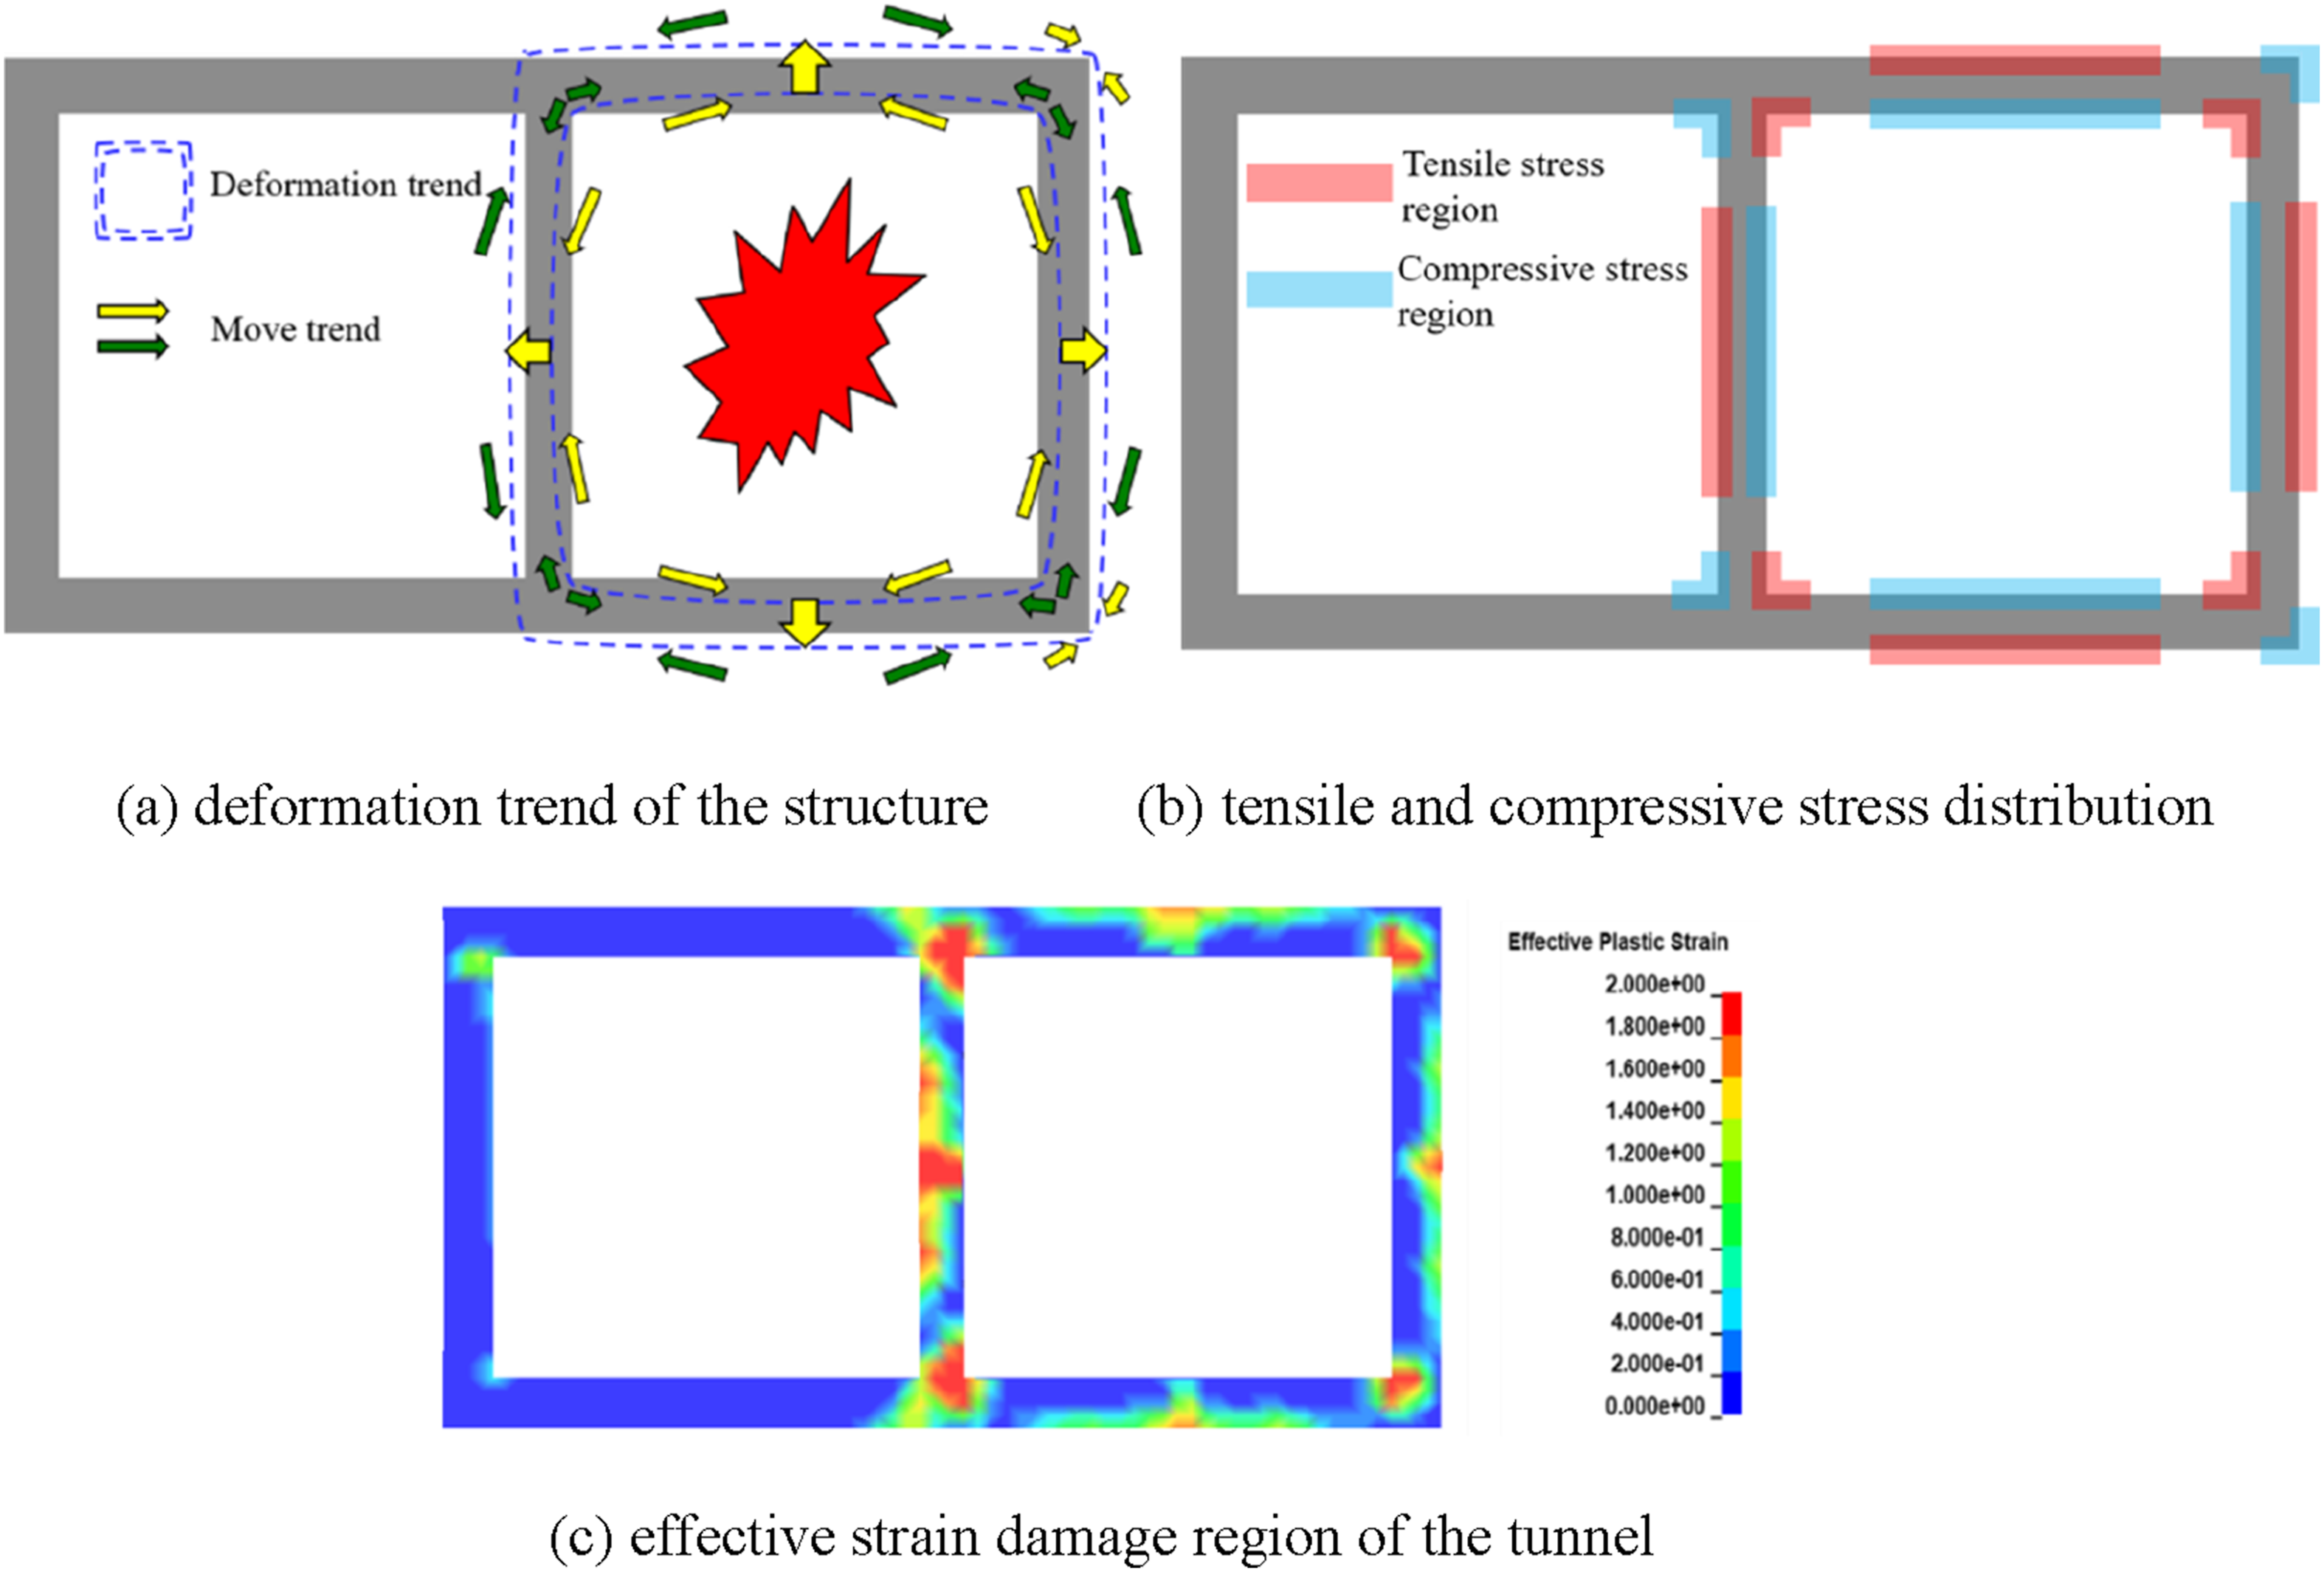
Von-Mises stress response
The Von-Mises stress (V-M stress) from plasticity theory is used as the primary indicator to describe the overall stress state and damage degree of the Lagrange elements (Jiang et al., 2020). The measuring points for V-M stress are shown in Figure 11. Distribution of test elements for Von-Mises stress response.
The time histories of the effective stress for the positions at four walls and four corners are depicted in Figures 12 and 13 respectively. The stress response is divided into three phases: initial peaking, mid-range fluctuations, and late attenuation. In the early stage of the explosion, the V-M stress at each point rapidly reaches its maximal value and then drops sharply. The average peak values of stress are 4.875 MPa and 4.363 MPa, respectively. This is because under the effect of explosion load, the localized stress is concentrated in a specific region. When the peak stress in this region exceeds the load-bearing capacity of the material, small cracks or plastic deformations will be initiated. Part of the energy is released through damage, resulting in a significant decrease in effective stress. This phenomenon is consistent with the effective strain damage distribution shown in Figure 9(c). Subsequently, the V-M stress value increases, the multiple superposition and interference of shock wave and reflected wave. Simultaneously, the tunnel walls undergo free vibration due to inertia caused by the explosion wave. During the vibration process, the stress fluctuates periodically until the vibration gradually attenuates and stabilizes. Time histories of the effective stress for the test elements at four walls. Time histories of the effective stress for the test elements at four corners.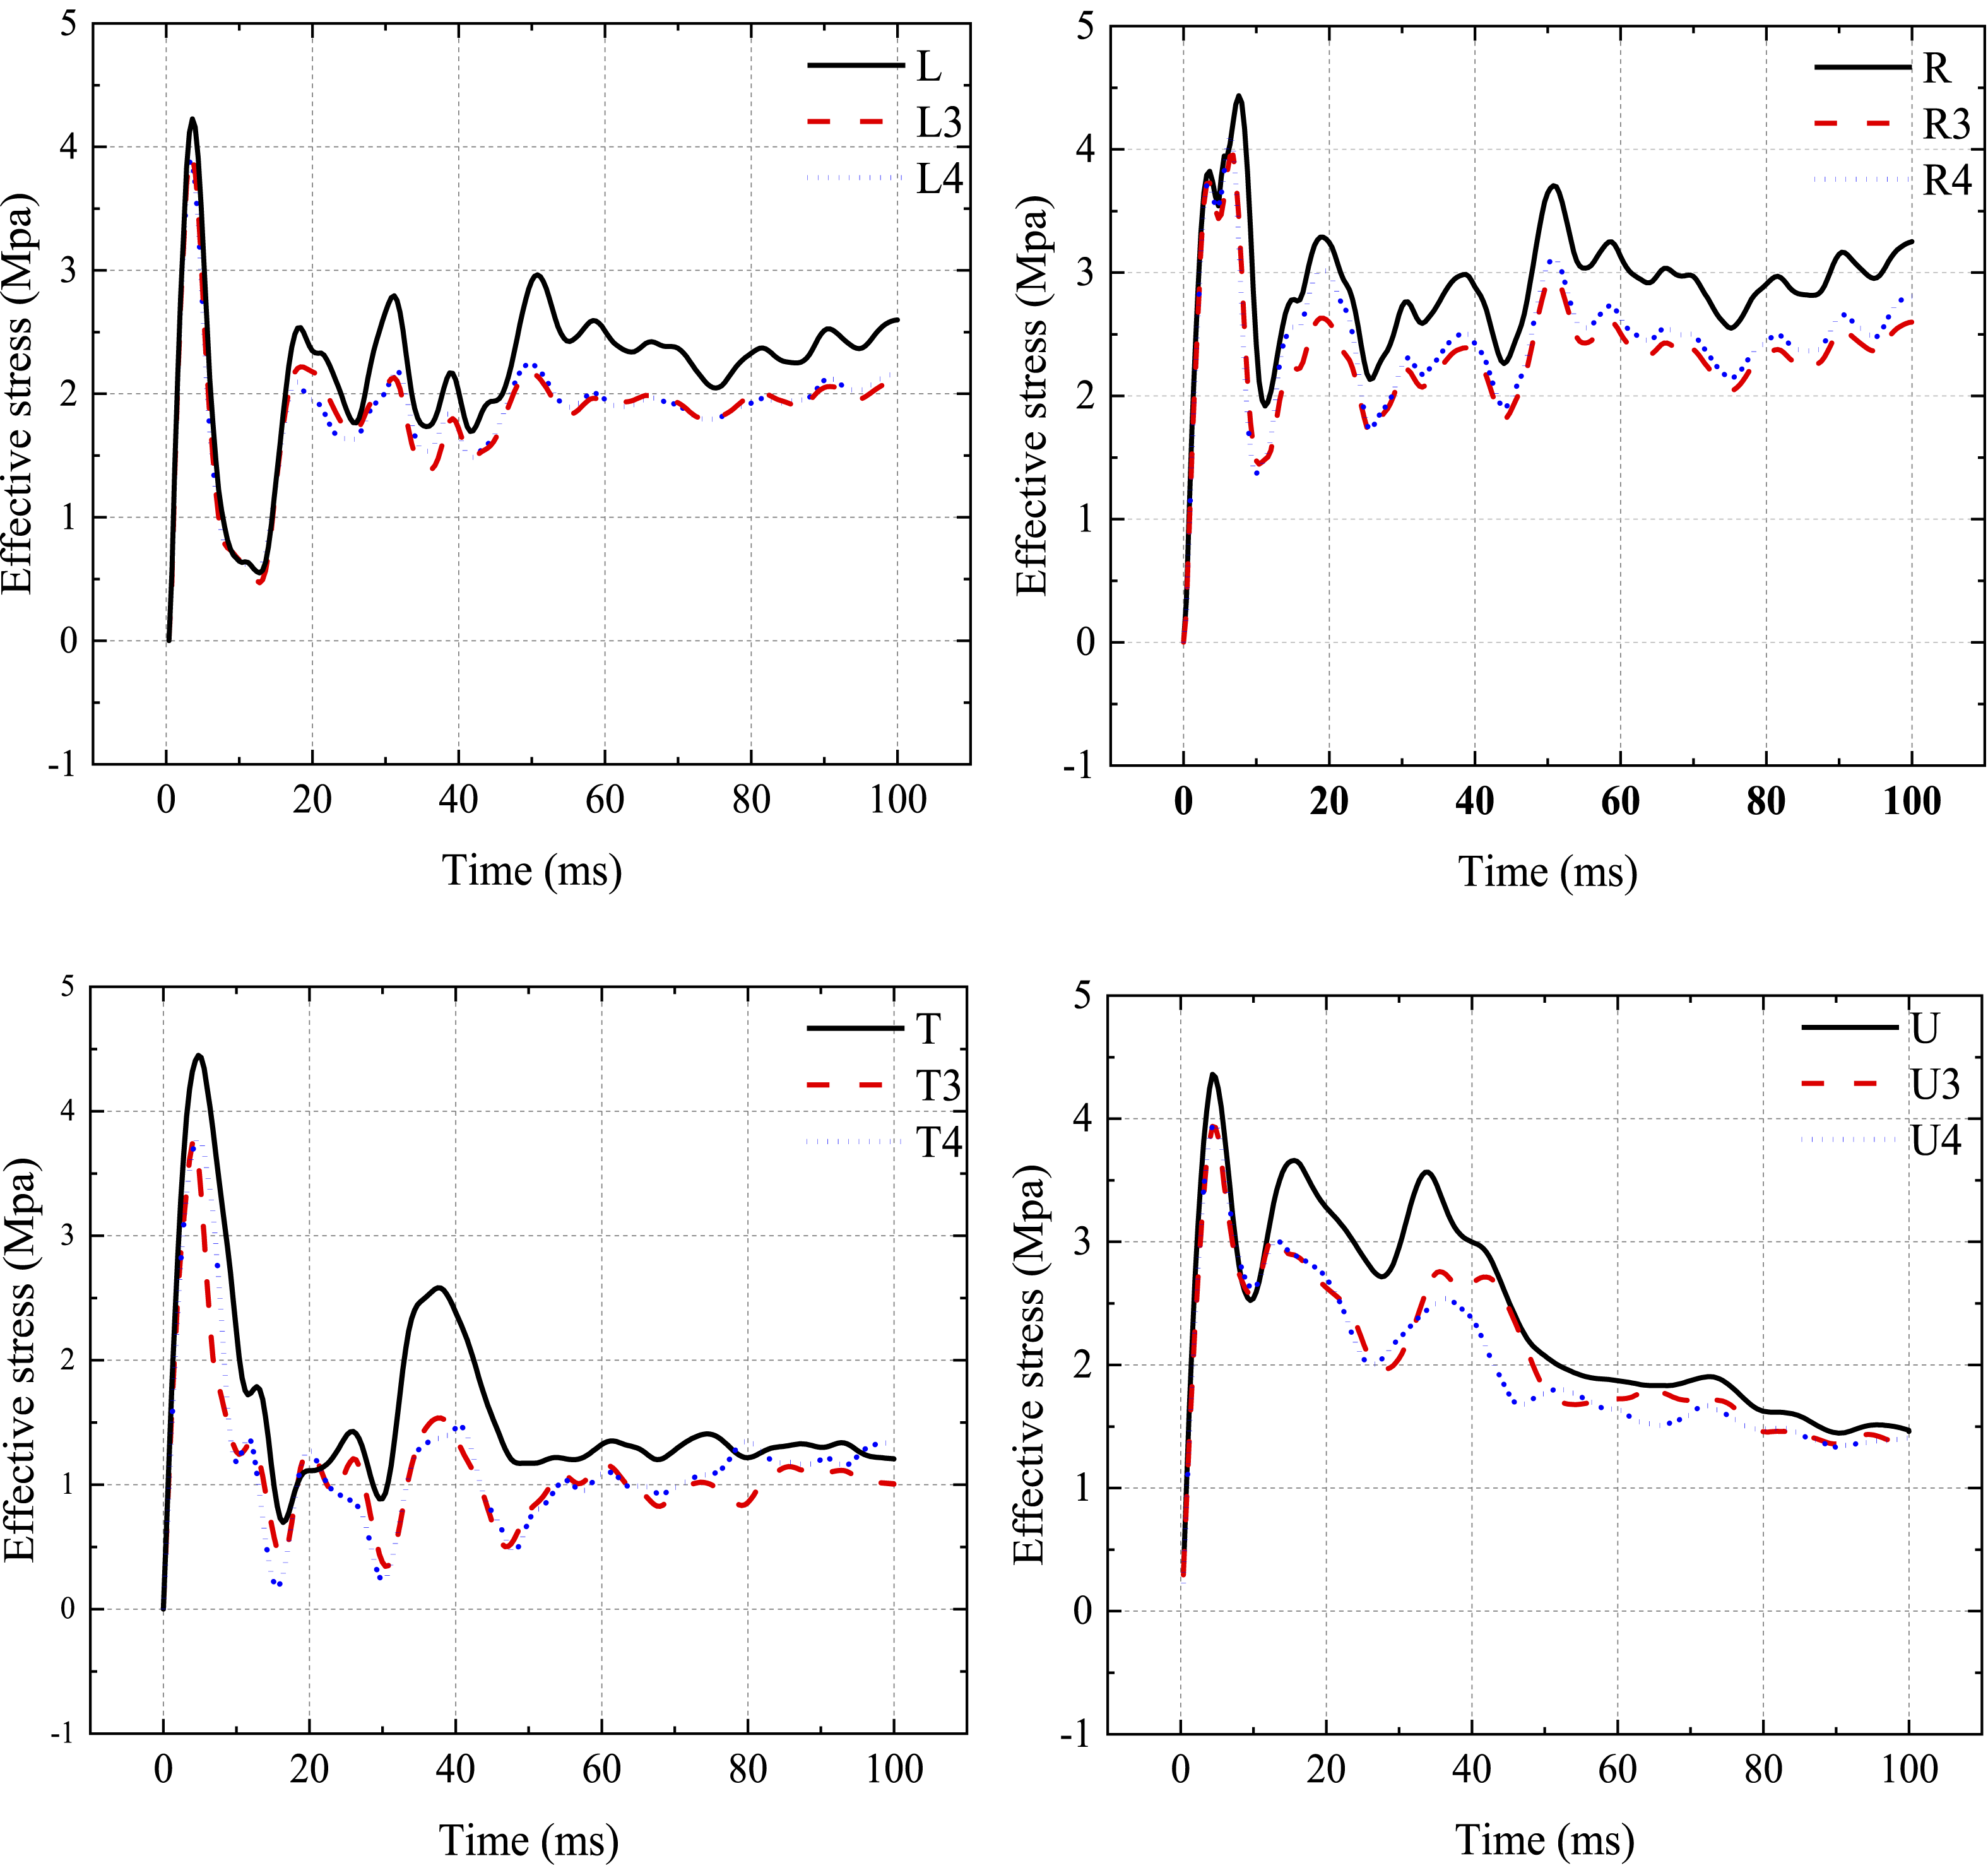
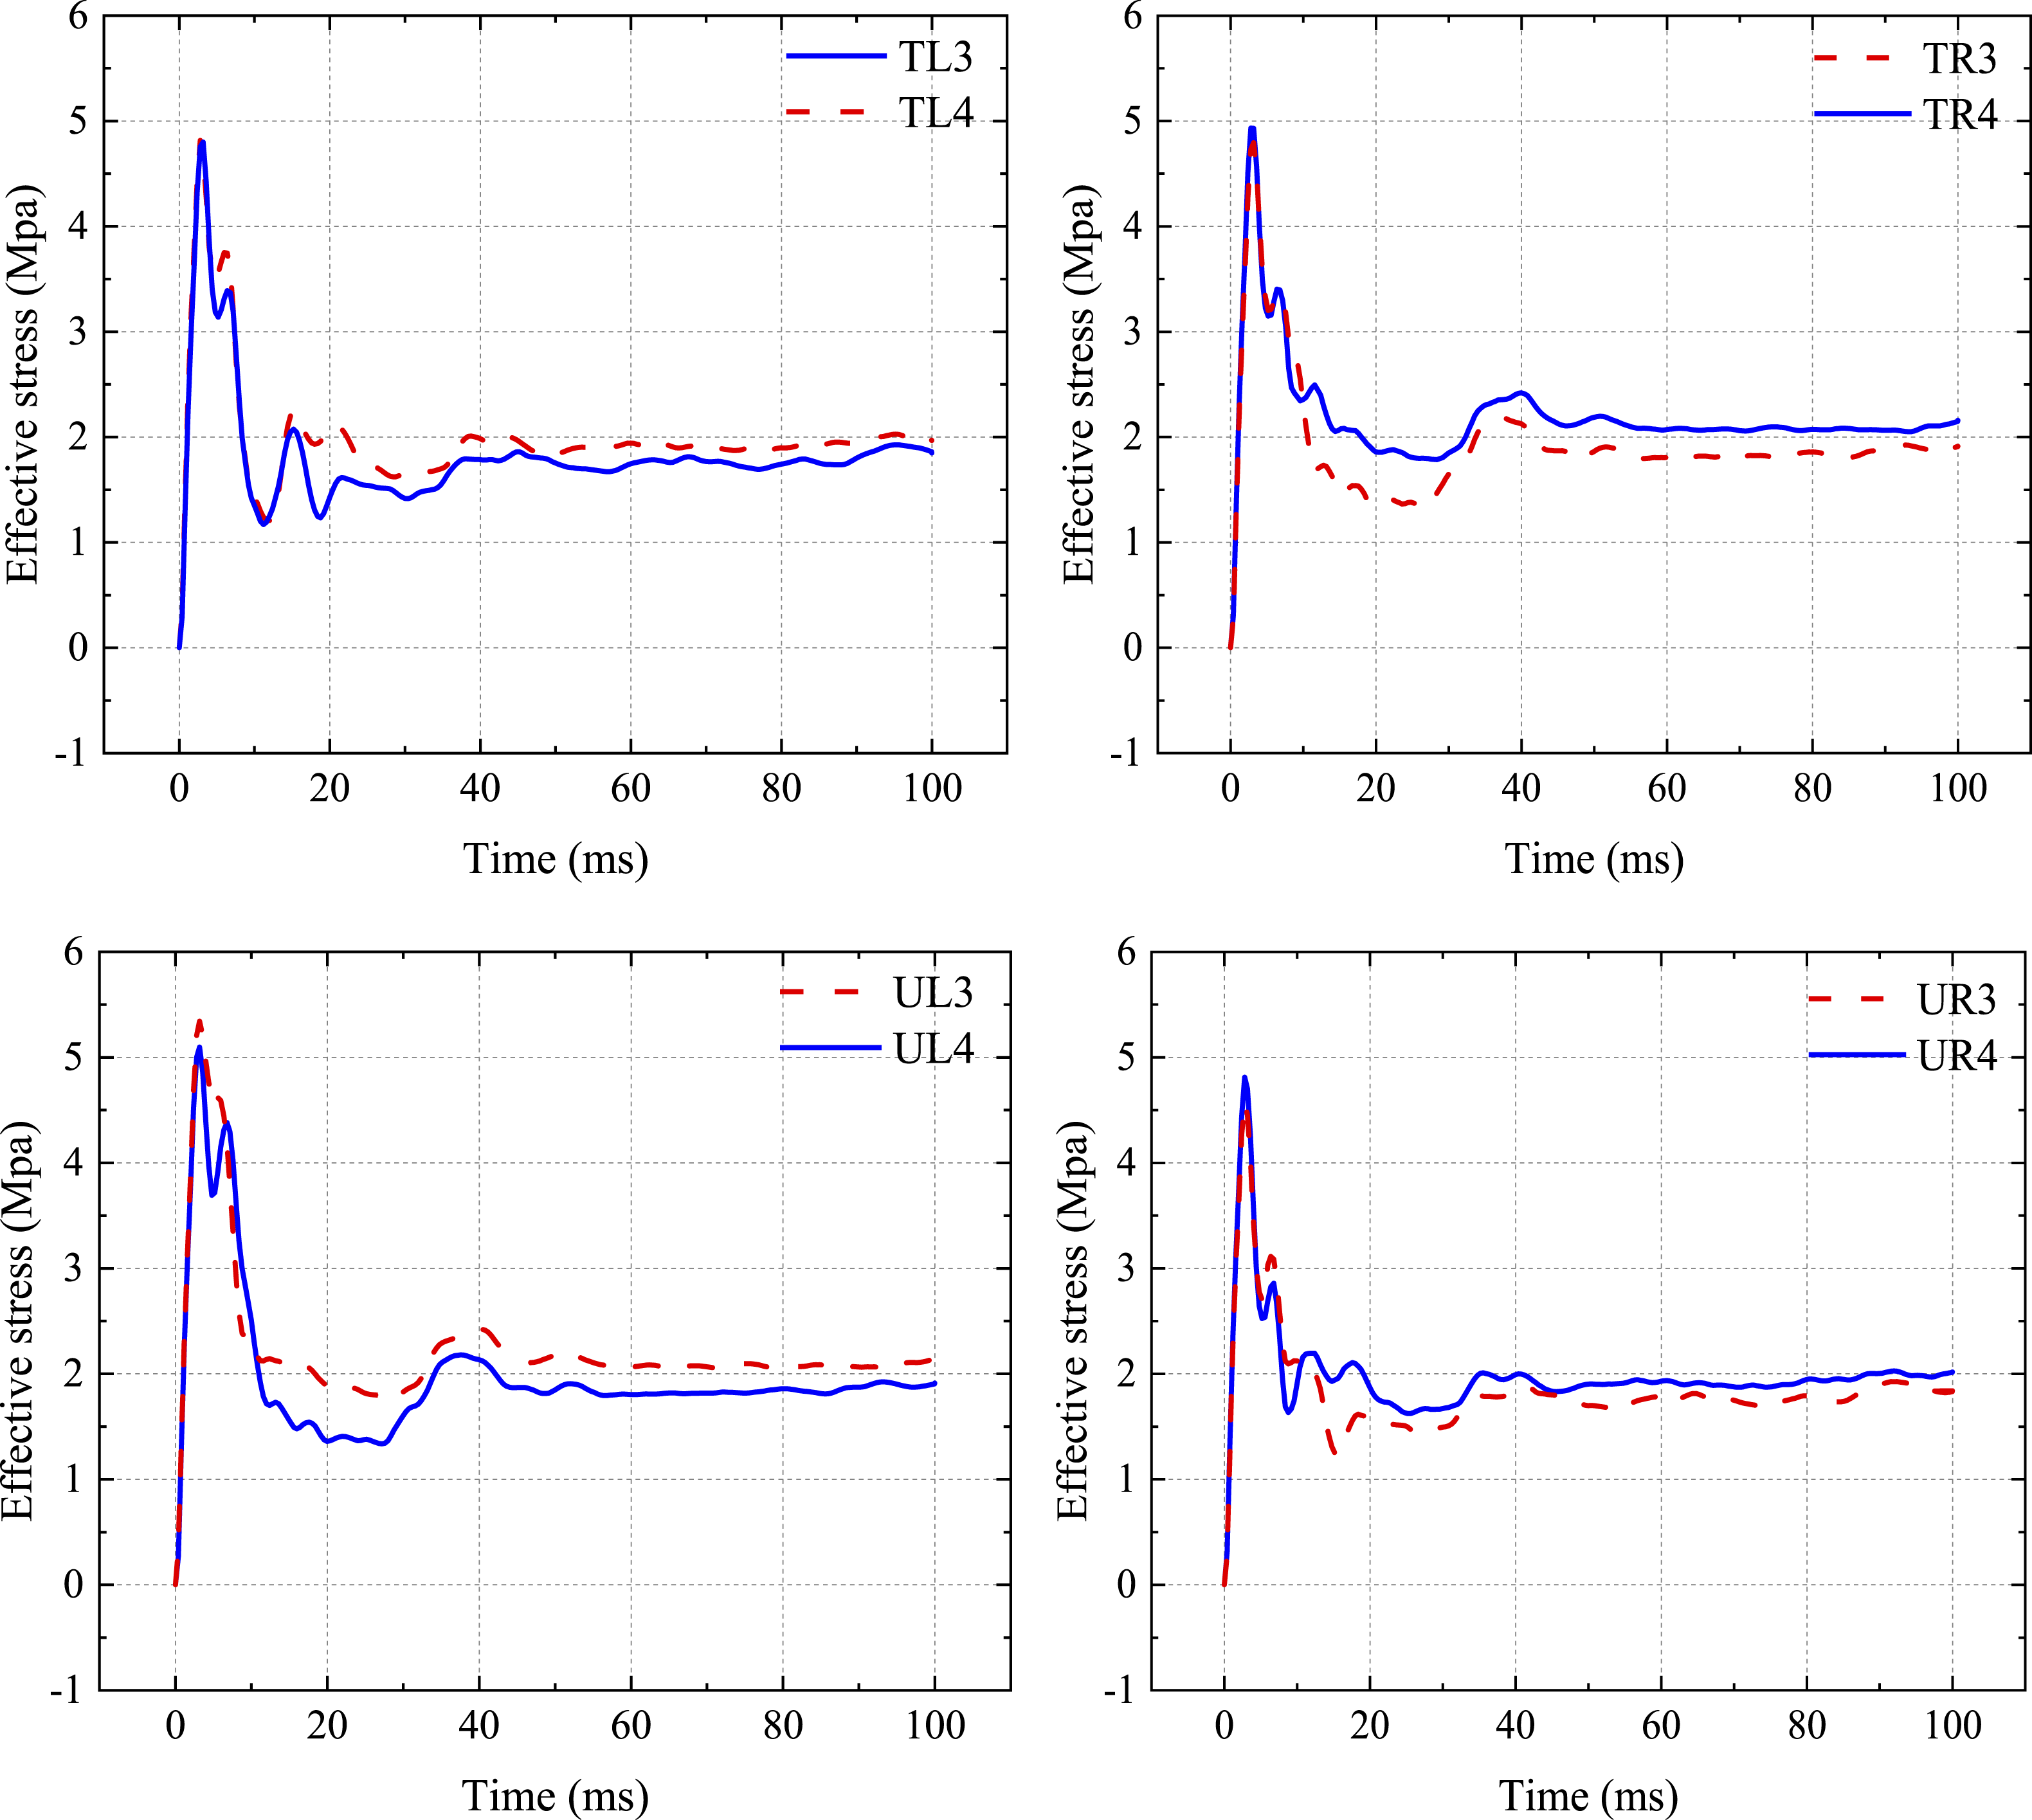
Furthermore, the maximal values of V-M stress at the four walls are lower than those at the corners. For instance, the maximum V-M stress at point L is 4.23 MPa, while it is 4.81 MPa at TL4, with an increasing ratio of 13.7%. When the explosion wave reaches the corner, the geometric discontinuity leads to a significant stress concentration. Compared to the four walls, the inner corners have a restricted wrap-around space, resulting in a restricted shock wave spread. The shock wave energy is concentrated and undergoes a dramatic change at the corners. When the shock wave arrives at the inner corner, it is reflected and converges from both walls, creating a localized high-pressure zone and a high effective stress. In contrast, at the four walls, the propagation direction of the explosion wave is relatively single, mainly manifested as the vertical impact. The pressure distribution is relatively uniform, so the stress peaks in the walls are lower than those in the corners. Therefore, for the design of utility tunnel, the inner corner should be structurally strengthened, such as increasing the thickness of the wall or using the high-strength materials.
In the subsequent stage of the explosion, the fluctuation amplitudes of the V-M stress at the four walls are notably larger than those at the corners. The four walls mainly withstand vertical impact and are directly subject to explosive load. In contrast, due to the constraints of surrounding structures (such as soil, intersecting walls, etc.) in the corner area, part of the impact energy is dispersed, which weakens the amplitude of stress fluctuations.
Bending utility tunnels with different bending angles
Model building and boundary condition
In the practical engineering, the underground utility tunnels are usually designed as complex multi-bend structure to adapt to terrain and space requirement. In this study, thebending tunnels with bending angles of (I) 15°, (II) 30°, (III) 45°, (IV) 60°, and (V) 90° are considered. Figure 14 shows the geometric model of gas explosion in utility tunnel with a bending angle of 30°. The lengths of the tunnel sections before and after the bending point are set to 10 m. The explosive gas volume is 2 m × 2 m × 5 m. The boundary condition for the end section is specified as non-reflective, while the front section adopts the closed boundary condition. Geometric modeling of gas explosion in bending tunnel with a bending angle of 30°(unit: cm).
Flow field
Figure 15 shows the shock wave profiles near the bends at different angles. There is a diffraction phenomenon as the high-pressure gas passes through the bending regions. At bending angles of 45°, 60°, and 90°, the pressure distribution becomes uneven near the bending corner due to reflection and turbulence. After the bending corner, a low-pressure zone is formed in the inner side of the tunnel, while a high-pressure zone is formed in the outer side of the tunnel. This is because when the shock wave reaches the inner corner, the space suddenly increases. When the shock wave bypasses the inner bending corner, the wave front diffuses in a near-arc shape toward the main tunnel. Meanwhile, the shock wave at the outer corner is obstructed by the tunnel wall. The gas products returns to the wall to form a high-density gas layer near the front end of the outer corner, resulting in a rapid pressure increase in this region. For the 15° and 30° bending tunnels, due to the small bending angle, the longitudinal geometric shape of the tunnel changes smoothly. When the shock wave passes through the bending corner, the gas flow has a good continuity, with smaller variations in flow speed and direction. This reduces the shear force and the possibility of vortex formation, thereby avoiding the formation of turbulent areas. The high- and low-pressure zones are typically noticeable in bending tunnels with angles greater than 45°. As the bending angle increases from 45° to 90°, the amount of reflection increases. The overpressure peak in the high-pressure zone behaves almost like a direct reflection of the shock wave. The range of the low-pressure zone expands as the angle increases, particularly for the bending angle in the range of 45° to 90°. Flow field profiles at tunnel bends of (I) 15°, (II) 30°, (III) 45°, (IV) 60°, and (V) 90°.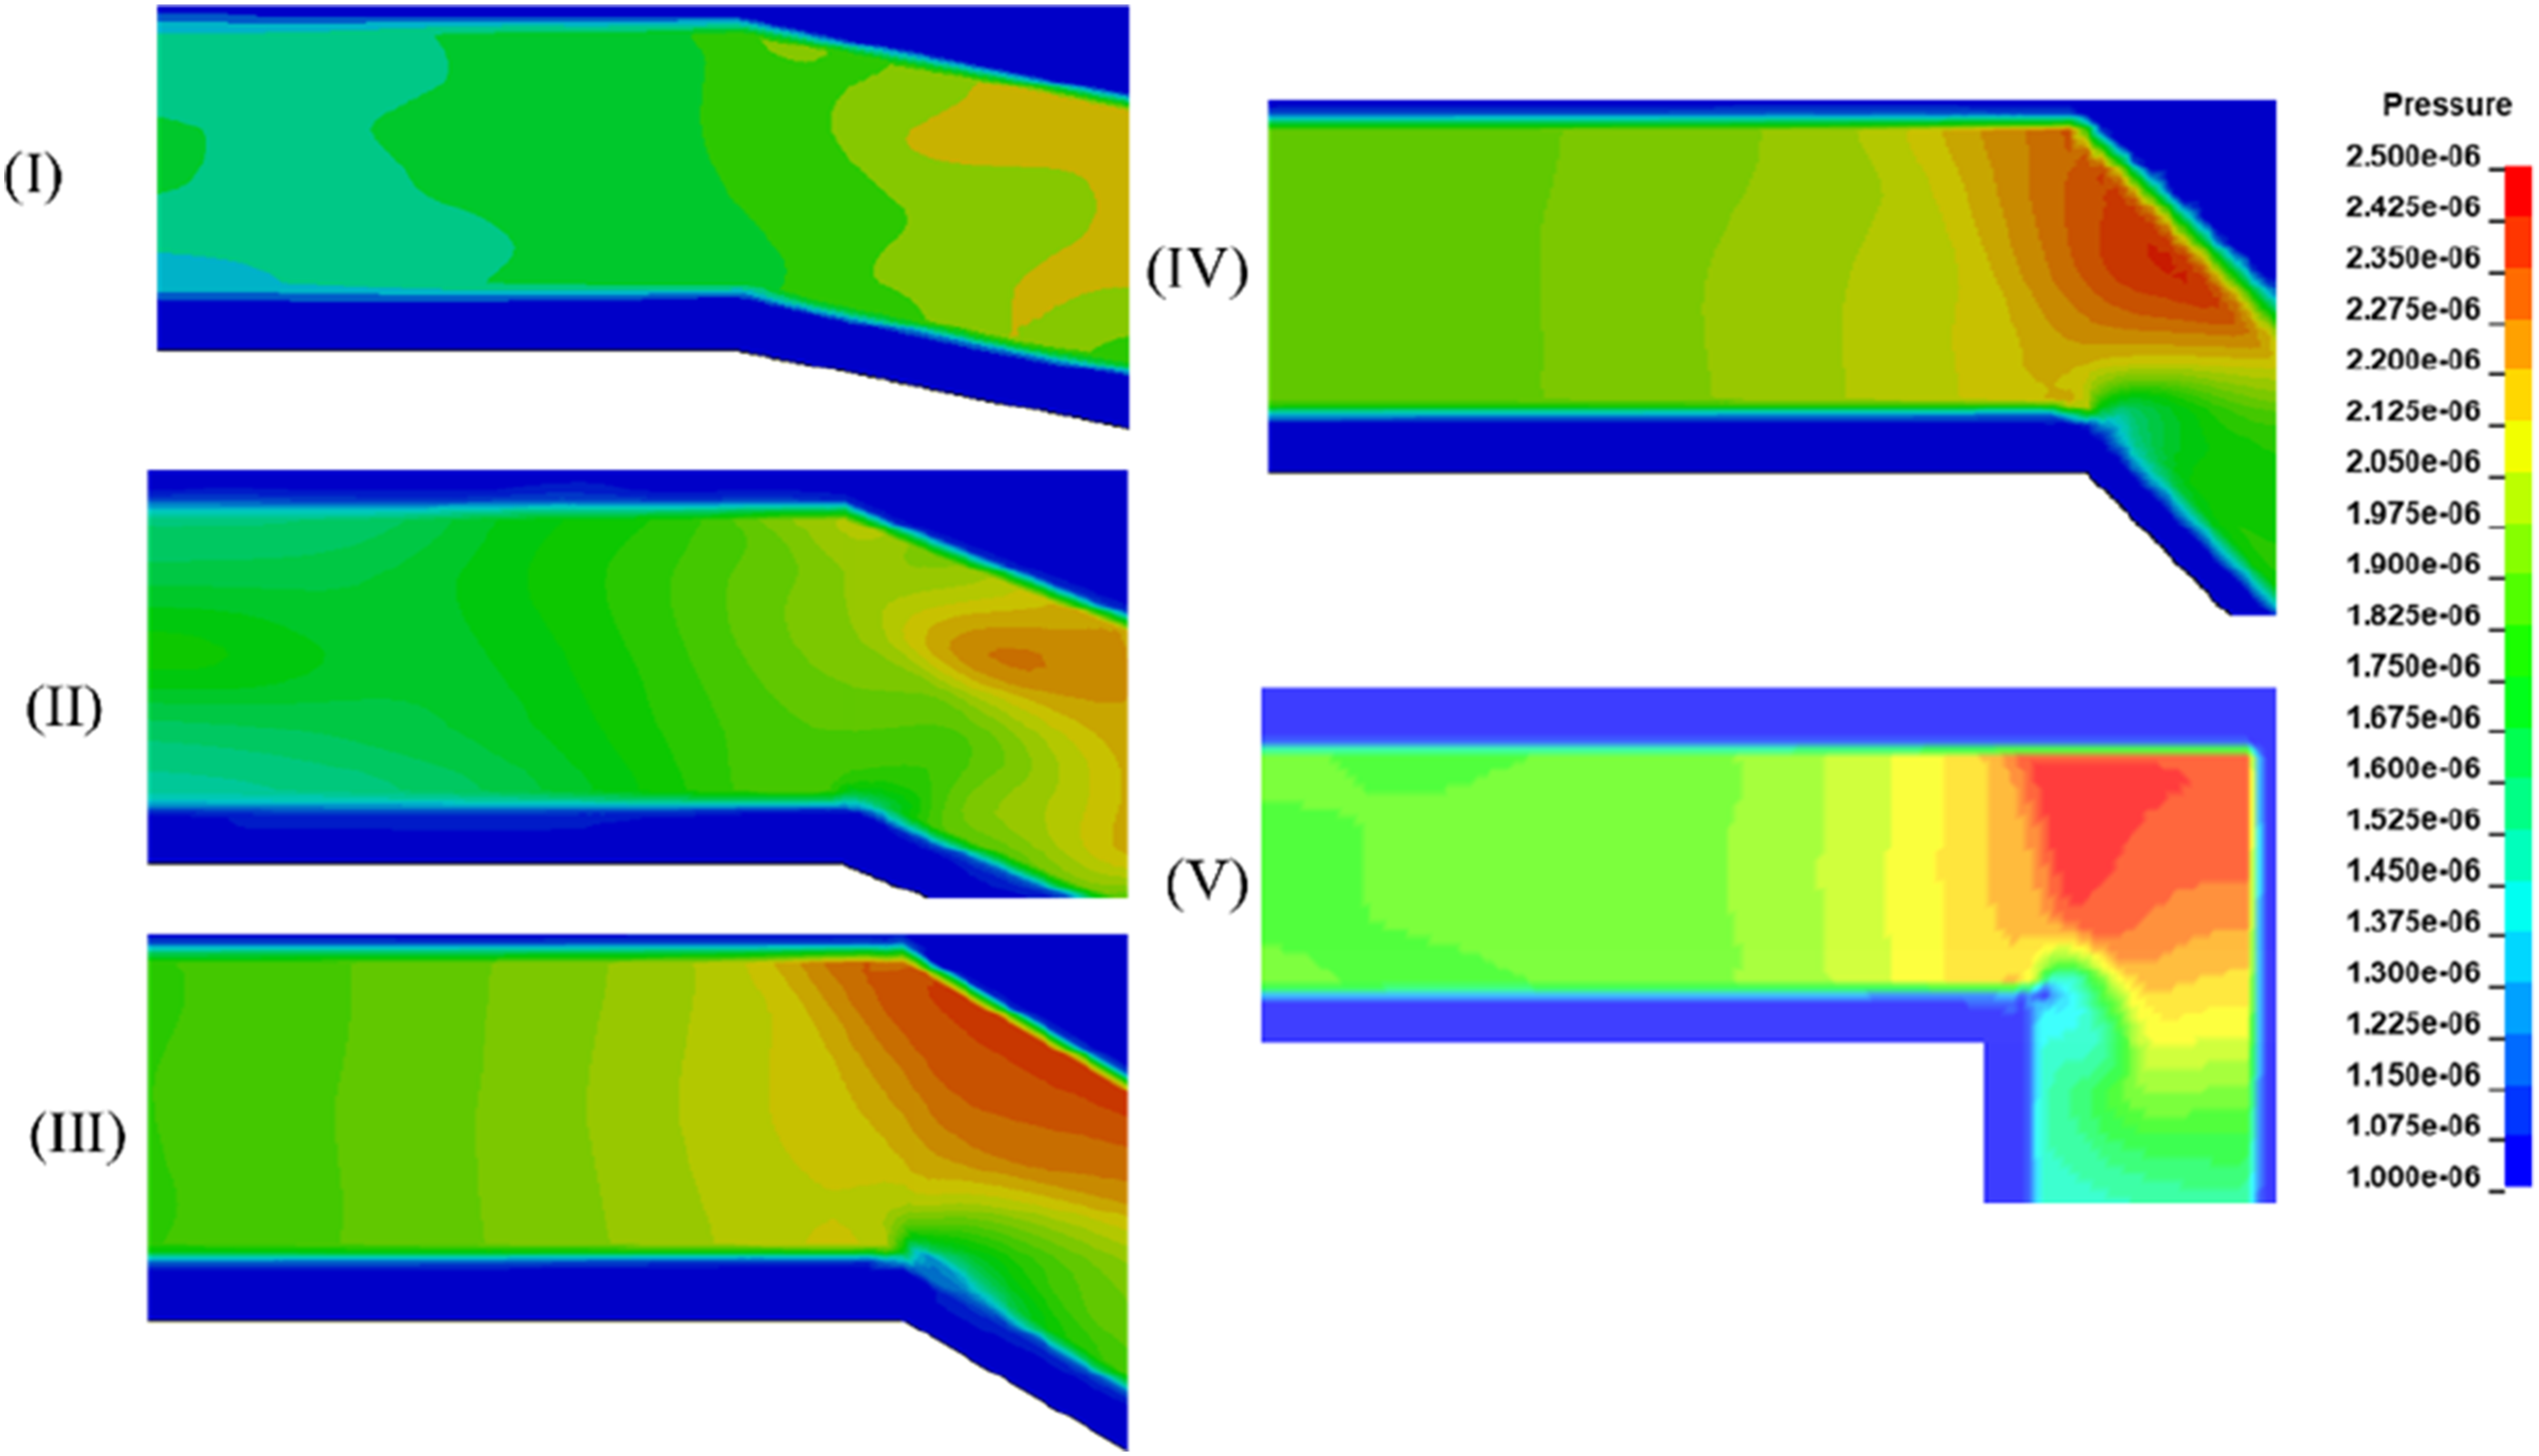
Damage response
As shown in Figure 16, the bending angle has a significant impact on the distribution and extent of damage to the tunnel. At the small bending angles of 15° and 30°, the damage area is evenly distributed, and the overall damage level is relatively slight. In contrast, at the large bending angles of 45°, 60°, and 90°, the damage is concentrated in front of and at corners. For the structures with small bending angles, due to the smooth geometric transition of the tunnel, the shock wave mainly propagates along the main channel. The energy loss is less and the wave peak is weak, so the damage is relatively slight and evenly distributed. In contrast, for the structures with large bending angles, the shock wave propagation path is strongly altered, causing the multiple reflection and accumulation of the wave at the bend. The multiple overlapping of reflected wave and the primary shock wave at larger bending angle leads to a higher pressure peak at the outer corner, increasing stress concentration of the local structure. In some cases, this may even directly affect the corner of adjacent chambers. Noted that the multiple reflections at the bend dissipate the shock wave energy. As a result, when the shock wave in the tunnel beyond the bend transitions back to a plane wave, its intensity is lower than that in a straight tunnel, exhibiting a certain “protective” effect. This leads to a relatively slight damage in the tunnel after the bend. Damage contour of tunnel at (I) 15°, (II) 30°, (III) 45°, (IV) 60°, and (V) 90°.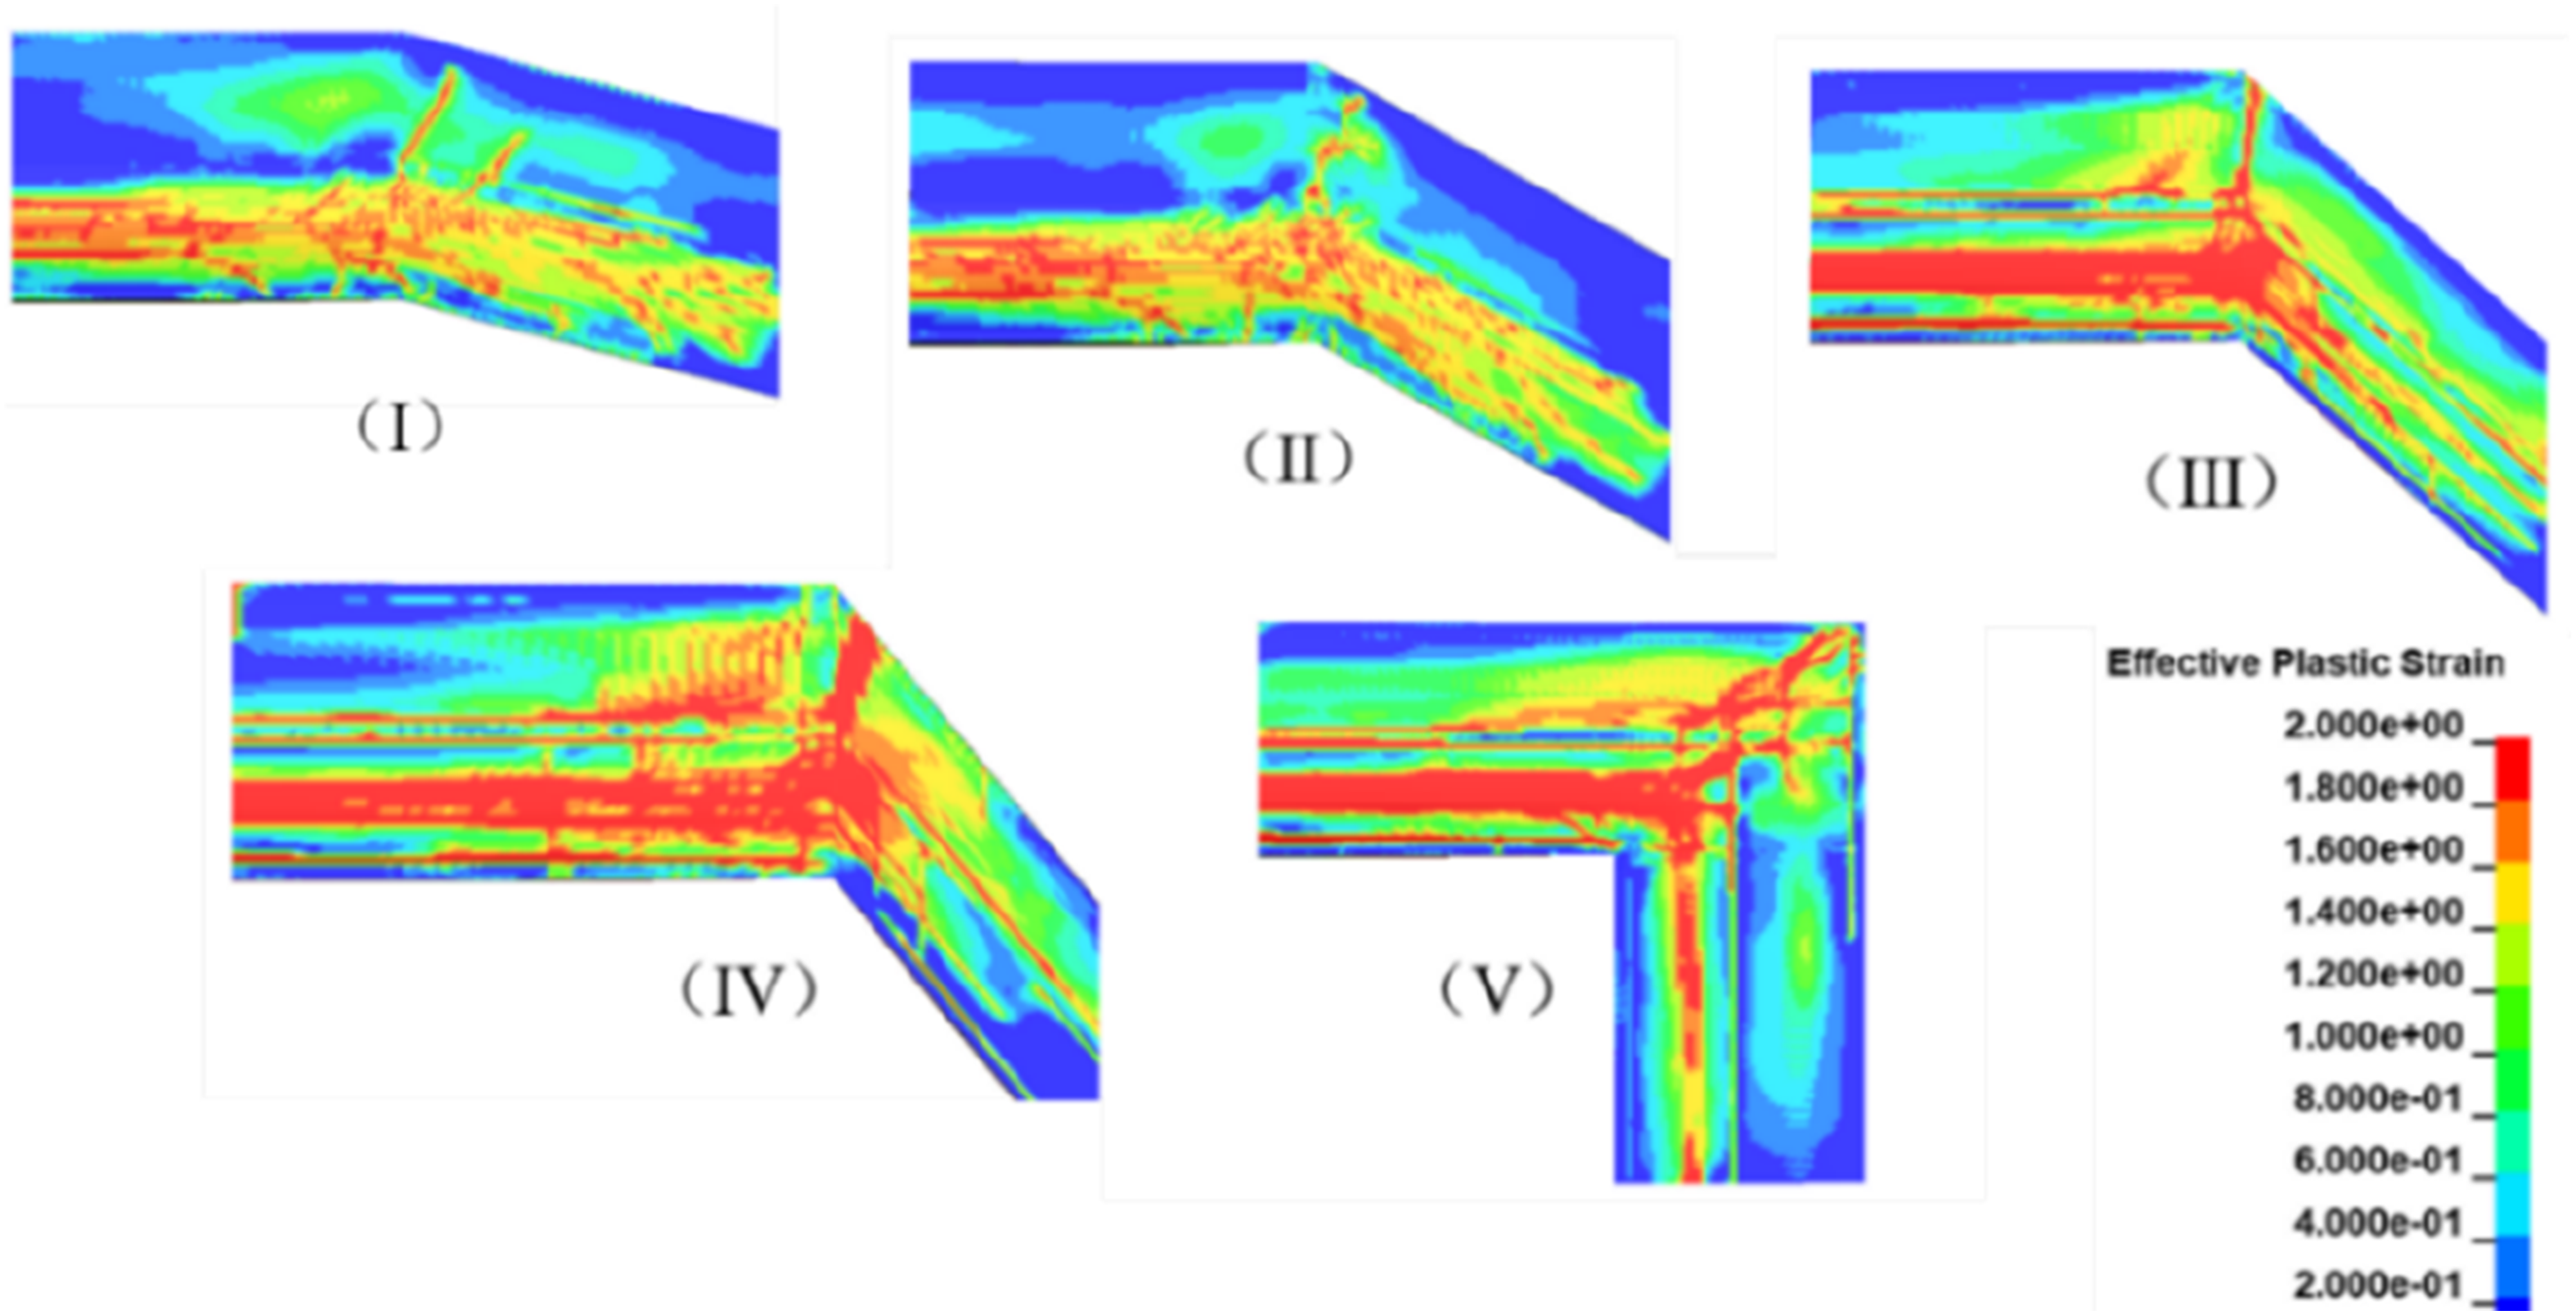
Figure 17 shows the peak pressure and displacement at the four corners of the utility tunnel under different bending angles. Compared with the baseline pressure of straight section of tunnel (0.255 MPa), the pressure gradually increases with the bending angle. The pressure reaches 0.301 MPa for 90° bend, with an increasing ratio of 18%. The displacement response shows a similar trend: the displacement is 8.86 mm for the straight section, but it increases to 10.36 mm for the 90° bend. The potential reasons are summarized. For small-angle bends, the shock wave propagation path is gentle, the flow field disturbance is small. As the bending angle increases, the collision angle between the shock wave and the tunnel wall increases, resulting in the more intense reflection and interaction of the shock wave. Consequently, there is a higher pressure concentration in local area, which in turn causes a larger displacement of the structure. For the 90° bend, the propagation path of the explosion wave changes dramatically, so the pressure and displacement attain the maximal values. Pressure and displacement changes at different bending angles.
Conclusion
A coupled numerical model integrating the ALE algorithm with the finite element method was developed to investigate explosion pressure and structural dynamic response in a double-chamber utility tunnel. The main conclusions are as follows: (1) In the event of a gas explosion, the shock wave rapidly propagates along the tunnel axis and spreads outward. The pressure near the ignition source sharply rises to a peak and then decays into a low-amplitude oscillatory state. The peak pressure decreases from 0.314 MPa at 6 m to 0.215 MPa at 30 m, with a reduction of 31.53%. This indicates that the near-field region is subjected to more severe explosion loads and should be prioritized as a key protection zone in engineering design. (2) The displacement, velocity, and effective stress responses of the tunnel structure are analyzed. The maximum displacement at the intermediate partition reaches 14.87 mm. Compressive and tensile stress zones appear alternately, with stress concentration mainly located at the inner corners and outer walls. The average peak compressive and tensile stresses are 4.875 MPa and 4.363 MPa, respectively. These results suggest that structural reinforcement should be prioritized at inner corners and key load-bearing components, and measures such as increasing local stiffness or adding reinforcement layers can effectively improve structural resistance to explosions. (3) The bending angle has a significant influence on shock wave propagation. At bending angles of 15° and 30°, the pressure remains relatively stable. However, at 45°, 60°, and 90°, high-pressure turbulent zones are more likely to form at the bends, leading to increased structural damage. Compared with the baseline pressure of 0.255 MPa in the straight section, the pressure increases to 0.301 MPa at 90°, with an increase of 18%. It is therefore recommended to avoid large-angle bends in tunnel design; if unavoidable, local strengthening and protective measures should be implemented at bending sections to mitigate blast effects. (4) The displacement response shows a similar trend, increasing from 8.86 mm in the straight section to 10.36 mm at the 90° bend. In addition, at small bending angles (15° and 30°), damage is relatively uniform and mild, whereas at larger angles (45°–90°), damage becomes concentrated at the tunnel front and bends. This indicates that high-risk regions should be clearly identified in design, and targeted reinforcement strategies should be adopted to reduce localized damage.
This study has several limitations. First, the numerical model assumes homogeneous methane-air mixtures and ideal gas behavior, simplifying real explosion dynamics. Second, material models idealize concrete, steel and soil behavior under high-strain rates, without considering aging or cracking. In future work, the following directions are recommended: (1) incorporating non-uniform mixture distributions and turbulence models to better simulate realistic gas explosion dynamics; (2) exploring the effects of structural reinforcement strategies, such as fiber-reinforced concrete or energy-absorbing linings, on mitigating explosion-induced damage.
Footnotes

Funding
This work is supported by Huzhou public welfare application research project (No. 2024GZ55), Special Project for High-level Talents of Huzhou Vocational and Technical College (No. 2024TS02), and State Key Laboratory of Precision Blasting and Hubei (Wuhan) Institute of Explosion and Blasting Technology (No. PBSKL2023A14).
Declaration of Conflicting Interests
The authors declared no potential conflicts of interest with respect to the research, authorship, and/or publication of this article.