



Abstract
Background:
Comparative evidence on 24-month clinical outcomes and biomarker trajectories with semaglutide, empagliflozin, and sitagliptin in adults with type 2 diabetes (T2D) and obesity remains limited.
Objectives:
To compare 24-month clinical outcomes and longitudinal biomarker trajectories among semaglutide, empagliflozin, and sitagliptin in people with T2D and obesity.
Design:
Multicenter retrospective cohort study.
Methods:
Using TriNetX, we performed an active-comparator, new-user study with three prespecified 1:1 propensity score-matched contrasts: semaglutide versus empagliflozin, semaglutide versus sitagliptin, and empagliflozin versus sitagliptin. Follow-up was intention-to-treat for 24 months. Multiplicity was addressed with Benjamini–Hochberg false discovery rate correction within two prespecified families: (i) clinical time-to-event endpoints (all-cause mortality, MACE, heart failure, MAKE, MALO, atrial fibrillation, stroke) within each comparator pairing, and (ii) window-level laboratory contrasts within each biomarker at baseline, 6, 12, and 24 months.
Results:
Versus empagliflozin, semaglutide was associated with lower all-cause mortality (hazard ratio [HR] 0.59, 95% confidence interval [CI] 0.51–0.69), major adverse cardiovascular events (MACE; HR 0.76, 95% CI 0.66–0.88), and heart failure (HR 0.62, 95% CI 0.54–0.70). Versus sitagliptin, semaglutide was associated with lower all-cause mortality (HR 0.34, 95% CI 0.27–0.42), MACE (HR 0.64, 95% CI 0.51–0.81), and heart failure (HR 0.54, 95% CI 0.43–0.67). Empagliflozin versus sitagliptin showed lower all-cause mortality (HR 0.48, 95% CI 0.40–0.58) and MACE (HR 0.74, 95% CI 0.59–0.92), whereas heart failure did not differ significantly.
Conclusion:
In matched cohorts with T2D and obesity, semaglutide was associated with lower 24-month mortality and heart failure risk than empagliflozin, and both semaglutide and empagliflozin were associated with lower mortality and MACE than sitagliptin.
Trial registration:
Not applicable (retrospective cohort); Institutional Review Board approval CS2-24004, Chung Shan Medical University Hospital.
Plain language summary
People with type 2 diabetes and obesity often need medicines that address both metabolic control and long term cardiovascular and kidney risks. Comparative evidence from routine care is still limited, especially when clinical outcomes and laboratory patterns are evaluated together. We studied adults who newly started semaglutide, empagliflozin, or sitagliptin to describe how these treatments were associated with outcomes and biomarker changes over time. We used deidentified electronic health records from the TriNetX US Collaborative Network. Among 3,981,497 eligible individuals, we constructed three active comparator cohorts and applied one to one propensity score matching. Patients were followed for up to 24 months using an intention to treat approach. Clinical outcomes included all cause mortality, major adverse cardiovascular events, heart failure, and a kidney composite outcome. Laboratory markers were summarized in prespecified windows around 6, 12, and 24 months, including glycemic measures, lipids, inflammatory markers, cardiac stress markers, and liver and kidney function. Mean corpuscular volume was processed as a negative control laboratory marker to help evaluate residual confounding. Across matched cohorts, semaglutide compared with empagliflozin was associated with lower risks of all cause mortality, major adverse cardiovascular events, and heart failure over 24 months. When compared with sitagliptin, both semaglutide and empagliflozin were associated with lower risks of mortality and major adverse cardiovascular events. The kidney composite outcome showed a different pattern than the cardiovascular outcomes, supporting interpretation in terms of domain specific profiles. This observational study describes associations and may be influenced by unmeasured factors and incomplete laboratory capture.
Introduction
Type 2 diabetes (T2D) and obesity frequently coexist and interact pathophysiologically, contributing to a heightened risk of cardiovascular, renal, and hepatic complications through overlapping metabolic and inflammatory pathways.1,2 As the global burden of obesity continues to rise, there is increasing need for therapies that provide benefits extending beyond glycemic control alone. 3
Glucagon-like peptide-1 receptor agonists (GLP-1 RAs), sodium-glucose cotransporter-2 inhibitors (SGLT2is), and dipeptidyl peptidase-4 inhibitors (DPP-4is) are widely used in the management of T2D, but they differ substantially in their effects on weight, inflammation, cardiorenal physiology, and long-term clinical outcomes.4–7 Semaglutide, a GLP-1 RA, has shown robust effects on weight reduction and glycemic control, with emerging evidence supporting broader cardiovascular and kidney benefits.8–10 Empagliflozin has demonstrated clear cardiorenal protection, particularly in heart failure and chronic kidney disease settings, whereas sitagliptin is generally regarded as cardiometabolically neutral apart from glucose lowering.11,12 These differences suggest that comparative evaluation across these three drug classes may offer clinically useful insight in people with concurrent T2D and obesity.
Unlike SUSTAIN-6, LEADER, EMPA-REG OUTCOME, and FLOW, which randomized higher-risk patients under protocol-specified conditions and reported single-agent versus placebo outcomes, our active-comparator new-user design captures 24-month clinical outcomes together with serial biomarker trajectories under routine-care prescribing, allowing head-to-head comparisons across three distinct drug classes in the same population.11,13–16 In parallel, prior real-world effectiveness studies have often focused on short-term glycemic and weight outcomes, treatment utilization, or safety, with limited integration of serial biomarker trajectories that may help contextualize organ-specific risk over time.17–19
To address this gap, we conducted a multicenter retrospective cohort study using a new-user, active-comparator design within the TriNetX network to compare semaglutide, empagliflozin, and sitagliptin in adults with T2D and obesity. By jointly evaluating 24-month clinical outcomes and longitudinal biomarker trajectories under routine-care prescribing, this study aimed to characterize how these three therapeutic classes differ across cardiovascular, kidney, hepatic, metabolic, inflammatory, and cardiac-stress domains in real-world practice.
Material and methods
Ethical approval and data source
We conducted a retrospective, multicenter cohort study using de-identified electronic health records (EHRs) from the TriNetX US Collaborative Network, which aggregates data from 70 participating health systems. The platform standardizes diagnoses (ICD-10-CM), procedures (CPT, ICD-10-PCS), medications (RxNorm), and laboratory measurements (LOINC/TNX), and applies small-cell masking (<11) to preserve privacy. The Institutional Review Board at Chung Shan Medical University Hospital approved the protocol with a waiver of informed consent (CS2-24004) under 45 CFR 46.104(d)(4). All procedures adhered to the Declaration of Helsinki.
Study population and design
Adults with type 2 diabetes (ICD-10-CM E11) and obesity (ICD-10-CM E66 or BMI ⩾ 27 kg/m2) who newly initiated semaglutide, empagliflozin, or sitagliptin between January 1, 2017, and September 30, 2025, were eligible (Figure 1). We used a new user active comparator design. Eligible patients were required to have no prescriptions for GLP-1 RA, SGLT2 inhibitor (SGLT2i), or DPP-4 inhibitor (DPP-4i) during the 6-month washout period before the index date. The index date was the date of the first qualifying prescription for semaglutide, empagliflozin, or sitagliptin. Patients who initiated more than one of these drug classes on the index date were excluded. All analyses followed an intention to treat approach. After cohort entry, later discontinuation, switching between these drug classes or addition of other glucose lowering agents did not change the original exposure assignment. The index date was the first recorded prescription for the assigned agent. Three parallel 1:1 comparisons were prespecified: semaglutide versus empagliflozin, semaglutide versus sitagliptin, and empagliflozin versus sitagliptin. Participants were followed from the index date until the earliest of 24 months of follow-up, death, the last recorded clinical encounter or the administrative end of data availability in the contributing health system. Key exclusions were type 1 diabetes, prior bariatric surgery or organ transplantation, end-stage kidney disease/dialysis, HIV infection, prior exposure to any study drugs within 6 months before index, and recent (⩽3 months) major cardiorenal events. Analyses followed an intention-to-treat approach (Table S1).
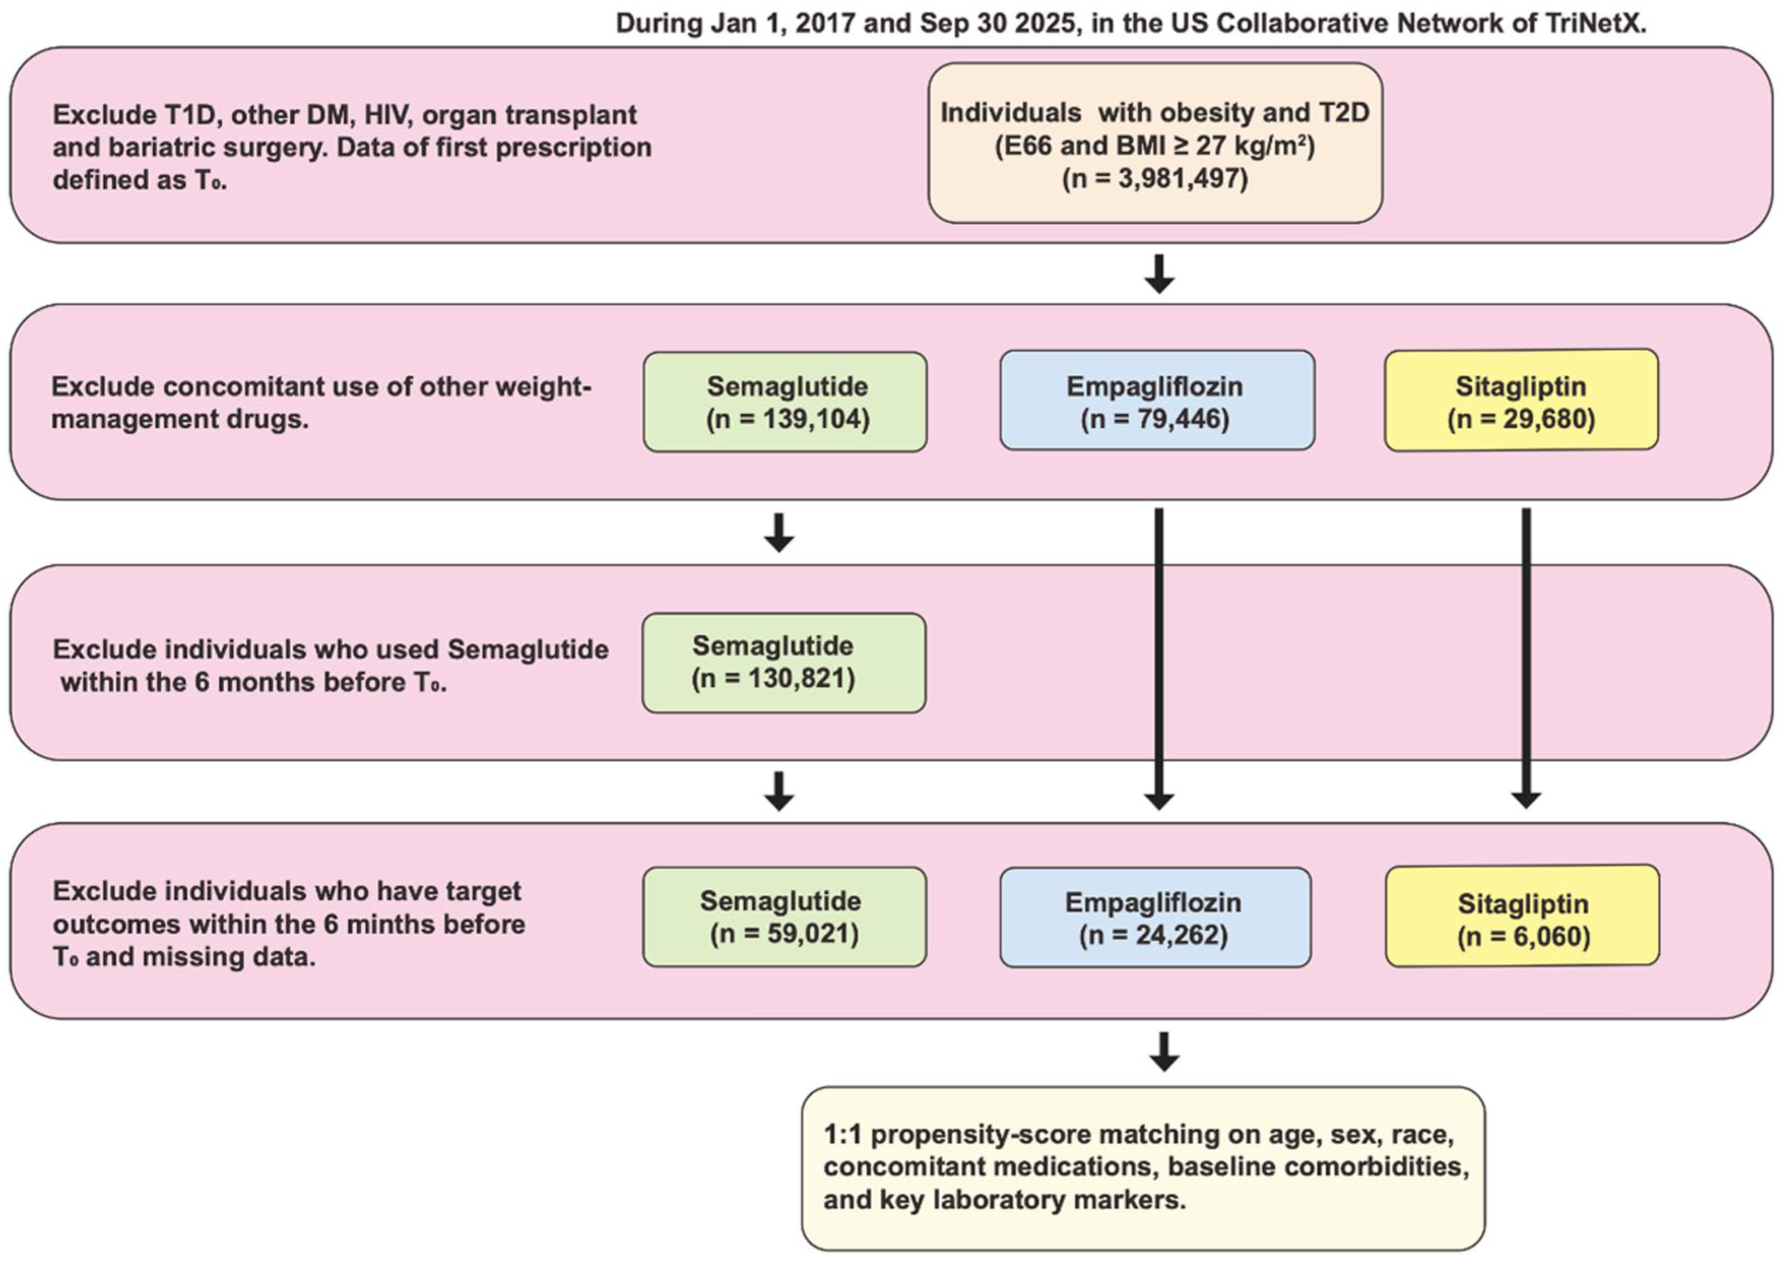
Flowchart of individuals’ selection.
Propensity scores were constructed separately for each comparison using demographics, clinical comorbidities, health-care utilization, background medications, and baseline laboratory strata (BMI, lipid panel, HbA1c, ALT/AST, creatinine/eGFR, CRP, NT-proBNP where available; Table S2). We performed 1:1 nearest-neighbor matching with a caliper of 0.2 SD of the logit score and targeted standardized mean differences <0.10 for all covariates. Despite matching on observed covariates, confounding by indication cannot be fully eliminated. Clinicians may preferentially initiate semaglutide in patients with greater obesity-related cardiovascular risk awareness, higher motivation for pharmacologic weight management, or better ability to afford a high-cost agent, factors that propensity score matching on electronic health record variables cannot directly capture. After matching, three analytic cohorts were formed: semaglutide versus empagliflozin (n = 21,114 pairs), semaglutide versus sitagliptin (n = 6,013 pairs), and empagliflozin versus sitagliptin (n = 6055 pairs).
Outcomes
We prespecified clinical outcomes to capture major cardiovascular, kidney, and liver morbidity and overall survival, applying identical definitions across cohorts. Outcomes were ascertained from structured EHR fields standardized in TriNetX (ICD-10-CM for diagnoses; CPT/ICD-10-PCS for procedures; RxNorm/LOINC/TNX where relevant). Event time was measured from the index date to the first qualifying event under an intention-to-treat design, retaining participants irrespective of subsequent adherence, switching, or discontinuation; censoring occurred at the last recorded encounter or administrative study end. For composite endpoints, only the first component event contributed. Kaplan–Meier displays covered up to 720 days.
All-cause mortality was treated as an event on the documented date of death in the health-system record. Major Adverse Cardiovascular Events (MACE) comprised the first occurrence of myocardial infarction, ischemic stroke, or cardiovascular death; heart failure (HF), atrial fibrillation (AF), and stroke were also evaluated as individual endpoints. Major Adverse Kidney Events (MAKE) were defined as the first occurrence of hospitalization with acute kidney injury, initiation of kidney replacement therapy (hemodialysis or peritoneal dialysis), or kidney transplantation. Major Adverse Liver Outcomes (MALO) were defined as hospitalization for acute/subacute liver failure or hepatic decompensation (e.g., encephalopathy, variceal bleeding, and ascites) or liver transplantation (Table S3).
Laboratory measures
We evaluated serial metabolic, inflammatory, cardiac-stress, hepatic, and renal biomarkers after 1:1 propensity score matching. Analytes comprised total cholesterol, LDL-C, HDL-C, triglycerides, HbA1c, C-reactive protein (CRP), NT-proBNP, ALT, AST, serum creatinine, eGFR, uric acid, and lipase; mean corpuscular volume (MCV) was processed as a prespecified negative-control laboratory on the identical pipeline. Units were harmonized as mg/dL for cholesterol fractions, triglycerides, creatinine, and uric acid; U/L for ALT/AST and lipase; pg/mL for NT-proBNP; percent for HbA1c; and mL/min/1.73 m2 for eGFR. Laboratory data were standardized within TriNetX using LOINC/TNX mappings.
Baseline was defined as the last available measurement on or before the index date. Follow-up assessments were abstracted in prespecified windows centered at approximately 6, 12, and 24 months. When multiple results occurred within a window, the value closest to the window anchor was selected. Laboratory analyses followed a complete-case approach at each assessment window; no imputation was applied. Participants without a measurement in a given window were excluded from that window’s laboratory contrast but retained for all time-to-event analyses, so denominators for biomarker and clinical analyses differ.
For each comparator pairing (semaglutide vs empagliflozin; semaglutide vs sitagliptin; empagliflozin vs sitagliptin), we summarized the exposure and comparator cohort means (SD) at baseline and at each window and estimated the between-group difference as Δ = (exposure minus comparator) with 95% CIs and two-sided p-values, using two-sample t-tests with heteroscedasticity adjustments when warranted. The reporting format mirrors Table 1, which tabulates Δ and p-values alongside window-specific means.
Comparative analysis of baseline and follow-up changes in clinical parameters between semaglutide versus empagliflozin, or sitagliptin.
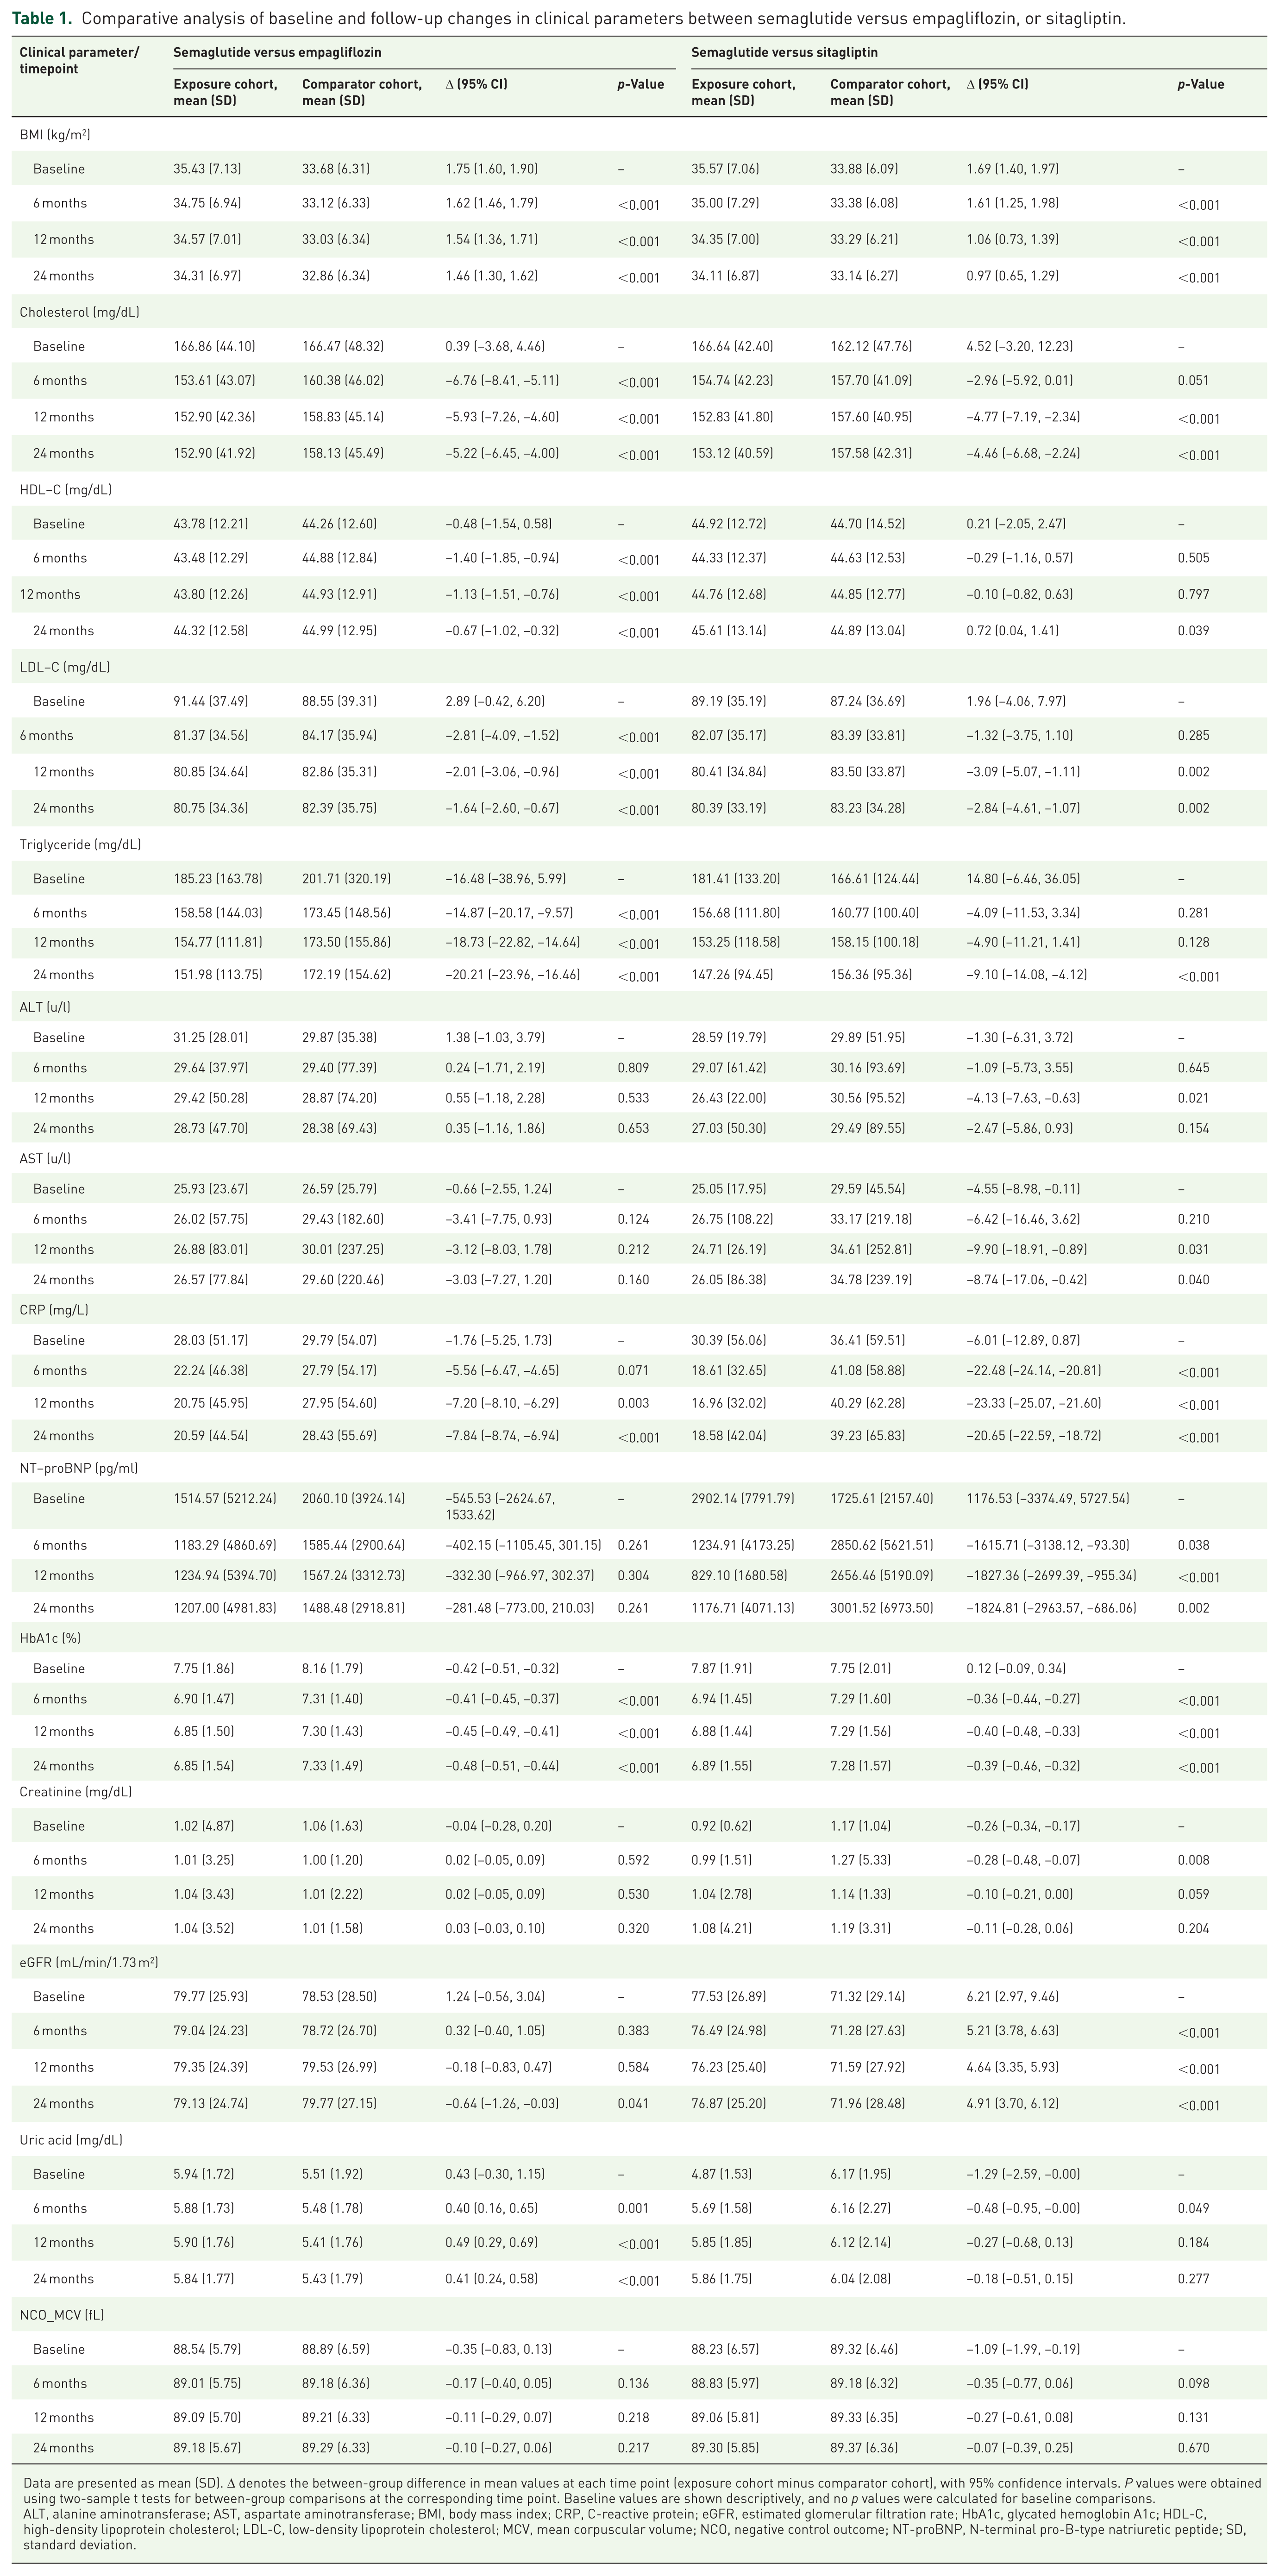
Data are presented as mean (SD). Δ denotes the between-group difference in mean values at each time point (exposure cohort minus comparator cohort), with 95% confidence intervals. P values were obtained using two-sample t tests for between-group comparisons at the corresponding time point. Baseline values are shown descriptively, and no p values were calculated for baseline comparisons.
ALT, alanine aminotransferase; AST, aspartate aminotransferase; BMI, body mass index; CRP, C-reactive protein; eGFR, estimated glomerular filtration rate; HbA1c, glycated hemoglobin A1c; HDL-C, high-density lipoprotein cholesterol; LDL-C, low-density lipoprotein cholesterol; MCV, mean corpuscular volume; NCO, negative control outcome; NT-proBNP, N-terminal pro-B-type natriuretic peptide; SD, standard deviation.
To probe for residual confounding, the negative-control laboratory (MCV) was analyzed and reported across the same windows (baseline; ~6, 12, and 24 months) using the identical ascertainment and statistical procedures.
Statistical analysis
All analyses were conducted on the TriNetX integrated analytics environment using prespecified code lists and identical pipelines across comparator pairings (semaglutide vs empagliflozin; semaglutide vs sitagliptin; empagliflozin vs sitagliptin). Baseline balance after 1:1 propensity score matching (nearest neighbor; caliper 0.2 SD of the logit) was summarized with standardized mean differences (SMDs). Residual imbalance <0.10 was considered acceptable.
Time-to-event associations were estimated with Cox proportional-hazards models on days since index. Models were fit in the matched cohorts with variance estimates robust to clustering by matched pair. Proportional hazards were probed using Schoenfeld residuals; when nonproportionality was detected, we verified robustness with time-stratified baseline hazards. Kaplan–Meier curves displayed up to 24 months with risk tables; absolute risk differences at 24 months were summarized as differences in cumulative incidence (exposure minus comparator).
Laboratory markers were analyzed at prespecified windows (~6, 12, 24 months) using complete-case data per window, without imputation. For each biomarker and window, we reported cohort means (SD) and the between-group contrast (Δ) (exposure minus comparator) with 95% CIs and two-sided Welch’s (t) tests (α = 0.05). The negative-control laboratory (mean corpuscular volume) was processed on the identical windowed pipeline to probe residual confounding.
Multiplicity was addressed with Benjamini–Hochberg false discovery rate control within families of related tests: (i) clinical endpoints per comparator pairing (primary intention-to-treat and the prespecified landmark analysis), and (ii) window-level laboratory contrasts within each biomarker. We present BH-adjusted alongside unadjusted p-values.
Sensitivity analyses followed the same modeling framework: a Global replication using the broader network dataset, and a 6-month landmark analysis excluding events in days 0–180 with follow-up beginning day 181.
The TriNetX platform supported computational analyses using Java 11.0.16 (Apache Commons Math 3.6.1), R 4.0.2 (Hmisc1-1, Survival 3.2-3), and Python 3.7 (lifelines, matplotlib, numpy, pandas, scipy, stats models). Reporting adheres to the STROBE statement for observational cohort studies. 20
Results
Baseline characteristics
After 1:1 propensity score matching (Figure S1), three analytic cohorts were constructed: semaglutide versus empagliflozin (n = 21,114 pairs; Table S4), semaglutide versus sitagliptin (n = 6,013 pairs; Table S5), and empagliflozin versus sitagliptin (n = 6055 pairs; Table S6).
Baseline characteristics were well balanced across demographics, comorbidities, medication use, and laboratory profiles, with all postmatch standardized mean differences (SMDs) <0.05 and most ⩽0.03. In the semaglutide-empagliflozin cohort, age ⩾65 years was 43.5% versus 43.3% (SMD 0.004), ischemic heart disease 21.1% versus 21.4% (SMD 0.007), and BMI ⩾30 kg/m2 68.8% versus 67.9% (SMD 0.020). In the semaglutide-sitagliptin cohort, creatinine ⩾1.5 mg/dL was 10.3% versus 11.8% (SMD 0.047) and inpatient encounters 24.8% versus 25.8% (SMD 0.024), with similar alignment across other variables. In the empagliflozin-sitagliptin cohort, HbA1c ⩾7% was 50.8% versus 50.9% (SMD 0.003) and LDL-C ⩾160 mg/dL 4.4% versus 4.1% (SMD 0.015).
Longitudinal biomarker trajectories
Serial metabolic, inflammatory, renal, and cardiac-stress biomarkers were compared after 1:1 propensity score matching (Tables 1 and 2). BMI trajectories were also assessed longitudinally. In semaglutide versus empagliflozin, the between-group BMI difference narrowed from 1.75 kg/m2 at baseline to 1.46 kg/m2 at 24 months, corresponding to an incremental BMI reduction of approximately 0.30 kg/m2 favoring semaglutide. In semaglutide versus sitagliptin, the difference narrowed from 1.69 to 0.97 kg/m2, corresponding to an incremental reduction of approximately 0.72 kg/m2 favoring semaglutide. By contrast, empagliflozin and sitagliptin showed similar BMI trajectories, with a 24-month difference of −0.23 kg/m2 (95% CI −0.53–0.07; p = 0.127).
Comparative analysis of baseline and follow-up changes in clinical parameters between empagliflozin versus sitagliptin.
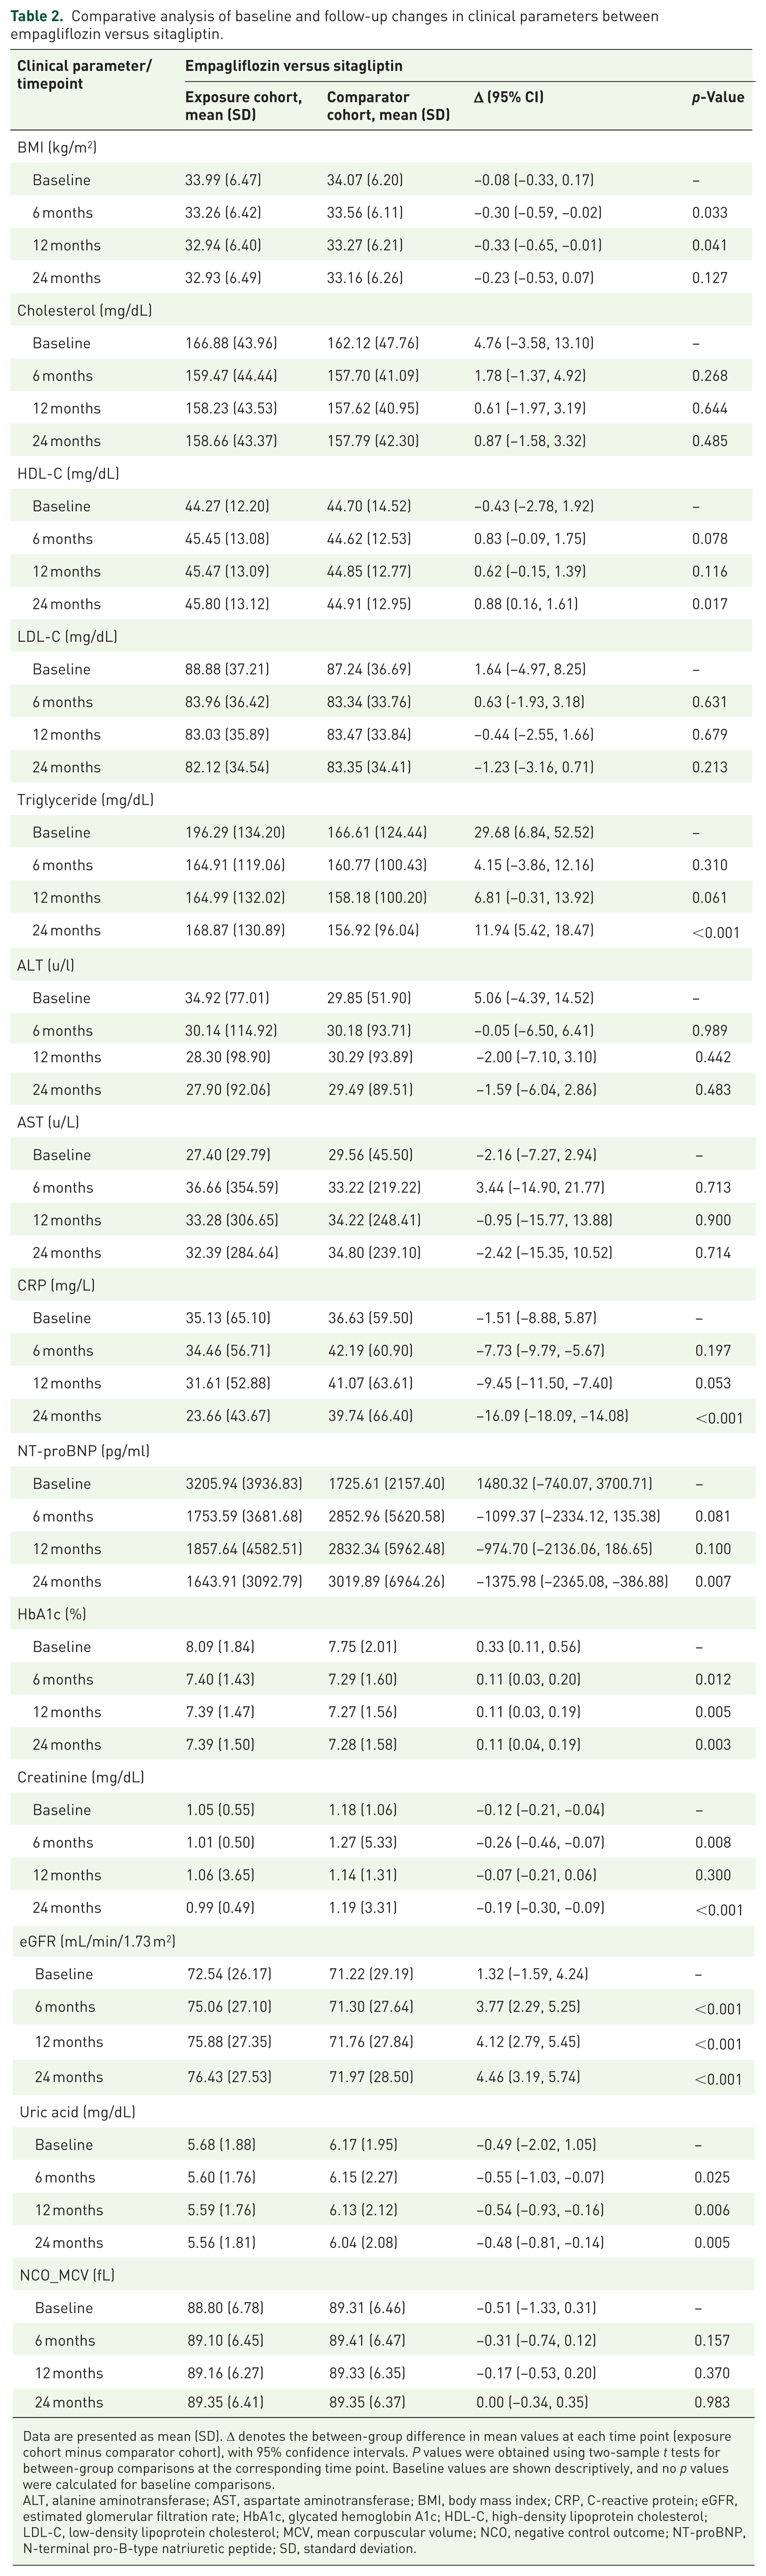
Data are presented as mean (SD). Δ denotes the between-group difference in mean values at each time point (exposure cohort minus comparator cohort), with 95% confidence intervals. P values were obtained using two-sample t tests for between-group comparisons at the corresponding time point. Baseline values are shown descriptively, and no p values were calculated for baseline comparisons.
ALT, alanine aminotransferase; AST, aspartate aminotransferase; BMI, body mass index; CRP, C-reactive protein; eGFR, estimated glomerular filtration rate; HbA1c, glycated hemoglobin A1c; HDL-C, high-density lipoprotein cholesterol; LDL-C, low-density lipoprotein cholesterol; MCV, mean corpuscular volume; NCO, negative control outcome; NT-proBNP, N-terminal pro-B-type natriuretic peptide; SD, standard deviation.
At 24 months, semaglutide versus empagliflozin showed lower total cholesterol (Δ −5.22 mg/dL; 95% CI −6.45 to −4.00), LDL-C (Δ −1.64 mg/dL; 95% CI −2.60 to −0.67), triglycerides (Δ −20.21 mg/dL; 95% CI −23.96 to −16.46), CRP (Δ −7.84 mg/L; 95% CI −8.74 to −6.94), and HbA1c (Δ −0.48%; 95% CI −0.51 to −0.44), whereas HDL-C was modestly lower (Δ −0.67 mg/dL; 95% CI −1.02 to −0.32; all p < 0.001). NT-proBNP showed no clear separation (Δ −281.48 pg/mL; 95% CI −773.00 to 210.03; p = 0.261). Renal indices were largely similar, except for a small eGFR difference favoring empagliflozin (Δ −0.64 mL/min/1.73 m2 95% CI −1.26 to −0.03; p = 0.041). Uric acid was higher with semaglutide (Δ +0.41 mg/dL; 95% CI 0.24 to 0.58; p < 0.001), and liver enzymes were similar.
Semaglutide versus sitagliptin also showed broadly favorable 24-month biomarker patterns: lower total cholesterol (Δ −4.46 mg/dL; 95% CI −6.68 to −2.24), LDL-C (Δ −2.84 mg/dL; 95% CI −4.61 to −1.07), triglycerides (Δ −9.10 mg/dL; 95% CI −14.08 to −4.12), CRP (Δ −20.65 mg/L; 95% CI −22.59 to −18.72), NT-proBNP (Δ −1824.81 pg/mL; 95% CI −2963.57 to −686.06), and HbA1c (Δ −0.39%; 95% CI −0.46 to −0.32), with higher HDL-C (Δ +0.72 mg/dL; 95% CI 0.04 to 1.41) and eGFR (Δ +4.91 mL/min/1.73 m2; 95% CI 3.70–6.12). Uric acid and ALT were similar, whereas AST was modestly lower at 24 months (Δ −8.74 U/L; 95% CI −17.06 to −0.42; p = 0.040).
In empagliflozin versus sitagliptin, total cholesterol and LDL-C were similar at 24 months, while HDL-C was higher (Δ +0.88 mg/dL; 95% CI 0.16 to 1.61; p = 0.017) and triglycerides were higher (Δ +11.94 mg/dL; 95% CI 5.42 to 18.47; p < 0.001) with empagliflozin. CRP (Δ −16.09 mg/L; 95% CI −18.09 to −14.08; p < 0.001), NT-proBNP (Δ −1375.98 pg/mL; 95% CI −2365.08 to −386.88; p = 0.007), creatinine (Δ −0.19 mg/dL; 95% CI −0.30 to −0.09; p < 0.001), and uric acid (Δ −0.48 mg/dL; 95% CI −0.81 to −0.14; p = 0.005) were lower, whereas eGFR was higher (Δ +4.46 mL/min/1.73 m2; 95% CI 3.19 to 5.74; p < 0.001). HbA1c was modestly higher at the 24-month time point (Δ +0.11%; 95% CI 0.04 to 0.19; p = 0.003), and liver enzymes were similar.
Clinical outcomes and effect estimate in obesity with T2D
In comparison of semaglutide versus empagliflozin (Table 3 and Figure 2), all-cause mortality was lower with semaglutide (HR 0.59, 95% CI 0.51 to 0.69; adjusted p < 0.001; 24-month ARD −1.0%, 95% CI −1.2 to −0.7; NNT = 83). MACE was lower (HR 0.76, 0.66 to 0.88; adjusted p < 0.001; ARD −0.6%, −0.9 to −0.3; NNT = 120). Heart failure was lower (HR 0.62, 0.54 to 0.70; adjusted p < 0.001; ARD −1.3%, −1.6 to −1.0; NNT = 58), and atrial fibrillation was lower (HR 0.72, 0.63 to 0.84; adjusted p < 0.001; ARD −0.7%, −0.9 to −0.4; NNT = 120). Stroke did not reach significance (HR 0.84, 0.69 to 1.03; adjusted p = 0.093; ARD −0.2%, −0.4 to 0.0). Kidney composites diverged: MAKE was higher with semaglutide (HR 1.13, 1.05 to 1.21; adjusted p = 0.001; ARD +2.7%, +0.6 to +4.7; NNT for harm = 18), whereas MALO was lower (HR 0.65, 0.52 to 0.82; adjusted p < 0.001; ARD −0.3%, −0.5 to −0.2; NNT = 198).
Clinical outcomes, risk differences, and effect estimates comparing semaglutide, empagliflozin, and sitagliptin in individuals with obesity and type 2 diabetes in the United States.
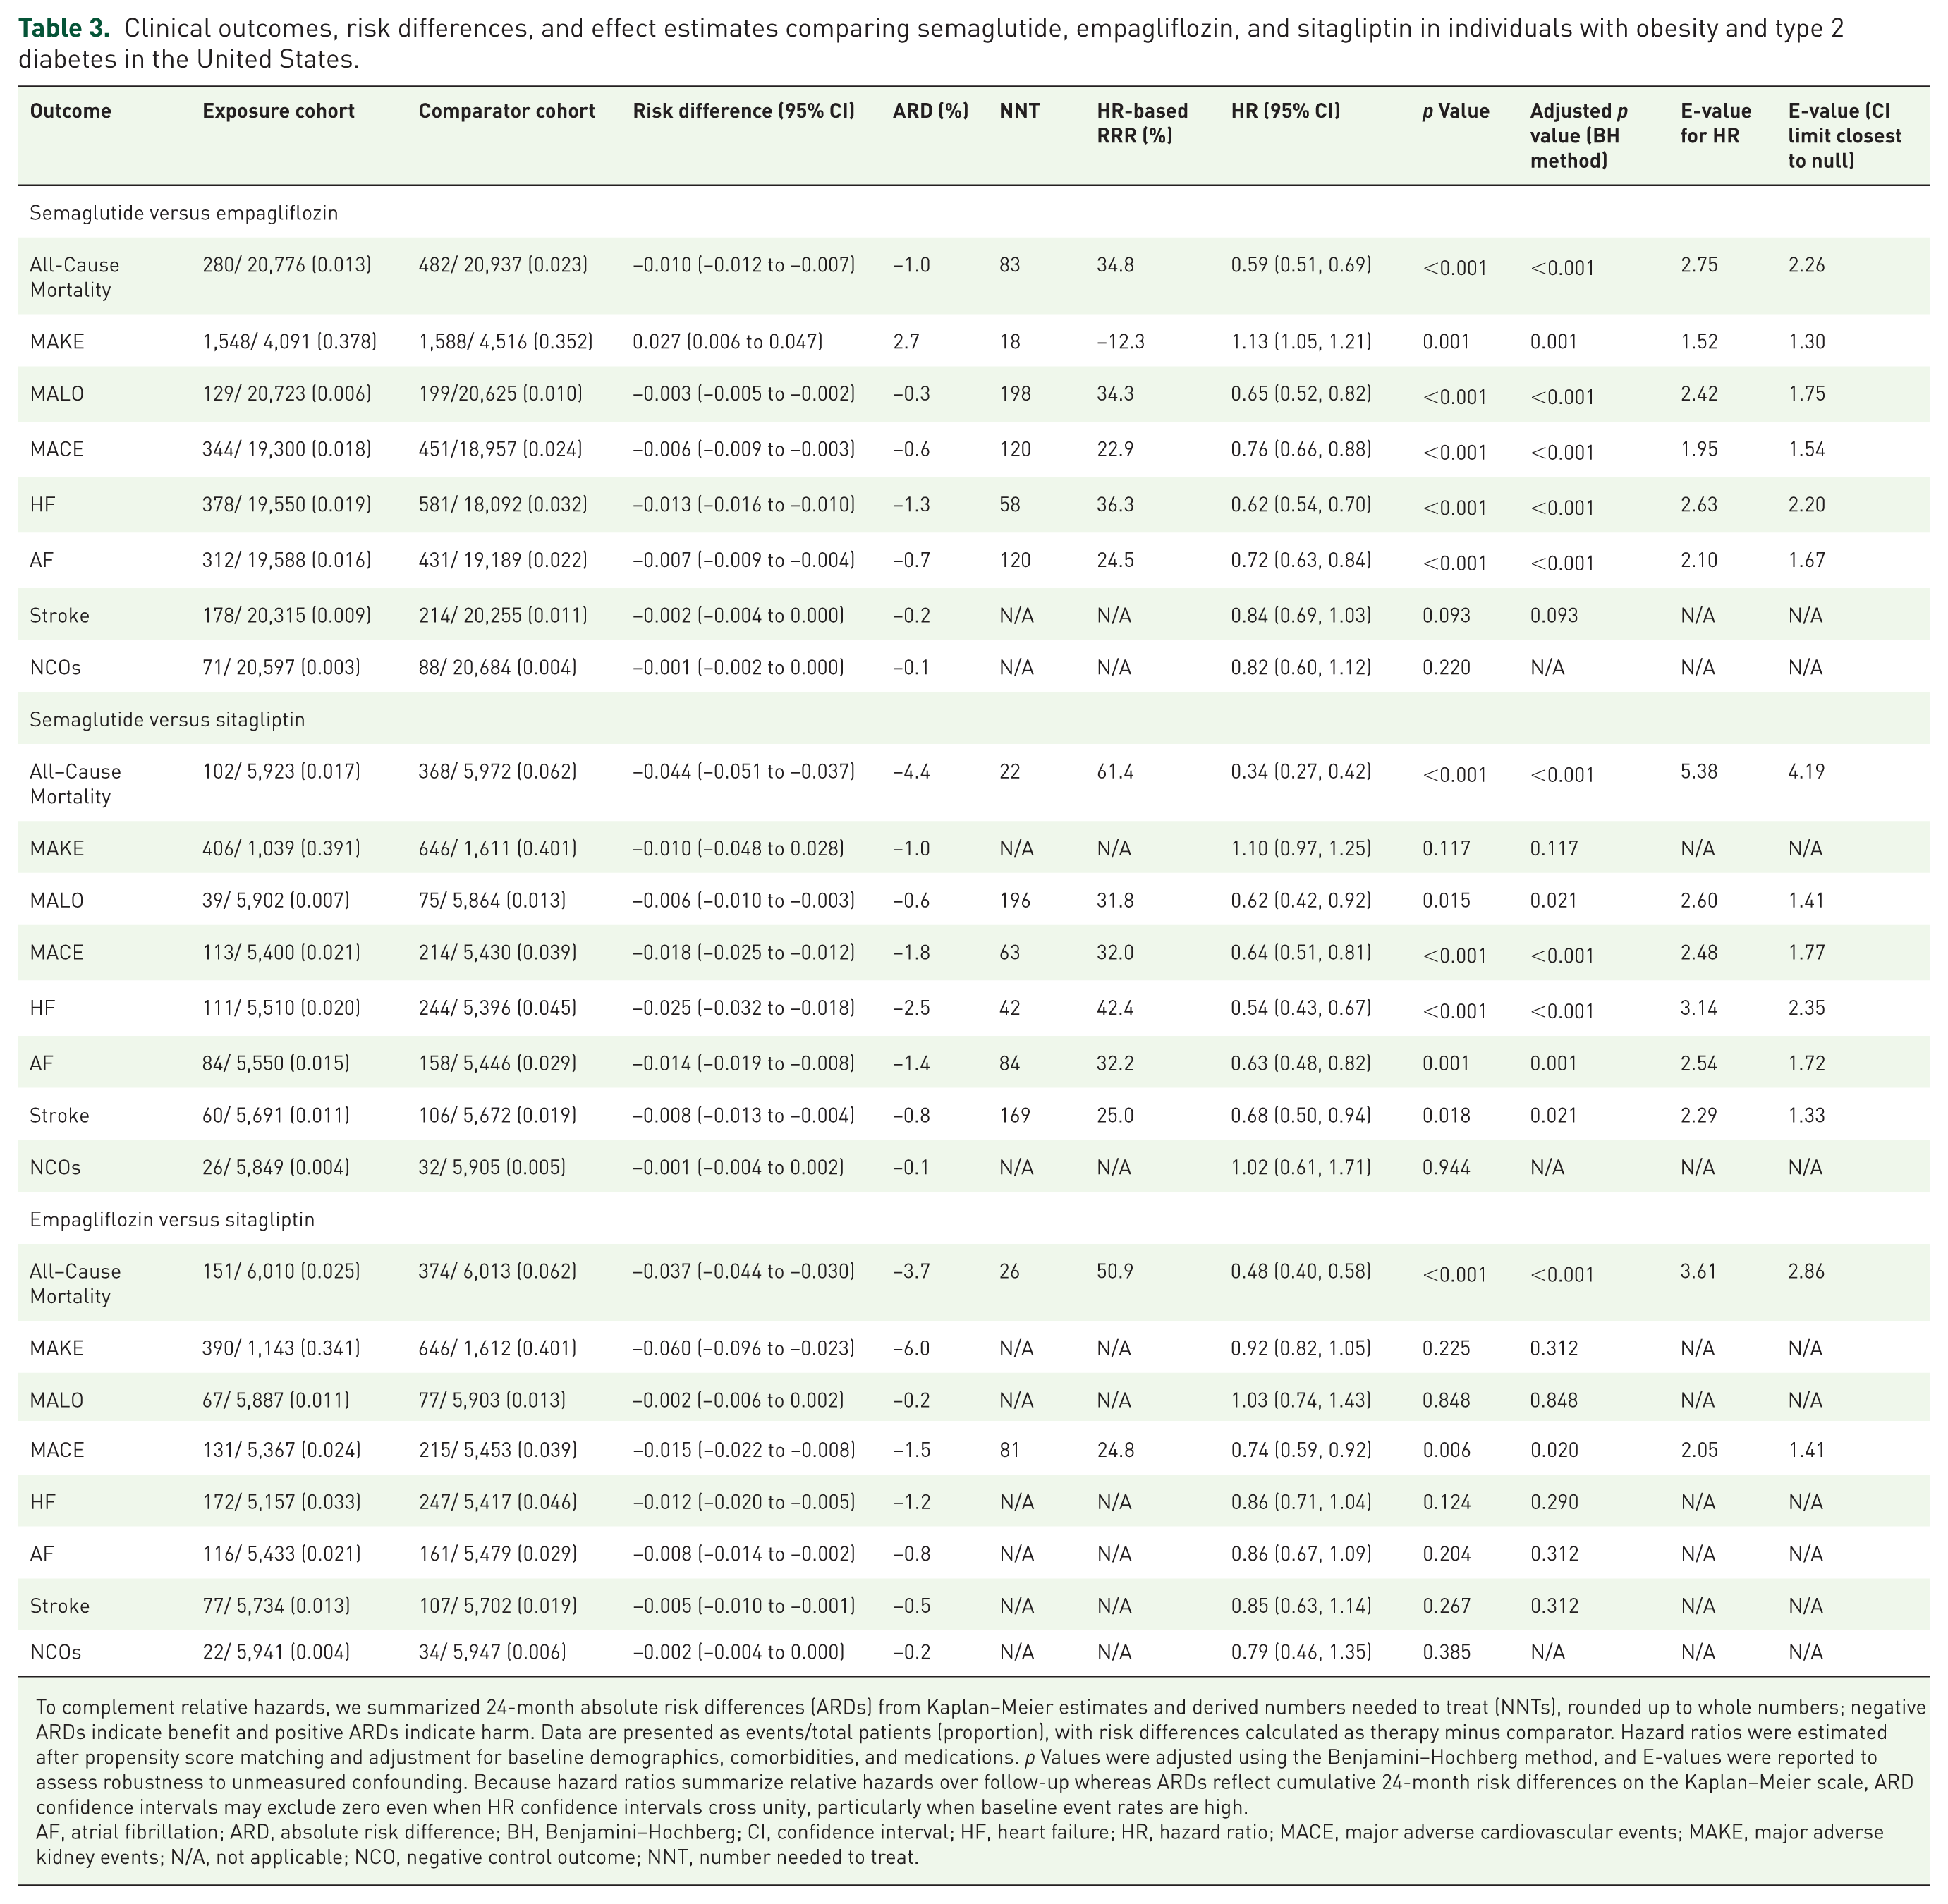
To complement relative hazards, we summarized 24-month absolute risk differences (ARDs) from Kaplan–Meier estimates and derived numbers needed to treat (NNTs), rounded up to whole numbers; negative ARDs indicate benefit and positive ARDs indicate harm. Data are presented as events/total patients (proportion), with risk differences calculated as therapy minus comparator. Hazard ratios were estimated after propensity score matching and adjustment for baseline demographics, comorbidities, and medications. p Values were adjusted using the Benjamini–Hochberg method, and E-values were reported to assess robustness to unmeasured confounding. Because hazard ratios summarize relative hazards over follow-up whereas ARDs reflect cumulative 24-month risk differences on the Kaplan–Meier scale, ARD confidence intervals may exclude zero even when HR confidence intervals cross unity, particularly when baseline event rates are high.
AF, atrial fibrillation; ARD, absolute risk difference; BH, Benjamini–Hochberg; CI, confidence interval; HF, heart failure; HR, hazard ratio; MACE, major adverse cardiovascular events; MAKE, major adverse kidney events; N/A, not applicable; NCO, negative control outcome; NNT, number needed to treat.
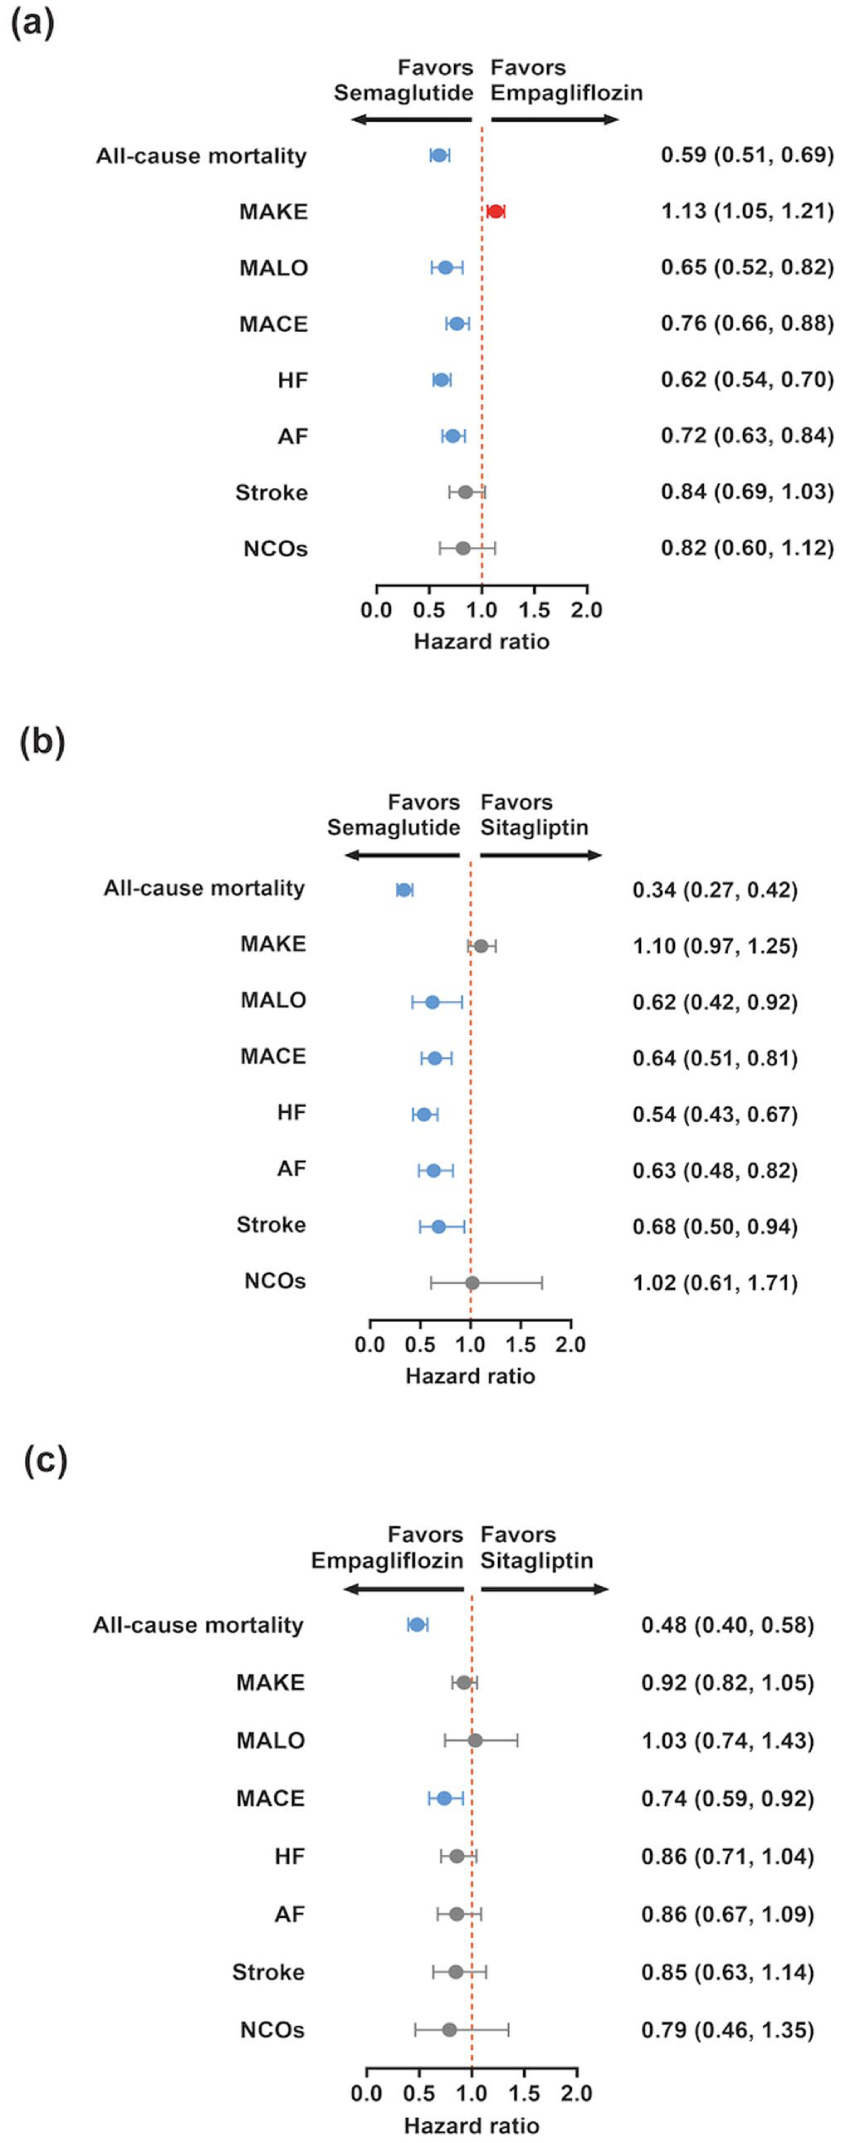
Forest plots of cardiovascular, kidney, and liver outcomes with semaglutide, empagliflozin, and sitagliptin in adults with obesity and type 2 diabetes. Forest plots showing Cox model hazard ratios with 95 percent confidence intervals for clinical outcomes across the three propensity score matched cohorts. Panel a displays semaglutide compared with empagliflozin. Panel b displays semaglutide compared with sitagliptin. Panel c displays empagliflozin compared with sitagliptin. Outcomes include all-cause mortality, major adverse kidney events (MAKE), major adverse liver outcomes (MALO), major adverse cardiovascular events (MACE), heart failure (HF), atrial fibrillation (AF), stroke and a prespecified negative control outcome. Hazard ratios are estimated under an intention to treat framework over 24 months of follow-up. The point estimate for each outcome is shown as a marker, and the horizontal bar indicates the 95% confidence interval. The vertical dotted line marks a hazard ratio of one, at which the event rates are similar between treatment groups. Hazard ratios below one indicate that the event was less frequent in the first listed treatment group than in its comparator, whereas values above 1 indicates the opposite pattern.
In comparison of semaglutide versus sitagliptin, all-cause mortality was lower with semaglutide (HR 0.34, 0.27 to 0.42; adjusted p < 0.001; ARD −4.4%, −5.1 to −3.7; NNT = 22). MACE was lower (HR 0.64, 0.51 to 0.81; adjusted p < 0.001; ARD −1.8%, −2.5 to −1.2; NNT = 63), as were heart failure (HR 0.54, 0.43 to 0.67; adjusted p < 0.001; ARD −2.5%, −3.2 to −1.8; NNT = 42), atrial fibrillation (HR 0.63, 0.48 to 0.82; adjusted p = 0.001; ARD −1.4%, −1.9 to −0.8; NNT = 84), and stroke (HR 0.68, 0.50 to 0.94; adjusted p = 0.021; ARD −0.8%, −1.3 to −0.4; NNT = 169). MAKE did not differ by hazard ratio (HR 1.10, 0.97 to 1.25; adjusted p = 0.117), with a 24-month ARD of −1.0% (−4.8 to +2.8). MALO was lower (HR 0.62, 0.42 to 0.92; adjusted p = 0.021; ARD −0.6%, −1.0 to −0.3; NNT = 196).
In comparison of empagliflozin versus sitagliptin, all-cause mortality was lower with empagliflozin (HR 0.48, 0.40 to 0.58; adjusted p < 0.001; ARD −3.7%, −4.4 to −3.0; NNT = 26). MACE was lower (HR 0.74, 0.59 to 0.92; adjusted p = 0.020; ARD −1.5%, −2.2 to −0.8; NNT = 81). Heart failure, atrial fibrillation, and stroke were not significant after adjustment (HF HR 0.86, 0.71 to 1.04; adjusted p = 0.290; AF HR 0.86, 0.67 to 1.09; adjusted p = 0.312; stroke HR 0.85, 0.63 to 1.14; adjusted p = 0.312). MAKE was not significant by hazard ratio (HR 0.92, 0.82 to 1.05; adjusted p = 0.312), with a 24-month ARD of −6.0% (−9.6 to −2.3). The MAKE hazard ratio for empagliflozin versus sitagliptin did not reach statistical significance, whereas the corresponding 24-month absolute risk difference did exclude zero; this reflects a modest relative hazard acting on a high baseline event rate and not a data inconsistency. MALO was similar (HR 1.03, 0.74 to 1.43; adjusted p = 0.848; ARD −0.2%).
K-M curve
Kaplan–Meier curves (0–720 days) showed clear separation across contrasts (Figure 3). Semaglutide tracked with higher survival than empagliflozin (log-rank p < 0.001), with early divergence that widened by 2 years. Versus sitagliptin, semaglutide displayed the largest separation (p < 0.001). Empagliflozin also exceeded sitagliptin (p < 0.001). Confidence bands overlapped minimally after ~6 months in the semaglutide contrasts, and risk tables indicated fewer cumulative deaths with semaglutide and with empagliflozin by later time points.
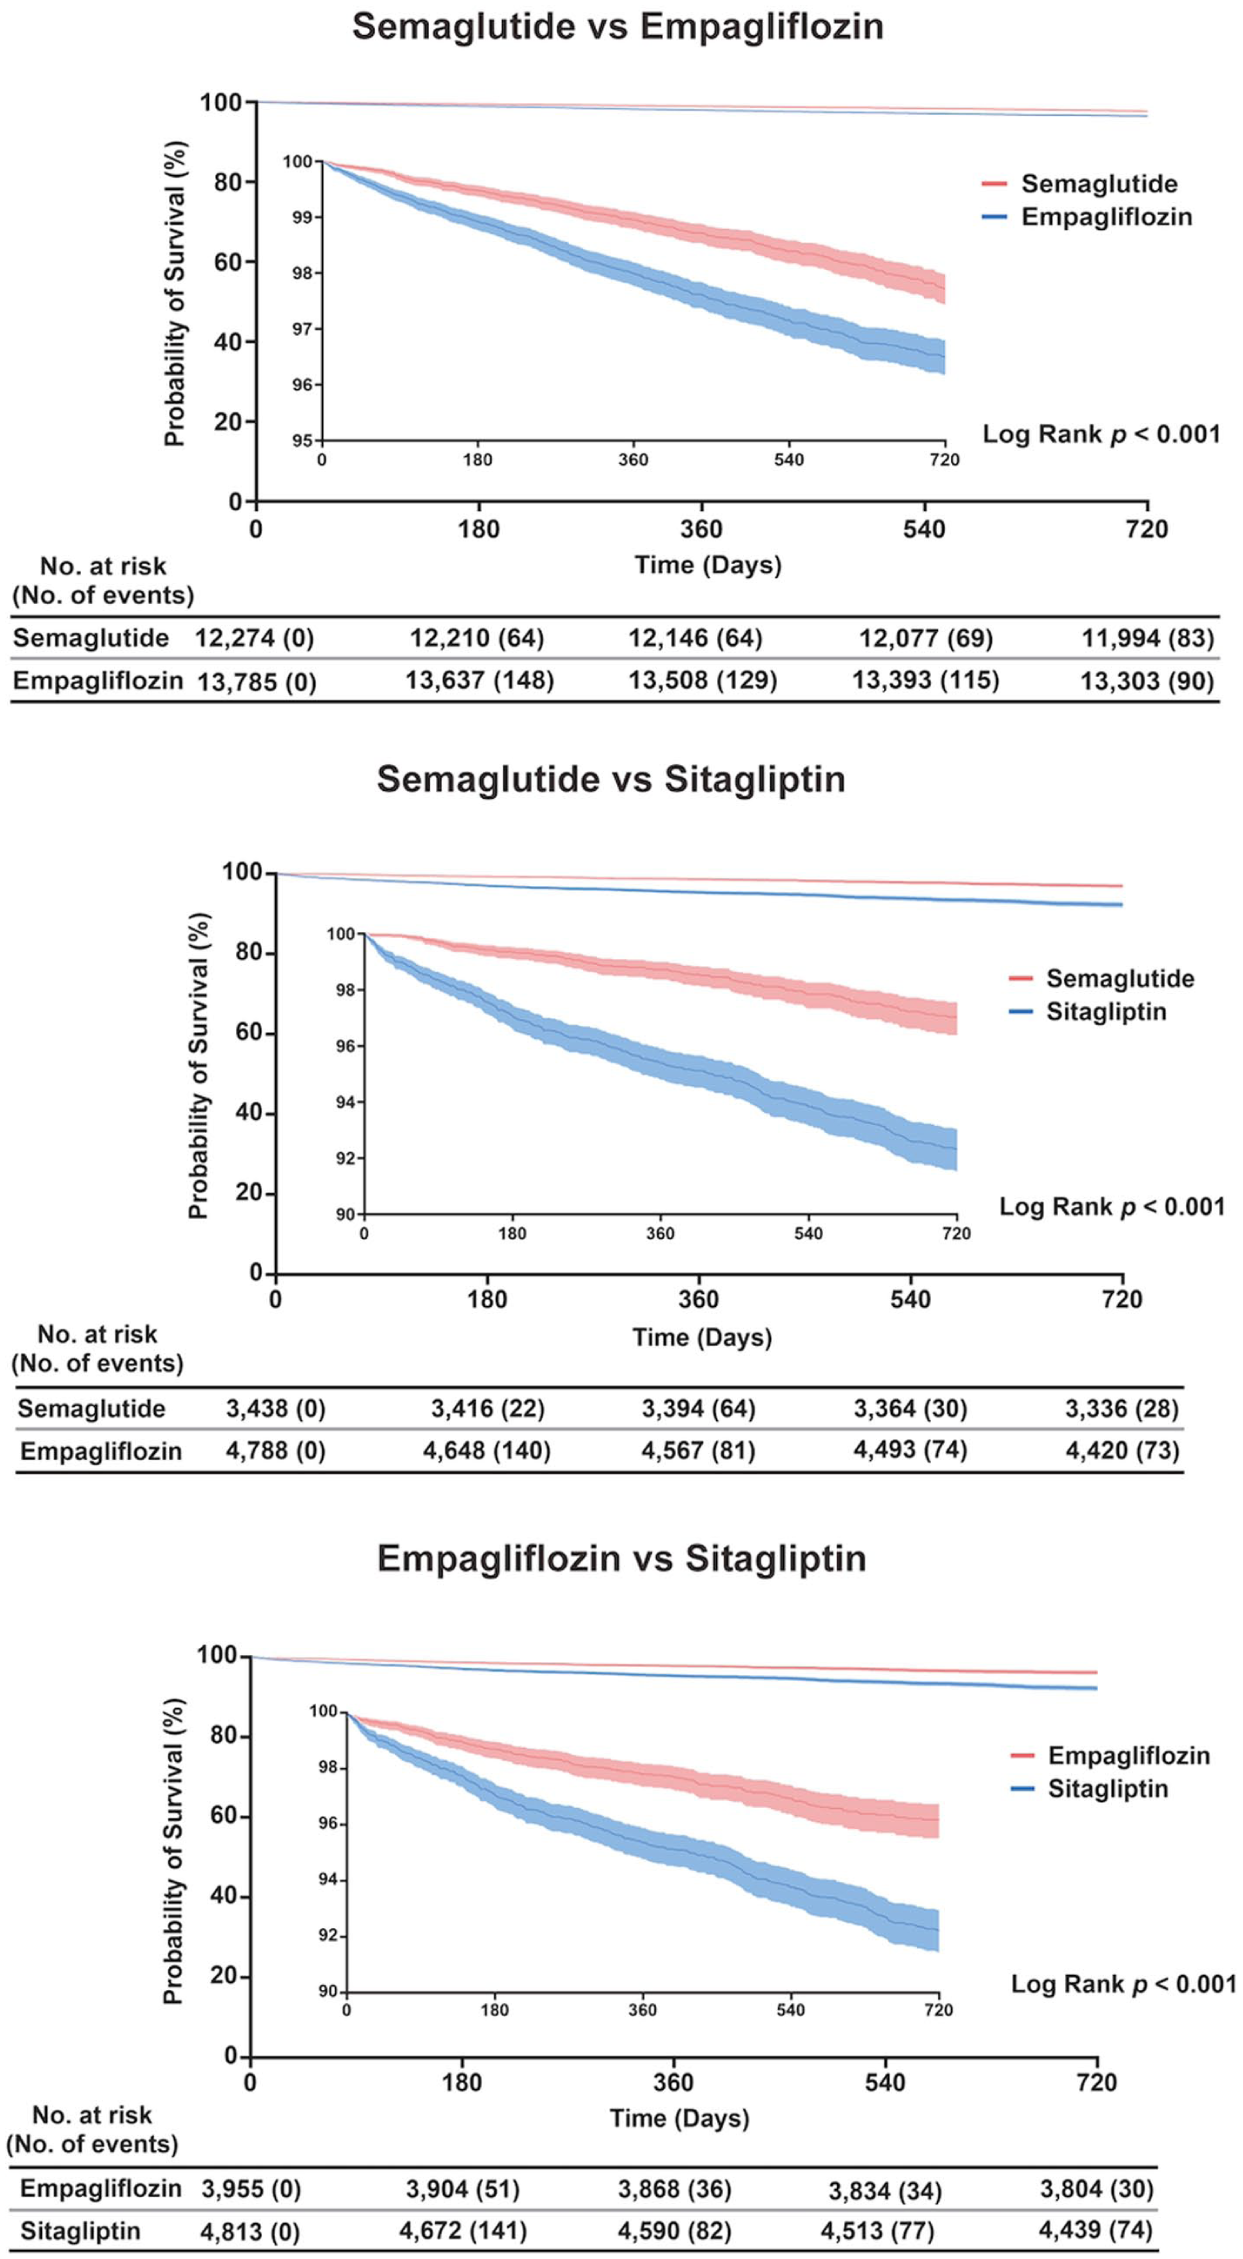
Kaplan–Meier curves for all-cause mortality with semaglutide, empagliflozin and sitagliptin in adults with obesity and type 2 diabetes. Kaplan–Meier estimates of overall survival during 720 days of follow up in the three matched cohorts. The y-axis represents the probability of survival in percent, and the x-axis represents time in days from treatment initiation. Solid lines denote the survival curves for each treatment group and shaded areas indicate 95% confidence bands. Log rank p values compare the survival distributions within each panel. Tables beneath each plot report the number of individuals at risk and the cumulative number of deaths at selected time points.
Sensitivity analysis
In sensitivity analyses (Table S7 and Figure S2), global estimates showed semaglutide versus empagliflozin with lower hazards for all-cause mortality (HR 0.59, 95% CI 0.51 to 0.69; p < 0.001), MACE (0.75, 0.65 to 0.86; p < 0.001), HF (0.67, 0.59 to 0.76; p < 0.001), AF (0.77, 0.66 to 0.89; p = 0.001), stroke (0.80, 0.66 to 0.98; p = 0.028), and MALO (0.75, 0.61 to 0.93; p = 0.011) and MAKE slightly favored empagliflozin (1.08, 1.01 to 1.16; p = 0.028).
Landmark results were directionally consistent (Table S8 and Figure S3): mortality (0.69, 0.59 to 0.82; p < 0.001), MACE (0.74, 0.62 to 0.87; p < 0.001), HF (0.63, 0.54 to 0.73; p < 0.001), AF (0.71, 0.60 to 0.85; p < 0.001); MAKE (1.13, 1.03 to 1.24; p = 0.016), and stroke (0.91, 0.72 to 1.15; p = 0.425) showed no separation. Comparisons with sitagliptin in the global analysis showed similarly lower risks for mortality, MACE, HF, stroke, AF, and MALO (all adjusted p ⩽ 0.002).
Discussion
All-cause mortality and MACE
Semaglutide was associated with lower all-cause mortality and MACE than both empagliflozin and sitagliptin, whereas the MAKE composite favored empagliflozin. The magnitude of the mortality reduction for semaglutide versus sitagliptin (HR 0.34) warrants cautious interpretation for four reasons: sitagliptin is a cardiometabolically neutral comparator that amplifies any pharmacodynamic advantage 12 ; residual confounding from frailty, contraindications, clinician preference, and cost cannot be fully excluded despite matching; the 6-month landmark analysis yielded a more conservative HR of 0.69, consistent with trial-level estimates; and the E-value of 5.38 (lower confidence limit 4.19) implies that a single unmeasured confounder would need a risk ratio of approximately five with both treatment and mortality to fully explain the association.
Whether these benefits are weight-mediated is a central question. Semaglutide was associated with incremental 24-month BMI reductions of approximately 0.30 kg/m2 versus empagliflozin and 0.72 kg/m2 versus sitagliptin, corresponding to roughly 1% to 2% of baseline body weight, both below the 5% to 10% threshold associated with measurable cardiovascular risk reduction in lifestyle trials. Yet empagliflozin and sitagliptin showed essentially identical BMI trajectories (24-month Δ −0.23 kg/m2, p = 0.127) while still differing on mortality (HR 0.48) and MACE (HR 0.74), isolating a weight-independent SGLT2i cardiorenal channel; semaglutide’s incremental benefit beyond empagliflozin is consistent with added GLP-1 RA pleiotropy. These observations align with trial-level mediation evidence: in SELECT, roughly two-thirds to 80% of the MACE reduction was not mediated by body weight21,22; in LEADER, body weight was not a significant mediator, whereas HbA1c and urinary albumin-to-creatinine ratio dominated 23 ; and pooled SUSTAIN and PIONEER hsCRP analyses found only 21% to 62% of CRP lowering mediated by HbA1c and weight. 24 The lipid separations we observed favoring semaglutide are consistent with SELECT, where MACE reduction was largely independent of baseline HbA1c. 25 At the molecular level, GLP-1 receptor activation augments insulin, suppresses glucagon, and attenuates hepatic de novo lipogenesis and VLDL-apoB secretion, providing a mechanistic basis for the LDL-C and non-HDL reductions observed in insulin-resistant states. 26
Heart failure and atrial fibrillation
The lower NT-proBNP trajectory and heart failure incidence with semaglutide are compatible with reduced cardiac wall stress from combined weight, glycemic, and anti-inflammatory effects. 27 In STEP-HFpEF, semaglutide lowered NT-proBNP across weight-loss categories, including participants without clinically meaningful weight reduction, supporting cardiac stress relief independent of adiposity. 27 Pooled heart failure analyses reinforce consistent clinical benefit despite varying weight-loss magnitudes.27,28 Because NT-proBNP is influenced by heart failure phenotype and important clinical modifiers such as obesity, renal function, atrial fibrillation, and congestion status, changes in this biomarker should be interpreted as supportive evidence of biological response rather than as a standalone substitute for adjudicated clinical outcomes. 29 Mechanistically, the NT-proBNP reduction is compatible with lower myocardial wall stress in the context of weight loss, improved congestion, and reduced inflammation. Prior obesity-focused cohorts have also shown that intentional weight loss can improve left ventricular diastolic function, although NT-proBNP changes should still be interpreted as supportive context rather than a surrogate for hard outcomes.27,28
Kidney outcomes (MAKE)
The MAKE composite favored empagliflozin, consistent with its established cardiorenal phenotype.11,30 CRP was lower with semaglutide and uric acid was lower with empagliflozin, suggesting partially complementary biological profiles in which GLP-1 RAs are more strongly linked to systemic inflammation attenuation and SGLT2 inhibitors to hemodynamic and metabolic reprogramming.31,32 Renal laboratory changes over 24 months were modest and largely parallel, which does not conflict with the FLOW trial: semaglutide slowed eGFR decline in patients with T2D and established CKD. 16 The difference likely reflects population risk (CKD enrichment in FLOW versus routine-care heterogeneity here) and the limited sensitivity of short-horizon creatinine and eGFR changes to detect structural kidney benefit. Mechanistically, SGLT2 inhibition drives natriuresis, restores tubuloglomerular feedback, reduces intraglomerular pressure, and reprograms cardiorenal metabolism toward ketone utilization, a constellation of hemodynamic and metabolic effects that plausibly underlies the MAKE advantage observed for empagliflozin beyond glycemic lowering.
Hepatic outcomes (MALO)
Small, favorable ALT and AST trajectories under semaglutide are coherent with evidence that semaglutide improves NASH histologic activity, though without clear short-term antifibrotic signal. 33 MALO was correspondingly lower with semaglutide versus both comparators. Pancreatic enzyme trends were variable and not different between groups, consistent with prior LEADER data showing that GLP-1 RAs may raise amylase or lipase modestly without predicting pancreatitis events. 34 Mechanistically, semaglutide’s favorable hepatic profile is consistent with improved insulin sensitivity, reduced hepatic de novo lipogenesis, and resolution of steatohepatitis histology demonstrated in phase II NASH trials, 33 supporting interpretation of the modest transaminase declines as markers of reduced hepatocellular stress rather than drug-specific hepatotoxicity.
Comparative biomarker profiles and therapeutic differentiation
Taken together, the longitudinal biomarker patterns align with the differentiated biology of GLP-1 and SGLT2 pathways. 35 GLP-1 receptor activation couples central appetite regulation with improved hepatic lipid handling and anti-inflammatory signaling,36,37 whereas SGLT2 inhibition drives natriuresis, hemodynamic reprogramming, and uric acid lowering. 32 Practically, when LDL-C and NT-proBNP trajectories are central to cardiovascular risk reduction in T2D with obesity, semaglutide may be prioritized, whereas targeting systemic inflammation with renal protection or uric acid may favor SGLT2 initiation. 38 Where tolerated and accessible, combined GLP-1 receptor agonist and SGLT2 inhibitor therapy is supported by emerging observational evidence, including lower cardiovascular and serious renal event risk versus either class alone in routine-care cohorts. 39 Among transplant candidates with obesity and T2D, pretransplant dual therapy has also been associated with lower mortality and kidney graft events without excess infection or metabolic complication signals. 40 Central GLP-1 signaling engages hypothalamic POMC/CART neurons and indirectly suppresses NPY/AgRP circuitry, linking appetite reduction to downstream metabolic effects. 36 Peripheral GLP-1 actions extend to pancreatic islet function and inflammatory signaling, thereby complementing rather than duplicating the predominantly renal hemodynamic pathway of SGLT2 inhibition.35,41
Limitations
Several limitations should be considered when interpreting these associations. First, although we applied extensive propensity score matching and used negative control outcomes and laboratories, unmeasured or imperfectly captured confounding remains possible. In particular, socioeconomic status, insurance type, health literacy, physical activity, dietary patterns, frailty, and nonprescription medication use are not reliably available in TriNetX. Drug cost and prior authorization patterns may also differentially channel patients across the three comparator classes, and residual confounding by indication therefore cannot be fully excluded. Second, laboratory analyses relied on complete case data within prespecified windows. Patients who returned for repeated testing may differ systematically from those without measurements, so selection related to testing intensity and informative missingness could influence the biomarker results. Third, clinical events and deaths were ascertained from participating health systems, and events occurring outside these networks may have been missed, which can affect absolute risks if loss to follow-up is related to prognosis. Fourth, case definitions required documented obesity, a recent hemoglobin A1c value above 6.5%, and initiation of semaglutide, empagliflozin, or sitagliptin in US health systems, which may limit generalizability to people without obesity, to other care settings, or to users of different GLP-1 RA and SGLT2i. Finally, diagnoses and procedures were identified from coded electronic health record data and are subject to misclassification, and the 24-month follow-up window may be insufficient to fully characterize longer-term kidney and liver outcomes, so replication with longer observation and complementary data sources would be valuable. To quantify robustness to unmeasured confounding, E-values are reported. For all-cause mortality in semaglutide versus sitagliptin, the E-value for the point estimate was 5.38 and for the lower confidence limit was 4.19, suggesting that a single unmeasured confounder would need to be strongly associated with both treatment assignment and mortality to fully explain away the observed association.
Conclusion
Overall, the comparative biomarker evolution observed here is coherent with the differentiated biology of GLP-1 and SGLT2 pathways and with major outcome trials. These data may assist clinicians in aligning drug choice with organ-system priorities in T2D and obesity, while underscoring the value of combined strategies when feasible.
Supplemental Material
sj-docx-1-tae-10.1177_20420188261460592 – Supplemental material for Comparative 24-month cardiovascular outcomes and biomarker trajectories with semaglutide, empagliflozin, and sitagliptin in people with obesity and type 2 diabetes: a multicenter real-world study
Supplemental material, sj-docx-1-tae-10.1177_20420188261460592 for Comparative 24-month cardiovascular outcomes and biomarker trajectories with semaglutide, empagliflozin, and sitagliptin in people with obesity and type 2 diabetes: a multicenter real-world study by Jo-Ching Chen, Kai-Wen Liu, Yu-Nan Huang, Gideon Meyerowitz-Katz, Tsung-Hsun Tsai and Pen-Hua Su in Therapeutic Advances in Endocrinology and Metabolism
Supplemental Material
sj-docx-2-tae-10.1177_20420188261460592 – Supplemental material for Comparative 24-month cardiovascular outcomes and biomarker trajectories with semaglutide, empagliflozin, and sitagliptin in people with obesity and type 2 diabetes: a multicenter real-world study
Supplemental material, sj-docx-2-tae-10.1177_20420188261460592 for Comparative 24-month cardiovascular outcomes and biomarker trajectories with semaglutide, empagliflozin, and sitagliptin in people with obesity and type 2 diabetes: a multicenter real-world study by Jo-Ching Chen, Kai-Wen Liu, Yu-Nan Huang, Gideon Meyerowitz-Katz, Tsung-Hsun Tsai and Pen-Hua Su in Therapeutic Advances in Endocrinology and Metabolism
Footnotes
Acknowledgements
We thank the participating healthcare organizations within the TriNetX US Collaborative Network for contributing de-identified patient data. We are also grateful to colleagues at Chung Shan Medical University Hospital for administrative and information-technology support during data extraction and quality checks. The content is solely the responsibility of the authors and does not necessarily represent the views of the data contributors or TriNetX. During the preparation of this work, the authors used GPT-5 in order to grammatical editing and language refinement. After using this tool/service, the authors reviewed and edited the content as needed and takes full responsibility for the content of the published article.
Declarations

Supplemental material
Supplemental material for this article is available online.
References
Supplementary Material
Please find the following supplemental material available below.
For Open Access articles published under a Creative Commons License, all supplemental material carries the same license as the article it is associated with.
For non-Open Access articles published, all supplemental material carries a non-exclusive license, and permission requests for re-use of supplemental material or any part of supplemental material shall be sent directly to the copyright owner as specified in the copyright notice associated with the article.
