




Abstract
The diffusion of Covid-19 imposed the confinement of the entire Spanish population between March and June 2020. An exploratory study of the evolution of teachers’ interests and feelings in social networks is carried out. For this purpose, three key periods have been differentiated: pre-pandemic (January 2018-February 2020), confinement and state of alarm (March 2020-May 2021), and post-pandemic (June 2021-March 2022). We analyzed 9462 tweets from faculty communities on Twitter using public data mining, sentiment analysis, and semantic content analysis. The results highlight a significant increase in teacher interventions on Twitter and an increase in emotional content during the confinement in both positive and negative sentiments, closely related to the use of emojis. During the pandemic period, new topics of interest appeared related to the evolution of COVID-19 in Spain and the safety of the return to the classroom. Topics dealing with digital tools and innovative methodologies appeared with different relevance in all the periods analyzed.
Introduction
The rapid and unexpected spread of COVID-19 led to the confinement of the entire population of Spain between March 15 and June 21, 2020. The subsequent evolution of the pandemic led to new partial confinements from October 25 of the same year until May 9, 2021. Consequently, on-site classes in educational centers were interrupted and were not resumed until September 2021 with limitations.
This situation limited the coexistence of educational communities and forced virtual teaching through different media. In parallel, the use of social networks was increased as a form of remote communication (INE, 2021), singularly on Twitter which is the social network preferred by teaching communities in Spain (Marcelo and Marcelo, 2021; Santoveña-Casal and Bernal-Bravo 2019).
Globally, Twitter picked up a significant increase in negative sentiment in the pandemic period (Lwin et al., 2020). In the case of teachers, studies in other countries showed that positive and negative affective postings increased during COVID-19 (Alwafi, 2021), although the main content dealt with Information and Communication Technologies (ICTs) use. In Spain, the confinement had emotional consequences on teachers and caused teachers to alter their emotional state, which was reflected in an increase in symptoms of stress, anxiety and depression (Ozamiz-Etxebarria, 2021).
This paper presents an exploratory study on the emotional content and topics discussed by Twitter teacher communities in Spain during the confinement period, before and after the confinement. Several studies support the use of educational hashtags as a means to organize teacher conversations and analyze their contents (Greenhalgh et al., 2020; Greenhow et al., 2021; Willet, 2019). Consequently, in this study we turned to the most used educational hashtags in Spain between 2018 and 2022, among which #claustrovirtual (#virtualteachingstaff) stood out.
Literature review
Educational communities on Twitter
Until the creation and rise of social networks, one of the main obstacles faced by teachers was the creation of communication networks that would allow them to connect with colleagues from different educational centers. Today, this issue has been largely overcome with the popularization of social networks, which expand the possibilities of interaction with other teachers (Carpenter et al., 2020).
Since the birth of Twitter, this social network was used by teachers to collaborate, share experiences, train and establish new professional contacts (Carpenter and Krutka, 2015; Greenhow et al., 2021; Krutka and Carpenter, 2016).
Although it is very common for teachers to use Twitter to carry out activities with their students (Carpenter et al., 2020; Nochumson, 2020; Rosenberg et al., 2016; Xing and Gao, 2018), it is also a network widely used by teachers to keep in touch with other teachers with common interests (Luo et al., 2020).
Teachers share their experiences on Twitter and explore new ideas especially on the educational use of ICTs and professional development (Willet, 2019). Educational resources are also shared (Carpenter and Krutka, 2014; Rehm and Notten, 2016).
In addition to this content, informal online communities and networks of teachers offer emotional support (Luo and Clifton, 2017; Macià and García, 2016; Noble et al., 2016) and reinforce identity as teachers (Carpenter et al., 2020).
Literature reviews by Galvin and Greenhow (2020) and Macià and García (2016) showed that in teachers’ use of social networks, professional learning prevailed over classroom instruction. Specifically, they were used to ask and answer questions; share and find teaching-related resources; reflect; dialogue; and obtain emotional support.
With respect to the evolution of content addressed by teachers, prior to the pandemic teachers used social networks to find instructional supports and for professional development (Bruguera et al., 2019). However, during the pandemic social networks were also used to seek help with the immediate challenge of school closures and emergency online instruction (Greenhow et al., 2021).
Sentiment analysis
Sentiment Analysis (SA) also called Opinion Mining (OM) is the field of study that analyzes people’s opinions by assessing the feelings, attitudes, and emotions that are generated towards issues such as products, services, issues, or topics, among others (Liu, 2012). Although two levels of SA are usually distinguished, one for the whole document and another for each of the sentences (Liu, 2012; Medhat et al., 2014), in the case of Twitter, the analysis of each tweet allows the unification of both analyses due to the limitation of characters and the brevity of these texts.
The systematic review of the Spanish language-specific literature on this topic by Osorio et al. (2021) is particularly useful for this study given its specific focus on the Spanish language. Although Spanish is the third most used language on the Internet after English and Chinese, SA resources for this language are scarce.
Machine Learning-based SA is the favorite for Spanish language SA. In contrast, Lexicon-based SA (LB) is the least used in Spanish language and is usually translated from English (Osorio et al., 2021; Saura et al., 2018).
SA from emojis is increasingly used on Twitter because emojis act as strong indicators of sentiment and are clearly identified when analyzed from a Natural Language Processing (NLP) perspective (Novak et al., 2015; Oyinbo and Olaniyi, 2021; Rathan et al., 2018). The study by Novak et al. (2015) identifies positive emotional content in most emojis, especially the most popular ones ( ). The research by Fernandez-Gavilanes et al. (2018) delves into SA in emojis also in the context of the Spanish language and concludes that emoticons have proven to be useful in sentiment classification.
In the educational context, SA was an under-exploited resource (Chauhan et al., 2019), although in recent years it has experienced a remarkable increase (Baragash and Aldowah, 2021). Koehler et al. (2015) discuss the potential applications of SA in educational research and practice, especially on Twitter, and highlight features related to online teaching, professional development and educational communities (e.g. monitor students’ online conversations in real time, learn about students’ motivation and understanding of materia, and measure the “course mood”).
Mite-Baidal et al. (2018) and Zhou and Ye (2020) conduct a systematic review of the literature on SA in education and conclude that some of the main benefits of using SA in the educational setting are the improvement of the teaching-learning process and student achievement, as well as the reduction of course dropout. None of these studies refer to SA of teacher networks.
Aim and research questions
In this study, we conducted an exploratory study about the interests and feelings of teachers on Twitter and how these have evolved in the last 4 years due to the exceptional circumstances that have been experienced worldwide. For this purpose, this study has differentiated between three critical periods to establish the chronological evolution of teachers’ opinions and interests. Specifically, the study has been divided into pre-pandemic, confinement and state of alarm, and post-pandemic periods.
The analysis of these three distinctive periods allows us to advance the knowledge base on the role played by the social network Twitter in the educational response of teachers to the COVID-19 pandemic. To this end, the present study was guided by the following research questions: - RQ1. What was the overall activity of teachers on Twitter before, during, and after the pandemic? - RQ2. How did the polarity of sentiment evolve in teachers’ Twitter posts before, during, and after the pandemic? - RQ3. What were the main topics for teachers on Twitter before, during, and after the pandemic?
Methodology
A mixed methodology based on public data mining, semantic content analysis, and SA was used. This methodology involves the use of digital crawling data. It aims to more efficiently collect, organise and analyse generalisable samples of data representing people in virtual learning (Kimmons and Veletsianos, 2018).
Sample
The sample was extracted through the Twitter v2 API search tool. The hashtags #eduhora (#eduhour), #claustrovirtual (#virtualteachingstaff), #SerProfeMola (#beingateacheriscool), #otraeducaciónesposible (#anothereducationisposible), #claustrotuitero (#twitterteachingstaff), #profesquemolan (#coolteachers), #orgullodocente (#teacherpride), and #soymaestro (# Iamateacher) were identified. The requests were made on a monthly basis between January 2018 and March 2022. This process resulted in the identification of 30,752 tweets, from which were extracted those that not only had textual content, but also emotional and/or visual content reflected in the use of emojis. The final sample was reduced to 9462 tweets.
Teachers’ interventions on Twitter were analyzed according to the chronological evolution of the pandemic in Spain: from January 2018 to February 2020 (pre-pandemic period); from March 2020 to May 2021 (pandemic period); and from June 2021 to March 2022 (post-pandemic period), respectively.
The final dataset within each specified time frame included 3102 tweets for the prepandemic period (32.8%), 3728 tweets for the pandemic period (39.4%), and 2632 tweets for the post-pandemic period (27.8%).
Data analysis
For the analysis of the tweets, punctuation marks and unnecessary characters were removed from the JavaScript Object Notation (JSON) encoding of the Twitter API.
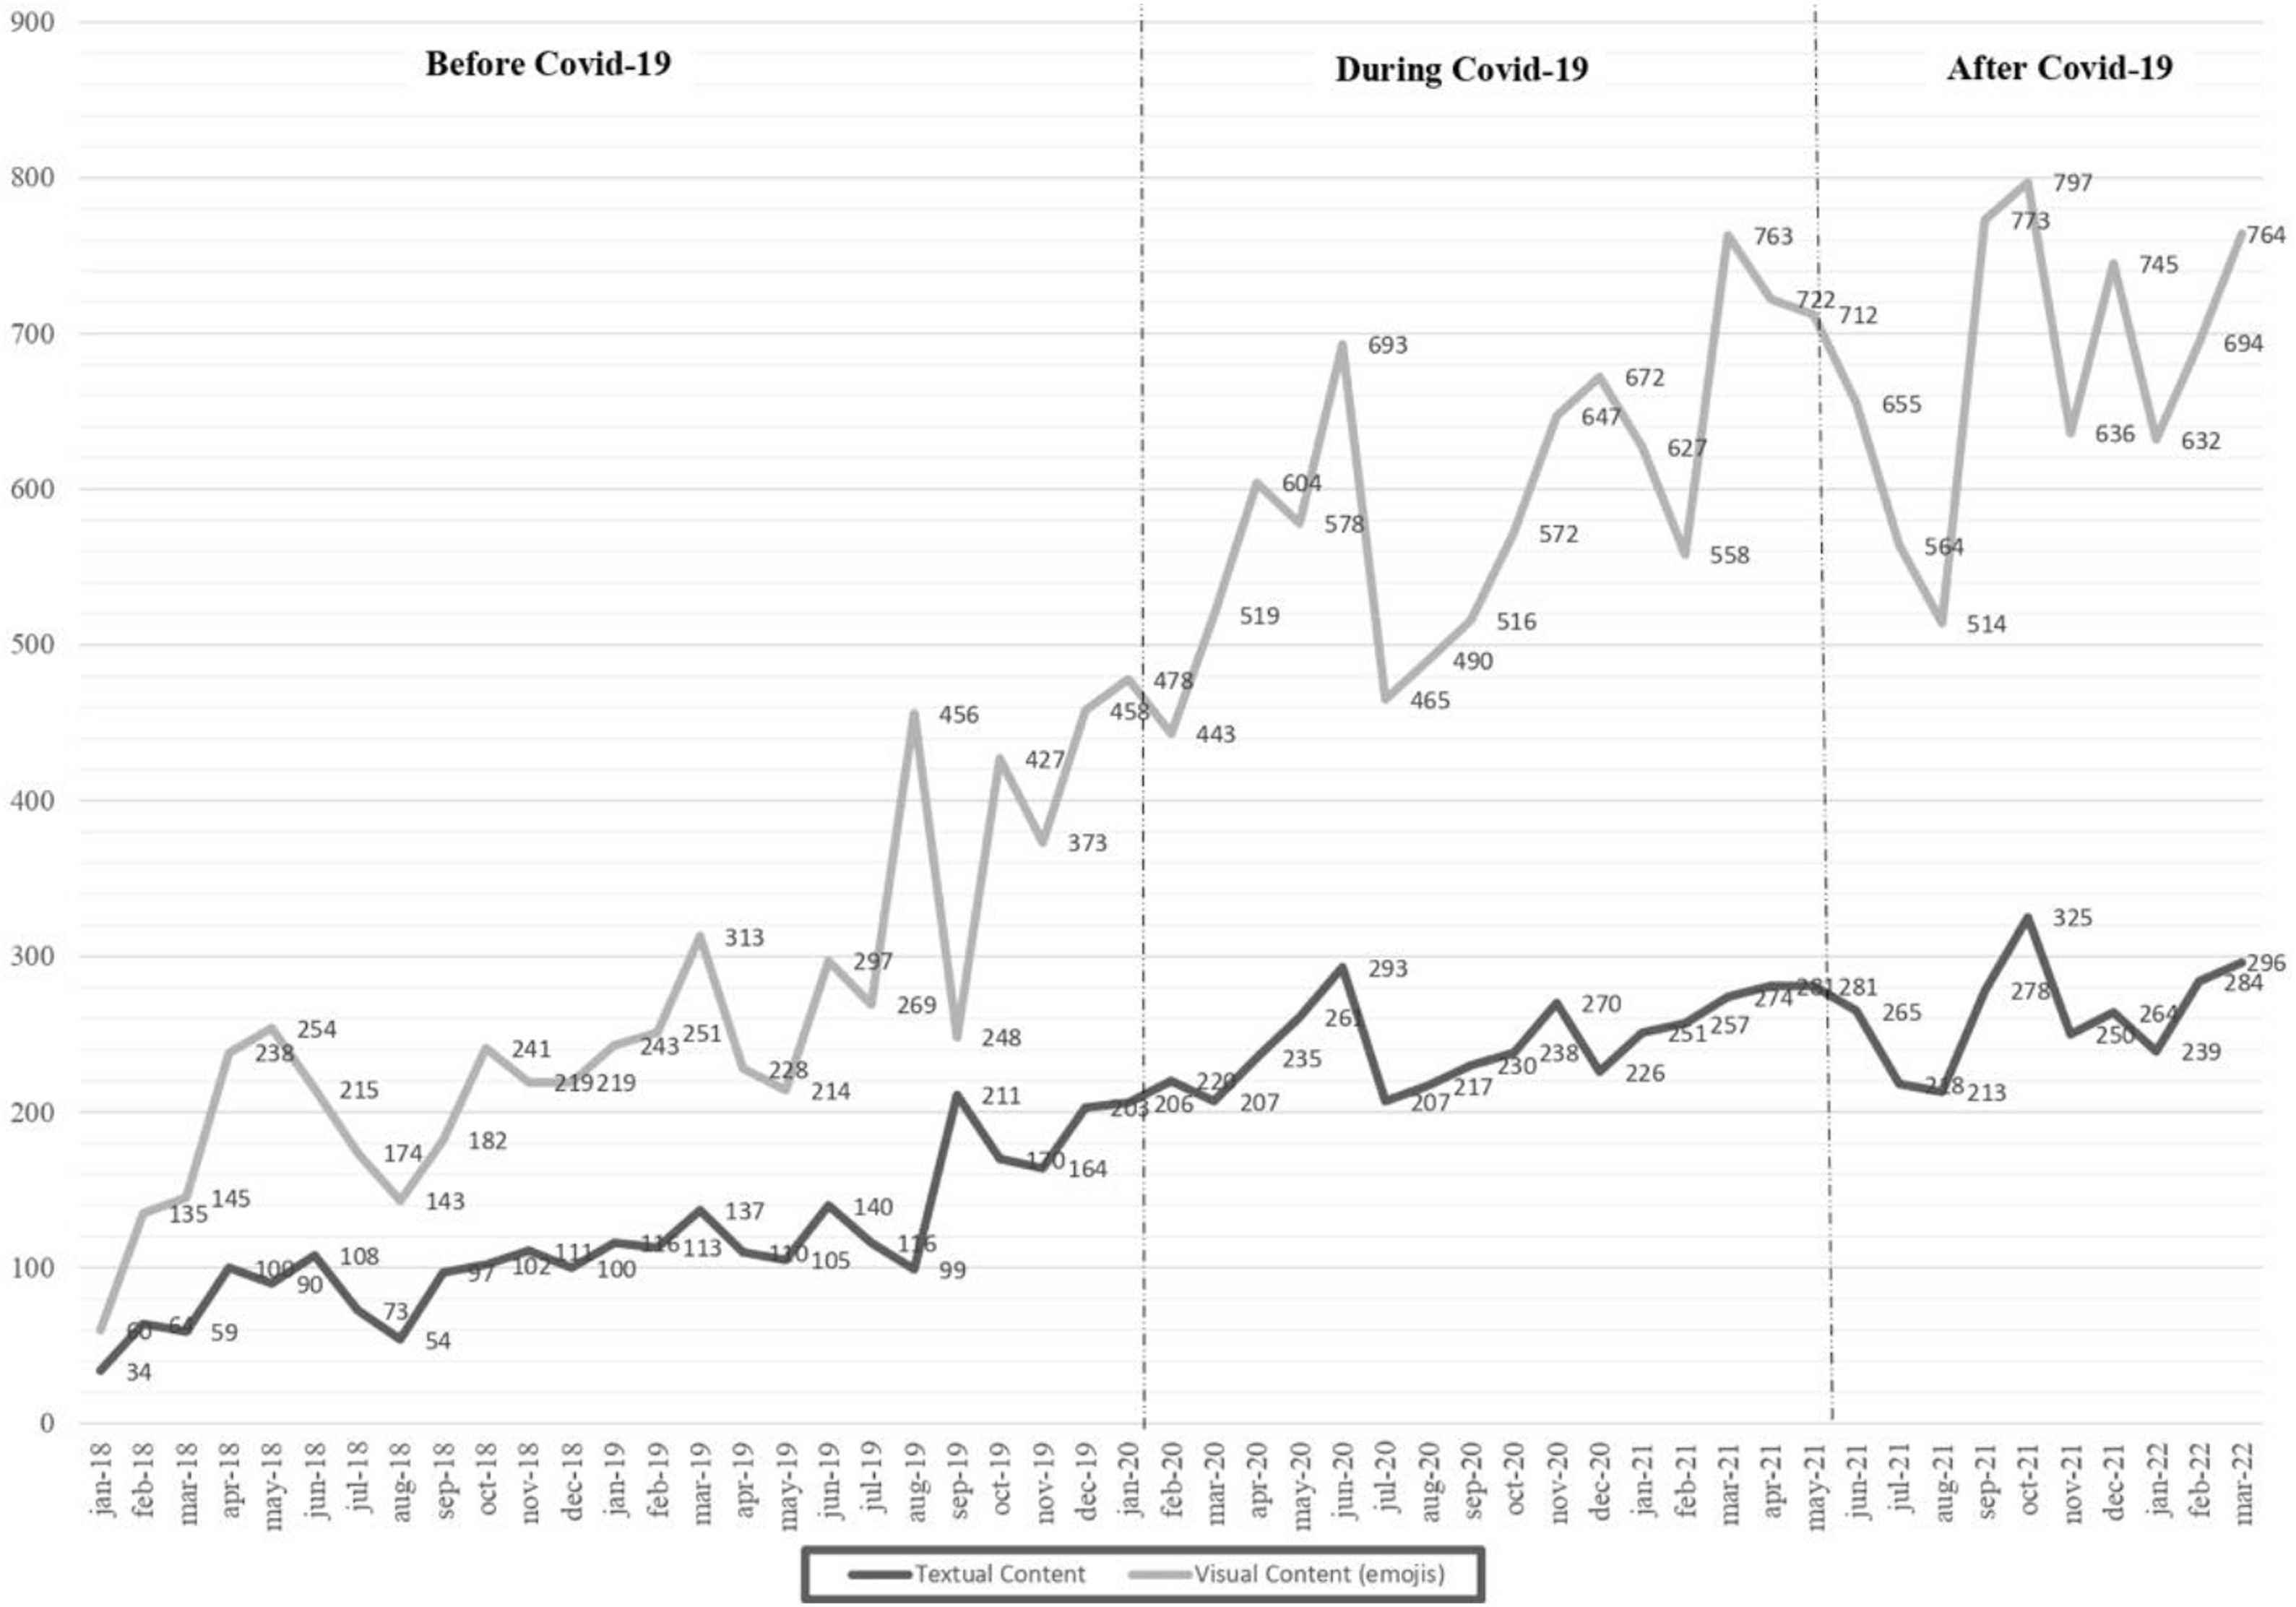
To answer the first research question, the number of tweets and the number of emojis in the sample were compared by month.
To answer the second research question, SA follows the model proposed by De Albornoz et al. (2012). First, the emotional content of each tweet is identified to different degrees. Second, tweets are classified according to sentiment polarity (positive or negative). Finally, Finally, SA is completed with visual data extracted from emojis. The results of these analyses are triangulated to determine the emotional charge of the analyzed tweets from the NLP point of view. To determine the attitude or polarity of the analyzed opinions, other previous research has been considered (Carpenter et al., 2020; Guerris et al., 2020; Kimmons et al., 2018; Xing and Gao, 2018).
The emotional content of each tweet was scored with Google’s Natural Language API that performs sentiment analysis, providing information on a scale with a numeric sentiment value ranging from −1 to +1. The Google API score was converted into a text label taking as a reference the formula validated by Quintana-Gomez (2021). Thus, values collected between 1 and 0.3 were considered positive, between 0.2 and −0.2 neutral, and between −0.3 and −1 negative.
The classification of tweets according to sentiment polarity (positive or negative) was also performed based on a semantic analysis of LB (Moreno-Ortiz, 2017; Peña et al., 2018). For this analysis, we chose to use the lexicon proposed by Hu and Liu (2004) translated from English to Spanish (Osorio et al., 2021).
Finally, SA was performed from visual data identifying the most frequent emojis in the sample (Fernández-Gavilanes et al., 2018; Novak et al., 2015; Oyinbo and Olaniyi, 2021). The occurrence of these emojis was related to previous SA results and to the polarity of sentiment in the analyzed tweets.
Results
RQ1. What was the overall activity of teachers on Twitter before, during and after the pandemic?
Figure 1 shows the total number of interventions generated on Twitter in the educational communities analyzed before, during, and after COVID-19. Overall, the number of Twitter interventions that included emojis increased significantly over the entire period studied. The first relevant peak occurring is generated during the pandemic in June 2020. After the pandemic, the number of interventions declines until October 2021, when it increases again and the maximum number of tweets within the analyzed period is reached. This increase coincides with the return to the classroom. RQ2. How did the polarity of sentiment evolve in faculty interventions on Twitter before, during and after the pandemic? Tweets and emojis before, during and after COVID-19.
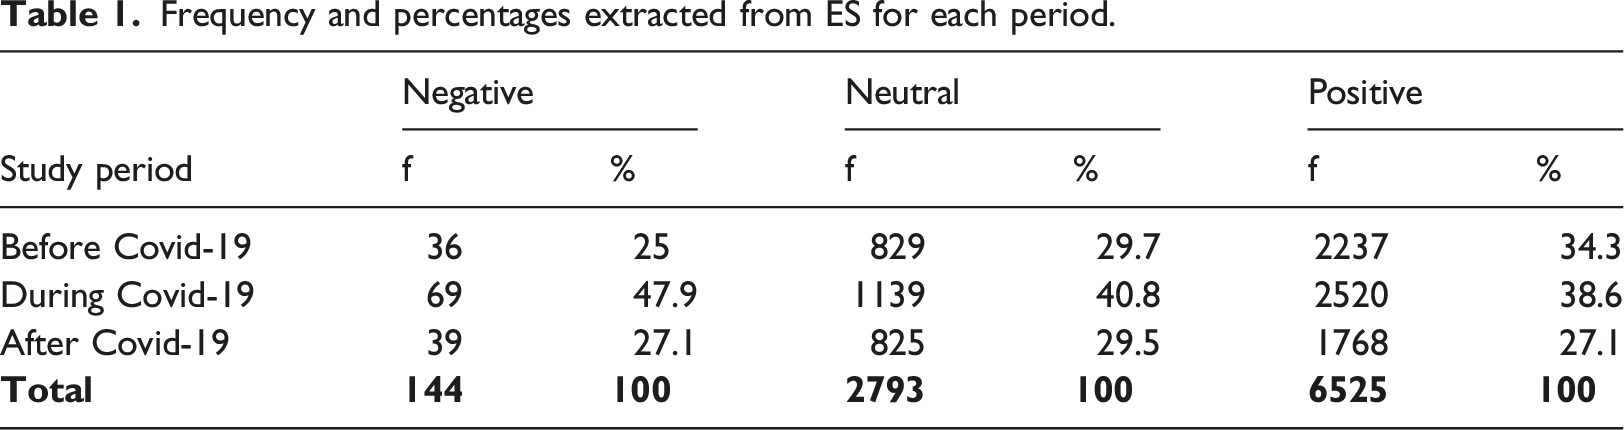
SA with Google’s Natural Language API shows a clearly positive polarity in tweets posted by faculty taking the entire sample as a whole. 69% (n = 6525) of the tweets analyzed presented a positive score between +0.3 and +1. This is followed by tweets with neutral emotional content, representing 29.5% (n = 2793). Tweets in which negative sentiments are identified were the least frequent with 1.5% (n = 144) with respect to the total sample (Figure 2). SA of total tweets.
Frequency and percentages extracted from ES for each period.
In general, tweets posted by teachers are characterized by the presence of positive sentiments, and the scarcity of tweets with negative sentiments. In the pandemic period in Spain, the percentage of tweets with positive emotional content increases significantly with respect to the previous period, reaching its maximum increase in two key moments: June 2020 and May 2021. This increase coincides with the end of the school periods of the 2019/2020 and 2020/2021 courses, which at those times were in virtual mode without face-to-face classes. Tweets with negative emotional content also increase in the pandemic period. The percentage of positive opinions decreased slightly after the pandemic, although positive polarity continued to set the trend (Figure 3). Evolution of sentiment polarity in teacher interventions on Twitter before, during and after the COVID-19 pandemic in Spain.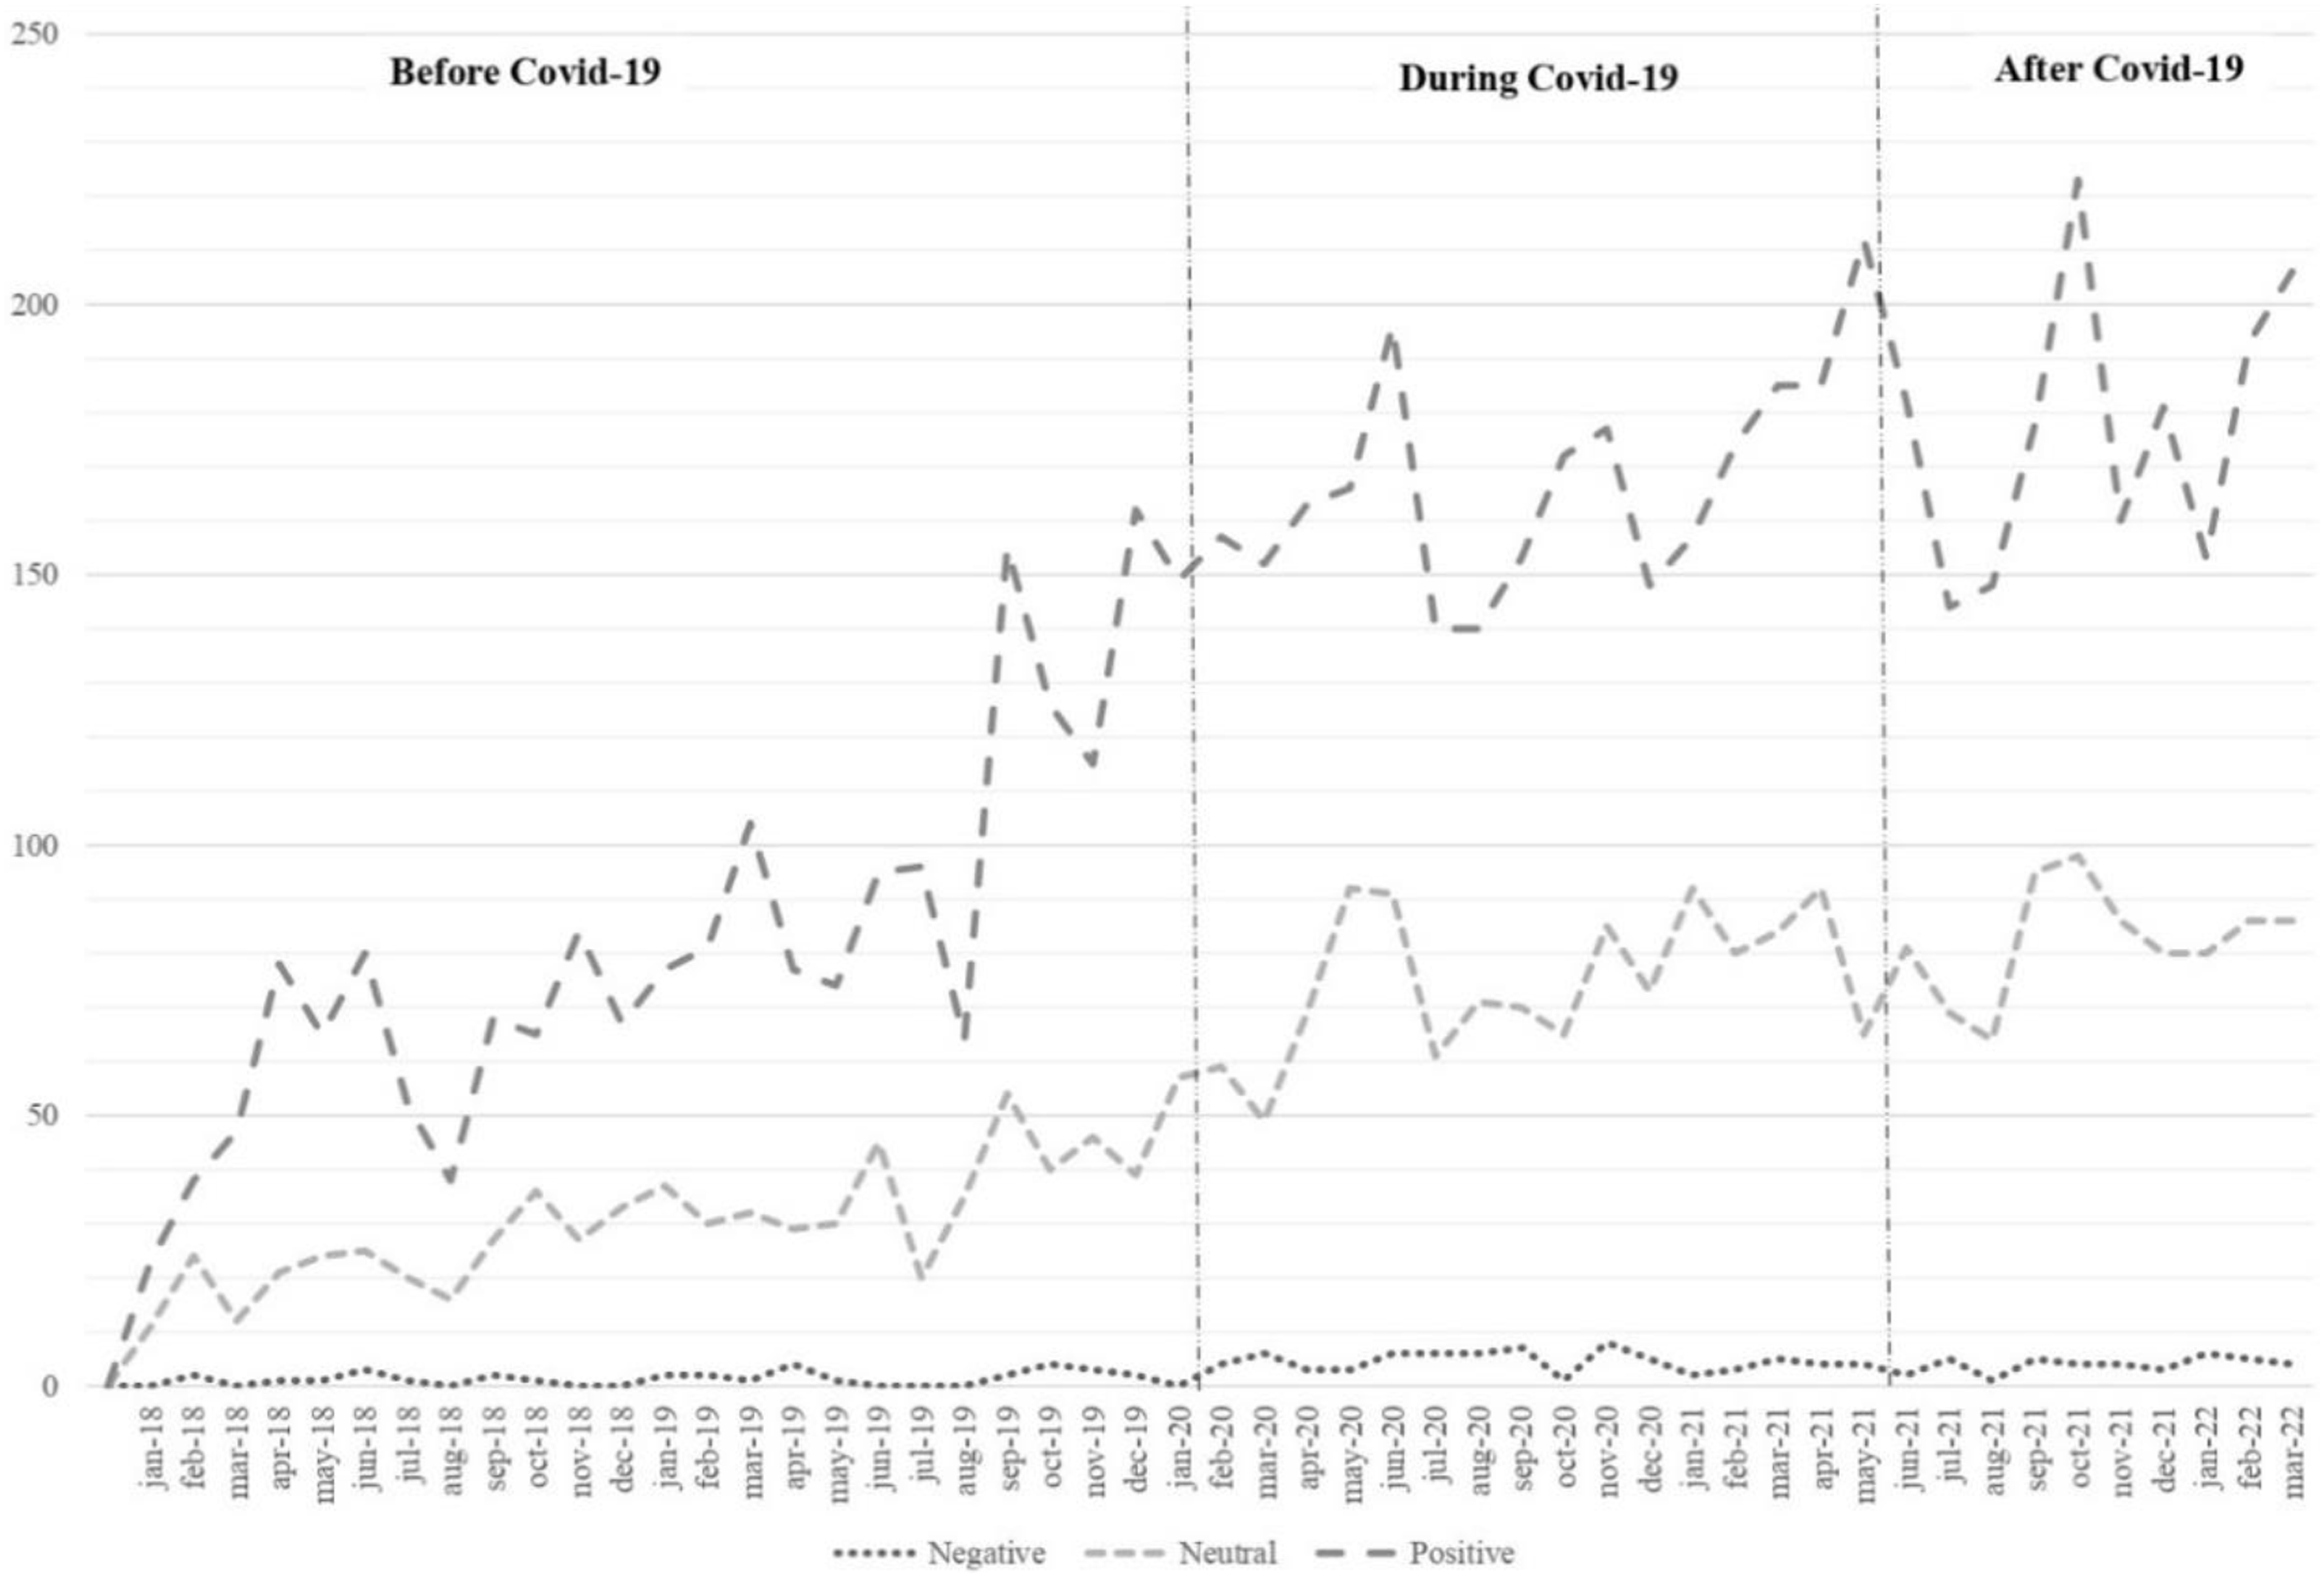
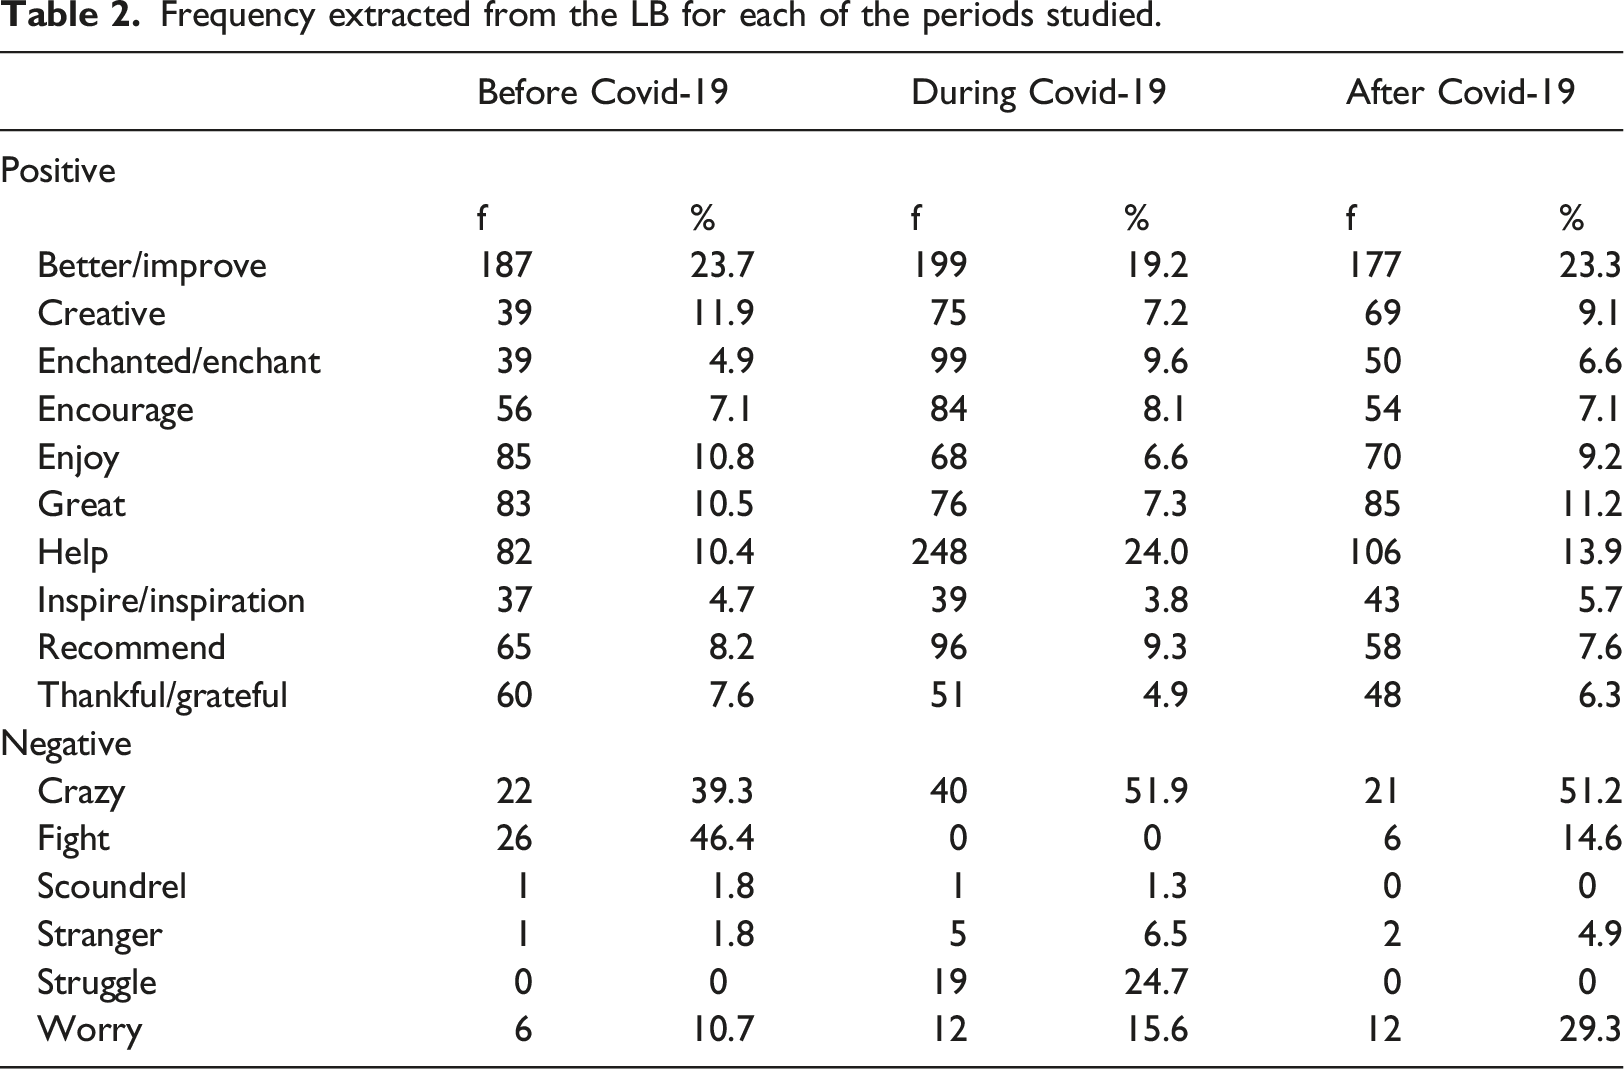
Semantic analysis was performed with SE, which extracted 3561 nouns, 1179 adjectives, and 1371 verbs from the sample. The localized terms were crossed with the Spanish translation of the lexicon proposed by Hu and Liu (2004) for LB. The result provided 94.6% of positive terms and 5.4% of negative terms. These percentages coincide with the polarity marked by the SA based on machine learning with Google’s Natural Language API. The positive terms that appeared most frequently in the teacher’s tweets in Spain were “improve”, “help”, “delighted” and “recommend”. As for negative terms, the most frequent were “struggle”, “crazy”, “worry”, “strange” and “shameless”.
Frequency extracted from the LB for each of the periods studied.
Distribution of emojis by period and sentiment polarity.

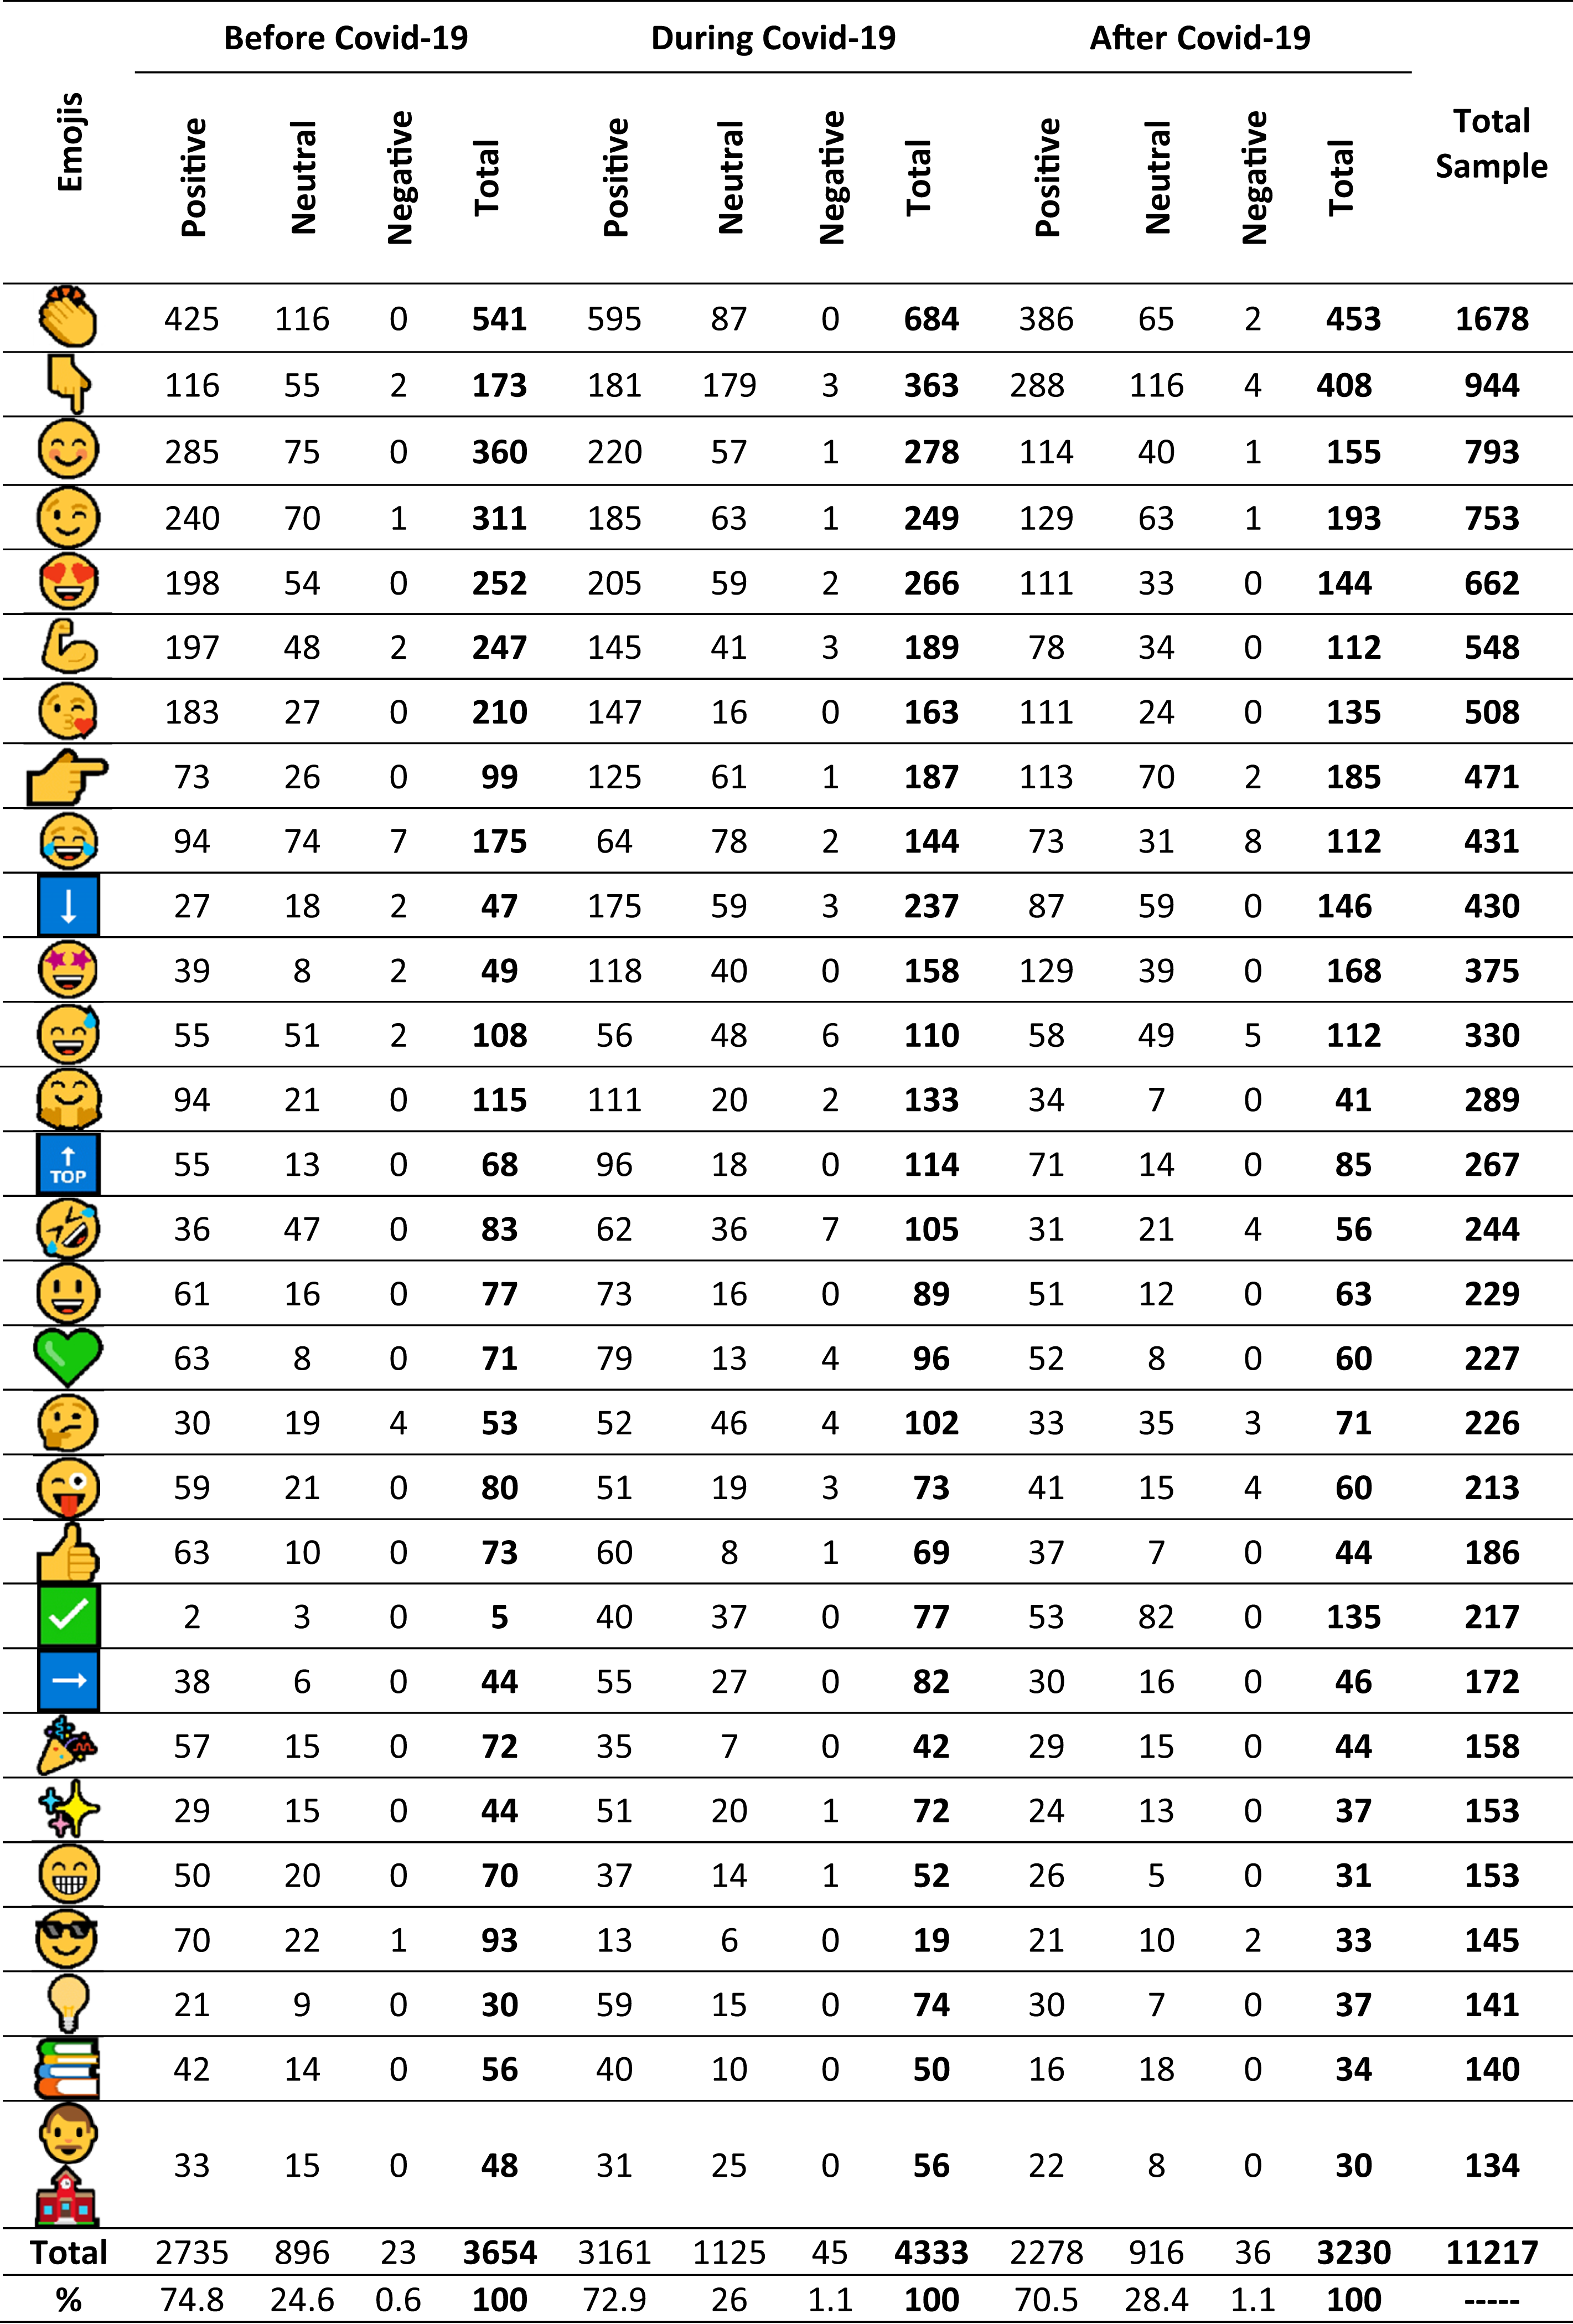
Human face emoticons representing positive emotions predominated. For example, smiley face with smiling eyes, smiley face with heart eyes, smiley face with hearts, rolling on the floor laughing, hugging face, face blowing kiss, surprised by a star, smiley face with smiling eyes, winking face, smiley face with big eyes.
Comparison of the machine learning-based SA results (Table 1) and the total emoji percentages for each period (Table 3) show a very similar sentiment polarity. The results of SA from visual data based on emojis share a strong correlation with SA based on machine learning, which reinforces the idea of using them complementarily in this type of analysis as a sentiment label. Although the LB results divide sentiments into positive and negative (Table 2), the polarity of sentiments considering only these two categories also matches the SA results from visual data. RQ3. What were the top topics for faculty on Twitter before, during, and after the pandemic?
Weight in the Topics ID corpus based on keyness Score (SE).

Topics generated by SE analysis.
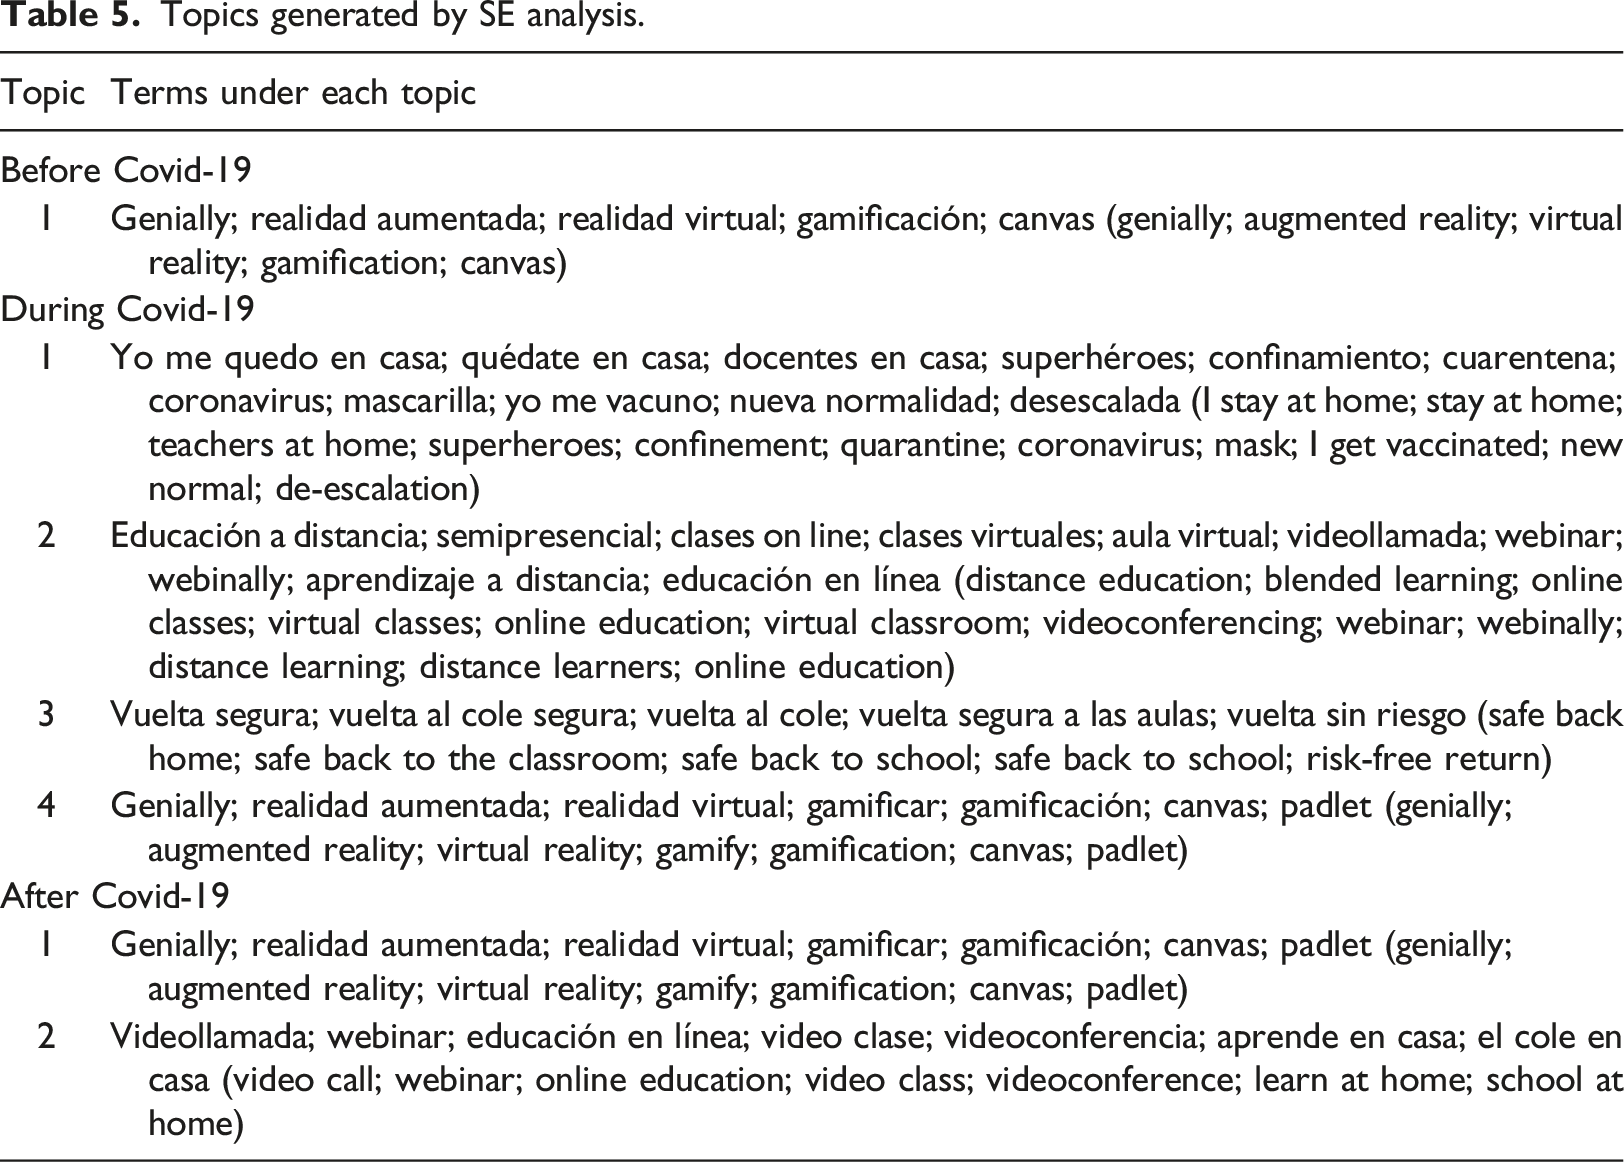
During the pandemic, four relevant topics were identified on Twitter for teachers. The first topic focused on the situation of confinement that was being experienced in Spain, the health measures and the transition to the new normality. Topic 2 was related to issues related to virtual teaching. Topic 3 reflected teachers’ concerns about the safety of the return to the classroom. Finally, topic 4 dealt with digital tools and teaching strategies, and is identified with the topic of the pre-pandemic period.
After the pandemic, the topics are reduced. Topic 1 deals again with digital tools and didactic strategies; this topic is repeated in all the analyzed periods. In this period after the confinement, a second topic appears, which is related to the first one and refers to distance communication.
Discussion
This study aims to analyze the topics of interest and sentiments of teachers in Spain before, during and after COVID-19. Interventions on Twitter over the last 4 years have been examined, which has allowed us to analyze whether significant changes have occurred in three key periods. On the one hand, a pre-pandemic period, on the other the pandemic moment linked in Spain to the confinement of citizens and the state of alarm, and finally the post-pandemic period beginning with the end of the state of alarm.
To answer the first research question on general activity, the results show that teacher use of the social network Twitter increases from 2018 to 2022. As we enter the pandemic phase, the number of interventions increased very significantly, with the high point being in June 2020, with the end of the school year that in March had become virtually taught for all school stages. These results coincide with the studies of Greenhow et al. (2021) and Alwafi (2021) for other countries with a similar situation of confinement and virtual teaching. This result is also in line with other researches that show that emergency situations influence the concern of citizens in general, and of the educational community in particular, for those issues that affect the educational environment (Li et al., 2021; Trust et al., 2020; Zhou and Mou, 2022).
With respect to the second research question, SA highlights that teachers have maintained a generally positive view, even during the pandemic, which has been contrasted with previous studies (Chanchí et al., 2021). The findings of this study further show that both tweets linked to positive sentiments and those linked to negative sentiments increased during COVID-19. As the results of Arora et al. (2021) and those of Alwafi (2021) had already established, the number of tweets linked to positive sentiments was higher than the number of tweets linked to negative sentiments.
The emoji-based SA results showed a clearly positive polarity that confirmed the results of other sentiment analysis methods, which supports the use of SA from visual data. These results are in agreement with those of Novak et al. (2015) and Fernandez-Gavilanes et al. (2018) also for the Spanish language.
In response to the third research question, the keywords extracted from the corpus provide a detailed description of the issues that were of interest to Spanish teachers before, during and after the pandemic. Interest in digital tools in education and innovative methodologies remained constant in the three periods analyzed, although with different relevance. However, in the pandemic period new topics related to the implications of confinement and the evolution of COVID-19 appeared. These data reinforce the conclusions of previous studies that emphasize the importance of Twitter for creating collaborative support networks among teachers (Alwafi, 2021; Carpenter et al., 2020; Carpenter and Krutka, 2014, 2015).
Although there have been previous studies on teacher interaction on Twitter, our data shows for the first time the topics of interest and feelings of Spanish teachers on Twitter at three key moments. This research broadens the field of knowledge and allows comparative studies to be carried out to highlight similarities and differences with other countries.
Limitations of the study
Among the limitations of this study, we can point out that it is limited to teachers in Spain. Future research could be expanded to include teachers from different Spanish-speaking countries, resulting in a comparative study with a much larger sample. Another limitation of the study is that although a mixed methodology based on public data mining, semantic content analysis, and SA was used to examine teachers’ professional networks, most of the data are quantitative. It would be valuable to use other qualitative methods (e.g., interviews or focus groups) to obtain more detailed information about faculty concerns, interests, and feelings.
Conclusions and implications
The global pandemic resulting from Covid-19 has forced the educational community to operate in a digital environment, which has resulted in an increase in the use of Twitter as a social network for teachers in Spain. The extreme situation of confinement corresponds to the maximum activity of teachers to maintain active digital educational communities.
The emotional content of teachers’ tweets presents a clearly positive polarity before, during and after the pandemic. However, in the period of confinement the emotional content of the messages increases very significantly, as well as the use of emojis. This increase implies that teachers found the ideal forum to express both positive and negative feelings in the educational Twitter communities during the confinement. The results of sentiment analysis with machine learning, LB and visual data show the same polarity and consistent percentages, which endorses the latest sentiment analysis method as a valid complement in the analysis of emotional content on Twitter. Digital tools and innovative methodologies are the preferred topics for Spanish teachers. However, during the confinement, the preferred topics were the health alert and the conditions of the return to work in the classrooms, which were perceived with uncertainty.
Footnotes
Declaration of conflicting interests
The author(s) declared no potential conflicts of interest with respect to the research, authorship, and/or publication of this article.
Funding
The author(s) received no financial support for the research, authorship, and/or publication of this article.
