
Abstract
Pavlovian-to-instrumental transfer (PIT) refers to the effect of stimuli that have been associated with a pleasant or aversive event on instrumental behaviors. Given that obsessive–compulsive disorder (OCD) is linked to excessive compulsions, which in the laboratory can be tested via testing instrumental responses, we assessed PIT effects in individuals with subclinical levels of OCD. Participants from a nonclinical population were separated in groups with low (OC−) and high (OC+) levels of OCD. Participants learned to associate one button press (R1) with the cancellation of an aversive outcome (O1) and another button press (R2) with the cancellation of another aversive outcome (O2). Subsequently, they watched stimuli of five different colors (S1–S5) that were followed by O1, O2, a novel negative outcome (O3: video of a house on fire), or two neutral outcomes (O4: plus sign; O5: caret symbol), respectively. In the last phase, participants saw S1–S5 while they were allowed to press the R1 or the R2 button. Contrary to predictions, the OC− compared to OC+ group showed somewhat stronger specific PIT effects, indicated by more R1 and R2 responses during the presentation of the S1 and S2, respectively. No reliable evidence was found for general PIT.
Obsessive–compulsive disorder (OCD) is a chronic psychiatric disorder that is mainly characterized by persistent obsessions and compulsions (American Psychiatric Association, 2013). Briefly, obsessions are recurrent, persistent thoughts, and intrusive urges, or images, whereas compulsions are repetitive behaviors or mental acts that the individuals perform driven by an obsession or due to the rules that the individual wants to adhere to. The prevalence of OCD ranges from 0.7% to 3.5% (Gustavsson et al., 2011; Kessler et al., 2005; Ruscio et al., 2010). OCD is accompanied by significant impairments in daily functioning (e.g., loss in productivity), as well as substantial direct and indirect costs (American Psychiatric Association, 2013; Angst et al., 2004). Given the significant negative impact of OCD on individuals and society, a body of literature has focused on unveiling the factors that contribute to OCD psychogenesis (Pauls et al., 2014). Importantly, this knowledge could prove invaluable in the improvement of current treatments (Ost et al., 2015; Romanelli et al., 2014).
A way to gain insight into the nature of OCD is by using associative learning procedures and specifically Pavlovian and instrumental conditioning. In aversive Pavlovian conditioning, a neutral stimulus (e.g., a picture of a white building; conditioned stimulus or CS+) is paired with an aversive stimulus (e.g., a video of a fire; unconditioned stimulus or US), whereas another neutral stimulus (e.g., a picture of a beige building; CS−) is never paired with the US. This procedure typically results in conditioned responses (e.g., higher fear toward the CS+ compared to the CS−). Pavlovian conditioning has been successfully used for testing how individuals with and without OCD differ from each other in terms of fear responding (see Duits et al., 2015).
To illustrate, Leplow et al. (2002) showed that when neutral CSs are used, inpatients with OCD show inferior differential learning compared to controls, which could suggest associative learning impairments in OCD. This hypothesis is also supported by findings of Apergis-Schoute et al. (2017), who showed that OCD patients failed to update the contingencies between the CS+/CS− and the US when those were reversed. In instrumental conditioning, the US presentation depends on whether the participant will perform an experimenter-defined response (e.g., the press of a computer key). This procedure has been used in OCD research for testing, among others, the role of purposeful actions and habits toward a CS (Nielen et al., 2009; see Gillan & Robbins, 2014, for a review). To illustrate, Gillan et al. (2014) extensively trained patients with OCD to make an avoidance response (i.e., press of a foot pedal) toward a CS to avoid a shock US. Interestingly, participants in the OCD group continued performing the avoidance response toward the CS, even when there was no chance anymore that the US would occur (i.e., the shock electrodes were detached), more often compared to a healthy comparison sample. Collectively, associative learning procedures have provided insights about the learning mechanisms in OCD and how such learning differs from healthy individuals.
Because maladaptive actions (compulsions) are a key component of OCD, further knowledge on the conditions under which these actions emerge could be useful in understanding OCD pathogenesis (Pauls et al., 2014). In this endeavor, insights from the learning and neuroscience literature could be useful. For instance, it has been suggested that instrumental responses toward a CS can be evoked even when the CS has never been explicitly trained with the specific instrumental behavior (Estes, 1948; Holmes et al., 2010; Kruse et al., 1983). This is the case of Pavlovian-to-instrumental transfer (PIT). Experimental findings show that animals and humans tend to perform the instrumental response more often during the CS presentation, relative to some control condition (e.g., a second control CS), although this behavioral response has never been explicitly paired with the CS (Holland, 2004). A PIT procedure typically entails three phases: Pavlovian, instrumental, and transfer. In the instrumental phase, participants receive rewarding stimuli (e.g., monetary rewards) when they perform an experimenter-defined response (e.g., press a button). In the Pavlovian phase, neutral stimuli (e.g., pictures; CSs) are paired with either the same rewarding stimuli as in the instrumental phase (i.e., in case of specific PIT) or a new rewarding stimulus (i.e., in case of general PIT), while the experimenter-defined response is prevented. Finally, in the transfer phase, the CSs are presented again while participants are allowed to perform the experimenter-defined response. No rewarding stimuli are presented in this last phase to attenuate new learning between the stimulus and the responses.
Experimental findings show that human and nonhuman animals tend to perform the instrumental response, although this behavioral response has never been explicitly paired with the CS (Holland, 2004). PIT effects have been extensively studied in the addiction literature (Everitt et al., 2001). Specifically, it has been argued that PIT effects show how actions (e.g., smoking) can be triggered by environmental cues (e.g., a pack of cigarettes) that have been previously paired with a positive outcome (e.g., relaxation; Childress et al., 1992; Gawin, 1991), an observation that is particularly relevant when testing relapse in addiction. Although PIT has been used for addressing approach behavior, there is little work on human avoidance PIT (e.g., Claes et al., 2016; Garofalo and Robbins, 2017; Lewis et al., 2013; Nadler et al., 2011). Importantly, PIT effects have been investigated in many other mental disorders such as schizophrenia (Morris et al., 2015), alcohol abuse (Garbusow et al., 2014; Schad et al., 2018), and have been associated with stress and anxiety levels in subclinical populations (Charpentier et al., 2015; Quail et al., 2017). Studying PIT effects could be relevant for disorders such as OCD. Specifically, it can be hypothesized that instrumental responses (e.g., excessive checking) performed in the presence of largely neutral stimuli (e.g., a gas stove that is turned off) can be triggered without any previous direct associations between the stimulus, the response, and the outcome but due to independent pairings of the behavior and the stimulus with a common outcome (e.g., a common US). As such, and in line with associative learning work in the addiction literature, PIT could prove helpful in unveiling the mechanisms of maladaptive responses in OCD.
In this line, this study explored avoidance-based PIT in individuals with high and low levels of subclinical OCD symptomatology. As there are various subtypes of OCD (American Psychiatric Association, 2000, 2013), we chose to focus on checking behavior, which is the most prevalent type (Ruscio et al., 2010). 1 Accordingly, we developed a new task based on the avoidance-based human PIT introduced by Lewis et al. (2013) and Nadler et al. (2011) and the checking behavior task introduced by van den Hout and Kindt (2004). Specifically, in the first part of the task, participants learned to avoid two negative outcomes (i.e., a video of a house collapsing and a video of a house exploding) by means of two different button presses (i.e., one button cancelled the first outcome, whereas another button cancelled the second outcome). Then, different colors of stoves were presented with either the outcome they saw before, a novel negative outcome (i.e., a video of a house on fire), or two neutral outcomes (i.e., different symbols). Participants did not have to emit any response during this phase. In the last phase, the different stoves were presented and none of them were followed by any of the outcomes (i.e., the videos of the different houses or the different symbols) while participants were free to press any of the available buttons used in the first part of the task.
Because this is the first study on PIT effects in subclinical OCD, we did not have strong directorial hypotheses. However, we can predict that if excessive instrumental behavior toward a CS would characterize OCD, then individuals with higher levels of subclinical OCD symptomatology would exhibit higher levels of specific PIT, as indicated by elevated specific responses during the transfer phase toward the stimulus that was predictive of the same outcome, than participants with lower levels of subclinical OCD symptomatology. Conversely, if individuals with higher levels of subclinical OCD would not be able to discriminate between different Pavlovian cues due to high stress levels (see Quail et al., 2017), could explain the absence of a specific PIT effect in these individuals. This prediction is in line with studies showing nondiscriminatory learning in cases of high stress and anxiety (e.g., Charpentier et al., 2015) that also characterize OCD.
Apart from specific PIT effects, we explored the differences on general PIT by testing whether responses toward the stimulus that was previously paired with the novel negative outcome would be higher compared to responses to the two neutral outcomes.
Method
Participants
Similar to previous studies in our lab (e.g., Toffolo et al., 2013), we decided to recruit individuals with high and low levels of subclinical OCD. A total of 426 students at Utrecht University or Utrecht Hogeschool were screened for obsessive–compulsive symptomatology using the Obsessive–Compulsive Inventory–Revised (OCI-R) (Foa et al., 2002).
Participants could fill in the questionnaire online, using the University website and their log in information, or on paper during a break in a class. This questionnaire has been used to select individuals with subclinical levels of OCD in previous studies (e.g., Toffolo et al., 2013). To create two extreme groups, we invited 60 individuals to the laboratory session, using the top and bottom 12.5% of the checking subscale distributions scores as an a priori cutoff (i.e., participants with the 26 lowest and 34 highest scores were invited to participate in our study). The 12.5% is half the percentage that was used by Toffolo et al. (2013). We used more extreme cutoff scores for the OCI-R scale in order to maximize our chances of detecting an effect, if there was one. Only these 60 participants completed the behavioral task.
The data from 12 participants (6 in each group) were removed because they did not report the Pavlovian or the instrumental contingencies correctly (see “Procedure” section). The final sample consisted of 20 participants in the OC− group and 28 participants in the OC+ group. This sample allowed us to detect an effect size of f = .18 (i.e., medium to lower effect size), for an α of .05, two groups, four measurements, and a power of .80. This was the minimal effect size of interest for this study and not based on prior research (as recommended by Morey & Lakens, 2016). The two groups did not differ significantly in terms of age (M = 20.42, SD = 1.96), t(45.97) = −0.05, p = .959, or gender distribution (38 females and 10 males), χ2(1) = 2.83, p = .09. The mean score in the checking subscale was 28.01 (SD = 13.53). The full data set, including the participants who were excluded from the main analyses, is available at the following URL: https://osf.io/p42jc/.
Material
Questionnaires
We screened participants for obsessive–compulsive tendencies using the OCI-R (Foa et al., 2002; Dutch version by Cordova-Middelbrink et al., 2007). The inventory includes 18 items and is designed to assess checking, hoarding, neutralizing, obsessing, ordering, and washing. Participants are asked to respond using a 5-point Likert-type scale (i.e., 0 = not at all, 4 = extremely). The scale meets sufficiently standard validity and reliability criteria (Foa et al., 2002; Hajcak et al., 2004). Given that our computer task was developed for measuring checking behavior, we selected participants based on the checking portion of the OCI-R. This consists of three questions. An example question is: “I check things more often that it is needed.”
We also assessed state and trait anxiety by means of the State and Trait Anxiety Inventory (STAI-S and STAI-T, respectively; Spielberger & Gorsuch, 1983; Dutch version by van der Ploeg, 2000). Each portion of the STAI consists of 20 items scored on a 4-point scale (1 = almost never, 4 = almost always). The scale has good psychometric properties (Spielberger & Gorsuch, 1983; van der Ploeg, 2000).
Procedure
Preparation
Prior to the main experiment, all participants read the information letter and signed the consent form. Then, they filled in the state portion of STAI. After that, the PIT paradigm followed, which consisted of three phases: instrumental, Pavlovian, and transfer (see Table 1).
Schematic of the experimental design for the PIT study.
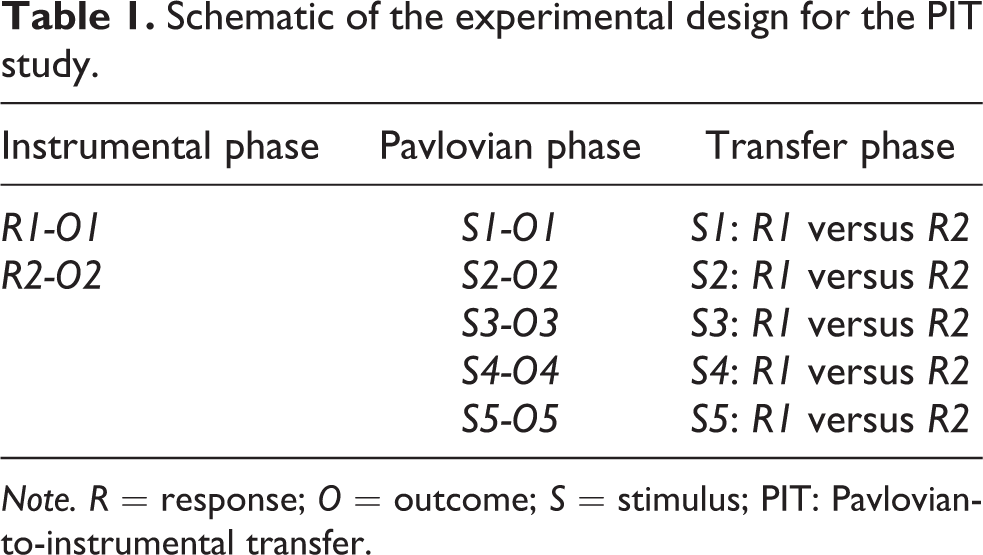
Note. R = response; O = outcome; S = stimulus; PIT: Pavlovian-to-instrumental transfer.
Instrumental phase
Participants received on-screen and verbal instructions about the instrumental phase. According to the instructions, participants would see pictures of two buildings, with one building afterward collapsing (O1) and the other one exploding (O2). They were instructed that their task was to prevent these outcomes by pressing either the A (R1) or the L (R2) button on a standard computer keyboard during the picture presentation (before the video of the building collapsing or exploding). Only one of the buttons would prevent each outcome, and the assignment of each button to each outcome was determined randomly at the beginning of each session.
Although participants could press any button as often as they wanted, pressing both buttons within each trial would not prevent the outcome presentation. A single button press to the correct button was needed to prevent the outcome from being presented.
Figure 1 shows a visual depiction of the trial sequence. Each instrumental trial started with a picture of a building for 3,000 ms. Participants were allowed to press any button during this period. In case of no or a wrong response, the outcome would be presented for 2,000 ms. In case of a correct response, there was no presentation of the outcome but the picture was presented for the remaining 2,000 ms. Participants completed 24 instrumental trials, 12 trials for each O. The trials were pseudo-randomized, with no more than two subsequent presentations of each trial type. The intertrial intervals ranged from 2,000 ms to 12,000 ms (steps of 2,000 ms).

Experimental design. Top panel: trial sequence during the instrumental phase. Middle panel: trial sequence during the Pavlovian phase. Bottom panel: trial sequence during the transfer phase.
After the instrumental phase, the learned R-O contingencies were tested. Participants evaluated the efficacy of each button to cancel the outcome on a scale from 0 (absolutely not) to 10 (totally). Similar to Lewis et al. (2013), the rating for the incorrect response was subtracted from the rating for the correct response, and the data of participants with scores equal to or lower than 0 were removed from further statistical analyses.
Pavlovian phase
The Pavlovian phase consisted of the presentation of five different stoves (S1–S5; 950 × 520 pixels), each having a different color (i.e., blue, green, purple, red, yellow). Two stoves (S1 and S2) were paired with the same outcomes (O1 and O2) as in the instrumental phase. The third stove was paired with a novel aversive outcome (O3; i.e., a video of a house on fire), and the last two stimuli were paired with two novel neutral outcomes: the plus sign (O4) and the caret symbol (O5). Which stove served as the different S was determined randomly for each participant. Participants were instructed that they had to learn which stove was paired with each specific outcome and they were not allowed to press any button during this phase.
Figure 1 shows a visual depiction of the trial sequence. Each Pavlovian trial started with a pretrial interval of 2,000–6,000 ms (steps of 1,000 ms). Then one of the stoves appeared. Gradually virtual fire appeared from four places of the stove. 2 After 2,550 ms, the outcome was presented for 1,000 ms. Which stove served as S1–S5 was determined randomly for each participant. Each S was presented nine times (45 trials in total), and it was followed always by the same O. The intertrial intervals were set to from 2,000 ms to 6,000 ms (steps of 1,000 ms).
At the end of the Pavlovian phase, participants had to choose which stove was followed by which outcome. All stoves were presented on the middle of the screen and pictures of each outcome were presented on the bottom of the screen. Participants could pick the outcome by using the computer mouse. The data of participants who did not correctly report any of the S-O contingencies were removed from further analyses (see “Participants” section above). Apart from the S-O contingencies, no further data were collected during the Pavlovian phase.
Transfer phase
During the transfer phase, participants were instructed that they would see each stove again, one at the time, and they were allowed to press any button they wanted or choose to not respond at all. Then, the transfer phase started. Each stove was presented 12 times (60 trials in total), with fire coming out of four places from the stove as was done in the Pavlovian phase. Similar to the study by Lewis et al. (2013), no outcome was presented in this phase. Instead, all stoves were followed by the message “the gas is refilling,” which was presented for 2,000 ms. 3 Unless this message was presented, participants were allowed to press any button. We did not record any press responses unless any of the Ss were on the screen.
Statistical analyses
To test whether participants learned to cancel the aversive events during the instrumental phase, we performed a 2 (Outcome: O1 vs. O2) × 2 (Response: R1 vs. R2) × 2 (Group: OC− vs. OC+) repeated measures analysis of variance (ANOVA), with outcome and response serving as the within-subjects factor and group the between-subjects factor. The dependent variables were the mean number of button presses for each stimulus. In case of violation of the assumption of sphericity, we used the Geisser–Greenhouse correction.
To test our specific PIT hypothesis, we compared between-group differences in responding to S1 and S2 during the transfer phase. We ran a 2 (Stimulus: S1 vs. S2) × (Response: R1 vs. R2) × 2 (Group: OC− vs. OC+) × 2 (Time: beginning vs. end) repeated measures ANOVA, with stimulus, response, and time serving as the within-subjects factor, and group as the between-subject factor. The factor time was included as a factor to test whether PIT effects were attenuated over time, due to the transfer phase being conducted in extinction.
Finally, to test the general PIT hypothesis, we compared differences in responding for S3, S4, and S5, during the transfer phase. We ran the same repeated measures ANOVA as for the specific PIT analyses, except that the stimulus factor had three levels (S3, S4, and S5).
Results
Questionnaires
As expected, between-group differences arose in terms of checking behavior, t(27) = −21.33, p < .001: the OC+ group had higher checking scores (M = 6.54), compared to the OC− group (M = 0). No between-group statistical differences arose for STAI-T, t(41.7) = −1.2, p = .238, or trait anxiety, t(46) = −1.73, p = .091. Table 2 shows mean characteristics for groups. 4
Background characteristics (mean and standard deviations or raw numbers) per group.

Note. STAI = State and Trait Anxiety Inventory; OCI-R = Obsessive–Compulsive Inventory–Revised.
Instrumental conditioning results
Results showed that participants learned to perform the correct response for both O1 and O2 as indicated by a significant Outcome × Response interaction, F(1, 46) = 62.96, p < .001,

Barplots of mean performance in the instrumental phase per outcome and button response. Error bars denote standard errors.
Specific PIT results
Results showed that participants performed R1 more frequently during the presentation of S1 and R2 more frequently during the presentation of S2 as shown by a significant Stimulus × Response interaction, F(1, 46) = 34.62, p < .001,

Barplots of mean performance in the transfer phase per outcome and button response. Error bars denote standard errors.
Given the significant Stimulus × Response × Group interaction, we followed up our analyses with separate repeated measures ANOVAs within each group. Results showed the same pattern of responses across both groups but now the rate of responding was higher for the OC− group, Stimulus × Response interaction, F(1, 19) = 19.76, p < .001,
General PIT results
Regarding our exploratory hypothesis, we found a significant Stimulus × Response interaction, F(1.22, 56.12) = 4.06, p = .041,
Follow-up post hoc analysis showed that participants pressed the R1 button more often during the presentation of S3 (i.e., novel threat outcome) than S5 (i.e., the caret symbol), t(47) = 2.29, p = .026. Taken together, there is some, although not strong, evidence for the presence of a general PIT effect, without any between-group differences.
Discussion
We compared PIT effects between individuals with low (OC−) and high (OC+) levels of subclinical OCD symptomatology in an avoidance-based PIT. To our knowledge, this is the first time that PIT performance was tested in a population with OCD-related symptomatology. Results showed that both groups exhibited a specific PIT effect, as reflected in the transfer phase, by more frequently pressing the R1 button during the presentation of the S1 and pressing the R2 button during the presentation of S2. Importantly, although both groups exhibited the predicted effect, this effect was somewhat stronger in the OC− compared to the OC+ group as indicated by the differences in the estimated effect sizes across groups. We also found limited evidence for the presence of a general PIT effect. Specifically, participants pressed the R1 button more often during the presentation of S3 (i.e., the novel negative stimulus) than S5 (i.e., the caret symbol), and this effect was comparable between groups. Different lines of explanations can be given for these specific and general PIT results.
No between-group differences in terms of trait or state anxiety arose. This may be because the sample had subclinical levels of OCD. Nonetheless, we think it is important to refer to the potential role that anxiety and stress could have played in our results. Specifically, the limited differentiation between the R1 and R2 in the OC− compared to the OC+ group in transfer phase is in line with previous studies showing that individuals under stress or anxiety show limited discriminatory learning in conditioning procedures (e.g., Charpentier et al., 2015; Duits et al., 2015). Another way to explain these findings is by considering that uncertainty, which is also linked to anxiety and stress (Gentes & Ruscio, 2011), promotes excessive checking in individuals with subclinical levels of OCD (Toffolo et al., 2013)—with such checking ironically increasing, rather than decreasing, memory trust (Dek et al., 2010)—resulting in suboptimal performance. Lastly, increased stress and anxiety are linked with biases in decision-making, such as worse economic decisions when emotional stimuli are present (Xu et al., 2013), and with increased emotional reasoning, rather than merely focusing on objective situational information (Engelhard & Arntz, 2005). Although as mentioned before, bringing up these hypotheses need to be tested in samples where there are also differences in anxiety levels, the weaker specific PIT effects in individuals with high levels of OCD could point to the potential influence of stress, anxiety, and/or uncertainty in these individuals, resulting in limited differentiation between R1 and R2.
Although we tested general PIT effects only for exploratory reasons, we acknowledge that our results partially contradict those by Lewis et al. (2013). In that study, healthy individuals underwent an avoidance-based PIT task. Results showed that healthy individuals exhibit both specific and general PIT effects. Although we found clear specific PIT effects, we found only weak evidence for the presence of a general PIT. These differences could be explained by procedural deviations between the different studies. Lewis et al. (2013) used a game-like scenario in which participants had to avoid attacks from different on-screen creatures (e.g., goblins) by using specific shields. In our study, we tailored our task after an impulsive-like checking scenario, where participants had to learn to avoid different house being destroyed. Arguably, the two experiments could be considered only conceptually similar. As such, procedural differences between these studies could have resulted in differences in outcomes for the general PIT.
Our study has limitations. First, we used a relative small sample size, although it was large enough to detect medium to small effects. Second, although we found between-group differences in terms of OCD symptoms, there were no between-group differences in trait anxiety, possibly due to random sample variations. Third, our design allowed us to evaluate PIT during the S presentations, but it did not include a baseline phase to assess whether the two groups showed similar performance in absence of the different Ss. So, we do not know whether the groups have similar baseline instrumental performance in the absence of the stimuli, which would have made our results stronger. Although responses outside the S presentation would not be expected, future studies should also assess instrumental performance during the transfer phase outside the S presentation. Finally, the non-observation of between-group differences in the general PIT could stem from the confusion of the novel outcome with the previously presented outcomes (e.g., a house on fire could also explode or collapse). However, this is unlikely because for both S1 and S2 no videos of houses on fire were shown before videos of exploding or collapsing houses.
All in all, by using an avoidance-related PIT, we explored whether participants with higher levels of OCD symptomatology exhibit higher performance, compared to participants with lower levels of OCD. Our results provide some preliminary evidence that individuals with lower subclinical levels of OCD show somewhat stronger specific PIT than individuals with higher levels. We acquired also preliminary but weak evidence for the presence of a general PIT. We argue that together with other associative learning tasks (e.g., Pavlovian conditioning procedures), the use of PIT could prove useful in further testing how learning processes contribute to OCD symptomatology.
Footnotes
Acknowledgments
The authors would like to thank Dieuwke Sevenster for help with the design of this study and Rosa Ratsma for assisting with data collection as well as for programming parts of the statistical analyses. They would also like to thank Jur M. Kersten, Kubra Simsek, Floor Schijen, Myrthe van Gestel, and Romy Schouten for collecting the experimental data.
Authors’ note
Angelos-Miltiadis Krypotos is now affiliated also with the Health Psychology Research group at KU Leuven.
Declaration of Conflicting Interests
The author(s) declared no potential conflicts of interest with respect to the research, authorship, and/or publication of this article.
Funding
The author(s) disclosed receipt of the following financial support for the research, authorship, and/or publication of this article: This study was supported by a VICI grant (453-15-005) awarded to Professor Iris M. Engelhard by the Netherlands Organisation for Scientific Research (NWO).