
Abstract
Objectives
Although cardiac function is truly vital, and can be adversely affected by many diseases, conventional quantitative global function analysis from images is largely limited to assessing the cardiac volumes at end-diastole and end-systole, and the associated ejection fraction, due to the time-consuming associated image segmentation. Advances in AI-assisted cardiac image segmentation can potentially enable more detailed analysis of the dynamic changes in cardiac volumes over the cardiac cycle, in clinically practical times, but there are now no standardized ways to analyze such data. In this work, we propose a systematic approach to the analysis of dynamic global cardiac function from imaging data.
Design
We use some cardiac magnetic resonance imaging (CMR) data here to illustrate this approach, but the methods are not limited to MRI. The focus here is on the technical approach, rather than on potential clinical applications. Representative short-axis cine CMRs from 19 normal subjects and 22 patients with clinical diagnosis of “heart failure with preserved ejection fraction” were analyzed for ventricular volumes over the cardiac cycle. The resulting data were used to calculate a set of dynamic global function variables.
Results
A set of representative measures of the timing and rates of ventricular emptying and filling is promising as compact means to characterize dynamic global function.
Conclusions
More efficient cardiac segmentation offers the potential to characterize dynamic global cardiac function, through a set of representative measures of the timing and rates of ventricular emptying and filling.
Keywords
Introduction
Cardiac function is truly vital; it can be adversely affected by many conditions. The cardiac cycle is composed of two principal components: ventricular ejection (systole) and filling (diastole). Systolic function is determined by interactions between the resistance to ventricular outflow (“afterload”), force generation by the myocardium (“contractility”), and the degree of ventricular filling (“preload”). Diastolic function also depends on myocardial stiffness and recoil, as well as atrial pressure. Diastole has three phases: rapid early filling, relatively quiescent diastasis, and atrial contraction. There are also isovolumic phases between systole and diastole. Many diseases can impair different aspects of cardiac function; thus, evaluation of cardiac function can be valuable for diagnosing heart disease and guiding its treatment.
While many medical imaging methods, such as cardiac magnetic resonance imaging (CMR), can provide good quality images of the beating heart, current assessment of regional heart wall motion is mostly just qualitative. Quantitative global function analysis is mostly limited to measurement of the ventricular volumes at end-diastole (ED), EDV, and end-systole (ES), ESV, with associated calculation of: 1) the difference of those volumes, the stroke volume (SV), and 2) the ratio of the SV to the EDV, the ejection fraction (EF)1,2; this limitation reflects the practical challenges of doing the associated image segmentation. The EDV is often indexed to the body surface area, as EDVi. While the EF is easily understood and is clinically useful, it is a relatively insensitive measure of function; for example, about half of patients with symptoms of heart failure have an essentially normal EF (“heart failure with preserved EF”, HFpEF). 3 The EF also provides no direct information about diastolic function, as it is only defined by the endpoints of the cardiac cycle. While it has been suggested that the rates and times of peak filling may reflect the diastolic state of the ventricles, 4 there has been little experience with this analysis. While echocardiography is often used to evaluate diastolic function, 5 there are no generally used CMR measures of diastolic function; as many clinical conditions may adversely affect diastole before the EF declines, e.g. transplant rejection6,7 and cardiotoxicity of cancer chemotherapy, 8 better assessment of diastolic function could improve clinical management of such patients.
Recent advances in artificial intelligence (AI)-aided segmentation offer the possibility of carrying out more extended function analysis,9–11 although the current segmentation results still generally require some interactive correction. In the expectation that such improved segmentation methods will soon make it practical to measure the ventricular volumes over the whole cardiac cycle, we have explored some approaches to characterization of dynamic global function (DGF) with such expanded data sets. Although there have been prior considerations of ways to characterize DGF from CMR-derived left ventricle (LV) volumes over time, e.g. peak early and late diastolic filling rates and their ratio12,13 (analogous to the use of “E” and “A” transmitral flow waves to characterize diastole in echocardiography 14 ), we also consider some alternative DGF characteristic variables.
While our data was drawn from CMR images, the approach can be used with volume-time data derived from any imaging modality, e.g. radionuclide imaging 15 or CT.16,17 We focus here on describing some potentially useful ways to characterize dynamic global function from changing ventricular volumes; there is currently no generally accepted approach to such analysis. There is no attempt to determine the expected range of normal values of the associated function variables or to evaluate their potential clinical utility.
This article is an augmented version of a prior report in the proceedings of the Functional Imaging and Modeling of the Heart 2025 conference. 18
Materials and methods
Subjects
Representative normal subjects were selected from a series of normal volunteers (screened with clinical history, vital signs, and ECG) previously imaged with long-axis (LAX) and short-axis (SAX) cine CMR. Representative patients were selected from a series of patients found through retrospective search of the electronic medical records (EPIC) for patients with a clinical history of HFpEF who had been imaged with CMR. The study was conducted under an IRB-approved protocol. Relevant subject demographic data (including age, sex, height, and weight) and heart rate were also recorded and anonymized.
Images
CMR imaging included conventional LAX and SAX cine images spanning the ventricles; representative technical factors included: retrospective gating, FOV 300–340 mm, slice thickness 8mm, slice spacing 2–4 mm, and 25–35 frames per cardiac cycle; imaging was performed on 1.5T and 3T clinical MRI systems (Siemens Healthineers).
Image analysis
Circle software (cvi42) was used for interactively corrected AI-guided segmentation of the LV and right ventricle (RV) endocardial contours over the whole cardiac cycle. A stylus-enabled tablet was used for the contour corrections. 19 A “stack-of-coins” approach was used to calculate the total ventricular volumes over time, V(t), from the SAX image wall contours at each cardiac phase, including only the ventricular portion of the cavity at each cardiac cycle phase when the (spatially fixed) image location straddled the moving atrioventricular junction; correlation of slice location with corresponding cardiac structures in LAX images helped this.
Dynamic function analysis
Conventional “static” global function measures, including the EF and EDVi, can be directly calculated from the volumes at ED and ES; when available, the full set of V(t values) can be used to calculate additional dynamic function-related variables. In order to make the dynamic function variables more easily comparable between subjects, we normalize the volumes to EDV, and the image frame times to the cardiac cycle length, both scaled to the range 0 to 1 (with the time of the initial frame denoted “0”; cine imaging is triggered by detection of the QRS complex); these normalized relative values can be readily rescaled back to absolute values. While more complex than the simple EF and EDVi, DGF can be characterized through a relatively limited set of representative volumes, rates of change of volume, and characteristic times. A simple way to characterize dynamic global function is through the times at which V(t) is equal to EDV-SV/2 in systole (t1/2S) and diastole (t1/2D). If they can be derived from the data, the durations of the isovolumic phases in systole (tiS) and diastole (tiD) provide indications of the rates of onset of contraction and relaxation, respectively; if the isovolumic periods are not clear from the volume data alone, the associated valve opening and closing times can be derived directly from the cine data, e.g. for the aortic and mitral valves from the three-chamber view. In mid-diastole, there is normally a relative plateau of V(t) during diastasis (Vd); the fraction of EDV that has been regained at that time is a measure of the effectiveness of early rapid filling. The rates of volume change, dV/dt, in systole and diastole directly reflect ventricular performance; the rate of volume change at the time of a given frame can be calculated from the central difference of the volume relative to volumes at adjacent frames, wrapping around to the first frame at the last frame. The time and value of the peak magnitude of dV/dt in systole (tps and dVps, respectively) provide measures of the ejection. There are typically two peaks of dV/dt in diastole, one during early rapid filling and one during atrial contraction (with a trough between them during diastasis); the times and values of the peak magnitude of dV/dt in those phases (tpe and dVpe, and tpa and dVpa, respectively) provide measures of those components of the filling process, while the trough between them (dVd) indicates how much filling slows during diastasis. The durations of the early and atrial filling phases (te and ta, respectively) provide additional characterization of these phases. These various dynamic function variables are schematically illustrated in Figure 1.
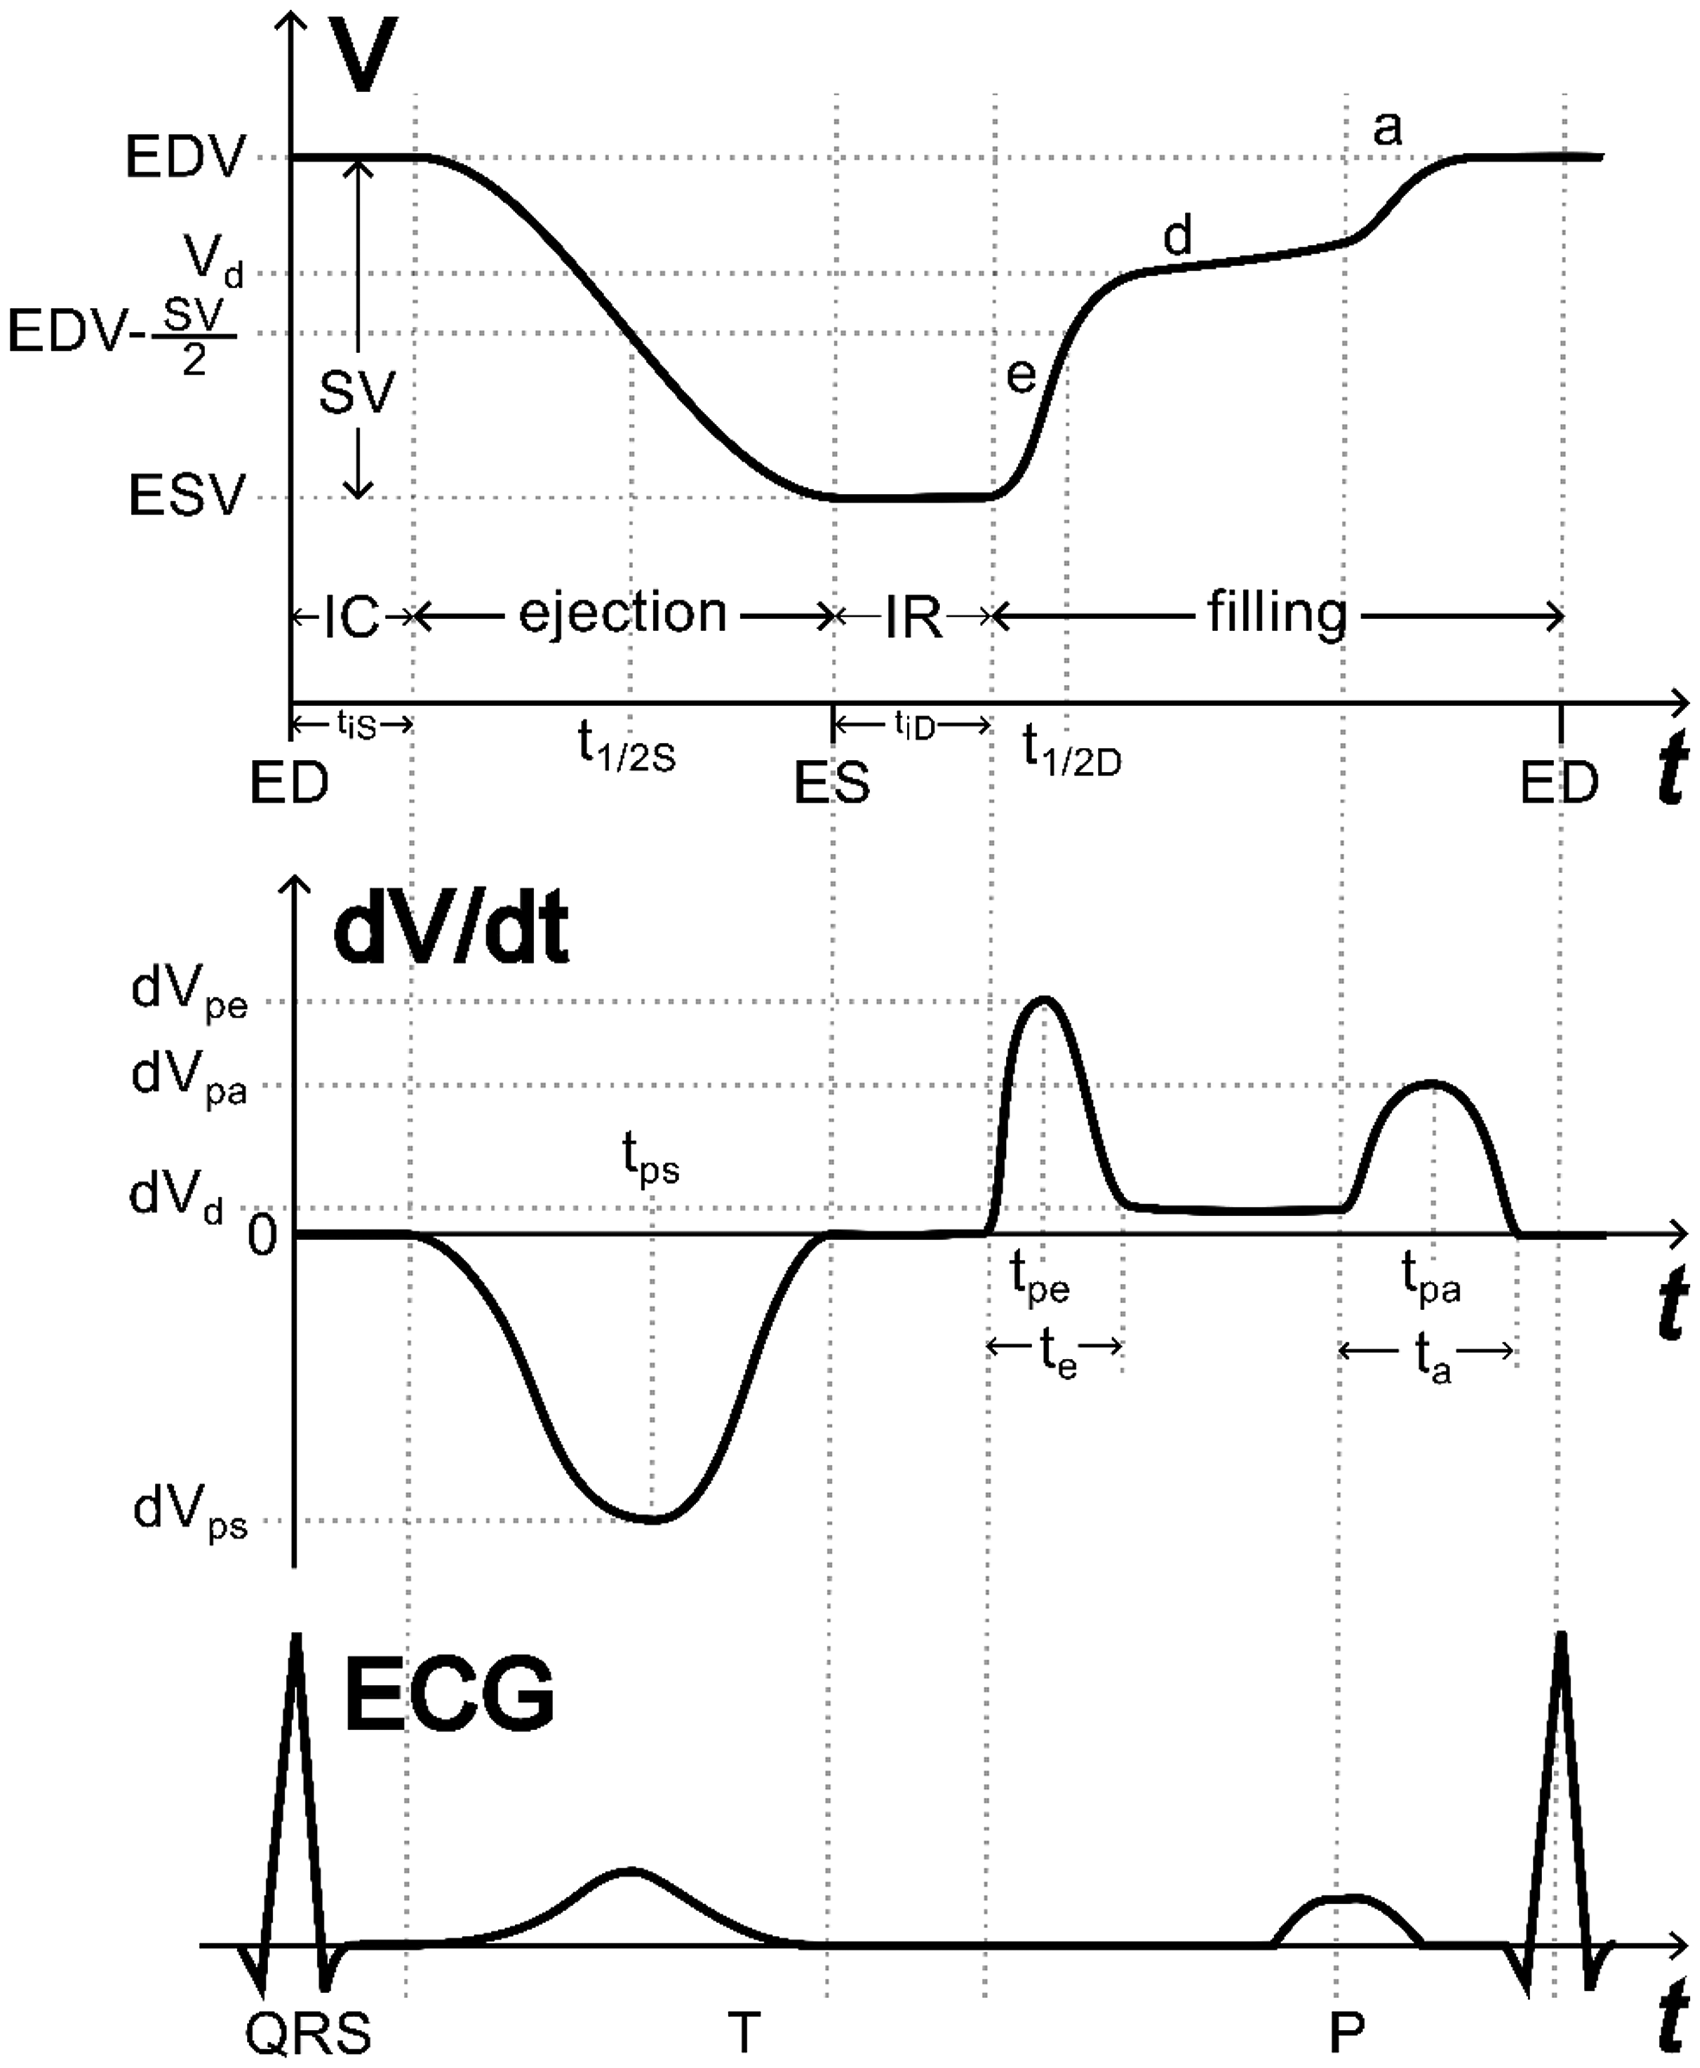
Schematic cardiac cycle, showing ventricular volumes (top), rate of change of volume (dV/dt) (middle), and the ECG (bottom), from end-diastole (ED), through end-systole (ES), and back to ED, along with some representative dynamic values and times. The stroke volume (SV) is the difference between the end-diastolic volume (EDV) and the end-systolic volume (ESV). The duration of the isovolumic contraction phase (IC) at the start of systole is tiS; the duration of the isovolumic relaxation phase (IR) at the start of diastole is tiD (note that the isovolumic phases may not be well-defined from volume data alone). The halfway point of ejection is t1/2S; the halfway point of filling is t1/2D. The volume at diastasis, Vd, may not have a well-defined associated time. The durations of early diastolic and atrial filling phases are te and ta, respectively. The peak magnitude rate of ejection in systole, dVps, is reached at tps (not necessarily the same as t1/2S). The peak rate of filling in early diastole, dVpe, is reached at tpe; the peak rate of filling in atrial contraction, dVpa, is reached at tpa. The rate of filling in diastasis (mid-diastole) is dVd.
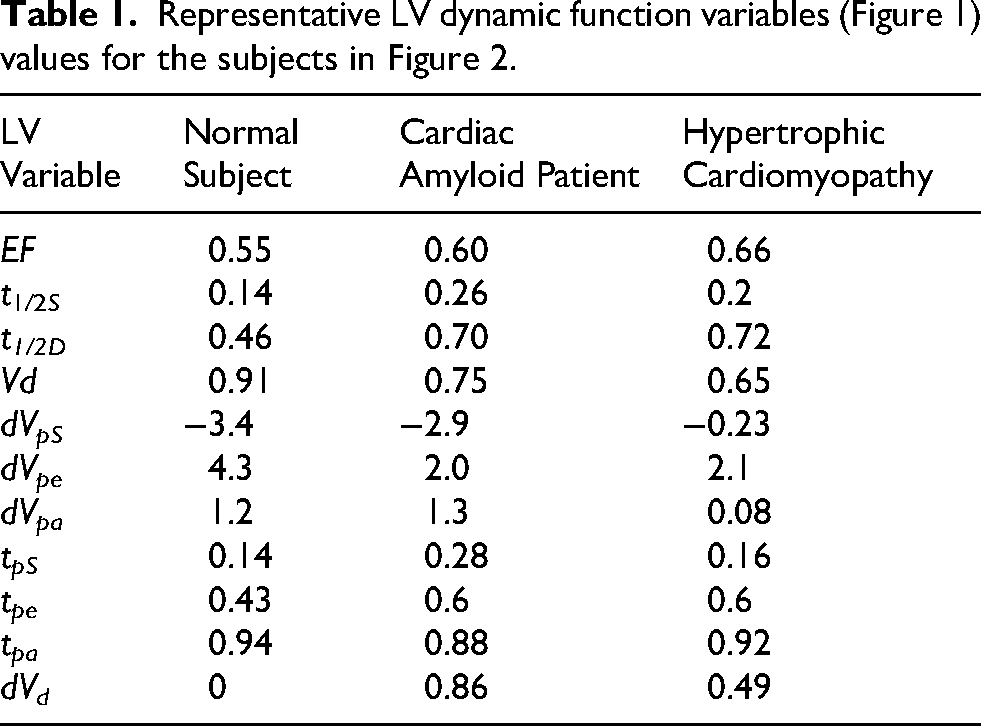
Representative normalized values of V(t) and dV/dt over the cardiac cycle are shown in Figure 2, for a normal subject, a patient with cardiac amyloid, and a patient with hypertrophic cardiomyopathy (HCM) with LV outflow obstruction, mitral regurgitation, and ventricular pacing. Note that the normal subject has relatively rapid ejection and early filling, and a distinct diastasis phase with a volume, Vd, close to EDV. In contrast, the amyloid and HCM patients, who have similar EF, have more protracted ejection and early filling phases and no distinct period of diastasis; these differences are reflected in the corresponding DGF variables derived from the dynamic volume data (Table 1). Particularly promising variables for distinguishing these subjects include the systolic and diastolic halftimes, the time and value of peak early diastolic filling, and the volume and rate of filling at diastasis. However, some otherwise normal subjects can have relatively slowed diastolic filling, particularly with aging (LV more so than RV) (Figure 3, Figure 4), while some patients can have relatively preserved diastolic variables. Normal subjects <60 years old had average/sd values for LV diastolic t1/2, Vd, and dV/dt peak of 0.55/0.08, 0.89/0.42, and 3.5/1.1, respectively; corresponding values for age 60 and above were 0.73/0.02, 0.74/0.01, and 1.7/0.95 (sd not meaningful for such few subjects).
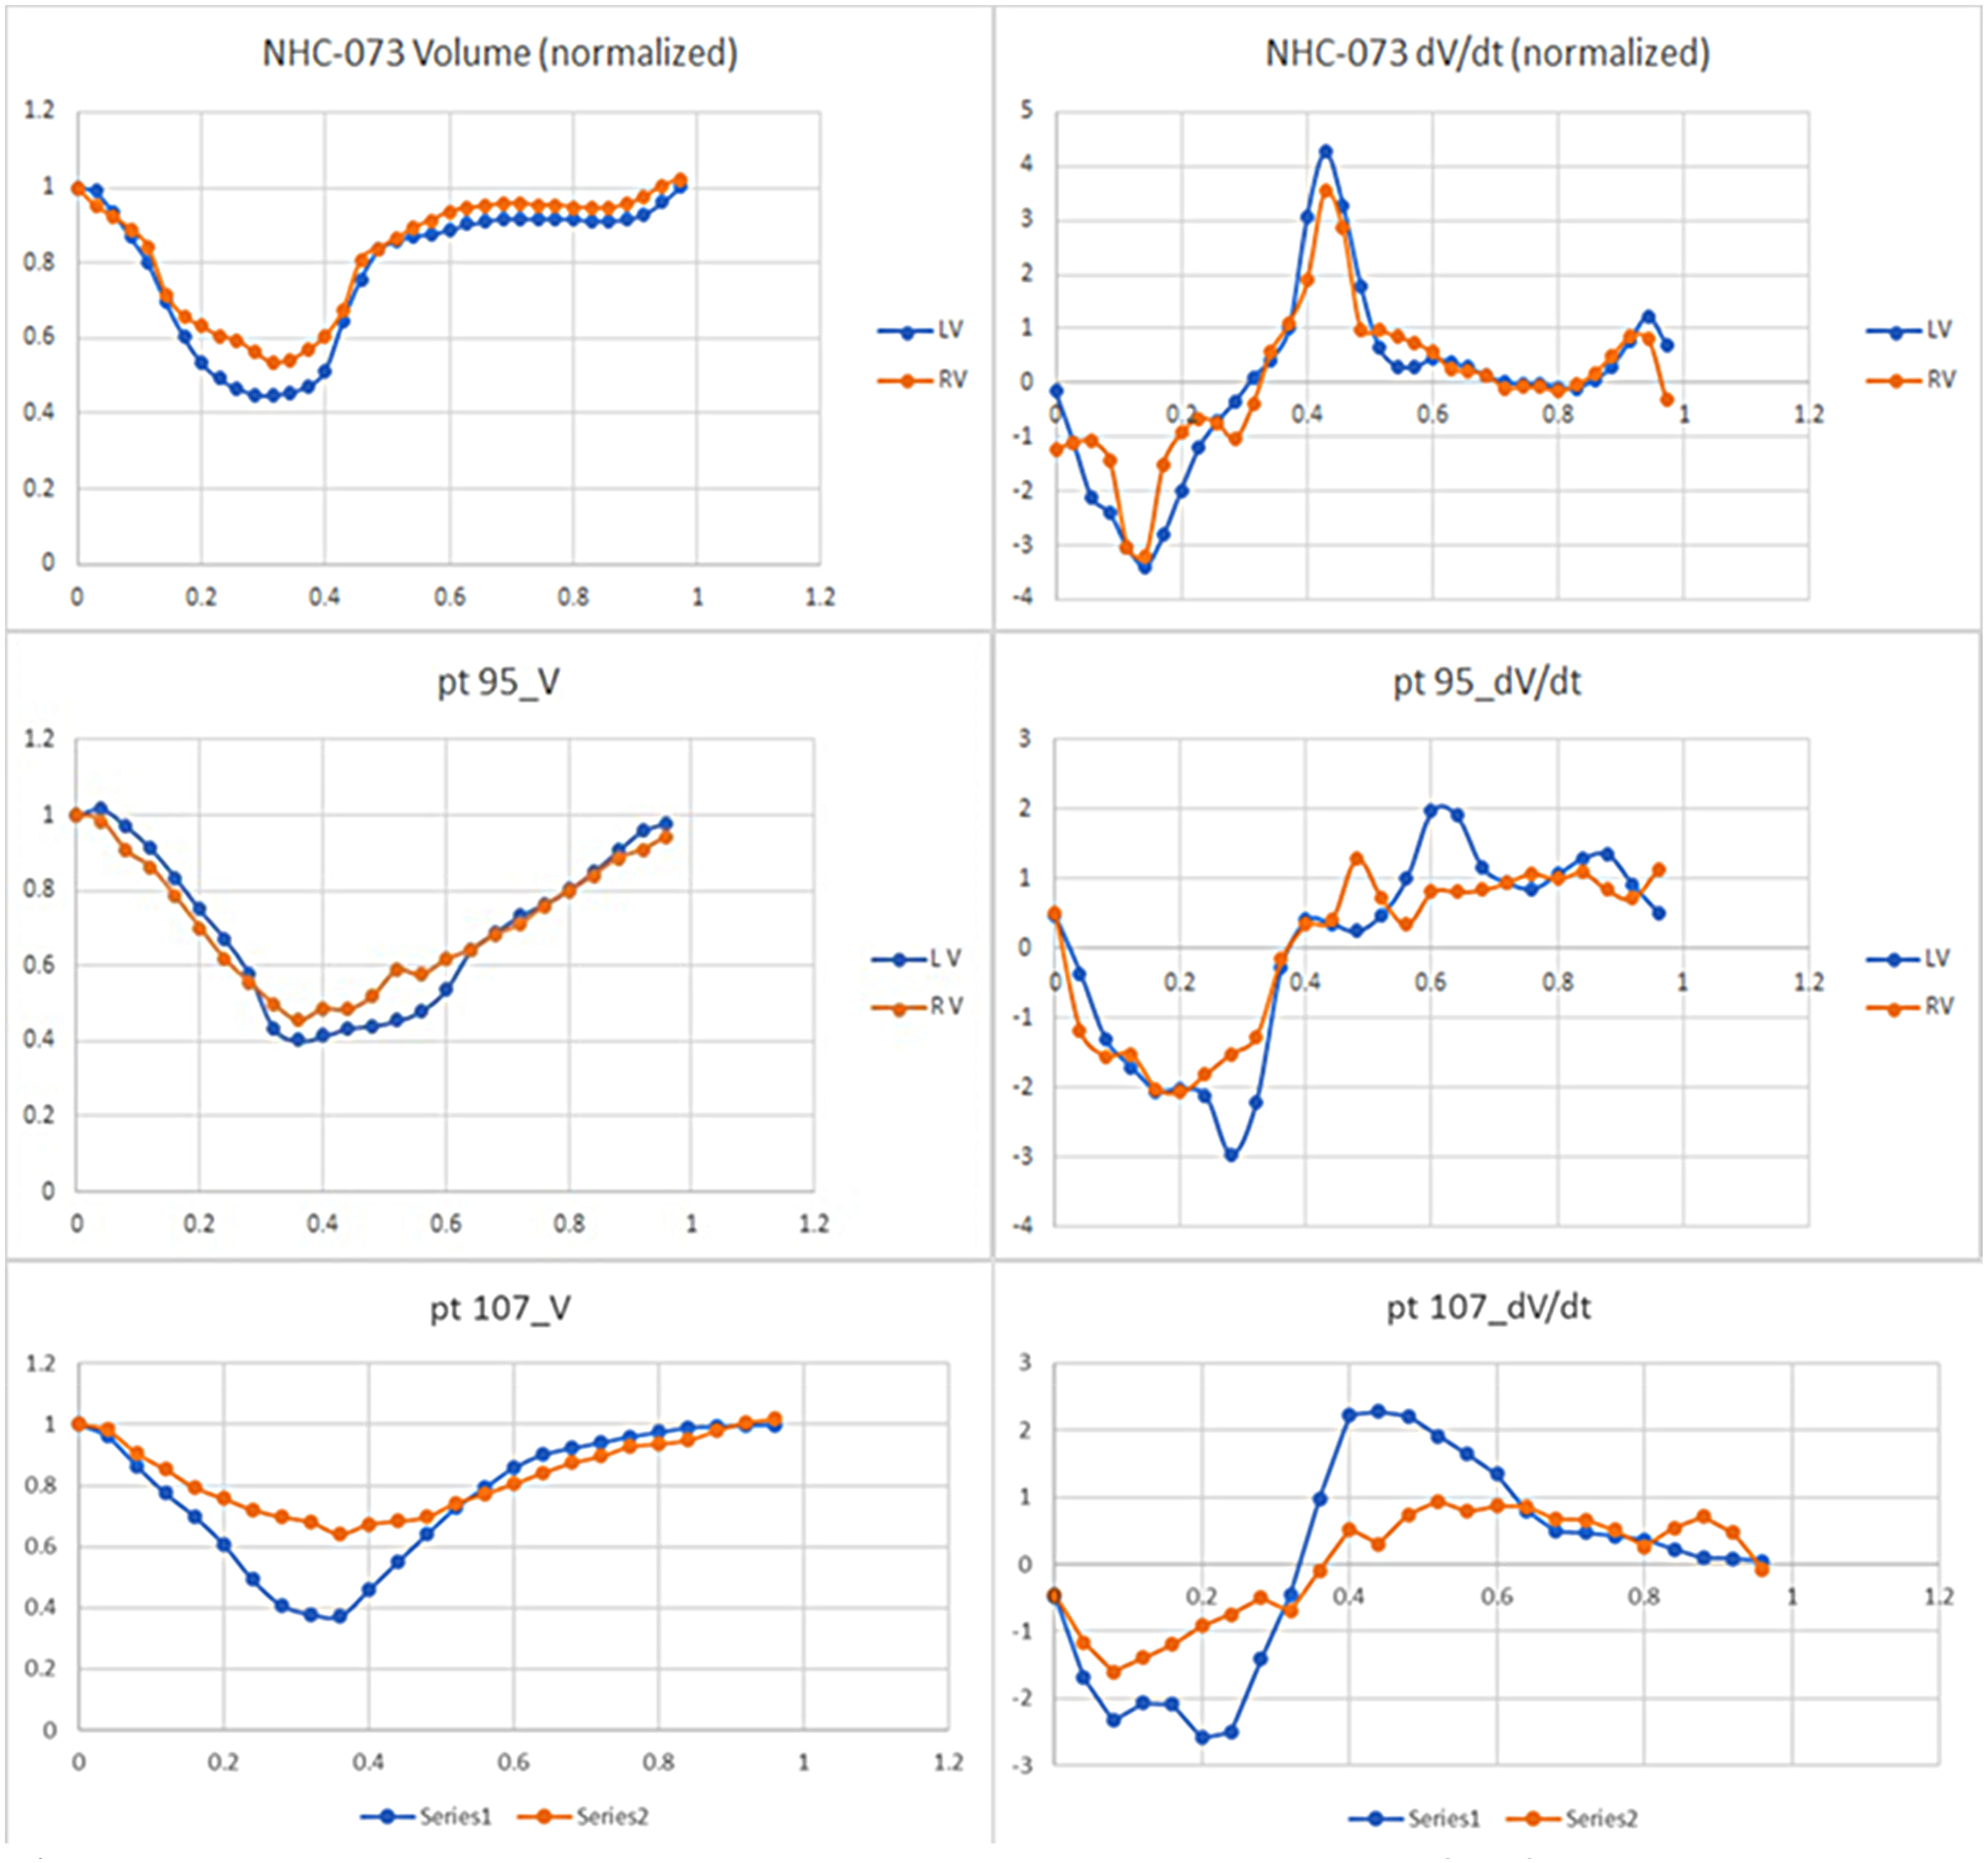
Normalized ventricular volumes over the cardiac cycle (left) and corresponding rates of change (right) for normal subject (top), HFpEF patient with cardiac amyloid (middle), and HCM patient (bottom), showing marked qualitative differences in both systolic and diastolic dynamic function.
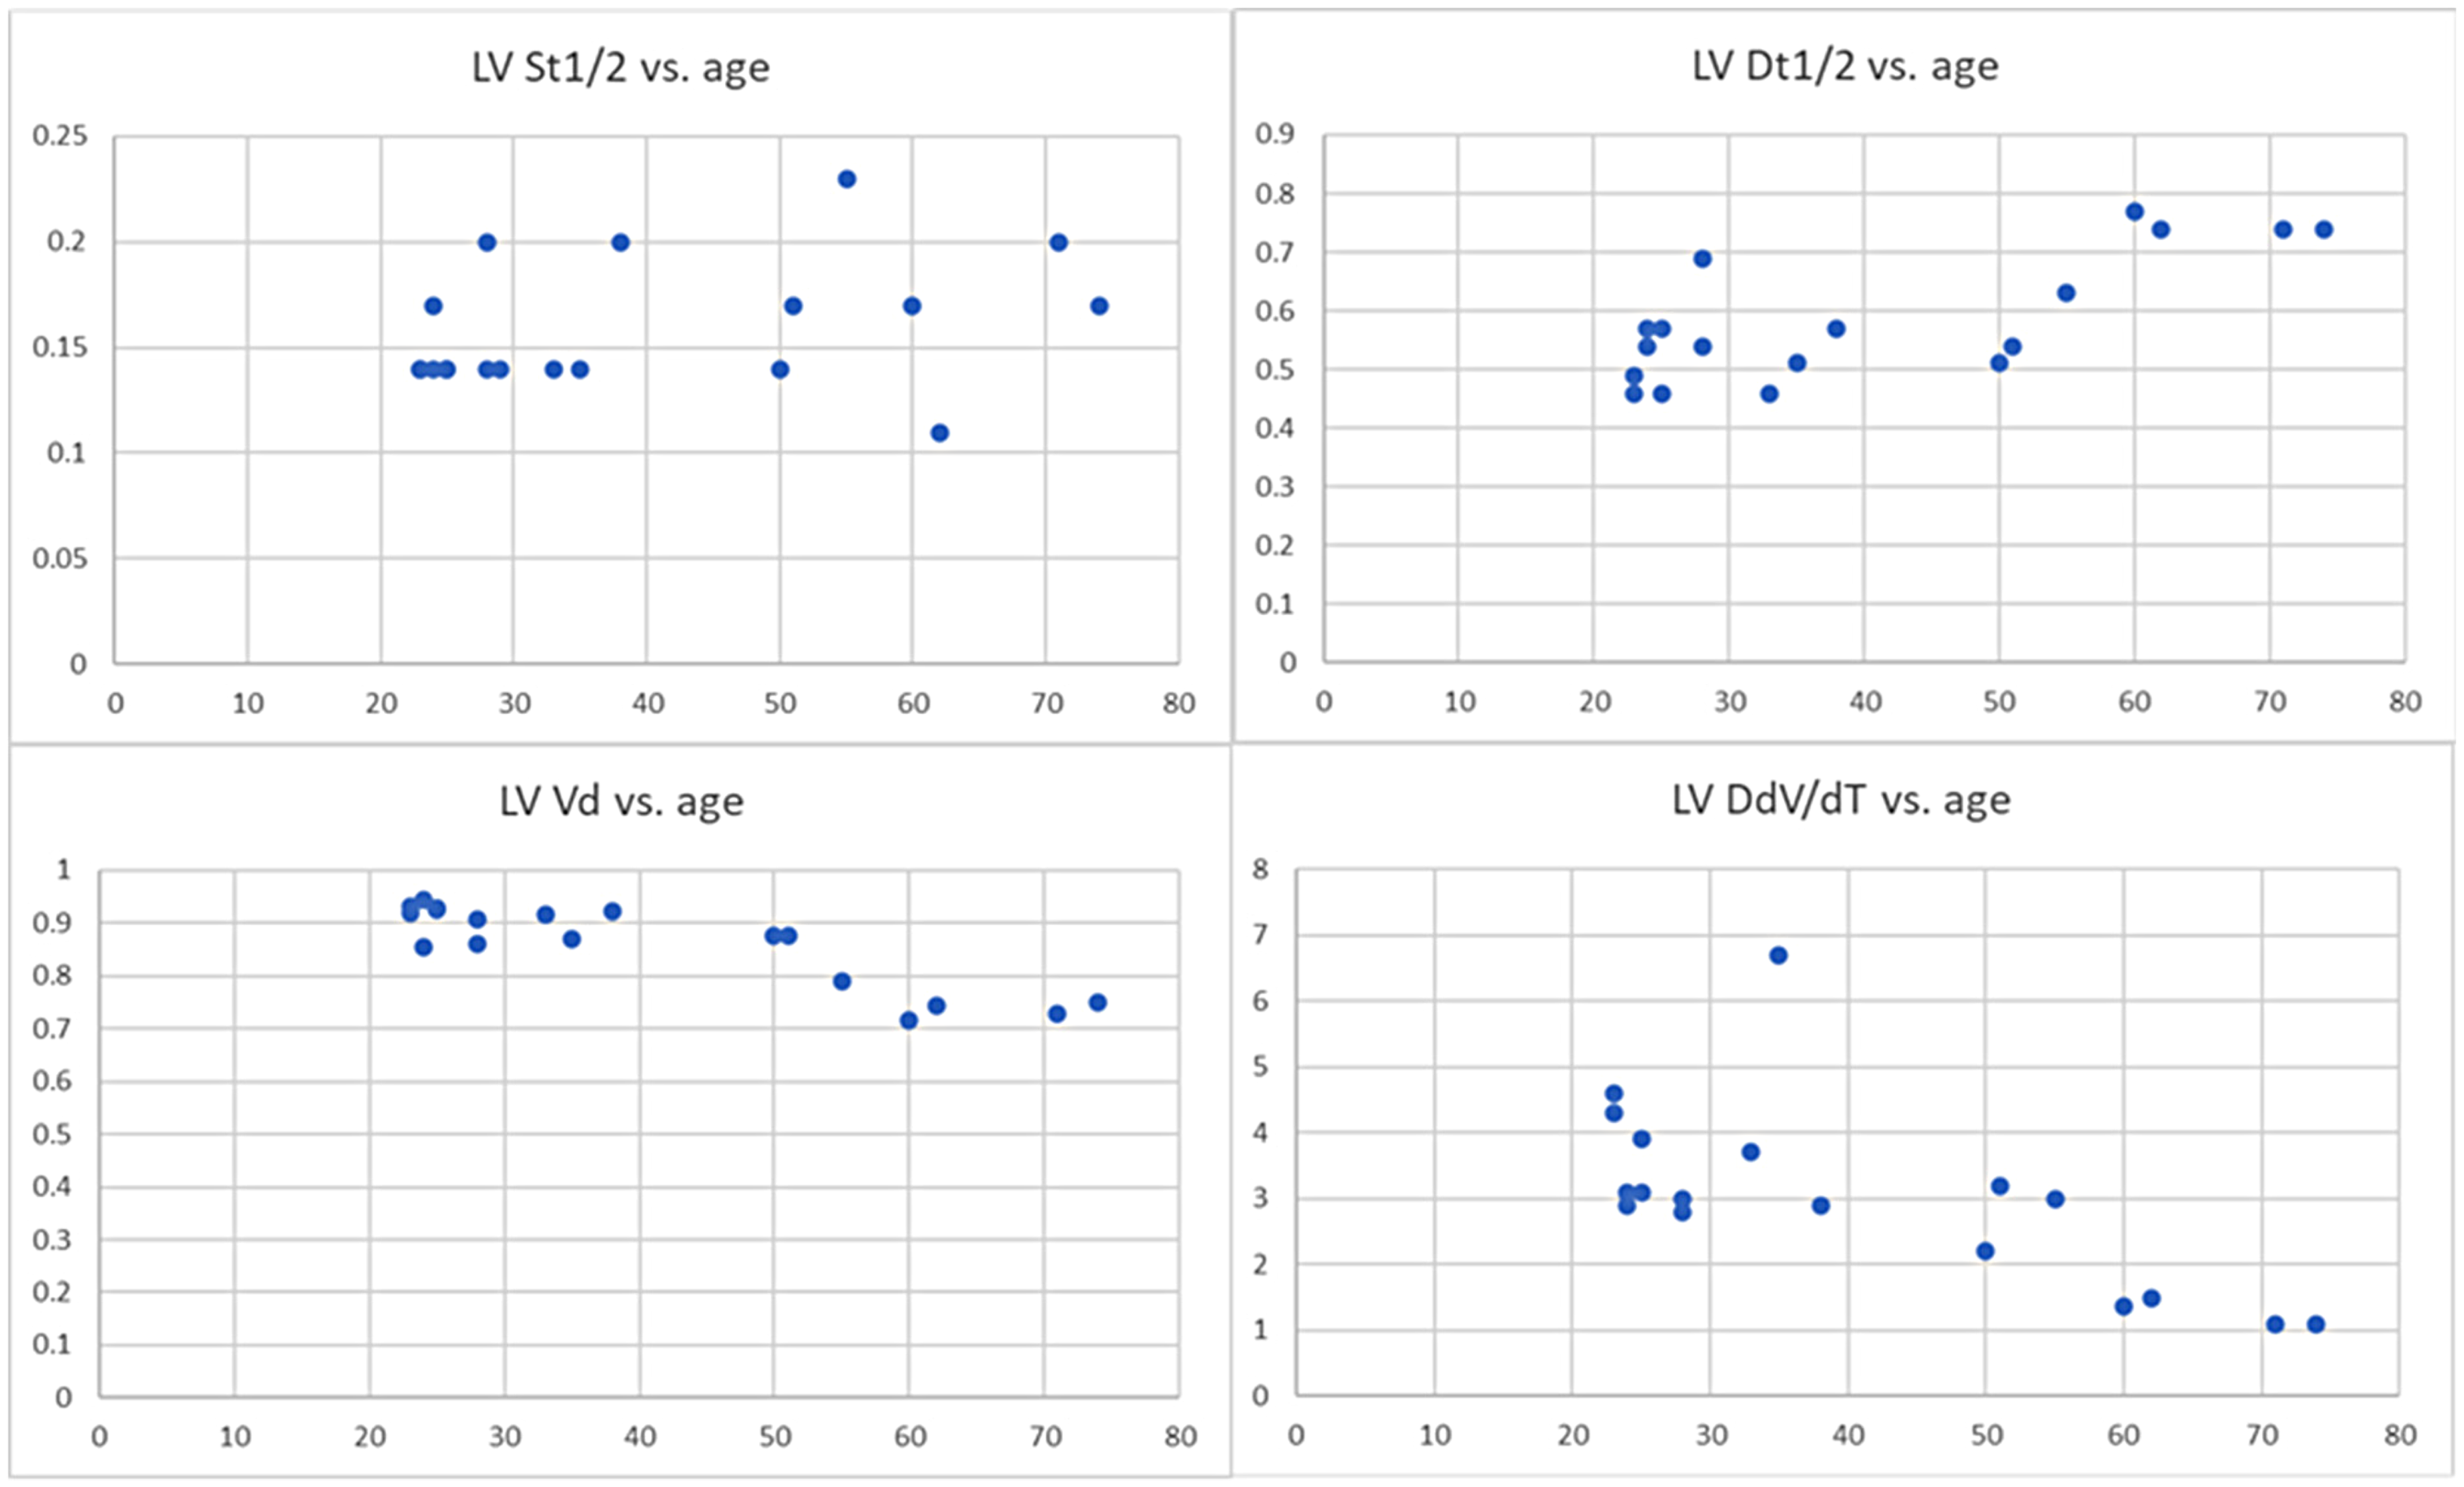
Normalized representative LV dynamic global function variables t1/2S (left top), t1/2D (right top), Vd (left bottom) and dVpe (right bottom) versus age, for 19 normal subjects, showing qualitative slowing of early diastolic filling with aging, particularly after 60.
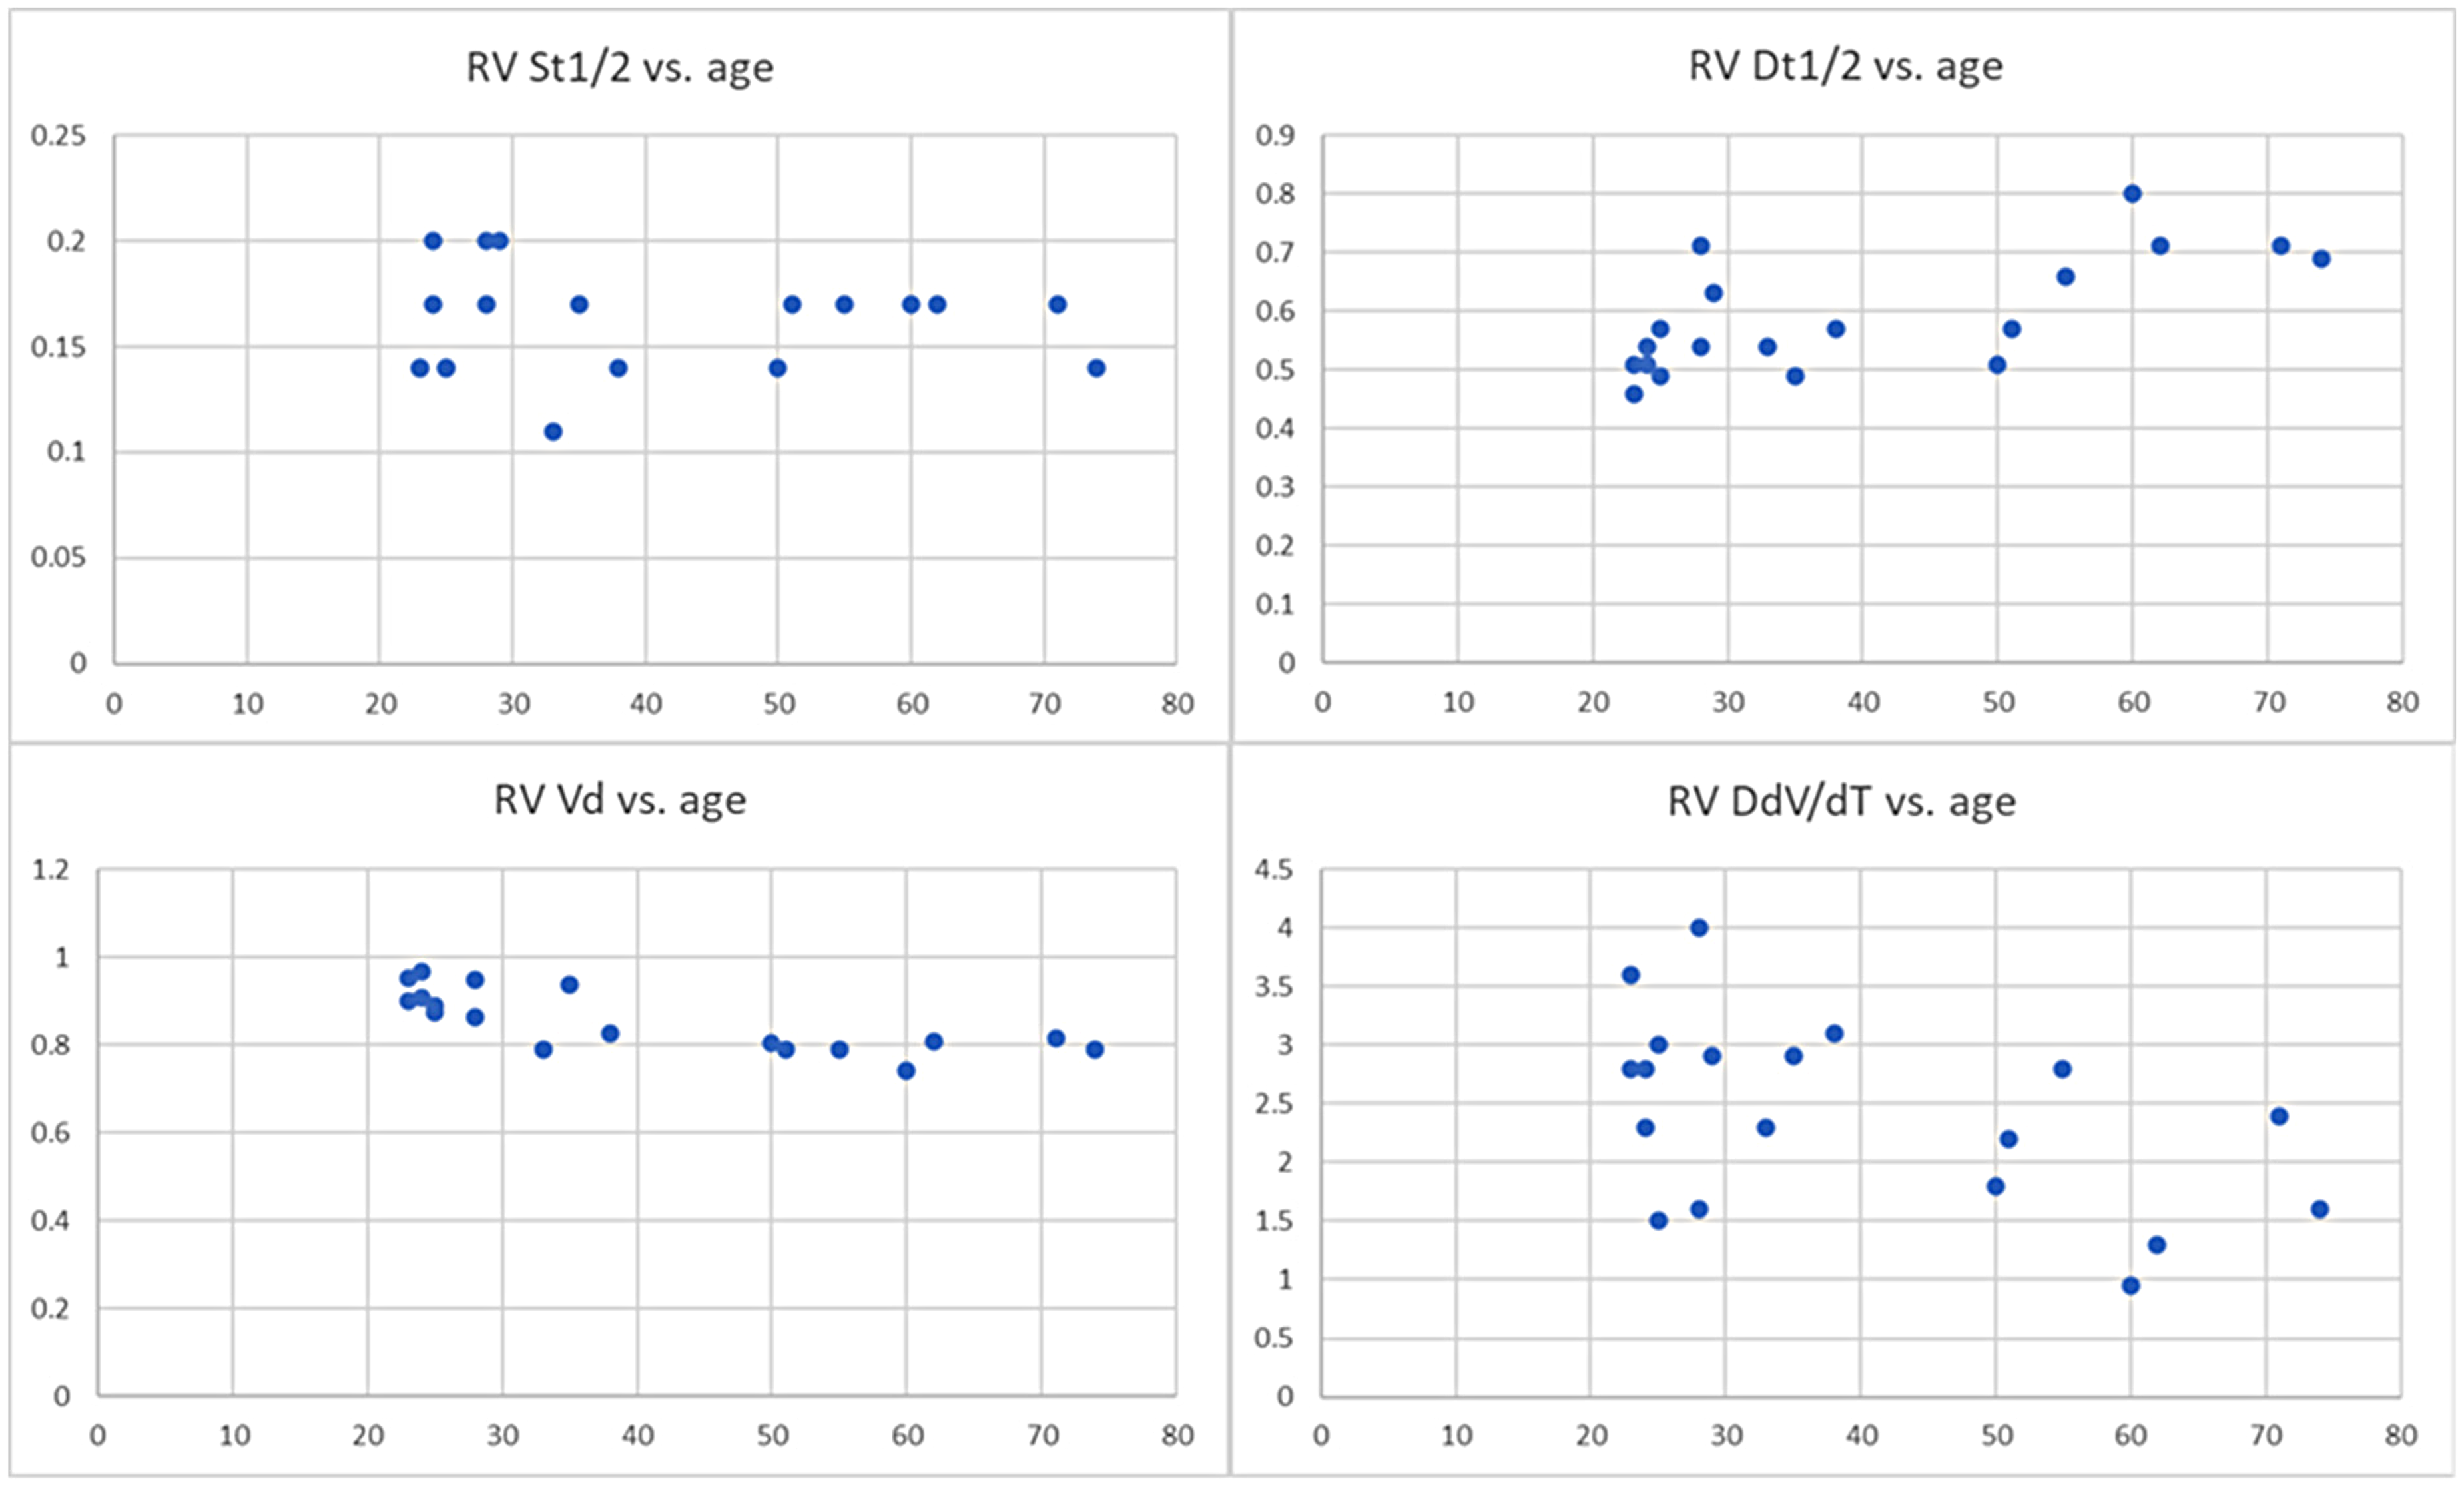
Normalized representative RV dynamic global function variables t1/2S (left top), t1/2D (right top), Vd (left bottom) and dVpe (right bottom) versus age, for 19 normal subjects, showing qualitative slowing of early diastolic filling with aging, particularly after 60.
Discussion
Although they are simple and easily understood, conventional global function measures provide only limited information on systole, and no direct information on diastole. If data on the full evolution of the ventricular volumes over the cardiac cycle are available, they can be used to calculate dynamic global function-related variables that provide additional functional information but are still easily understood. In particular, they can provide more direct characterization of the three phases of diastole than conventional methods.
Systolic function is dependent on the interaction of myocardial contractility and afterload. Even with a preserved EF or EDV, alterations in systolic function may be reflected in the values of systolic DGF variables, such as the ejection half time or ejection rates. Both cardiomyopathy and dyssynchrony can lead to prolonged isovolumic contraction times.20–22 Systolic ejection times may be correlated with outcomes in heart failure. 23
Diastolic function is dependent on the interactions of passive and active stiffness of the myocardium and its recoil, as well as atrial pressure and atrial traction on the base of the ventricle. 24 While diastolic function is not directly related to the EF or EDV, DGF variables can distinguish the different phases of diastole and can provide a quantitative characterization of them. In particular, the peak diastolic volume filling rate directly reflects early diastolic function, while the volume and minimum filling rate in diastasis reflect mid-diastole. DGF analysis can thus provide a more direct characterization of diastolic function than current approaches, which typically monitor only the motion of the base of the ventricles and the flow across the atrioventricular valves. 25
While there have been prior efforts to characterize DGF with various variables, the systolic and diastolic “half times” used here do not seem to have been previously investigated. They are particularly attractive, as they are simple measures of systole and diastole that are intuitively easy to understand and easy to calculate, and are relatively robust to noise in the volume measurements. The peak ejection and filling rates are also attractive ways to characterize DGF, although the calculation of dV/dt is inherently noisier than the associated volumes. An additional simple variable for characterization of diastole is the fractional volume reached in diastasis, Vd; however, this may be somewhat ambiguous to define if there is no clear phase of diastasis. A related measure of diastolic function is the minimum filling rate in mid diastole, dVd, which may provide a complementary assessment of diastasis.
Conventional global function measures are known to vary with sex, age and body size, which is considered when establishing normal value ranges; these will also need to be considered when establishing normal value ranges for these new DGF variables. In particular, we found a slowing of diastolic function in normal older patients; this will need to be further investigated in larger numbers of subjects. As changes in heart rate are mostly due to corresponding changes in the duration of diastasis, 26 heart rate is also likely to be important to consider when establishing normal value ranges for DGF variables; characteristic time variables in diastole may be best referenced to end-systole.
There are many potential factors contributing to HFpEF; DGF may help to separate their roles in individual patients, as well as providing objective measures to confirm the presence of cardiac dysfunction despite the normal value of EF. Conditions such as transplant rejection, cardiomyopathy, and chemotherapy may affect diastolic function before significant EF changes; DGF may provide additional information that can be helpful to guide therapy.
The effects of altered ventricular loading (e.g., due to valve disease or shunts) and dyssynchrony may be better distinguished from intrinsic myocardial disease by DGF analysis, although that will need to be tested with further clinical research.
Current segmentation methods still generally require interactive corrections, especially near the base and apex of the ventricles, which can be time-consuming. In particular, atrioventricular (AV) boundaries can be difficult to delineate in SAX images alone. Motion of the AV structures through the fixed imaging plane can add to the uncertainty of the computed volumes. The thin RV wall may be hard to distinguish, with bright fat or fluid outside and bright blood inside, particularly near the ends of the ventricles. As with conventional global function assessment, the presence of trabeculations and papillary muscles may make it difficult to reliably delineate endocardial boundaries, with associated potential bias or error in the DGF variables. While previous approaches to cardiac segmentation using partial volume calculations have reduced the uncertainties associated with the wall segmentation, 27 they are still subject to uncertainty regarding the location of the moving boundaries at the base of the ventricles.
The “noise” in the volume measurements, due to variability of the segmentation, adds to the associated variability of the calculated dynamic global function measures, particularly related to dV/dt. While such variability can be reduced by adding some temporal smoothing or other regularization, that may tend to bias the results. The use of both SAX and LAX data to reconstruct the 3D ventricular volumes may help to reduce that variability.
As conventional cine CMR is triggered by detection of the QRS complex, the first frame will typically correspond to the onset of systole. In prospectively gated CMR, the last portion of diastole may not be reconstructed. The isovolumic contraction and relaxation phases of the cardiac cycle may be difficult to precisely delineate in the measured V(t) curves alone, due to noise in the measurements; thus, the associated times may be more reliably determined from the valve images in the original CMR data.
Classical invasive work on pressure-volume loops 28 can now be approached with the use of CMR for noninvasive volume measurements that are more reliable than those from conductance catheters, using peripheral blood pressure as a surrogate for systolic ventricular pressures. It will be interesting to correlate this approach with these characteristic volume-related variables.
Limitations
This work is just an initial “proof-of-principle” investigation of the potential of such an approach to characterization of global dynamic function. Greater numbers of normal subjects will need to be evaluated, in order to establish expected normal values of these relatively novel function variables, and their expected variation with factors such as age, sex, size and heart rate, as well as ethnicity and activity level. Greater numbers of patients with different clinical conditions will also need to be evaluated, in order to evaluate the potential clinical value of these novel function variables in different clinical applications.
Conclusion
While still not fully reliable, the development of newer and more efficient image segmentation methods offers the potential for providing more complete data on the dynamic evolution of the ventricular volumes over the cardiac cycle than conventional global function measures. A systematic approach to the analysis of such DGF data, through variables like those presented here, e.g., the peak volume filling rate in early diastole and the minimum filling rate in diastasis, can provide novel function measures that could potentially better characterize cardiac function than current global function methods, particularly for the evaluation of diastolic function. However, DGF variables, while promising as novel ways to characterize heart disease, are neither fully sensitive nor specific; further experience with them will be needed in order to evaluate their potential clinical utility.
Footnotes
Acknowledgments
Dr John Dodson helped to initiate this project.
Ethical considerations
This retrospective study was approved by the NYU Langone Health Institutional Review Board, Study Numbers i17-01798 and S22-01004.
Author contributions
Conceived and designed the experiments: LA, MK, AJ. Analyzed the data: LA, MK. Wrote the first draft of the manuscript: LA. Contributed to the writing of the manuscript: LA, MK, AJ, MY, BG, XH, DM. Agree with manuscript results and conclusions: LA, MK, AJ, MY, BG, XH, DM. Jointly developed the structure and arguments for the paper: LA, MK, MY. Made critical revisions and approved final version: LA, MK, AJ, MY, BG, XH, DM. All authors reviewed and approved of the final manuscript.
Funding
This study was funded by NIH grant number R01HL127661.
Declaration of conflicting interests
The authors declared no potential conflicts of interest with respect to the research, authorship, and/or publication of this article.