
Abstract
Background:
Universal community-based tuberculosis (TB) screening in high-burden settings is resource-intensive and inefficient, frequently missing cases and leading to suboptimal resource allocation. Integrating routine surveillance data with geospatial analytics offers a promising approach to enhance the efficiency and cost-effectiveness of active case finding.
Objective:
To evaluate whether integrating Uganda’s electronic Case-Based Surveillance System (eCBSS) data with geospatial hotspot analytics improves the efficiency, yield and cost-effectiveness of integrated TB case finding (CAST+) in Eastern Uganda
Design:
We conducted a quasi-experimental before-and-after study comparing a universal community screening campaign (September 2022) with a geospatially targeted campaign (March 2024) in Eastern Uganda.
Methods:
We analysed routine eCBSS data from 166 diagnostic and treatment units using a sequential two-stage geospatial approach in Quantum Geographic Information System (QGIS). Statistically significant hotspot parishes were identified using the Getis-Ord Gi* statistic (p < 0.05), followed by the prioritisation of villages reporting > 2 bacteriologically confirmed TB cases (March 2023–February 2024). Comparative effectiveness was assessed with a cluster-adjusted chi-square test (Rao-Scott correction). Cost-effectiveness was evaluated from the provider perspective using inflation-adjusted 2024 USD costs, disability-adjusted life years (DALYs) averted, cost-effectiveness ratios (CERs) and incremental cost-effectiveness ratios (ICERs).
Results:
The targeted strategy screened 49,373 individuals across 313 villages, compared with 627,082 in 3252 villages under the universal campaign, representing a 92.1% reduction in screening volume. Despite this, TB yield increased by 10% (1.68%–1.85%; p < 0.001). Total inflation-adjusted costs declined by 90.9% (from USD 62,804 to USD 5704), unit cost per TB case fell by 55.2% (USD 82.20–USD 36.80), and cost per DALY averted decreased from USD 4.72 to USD 2.11 (ICER: USD 5.39 per DALY averted). All diagnosed TB cases were initiated on treatment.
Conclusion:
eCBSS-guided geospatial targeting improved efficiency, precision and cost-effectiveness of TB screening, supporting a shift from universal to targeted TB case finding, and provides programmatic evidence for high-value public health interventions in resource-limited settings.
Plain language summary
Tuberculosis (TB) remains a major health problem in Uganda. Instead of costly door-to-door screening, this study used routine electronic health data and mapping to identify TB hotspots and target high-risk areas. The approach screened 92% fewer people, reduced costs by 91%, and improved efficiency, lowering cost per case by 55%. All diagnosed patients started treatment promptly, demonstrating a more effective and affordable strategy.
Introduction
Tuberculosis (TB) remains a leading cause of infectious mortality globally. Each year, 10.6 million new cases and 1.3 million deaths are reported. 1 Sub-Saharan Africa bears 24% of this burden. Health systems in the region face many constraints and suffer from persistent diagnostic delays. Uganda ranks 16th among the World Health Organisation’s 30 high TB/HIV burden countries. The country notifies approximately 90,000 cases annually (94,286 in 2022) with a national incidence of 200 per 100,000 population.2 –4 However, these aggregates conceal substantial subnational heterogeneity. Case notification rates differ more than tenfold across districts. 2
An estimated 46% of TB cases in Uganda remain undetected. 5 Several structural barriers drive this ‘missing TB cases’ phenomenon. First, 63% of rural populations live more than 5 km from diagnostic and treatment units (DTUs). 6 Secondly, diagnostic delays average 56 days from symptom onset to confirmation. 7 Comorbid conditions further complicate detection: 33% of TB patients have HIV coinfection, and 41% present with malnutrition.8,9 These intersecting vulnerabilities create geographically concentrated ‘syndemic’ environments that reinforce disease transmission.10,11 In Eastern Uganda, between 2020 and 2023, about 32% of TB cases were missed. Case notification rates stayed below the national average (DHIS2, 2024). 3
In response, Uganda’s Ministry of Health launched the Community Active Screening and Testing, dubbed the CAST strategy, in 2022. The novel, context-specific approach involved biannual door-to-door screening of TB symptoms. Later, expanded to address syndemics (CAST+: TB, HIV, malaria, malnutrition, and leprosy). 12 However, universal implementation proved inefficient both programmatically and economically. Retrospective analyses showed that 78% of screenings occurred in villages with zero or one TB case annually. This diverted resources from true transmission hubs. Screening yield, a key metric, declined from 2.8% in 2019 to 1.9% in 2022, indicating diminishing returns in low-burden areas.11,13 From a cost perspective, each universal campaign costs about $50,678 or $70 per TB case diagnosed. National scale-up would require an estimated $1.2 million annually, 19% of Uganda’s total TB programme budget, raising concerns about the financial sustainability of untargeted approaches. 14
TB transmission exhibits fine-scale spatial heterogeneity driven by socio-economic vulnerabilities. Cases tend to concentrate within small, geographically defined hotspots shaped by transmission dynamics such as social mixing and population mobility.15 –17 Modelling studies show that geographically targeted screening achieves a substantial reduction in incidence compared with universal approaches when only a fraction of the population is screened.11,18 Concentrating interventions within high-burden areas has been associated with >50% reductions in simulated incidence, whereas achieving a comparable impact through universal coverage would require screening more than 80% of the population at substantially higher cost.19,20 Empirical studies from Ethiopia and South Africa report 25% incidence reductions within hotspots, 20 and 30%–40% improvements in cost-effectiveness when screening is concentrated in transmission foci. 21 These findings suggest that spatial targeting could simultaneously improve both yield (cases diagnosed per person screened) and unit costs, the very metrics where universal approaches have underperformed.
Uganda’s electronic Case-Based Surveillance System (eCBSS), introduced in 2020, provided a potential solution. This DHIS2-integrated platform captures village-level notification data, treatment timelines and comorbidity profiles. 22 While eCBSS offers descriptive spatial summaries such as basic case mapping, advanced geospatial techniques, including kernel density estimation, spatial scan statistics and Kulldorff scans, have proven effective in identifying high-transmission foci across diverse settings.15,23 Tools such as QGIS enable statistical validation with Getis-Ord Gi*, adding analytical rigour by quantifying clustering significance and predicting transmission risk beyond simple case-count. 24 These approaches have been successfully applied to identify TB hotspots in Madagascar and India.23,25 Despite this evidence, operational integration of national surveillance with campaign-level spatial optimisation remains limited. In Africa, geospatial analyses often remain retrospective and detached from implementation, missing chances to align screening intensity with transmission risk. This study addresses the gap by assessing whether integrating eCBSS-derived geospatial hotspot analysis can improve the efficiency and cost-effectiveness of CAST+ deployment in Eastern Uganda.
Methods
Study design
We compared two campaigns: a universal screening conducted in September 2022 (CAST) and a geospatially targeted CAST+ campaign implemented in March 2024. We employed a quasi-experimental design guided by Porter’s Value-Based Healthcare framework.26,27 The intervention followed a six-phase geospatial optimisation cycle: (i) electronic surveillance data collection, (ii) hotspot mapping using QGIS, (iii) evidence-based resource allocation, (iv) targeted implementation, (v) cost-effectiveness evaluation and (vi) feedback for system refinement. This study was reported in accordance with the STROBE statement. 28 A completed STROBE checklist is provided as Supplemental File 1.
Study setting and population
The interventions were conducted in Bugisu and Bukedi, 2 of the 15 health regions in Eastern Uganda. Together, these regions serve a population of approximately 4.2 million. The area comprises both urban and rural communities, with population densities ranging from 527 to 741 persons per km2 and average household sizes of 4.0 to 4.8 persons. 29 The study was conducted in 166 of 210 DTUs across 16 districts in the two regions.
Data sources, measurement, geospatial mapping and TB hotspot identification
During routine TB care at facilities, health workers use paper-based HMIS tools to record demographic and clinical data on TB patients. These data are then entered into a DHIS2-based interface, the electronic equivalent of the HMIS tools, called eCBSS. As part of data preparation, eCBSS was scaled to 166 diagnostic units, achieving 93% coverage. Backlog data from 2020 was cleared to 100% completeness, covering 6992 cases. Residences were geocoded using the Uganda Bureau of Statistics (UBOS) administrative boundaries (GIS shapefiles). 30 The eCBSS dataset was linked to the UBOS GIS shapefile using deterministic keys (district, parish, village, facility code, patient ID, test date), facilitating precise geographic analysis.
For this study, the primary dataset was the eCBSS data, which contained patient demographics, diagnostic results, facility identifiers and geolocation data. Secondary sources included DHIS2, CAST+ outcomes data from TB-Info, and UBOS GIS shapefiles with population estimates.
Hotspots were identified through a two-stage sequential process in QGIS. First, a parish-level spatial autocorrelation analysis (Getis-Ord Gi* Hot Spot analysis tool) of TB notification data (March 2023–February 2024) identified statistically significant hotspot parishes (high positive z-scores, p < 0.05, false discovery rate (FDR)- adjusted). 24 Sensitivity analyses tested robustness across alternative bandwidths and thresholds. Second, within these parishes, villages reporting more than two bacteriologically confirmed TB cases during the same period were selected for the targeted CAST+ campaign. This two-stage approach ensured statistical rigour at the parish level while maintaining operational relevance at the village level. Villages with ⩽2 cases within hotspot parishes were excluded, as they represented lower-transmission areas within broader high-burden zones. Geospatial data were validated using GPS field checks (98% accuracy during TB contact tracing). A total of 313 hotspot villages (across 109 parishes) were identified, informing the design of the targeted CAST+ campaign.
Critically, diagnostic methods remained fully comparable across both campaign periods (September 2022 and March 2024): no changes occurred in GeneXpert testing capacity, the number of functional machines, cartridge supply, laboratory staffing, or sample transport systems, thereby eliminating diagnostic capacity as a potential confounder when comparing case detection between campaigns.
The intervention – targeted CAST+ campaign (March 2024)
Health facility staff at facilities near the identified hotspots trained community health workers (CHWs) in CAST+ procedures and provided registers, referral forms, PPE, and communication materials. CHWs conducted door-to-door household visits using standardised screening forms. Sputum was collected from presumptive TB cases and referred via triple packaging for GeneXpert MTB/RIF testing at catchment facilities.
Beyond TB, the CAST+ model integrated screening for multiple additional conditions within identified hotspots including: (1) Malaria rapid diagnostic testing (mRDT) testing for febrile individuals with on-site treatment, (2) HIV Self-test kit distribution with assisted testing; reactive results were referred to facilities for confirmation, (3) Leprosy Skin patch assessment with referral to health facilities for clinical evaluation and diagnosis, (4) Nutrition mid-upper arm circumference (MUAC) screening for children aged 6–59 months and pregnant/lactating women, (5) Maternal and child health on antenatal (ANC) attendance and immunisation status review, and (6) Water, Sanitation and hygiene (WASH) Household assessment, latrine availability and sanitation practices. All screening followed Ugandan national guidelines. Data were captured using HMIS tools and reported through DHIS2 and TB-Info systems. Implementation fidelity was monitored through supervisor checklists and digital dashboards tracking CHW performance, data completeness, and daily campaign coverage progress.
Study variables and cost components
The primary study variable was unit cost (USD) per TB case diagnosed, calculated as the number of bacteriologically confirmed TB patients identified divided by the total provider costs. Secondary variables included TB detection rate (TB yield), population-level screening yield and treatment initiation. We defined provider-incurred costs as an aggregate of costs incurred at community and facility levels during the campaigns (Table 1).
Provider costs definition.
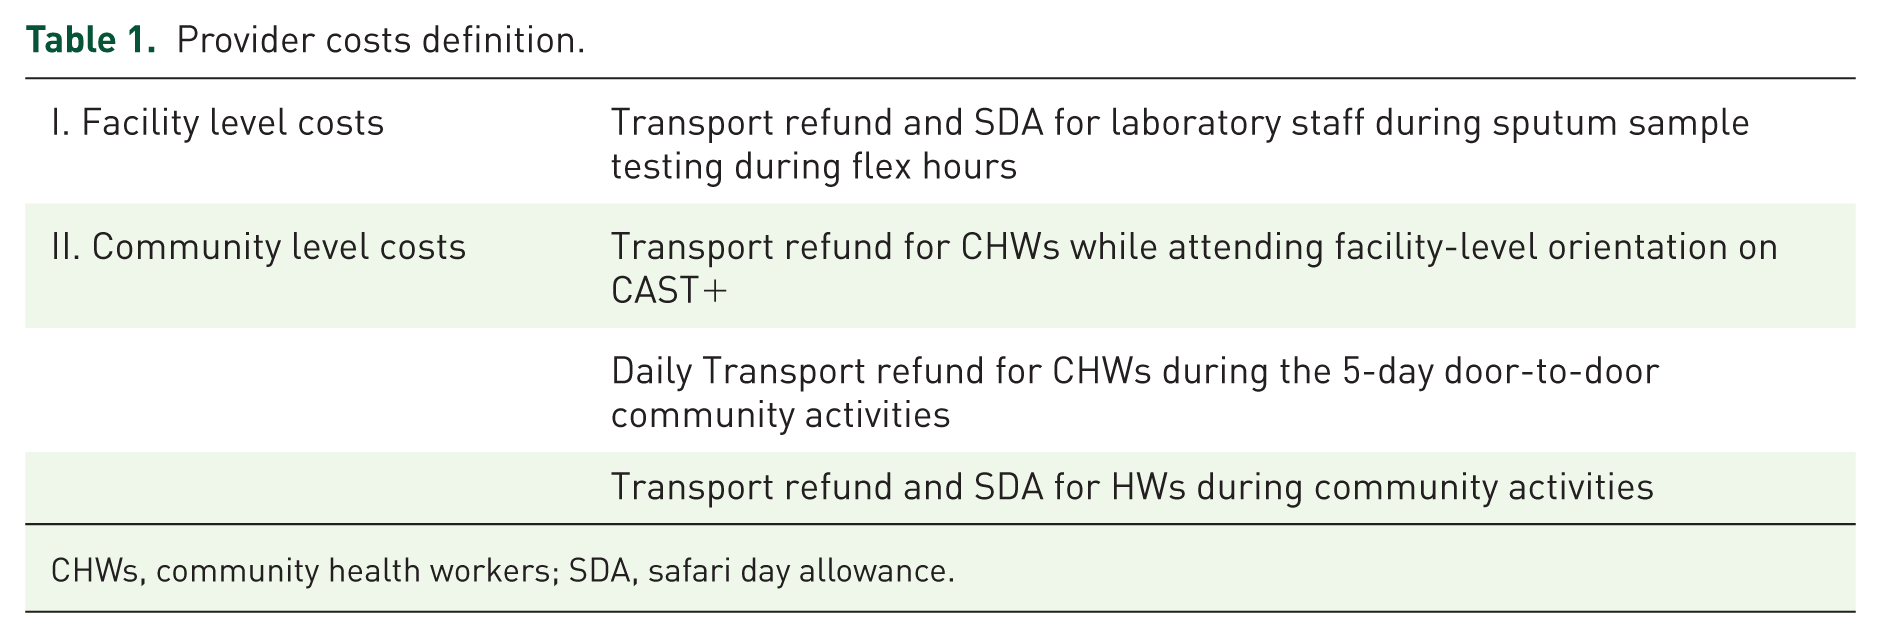
CHWs, community health workers; SDA, safari day allowance.
Cost-effectiveness analysis
A provider-perspective cost-effectiveness analysis was conducted in accordance with WHO guidelines, with effectiveness measured in disability-adjusted life years (DALYs) averted. Key outcomes included the cost-effectiveness ratio (CER: total cost per DALY averted) and incremental cost-effectiveness ratio (ICER). Years of Life Lost (YLL) were estimated as: YLL =N × L × (1 − Treatment Success Rate) × Untreated TB Mortality, where N is the number of TB cases diagnosed; L is remaining life expectancy calculated as the difference between national life expectancy and assumed mean age at diagnosis (63–35 years = 28 years); treatment success rate was 88%; and untreated TB mortality was 70%. 31 Years Lived with Disability (YLD) were calculated as: YLD = N × disability weight × treatment duration, using a disability weight of 0.333 and a treatment duration of 0.5 years. DALYs averted were calculated as the sum of YLL and YLD, where DALYs = YLL + YLD.32,33
Future life years were discounted at 3% annually. One-way sensitivity analyses varied untreated mortality (50%–70%), treatment success (85%–92%), disability weight (±10%) and discount rate (0%–5%). All 2022 costs were adjusted to 2024 USD using a compound inflation rate of 16.8% (annual rates: 7.2% in 2022, 5.3% in 2023, and 3,5% in 2024). 34 The incremental cost-effectiveness ratio was calculated as: (Cost_Targeted − Cost_Universal) / (DALYs_Targeted − DALYs_Universal). Results were interpreted using WHO cost-effectiveness thresholds (⩽1 ×GDP per capita = very cost-effective; ⩽3 × GDP per capita = cost-effective; Uganda’s 2024 GDP per capita was $964). 35
Data quality and missingness
Data completeness, timeliness and internal consistency of eCBSS data were assessed. Records with implausible dates were corrected or excluded. Missing coordinates were imputed to parish centroids as a conservative approximation.
Data analysis
Descriptive statistics were used to summarise TB case detection, population-level screening yield, and treatment outcomes across the universal CAST (2022) and targeted CAST + (2024) campaigns. Given the pragmatic nature of the study, all 313 hotspots were purposively targeted, precluding a priori sample size calculation. Post-hoc power was assessed to detect the observed 10% relative improvement in TB yield (from 1.68% to 1.85%; α = 0.05). However, because individuals were nested within villages, we accounted for clustering by calculating the design effect (DE) using an intraclass correlation coefficient (ICC) of 0.001 from Cochrane TB reviews in Africa. 36 With an average cluster size of 158 individuals per village in the targeted campaign (49,373 individuals/313 villages), DE = 1 + (158 − 1) × 0.001 = 1.157. The effective sample size was n/DE = 49,373/1.157 = 42,668, yielding 75% power to detect the observed TB yield improvement, which is slightly below the conventional 80% threshold. This is acceptable in a real-world programmatic setting with near-census coverage of hotspots, particularly given the highly significant difference (p < 0.001). All statistical analyses were performed using Stata version 14.2 (StataCorp, College Station, TX, USA). For all comparative analyses, we used cluster-adjusted chi-square tests with the Rao-Scott second-order correction to account for village-level clustering. All statistical tests were two-sided, with significance set at p < 0.05. Programmatic cost analysis compared operational efficiency between campaigns. All provider-incurred costs were extracted from project expenditure records and converted from Uganda shillings (UGX) to US dollars (USD). The exchange rate was 1 USD = 3750 UGX. Unit cost per TB case diagnosed was calculated by dividing total expenditure by the number of confirmed cases, with percentage reductions between the universal and targeted campaigns quantified to assess efficiency gains. To ensure data validity, all diagnosed TB cases were verified by cross-referencing patient identifiers with data from GeneXpert laboratory records system (Lab-Xpert), paper-based HMIS TB registers and eCBSS. Verified data were routinely entered into the national DHIS2 and TB-Info system.
Results
Spatial distribution of TB hotspots
The analysis identified 313 statistically significant TB hotspots, concentrated in peri-urban zones and border communities, with 33% clustered within 5 km of urban centres, including Mbale and Tororo. The 2022 universal CAST campaign targeted all 3252 villages in 533 parishes across 16 districts (Figure 1). In contrast, the 2024 targeted CAST+ campaign reached 313 villages across 106 high-transmission hotspot parishes, representing a 90.2% reduction in operational scope (Figure 2).

Showing TB screening villages across 16 districts during the blanket CAST in September 2022. TB screening in 3252 villages across 16 districts during the blanket CAST in September 2022.

Showing the spatial distribution of TB hotspots and TB yield in Eastern Uganda during the CAST+ Campaign in March 2024.
Intervention outcomes and efficiency metrics
The universal campaign screened 627,082 individuals and diagnosed 764 TB cases (TB yield: 1.68%), while the targeted campaign screened 49,373 individuals and identified 155 TB cases (TB yield: 1.85%). All diagnosed TB patients were initiated on TB treatment. This represents a 92.1% reduction in the number of individuals screened and a relative 10% improvement in TB yield. Additionally, the presumptive TB rate increased from 7.2% in the universal campaign (45,341/627,082) to 17.0% in the targeted campaign (8386/49,373), indicating improved screening specificity (Table 2).
Comparative results of universal CAST (2022) versus targeted CAST+ (2024).

Screening yield (population-level): Number of bacteriologically confirmed TB cases divided by total number of individuals screened, expressed as a percentage, reflecting the efficiency of community-wide screening efforts.
TB yield: Number of bacteriologically confirmed TB cases divided by the number of presumptive TB cases identified (individuals with symptoms suggestive of TB).
ART, antiretroviral therapy; CHWs, community health workers; MCH, maternal & child health; mRDT, malaria rapid diagnostic testing; SDA, safari day allowance; UGX, Uganda shillings; USD, US dollars.
In nominal terms, total campaign costs declined from $53,771 in 2022 to $5704 in 2024. After inflation adjustment to 2024 USD, costs fell from $62,804 compared to $5704 for the 2024 targeted campaign, representing a 90.9% reduction in expenditure. The unit cost per TB case decreased from $66.80 to $36.80 (44.9% reduction) in nominal terms. After inflation adjustment, the unit cost per TB case declined from $82.20 to $36.80 (55.2% reduction). Correspondingly, the CER fell from $4.72 to $2.11 per DALY averted, representing a 55.3% improvement in economic efficiency. Although the universal campaign averted more total DALYs (13,301 versus 2699) due to its broader population coverage, incremental analysis favoured the targeted strategy (ICER = $5.39 per DALY averted), indicating substantially lower cost per health gain (Table 3).
Comparative efficiency, cost-effectiveness and health economic value of universal versus targeted CAST+ campaign.
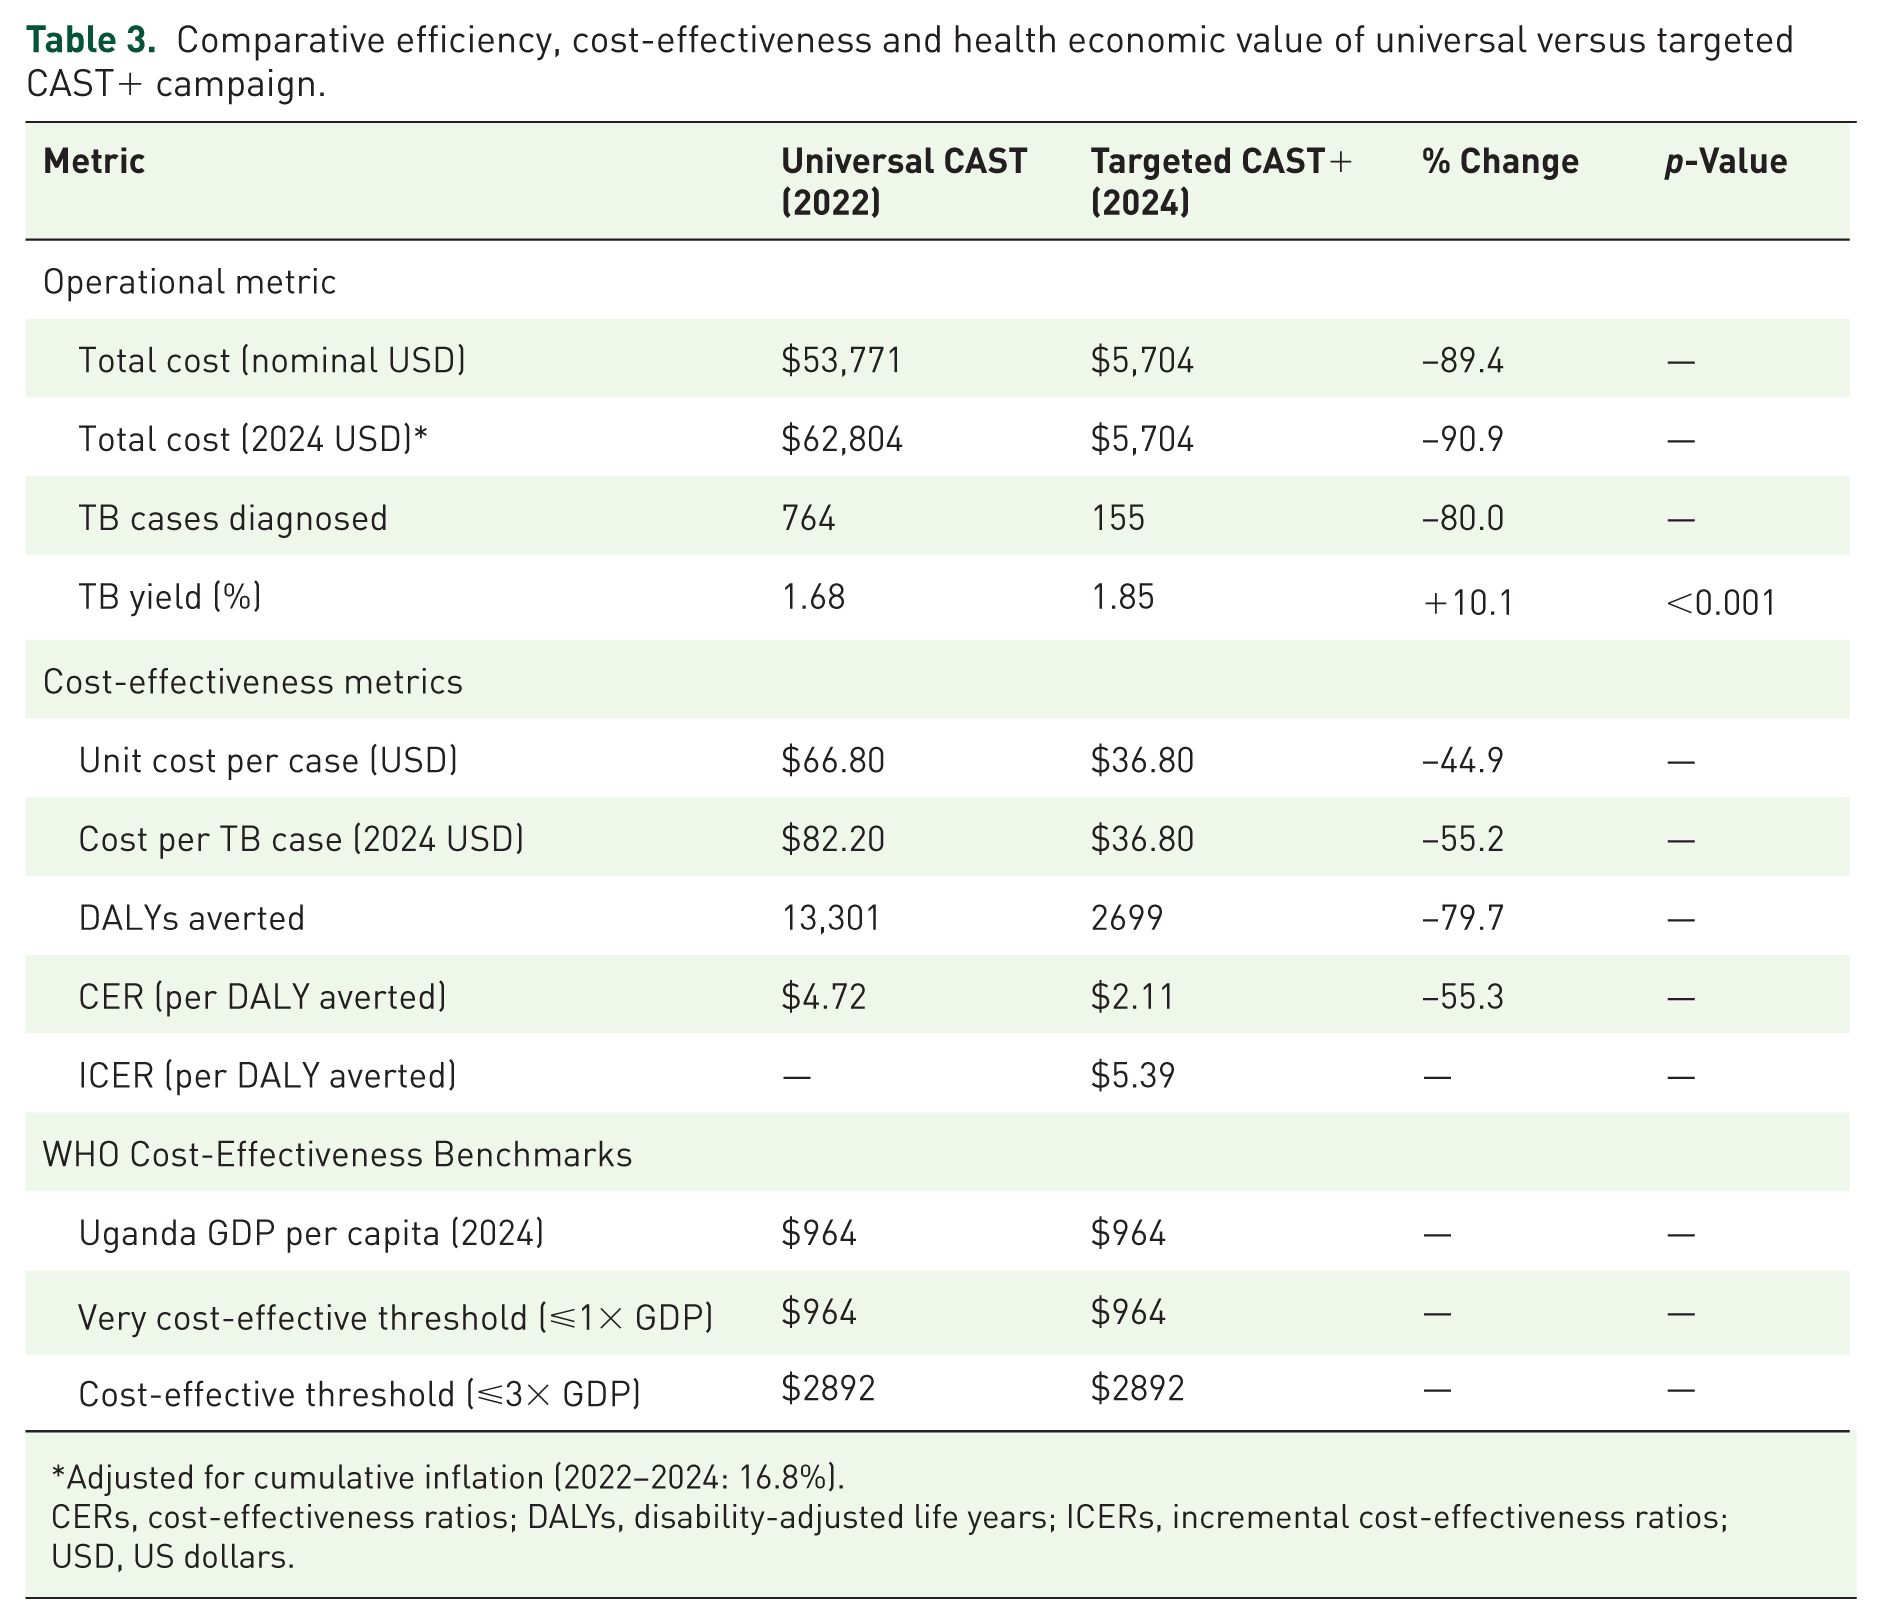
Adjusted for cumulative inflation (2022–2024: 16.8%).
CERs, cost-effectiveness ratios; DALYs, disability-adjusted life years; ICERs, incremental cost-effectiveness ratios; USD, US dollars.
Integrated health outcomes
Beyond TB, the integrated CAST+ campaign generated broader health benefits across multiple disease areas. These included: identification of two new leprosy cases from nine presumptive cases with skin patches referred for clinical evaluation; diagnosis of 1040 malaria cases from 2290 mRDTs; screening 1765 pregnant women, of whom 92.9% already receiving antenatal care; distribution of 6553 HIV self-test kits, leading to confirmation and ART initiation for 27 HIV positive individuals; and detection of 210 malnourished children aged 6–59 months from 6106 screened, all who were linked to nutritional care.
Discussion
This quasi-experimental study shows that integrating Uganda’s electronic Case-Based Surveillance System with QGIS geospatial hotspot analysis substantially improved the efficiency and cost-effectiveness of TB active case finding (ACF) in Eastern Uganda. These findings provide operational evidence that spatially targeted ACF using routine surveillance data can optimise TB control efforts in resource-constrained settings.
The 2024 targeted CAST+ campaign screened 92.1% fewer individuals (49,373 versus 627,082) than the universal campaign, yet achieved a 10% relative improvement in TB yield (from 1.68% to 1.85%). This finding reinforces evidence that TB transmission is spatially heterogeneous and that spatially targeted screening in high-risk areas can improve efficiency and achieve greater epidemiological impact than untargeted approaches, particularly where transmission is strongly clustered.16,17,19,23,37 Our observed improvement in yield supports the spatial targeting hypothesis and is consistent with findings from studies in India reporting 15%–20% greater impact under conditions of high spatial heterogeneity. 25 Additionally, the magnitude of the reduction in the number of individuals screened in this study was larger than that reported in comparable studies from Ethiopia and Zambia.20,37 These differences likely reflect the granularity and recency of the data used for hotspot identification. The universal CAST campaign (2022) functioned as a de facto high-resolution burden assessment, revealing that substantial screening occurred in villages reporting zero or one TB case. By contrast, the CAST+ intervention relied on a statistically validated Getis-Ord Gi* hotspot analysis of near-real-time eCBSS data, enabling more precise identification of high-transmission areas and minimising screening in low-yield locations.2,33
Beyond yield improvements, spatial analysis revealed important patterns in disease distribution. Our study demonstrated a classic Pareto distribution of TB cases, in which a small number of geographic hotspots accounted for a disproportionate share of cases. Notably, all 155 TB cases detected during the targeted CAST+ campaign originated from mapped hotspot villages, providing strong empirical support for focal transmission dynamics. Similar spatial concentration has been reported in Malawi, Zambia and South Africa, where a small number of geographic hotspots accounted for the majority of ongoing transmission.21,37,38 Urban informal settlements yielded substantially more TB cases than rural villages, consistent with prevalence estimates of four times the national rate in these areas. 39 This affirms the critical need for finer sub-level targeting. Rather than applying a uniform ‘hotspot’ definition, our findings highlight the importance of tailoring TB active case-finding strategies to local epidemiological context and allocating resources to areas with the highest documented burden. 5
The targeted CAST+ campaign generated substantial efficiency gains, with total inflation-adjusted costs declining by 90.9% (from $62,804 to $5704) and the unit cost per TB case falling by 55.2% (from $82.20 to $36.80). These cost reductions exceed the 20%–30% savings reported in similar hotspot-based interventions from Madagascar. 23 and Zambia, 40 likely reflecting our integration of near-real-time eCBSS data with statistically validated Getis-Ord Gi* analysis. This approach enabled more precise targeting than the descriptive hotspot mapping used elsewhere, reducing resource expenditure on personnel, transport, and consumables. Additional efficiencies stemmed from shorter campaign duration and greater contact time per screened individual within hotspots, consistent with evidence from targeted TB investigations in comparable settings.41 –43
The 90.9% cost reduction may reflect two distinct drivers: scale effects from screening 92.1% fewer individuals and genuine efficiency gains within hotspots. To quantify the efficiency component, we calculated a counterfactual: applying universal campaign costs ($0.086 per person) to the 49,373 individuals screened would have cost $4,246, which is 25.6% less than the actual $5704. The additional $1458 reflects the incremental cost of intensified activities (enhanced contact time, integrated services) that contributed to the 10% improvement in TB yield. This aligns with economic theory on diminishing marginal returns: the policy implication is not simply to screen fewer people, but to screen the right people with appropriate intensity. 13
Compared to other geospatial strategies, our QGIS-based approach offers greater feasibility in low-resource settings than AI-assisted targeting in Nigeria, which required advanced infrastructure yet achieved similar yield improvements (1.75-3-fold). 44 While Ethiopian modelling studies demonstrated a 52% reduction in incidence, they required longer implementation periods and higher per-case costs ($582). 20 Targeted screening strategies in South Africa improved yields but lacked syndemic integration and were largely urban-focused, unlike Uganda’s mixed rural-urban transmission context. 17 Within Uganda, our community-scale strategy achieved superior efficiency by minimising screening in low-burden areas.45,46 These empirical findings align with Bayesian meta-analyses predicting pronounced subnational heterogeneity in TB burden, though such analyses remain primarily predictive rather than implementation-oriented. 47 Collectively, the observed cost savings reflect the synergistic effect of (1) precise targeting through statistically validated hotspot analysis, (2) operational efficiencies from shorter, intensified campaigns and (3) integration with syndemic screening that leveraged shared platforms and logistics.
The economic evaluation further strengthens this case. At $2.11 per DALY averted, the targeted strategy was substantially more cost-effective than the universal approach ($4.72 per DALY averted), with both falling well below the WHO threshold of three times Uganda’s GDP per capita ($2892). Incremental analysis demonstrated the targeted model’s clear economic dominance, achieving comparable health gains at markedly lower cost. While this evaluation was tailored to the Ugandan programmatic context, the favourable ICER and efficiency gains suggest value for replication in other sub-Saharan African settings with comparable surveillance infrastructure, pending local adaptation and validation. These figures lie at the lower end of published estimates for sub-Saharan Africa ($8 to $500 per DALY averted) for various TB ACF and diagnostic interventions.33,48,49
Contextual and operational factors may have amplified the observed effects. Eastern Uganda’s pronounced spatial clustering of TB, driven by peri-urban growth and mobility, likely amplified the returns on geographic targeting. 3 Furthermore, the strategic integration of HIV, malaria and nutrition screening within these TB hotspots created a synergistic syndemic response. While the detection of co-morbidities (1040 malaria cases, 27 individuals confirmed with HIV infection, and 210 malnourished children) reflected the expanded scope of the 2024 campaign to include integrated screening, geospatial targeting determined its efficiency, channelling these integrated services into high-burden TB zones, generating a higher co-morbidity detection rate per unit of effort and enabling shared use of platforms and logistics to dilute costs. This level of syndemic integration was less emphasised in earlier studies that evaluated TB-focused interventions in isolation and may partly explain the larger efficiency gains observed.24,33,47 This analysis, grounded in actual programmatic expenditure, demonstrates that leveraging routine surveillance and open-source tools can deliver substantial benefits without major new investments. The delivery of 49,373 integrated screenings by CHWs underscores the operational capacity and sustainability of this model within national programmes and similar resource-limited settings.
This study demonstrates several notable strengths. First, it showcases methodological innovation by integrating routine eCBSS surveillance data with QGIS-based geospatial analysis. This approach achieved a 10% relative improvement in TB yield (from 1.68% to 1.85%), a 90.9% reduction in total cost, and a 55.3% improvement in cost-effectiveness (from $4.72 to $2.11 per DALY averted), with findings supported by rigorous sensitivity analyses. Second, the study adopted a syndemic approach through integrated screening, enabling the simultaneous detection of comorbid conditions (malaria, HIV, and malnutrition) and enhancing efficiency in multidisease management. Third, its pragmatic quasi-experimental design closely reflects real-world implementation conditions. Finally, to our knowledge, this is the first study in Uganda to leverage routine surveillance data for geospatially targeted TB and syndemic hotspot interventions, providing novel evidence for precision public health in Africa.
Despite the observed successes, several limitations should be acknowledged. First, the quasi-experimental design does not fully control for temporal confounding, including potential changes in health worker performance or diagnostic practices (e.g., seasonal variations, programme maturation, or post-COVID improvements in the health system) between September 2022 and March 2024. Second, our cost analysis included only provider-incurred costs and did not account for patient-incurred costs (e.g. transport, lost wages and opportunity costs), potentially underestimating the true economic burden. Third, spatial analyses relied on existing administrative boundaries (2019 UBOS shapefiles), which may not fully capture rapidly changing settlement patterns, potentially leading to misclassification of some hotspot areas. Fourth, DALY calculations relied on standard assumptions (70% untreated mortality, 0.333 disability weight) from the global literature rather than Uganda-specific data, potentially affecting the precision of cost-effectiveness estimates. Fifth, although we used cluster-adjusted statistical methods, residual spatial autocorrelation and unmeasured village-level factors (health-seeking behaviour) may persist. However, sensitivity analyses using varying intraclass correlation coefficients confirmed minimal impact on statistical significance. Finally, no a priori sample size calculation was performed because of the exhaustive targeting of all hotspots. This pragmatic approach prioritised implementation feasibility, with post hoc analysis showing 75% power to detect the observed yield improvement. Though significant, the slightly sub-optimal power warrants cautious interpretation of the findings.
The findings from this Eastern Ugandan study, characterised by high HIV prevalence, population mobility and rural–urban interfaces, may generalise to similar high-burden sub-Saharan African settings with comparable surveillance infrastructure. The geospatial targeting model’s efficiency gains (a 10% increase in TB yield and a 90.9% reduction in costs) could be applied to national TB programmes in low-resource settings, particularly where hotspots drive transmission. 47 However, caution is warranted: the quasi-experimental design and purposive sampling limit generalizability to settings with comparable characteristics (e.g. Kenya border dynamics), which may not generalise to non-border or urban-only areas. Generalizability to lower-prevalence regions or to regions without eCBSS equivalents is limited, as data quality and access barriers (3% unreached hotspots) could bias outcomes. 50 Future multi-site trials could strengthen the evidence base and support broader applicability.
Conclusion
This study demonstrates that leveraging eCBSS data for geospatial targeting constitutes a highly cost-effective strategy ($2.11 per DALY averted; ICER $5.39 per DALY), supporting Uganda’s transition to precision TB case-finding and delivering strong value for money in resource-constrained environments, as evidenced by costs well below Uganda’s GDP per capita of $964. This targeted approach replaces a broad, resource-intensive universal campaign with a focused, high-yield intervention, improving cost-effectiveness by 55% and meeting WHO criteria for very high cost-effectiveness. Future priorities should include strengthening the quality, timeliness, and completeness of routine surveillance data; developing real-time hotspot-mapping capabilities; and establishing flexible implementation frameworks to overcome access barriers in marginalised communities. Integrating geospatial intelligence into national TB programmes is a critical step toward achieving End TB targets.
Supplemental Material
sj-docx-1-tai-10.1177_20499361261456596 – Supplemental material for Precision geospatial targeting for cost-effective tuberculosis case finding in Eastern Uganda: a quasi-experimental study
Supplemental material, sj-docx-1-tai-10.1177_20499361261456596 for Precision geospatial targeting for cost-effective tuberculosis case finding in Eastern Uganda: a quasi-experimental study by Clark Joshua Brianwong, Diana Cherotin, Lwanga Sssekiswa Zimwanguyiza, Richard Kyakuwa Jjuuko, Patricia Ntege Nahirya, Alexander Mugume and Dithan Kiragga in Therapeutic Advances in Infectious Disease
Footnotes
Acknowledgements
This work was made possible through the support of the President’s Emergency Plan for AIDS Relief (PEPFAR) under the Local Partner Health Services for Eastern Region (LPHSE) project, Cooperative Agreement Number 72061722CA00002, implemented by Baylor Foundation Uganda in 15 districts and one city of the Eastern Region. The content and findings presented here are the sole responsibility of the authors and do not necessarily represent the official views of PEPFAR or the United States Government. Freepik (flaticon) made the icons used.
Declarations
Supplemental material
Supplemental material for this article is available online.
References
Supplementary Material
Please find the following supplemental material available below.
For Open Access articles published under a Creative Commons License, all supplemental material carries the same license as the article it is associated with.
For non-Open Access articles published, all supplemental material carries a non-exclusive license, and permission requests for re-use of supplemental material or any part of supplemental material shall be sent directly to the copyright owner as specified in the copyright notice associated with the article.