




Abstract
As mobile media have grown more advanced, and mobile Internet access has increased to a near-ubiquitous state, media use is often described as occurring “anytime, anywhere.” Consequently, measuring media use and understanding competition and coexistence within such an environment is a constant challenge for researchers. To help address this issue the present study explicates a method for measuring media use and competition, the time–space diary, and reports a methodological study testing the robustness of this method across 3 diary instruments. Following a summary of concepts central to mobile media use and measurement, this study reports findings from data collected using 3 types of time–space diaries. Results indicate no significant difference between diary methods (paper and pencil, audio recorder, mobile device) on the likelihood of reported media use, and minimal differences in patterns of competitive superiority, supporting the reliability of the method. Paper-and-pencil diaries are argued to offer the greatest use flexibility relative to audio recorders and mobile devices, and received higher ease of use scores relative to mobile devices. The article concludes with a discussion of the utility of the time–space diary method for emerging mobile media research which must account for media use in novel times and places, as well as multichannel media consumption.
Introduction
Competition between newer and older media is not unique to the 21st century. As Innis (1951) notes, the first mobile medium was the papyrus scroll, which eventually came into competition with the parchment codex which, in turn, was replaced by the new medium of paper from China. While competition in the classical world was largely serial and older forms such as papyrus did not coexist with later forms such as paper, DeFleur and Ball-Rokeach (1989) observe that media are now cumulative. Older forms such as broadcast TV and radio are present alongside newer forms such as desktop computers and mobile devices. In short, competition between the media in the contemporary world is not simply one-at-a-time competition but, rather, is simultaneous (Gaskins & Jerit, 2012; Okazaki, Li, & Hirose, 2012; Westlund & Färdigh, 2011).
Media-use patterns have been changing quickly (Westlund, 2013; Westlund & Färdigh, 2015), as the inception of the cell phone and other mobile technologies have opened up new vistas of time and space to the media consumer (Dimmick, Feaster, & Hoplamazian, 2011). Moreover, content providers and advertisers are increasingly using mobile media to reach consumers (see Grewal, Bart, Spann, & Zubcsek, 2016; Okazaki & Barwise, 2011), with marketing strategies that emphasize place and proximity such as location-based advertising (Banerjee & Dholakia, 2008) and social-local-mobile (or SoLoMo) strategies (see Ankeny, 2013; Lee, 2016). Individuals can now reach each other via interpersonal media as well as access entertainment or news and information “anytime, anywhere,” making it imperative to explicitly incorporate time and space into the theory and measurement of media use.
The myriad methods and places where individuals can access media content presents challenges to researchers looking to accurately record media use and identify emerging trends in use patterns for both specific media platforms (e.g., mobile apps) or for a population’s media use more generally (e.g., competition between emerging and traditional media). To aid scholars looking to capture media use occurring in novel times and places, this paper explicates an important method of capturing mobility in order to support quality assessment of future mobile communication research. First, concepts central to the use of mobile media today are described, followed by a review of niche theory and the use of mobile media in time–space interstices. Next, a brief explication of the time–space diary as a method for measuring and identifying niches of media use is presented. Finally, we describe a methodological study comparing three diary methods aimed at determining whether the reported patterns of media use differ between diary conditions. The paper concludes with a discussion of practical considerations for diary selection, as well as new research opportunities for capturing the use patterns of mobile (and nonmobile) media utilizing the time–space diary.
Literature review
Mobile media and ubiquitous networks
The need for flexible and customizable methods for measuring media use, such as the time–space diary, is highlighted by the growth in penetration and capabilities of mobile communication technologies. Presently, Internet-enabled mobile phones are approaching a state of ubiquity, or being available in all places, at all times. While certainly not available in all locations (ask any serious hiker or hunter), the ubiquity of mobile phones may be more appropriately defined as usage flexibility in time and space (Okazaki, 2012), which scholars have argued is the most important and distinctive feature of mobile devices such as smartphones (Barnes, 2002; Okazaki & Mendez, 2013). However, the ability to reach others or be reached anywhere individuals carry their mobile phones is dependent on the existence of a ubiquitous network, a term first coined by Weiser (1991). Here a ubiquitous network refers not to a single network which allows access to the Internet, but rather a combination of different networks where user devices “switch” from one network to another in a seamless, automated, invisible manner (Kaplan, 2012). For example, consumers may listen to Internet radio on their phones at home via a wireless LAN, then switch to a 4G mobile phone network in the car, then switch to Wi-Fi when arriving at work. The existence of a ubiquitous network allows users to continue receiving content while their mobile devices seamlessly switch between networks.
Research methods which are flexible enough to account for the impact of location, time, or device on media consumption are vital to assessing media use today. Physical or geographic location is a major component of the gratification opportunities afforded to users (see Dimmick & Albarran, 1994). In other words, rather than render unimportant the location of users, mobile technologies have led to a greater emphasis on the affordances of one’s location (Banerjee & Dholakia., 2013), or the type of content available (Heine, 2016; Schultz, 2015). Consequently, assessing media use patterns in an ever-changing mobile media environment requires consideration of where and when media use occurs.
The theory of the niche, and time–space interstices
Given the rapidly evolving mobile media landscape, it is becoming essential to place explicit attention on the role of time and space on media use. The theory of the niche and its accompanying concept of time–space interstices offer helpful lenses toward understanding these roles and how to approach them methodologically. One of the basic questions addressed by the theory of the niche is how several media channels, platforms, or technologies which seem to be used for the same purpose manage to survive and coexist in a competitive environment. With its roots in bio-ecology, the theory posits that in order to survive, a media channel, device, or platform must occupy a unique niche in the environment that enables it to consume enough resources to sustain itself (see Dimmick, 2003, for review). A niche refers to the resource utilization patterns of a given population, or in the case of media research, a media channel, technology, or platform.
As concisely summarized by Gaskins and Jerit (2012), niche theory predictions center on two related concepts—overlap and superiority. When there is little overlap between media technologies regarding the resources they need to survive (advertising dollars, subscribers, time spent viewing), many populations (technologies) can peacefully coexist. However, when media have heavy overlap because they serve similar user needs or target similar advertising revenue, niche theory predicts they will compete until one is driven to extinction (Dimmick, 2003). “Thus, the key to the coexistence of different populations is the presence of some ecological difference between them” (Gaskins & Jerit, 2012, p. 193). In niche theory terms, survival of a population depends on being “competitively superior” along at least one niche dimension. This means that a given technology must be perceived by users to be superior to alternatives based on a certain criterion, otherwise it will be replaced by another technology. An organism, population, or media platform’s “niche” is thus defined by its dimensions of superiority to competitors, as well as the range of resources it consumes (niche breadth; Dimmick, Feaster, & Ramirez, 2011).
Considerations of time and space in niche theory research began with the introduction of the gratification opportunities concept in analyses of home video use (Albarran & Dimmick, 1993; Dimmick & Albarran, 1994). Building on that concept and the time geography writings of Carlstein (1982), Dimmick (2003) formally explicated the importance of time and space in his summative text on niche theory. Measures of time and space have been used to study competition among the interpersonal media (cell phone, landline telephone, instant messaging, email, and text messaging; Dimmick, Feaster, & Ramirez, 2011), as well as media competition for access to news content (Dimmick, Feaster, & Hoplamazian, 2011). In a similar vein, the concept of spatial journalism (see Schmitz Weiss, 2015) has been offered to highlight the emerging importance of space, place, or location—including augmented or virtual locations—in journalism practice and mobile media use. The freedom afforded by mobile media allows for both the creation and consumption of media content in the interstices of people’s schedules—those odd crevices of time/space that routinely occur in daily life (Lee, 2016).
In the absence of research on the times and places where interstices occur, we may classify interstices as: (a) scheduled by organizations or family norms, or (b) individual, idiosyncratic, and unscheduled. In the case of the first sort of interstices, many may be in a very real sense “objective” and predictable. For example, the office worker’s lunch period and the factory worker’s “breaks” are part of the employer’s policies and procedures and call for apologies (“Sorry to disturb your lunch hour”) or provoke justifications (“I’m on break now”) when “violations” occur. Family norms may dictate the time of dinner or “family time,” while scheduled daily commutes may become interstices for phone calls or texts. While the scheduled interstices are predictable, the unscheduled form is usually unpredictable. For example, a person may use a mobile device to check the day’s stock market performance during the commercial break in an evening TV program. Similarly, an individual might take a break while painting the living room and use a mobile phone to invite a son or daughter to Sunday dinner.
Understanding coexistence: Competitive superiority
In the theory of the niche, strong competition usually results in either the displacement of the inferior competitor which reduces niche breadth, or exclusion which results in extinction. Displacement of the older medium is the most often occurring outcome (Dimmick, 2003). For example, TV displaced radio from the national advertising portion of its niche in the 1950s and 1960s (Dimmick & Rothenbuhler, 1984). Exclusion is rather rare but it did occur in the case of the household telegraph which was excluded and driven into extinction by the telephone.
Prior research offers mixed results in terms of the impact of mobile media on existing channels. In a study of interpersonal media (Dimmick, Feaster, & Ramirez, 2011), including the mobile phone, the niche overlaps indicated strong competition. The superiority measures, however, indicated that each medium had a distinct niche where it was superior. Other recent research also suggests that emerging media do not necessarily displace the use of existing media. The potential for strong competition between news platforms, including mobile devices, is suggested by a recent Reuters Institute study which concluded that “Overall, we find that more people are accessing news through a greater number of devices than ever before” (Newman & Levy, 2013, p. 47). Indeed, Pew Research Center data (2017) highlight the evolving nature of media consumption, as mobile devices lead to shifting use trends as well as newer habits such as the “second-screen phenomenon” (Saseen, Olmstead, & Mitchell, 2013). For example, scholars have found that teens’ mobile Internet use primarily served as an extension of PC Internet use, rather than a replacement (Lin, Zhang, Jung, & Kim, 2013).
Research by Westlund and colleagues further reveals the mixed impact of mobile media on traditional news channels. While mobile devices offer increased affordances for journalists to tailor news to individuals “on the go” (Westlund, 2013), other research highlights how age plays a role in media use (Westlund, 2015; Westlund & Färdigh, 2011, 2015). For example, while most individuals engage in single-medium news consumption, the medium of choice has been found to differ by age cohort (Westlund & Färdigh, 2015), with younger consumers most likely to engage in cross-media news access (Westlund & Färdigh, 2012). Furthermore, prior evidence highlights that media displacement does not happen uniformly but rather is more pronounced for men and more highly educated consumers, but is less pronounced for 50- to 85-year-olds (Westlund & Färdigh, 2011).
Findings from time–space diary research and niche theory offer a rationale for why full displacement and exclusion have not occurred as a result of the diffusion of mobile media. The concept of competitive superiority places emphasis on the unique value that each medium holds for its consumers. The differentiation of the uses of media in time and space insulates and cushions the effects of competition. By utilizing methods such as the time–space diary, scholars can better capture and explain the unique media use trends or niches of emerging technologies and platforms.
Measuring emerging media habits
In order to make decisions concerning media use in the mobile age, people must consider, first of all, the gratification utilities or satisfaction they are seeking (Dimmick & Albarran, 1994), the media available in their time–space location (including availability of Wi-Fi access, or perhaps the cost of cellular Internet data), and the gratification opportunities associated with the available media. As the mobile device has evolved from a voice-only device to a multimedia form (see Westlund, 2013, for review), the gratification opportunities associated with the medium have grown enormously. Recent research suggests that mobile devices are being used more often in the home to consume news content despite other media options being available (van Damme, Courtois, Verbrugge, & De Marez, 2015), representing a shift from primarily interstitial use throughout the day (Dimmick, Feaster, & Hoplamazian, 2011). As the gratification opportunities provided by mobile devices have grown, this necessitates data collection procedures sensitive to changes in media use habits. Perhaps more importantly, methods that are flexible to the specific research questions being examined, or to specific device uses such as the “second screen” phenomenon (see Choi & Jung, 2016) are essential for collecting data which allow researchers to accurately describe the complex relationship between competing media technologies and platforms today.
The time–space diary method
As highlighted before, the inception of the cell phone and other mobile technologies has opened up new vistas of time and space to the media consumer. The ease with which individuals can access media and be reached by marketers makes it imperative to explicitly incorporate time and space into the theory and measurement of media use. In the following sections, a specific tool for measuring media consumption in time and space, the time–space diary, is explicated, followed by findings from a methodological study which demonstrates the reliability and flexibility of this tool across instrument types.
Capturing mobility: The time–space diary
The time–space diary method is a useful method for tracking behaviors (media consumption) across time and space (through one’s daily activities), and has been used successfully in studies of human spatial behavior (see Isaacson & Shoval, 2006) and transportation engineering (Muralidhar, Mathew, & Dhingra, 2006). Diaries have been shown to be appropriate to capture this type of data because they allow participants to report details about their behavior without being too obtrusive (Cheng, Olsen, Southerton, & Warde, 2007; Gershuny & Sullivan, 1998). The time–space diary has been utilized successfully in previous research of media use niches (Dimmick, Feaster, & Hoplamazian, 2011; Dimmick, Feaster, & Ramirez, 2011; Hoplamazian & Feaster, 2009), where diarists kept an account of their media use by recording for a 24-hour period each use of a medium in interpersonal or news content domains. Specifically, diarists recorded the time at which each instance of media use occurred as well as their location for each instance. In addition, in one of the interpersonal media studies and in one of the news studies diarists also recorded their goals for each instance of media use. This information—time, place, and goals for each instance—was recorded in a printed form by the diarist and, after the 24-hour period had expired, the information associated with each instance was keyed into an online entry form. See the Appendix for examples of paper diary instruments, which reflect a set of items constituting one media use “session.” These items can be completed multiple times within an assigned time period to allow participants to record all media use sessions that occur during this time period.
The questions that researchers choose to include for each media use session can be tailored to the needs of the individual study. Closed-ended questions are generally preferable, and allow for easier conversion to numerical data for statistical analysis. However, some lines of inquiry may lead to one or more open-ended questions which allow participants to write in their own response. These types of questions can then be content analyzed and coded by researchers to quantify the responses and identify distinct patterns of media use.
Instructions for the time–space diary should consider the particular norms of the media use being studied. For example, if studying media use in general, participants may need to be instructed how to record multidevice use (watching TV while surfing the Web on a tablet). Researchers can choose to have an option for checking multiple media that are being used during a time period, or may require participants to record separate use sessions for each medium (watching entertainment television for 30 minutes as one session, checking Twitter on a tablet for 5 minutes as a separate session).
The goal of the time–space diary method of measuring media use is to make visible the niches of media in a particular domain such as interpersonal media, news, or entertainment. One way of defining a medium’s niche is to assess its competitive superiority, or whether there are sectors of the environment where the medium in question outcompetes other media, or is more likely to be chosen. In the studies conducted to date, competitive superiority was operationalized as likelihood of use: a medium which was most likely to be used at a particular time, at a particular place, or for a particular goal was viewed as competitively superior on that niche dimension. In other words, if a reported location or goal within a use session produced an increase in the likelihood that a medium would be reported for that session relative to other options, this was interpreted as evidence of competitive superiority.
These changes in likelihood of use were assessed in the three studies using hierarchical multilevel modeling. Such procedures were required, as opposed to more typical regression models, as the assumption of independence of observations is violated when allowing participants to record media use sessions as they naturally occur throughout the day. The result is that individual differences must be considered and controlled for, as one participant might happen to favor mobile media for accessing news content, and report 20 instances of news access in a given day, while another participant may prefer television news, and report one or two news sessions in a day. If assessing the niches of news media, each individual news access “session” is not created equal, as the session type, frequency, and duration will be influenced by the participant.
New methodological opportunities
Media diary studies involving use of mobile and digital communication technologies often involved participants recording their behaviors in a paper-and-pencil diary (e.g., Baym, Zhang, & Lin, 2004; Gross, 2004). Further, all diary studies focusing on the theory of the niche to date have likewise used paper-and-pencil instruments (Dimmick, Feaster, & Hoplamazian, 2011; Dimmick, Feaster, & Ramirez, 2011; Hoplamazian & Feaster, 2009). Diary studies, however, have become far more varied with respect to instrumentation including continued use of paper-and-pencil diaries (e.g., Kenyon, 2010), use of online questionnaires available via PC or mobile devices (e.g., Derks & Bakker, 2014; Walters & Horton, 2015), and use of smartphone apps (Oulasvirta, Rattenbury, Ma, & Raita, 2012). In all of these studies, scholars justify the use of diary research in general, but the choice of the technology to be used to collect the diary data is either arbitrary or not made explicit. Given the quickly changing media landscape described before, it is important to determine if the technology of data collections in any way biases the findings gleaned from those collections. Hence, the purpose of the study reported in what follows is to evaluate three methods of collecting time–space data: (a) the pen-and-paper diary (PAP), (b) the digital audio recorder (AR), and (c) the handheld mobile device (MD). Using niche theory as a lens, we ask the following research questions:
RQ1: Do the three methods differ in the average likelihood of any of the channels (e.g., television, radio, cell phone) being reported in a diary entry?
RQ2: Do any of the three methods have a significant effect on the measured or observed competitive superiority of a channel given a particular location? In other words is there a significant interaction between diary method and the measured competitive superiority?
Finally, the different methods may be perceived differently by the respondents creating otherwise immeasurable effects on channel use reports. Therefore, we ask:
RQ3: Are the three methods evaluated differently by diarists on cognitive and affective measures?
Method
Participants
Undergraduates from a large Midwestern university were recruited for this study and were only eligible for participation if they (a) consumed news content at least once per day, and (b) this news content came from a “professional” source (see following lines for description). These criteria for recruitment were implemented because this study was concerned not with overall news habits of the student population (some of whom may not consume news content daily), but with measuring and assessing news media niches among news users. Of the 84 students who consented to participation, interpretable data from 79 (94.0%) participants were obtained, yielding 338 news access sessions for analysis. While issues exist with the generalizability of college student samples, the present work was focused on a methodological comparison of diary instruments to inform future research using more representative samples. Therefore, a convenience sample was deemed appropriate for seeking sources of instrumentation error which may emerge in time–space diary data.
Design
To address the research questions, a time–space diary was constructed and implemented in three different formats: paper and pencil (PAP), digital audio recorder (AR), and handheld mobile device (MD). Participants were randomly assigned to one of the diary instrument conditions and asked to record each instance of news access (termed a news access “session”) for a 24-hour period. They were told that general news, weather, and sports content were all considered news for this study, but that personal blogs and other forms of news commentary or informal news sources were not to be reported for this study. While it may be valuable for other researchers to operationalize news content more broadly, the goal in imposing this limitation was to provide concrete boundaries to help participants understand which news consumption behaviors should be recorded, as well as limiting data to a more specific domain. Each time respondents accessed formal news sources they were asked to report the following items: (a) session duration in minutes, (b) physical location (residence, work, transit, computer lab, store/business), (c) type of news content (news, weather, sports), (d) level of news content (local, national, international), (e) medium used (TV, newspaper, cell phone, multimedia mobile, radio, computer), and (f) main reason for accessing news content during this session (e.g., check weather, seek specific story).
After completing their 24-hour recording period, participants submitted their diary content to an online database set up by the researchers. After entering their news session information, participants were prompted to respond to questionnaire items about their attitudes and perceptions of their diary instrument. First, they were asked to consider their overall impression of the diary instrument and respond to a set of semantic differential items adapted from Forehand, Deshpandé, and Reed (2002) which were designed to address level of affect toward an attitude object. Sample word pairs placed at the ends of a 1–7 scale include Bad–Good, and Poor–Outstanding. Next, participants were asked to respond to six statements that inquired about their cognitive reactions to the instrument pertaining to its usability. These statements were adapted from the technology acceptance model (Davis, Bagozzi, & Warshaw, 1989) where they were designed to address a technology’s ease of use in order to predict its acceptance by end-users. Sample items include “This diary instrument was easy for me to learn and use” and “This diary instrument was clear and understandable to use.” To conclude the exit survey portion, the participants were asked to respond to an open-ended item inquiring about their overall impressions and experiences using the diary recording devices.
Pen and paper (PAP)
Participants in the PAP diary condition were given a diary packet printed on 8.5” x 11” paper. The packet was five pages, double-sided, with two news access session entries on each side, allowing participants to record up to 20 instances of news access. For this diary condition, participants had to carry the pen-and-paper diary with them wherever they were during the day. Because the sample consisted of students, most participants simply stored the diary in their schoolbag. Whenever a news access session was completed, they would retrieve the diary, answer the items about the session, and then put the diary away.
Digital audio recorder (AR)
Participants in the AR condition were given an AR device and trained how to use it to record their news sessions orally. Participants were given a sheet from which to read the same news session items as the PAP condition, and then speak their answer into the recorder. Participants were instructed to read the items verbatim and then provide their answer, and to do this in the order the items appear. For example, after a news access session a participant would start the AR and say “The time of day at the start of this session, was 8:00 a.m. This session occurred at the location of . . .” Participants were instructed to record each news access session in this way for the AR so that at the end of their 24-hour recording period they would have a separate file on the AR for each session. For this particular diary condition, participants had to carry a small AR with them for the duration of their day. The device was small (approximately 1.5” x 1” x 4.5”) and so fit easily into jacket and schoolbag pockets, but also presented the issue of durability and loss. More significantly, the use of this diary device was more dependent upon the environment than the PAP diary. If the participant was in a noisy area, or somewhere that speaking was not permitted or socially unacceptable, this would impede their ability to use the diary device.
Handheld mobile device (MD)
For participants in the MD condition, the same session information and exit survey items were completed as in the other two conditions except that all entries and reports were made on a 3” x 5” mobile device operated using a stylus pen and touch screen to select buttons. No subsequent online entry was necessary for this condition. Participants were trained to enter their news access information into an application preloaded on their assigned device called SurveyToGo. At the end of the 24-hour recording period, participants were instructed to access a different file in the SurveyToGo program to take the exit survey about their experiences using the device. Participants returned the device to the researchers to complete their participation in the study. The data from the MDs were then copied to a computer for analysis.
Results
Because the time–space diary is designed to record multiple observations for each respondent, the data may not be analyzed using traditional central tendency or correlational statistics. This is because the unspecified number of observations (news access sessions) for each respondent violates the assumption of independence of observations and therefore biases any results produced from such statistics. Multilevel modeling procedures must be used for this reason. See Luke (2004) for a thorough review of multilevel modeling procedures, which were used in the following analysis.
Research Question 1 asked if the diary method used had any effect on the likelihood of a channel being reported for a use session. Prior to analysis, all diary method categories, use locations, and channels were dummy coded. Each variable was to be interpreted as a category being present or not present in a use session. A nonlinear multinomial model with two category outcome variables (logistic) was specified to estimate the log likelihood that a medium would be present or not present based on the method used. Separate models were estimated for each medium. The AR and MD diary method dummy variables were entered as Level 2 predictors of the Level 1 intercept to answer this research question. The PAP variable was left out and used as a reference category such that the effects of the other methods should be interpreted as relative to this category.
The results indicated that the effects of the different methods on the likelihood of the reported uses of the different media were nonsignificant (p > .05). Consequently, study findings provide some evidence that different diary methods can be used without significantly altering the reporting of media use (see Table 1).
Level 2 gamma coefficients for reported channel uses regressed on diary reporting method using multilevel modeling logistic regression procedures.
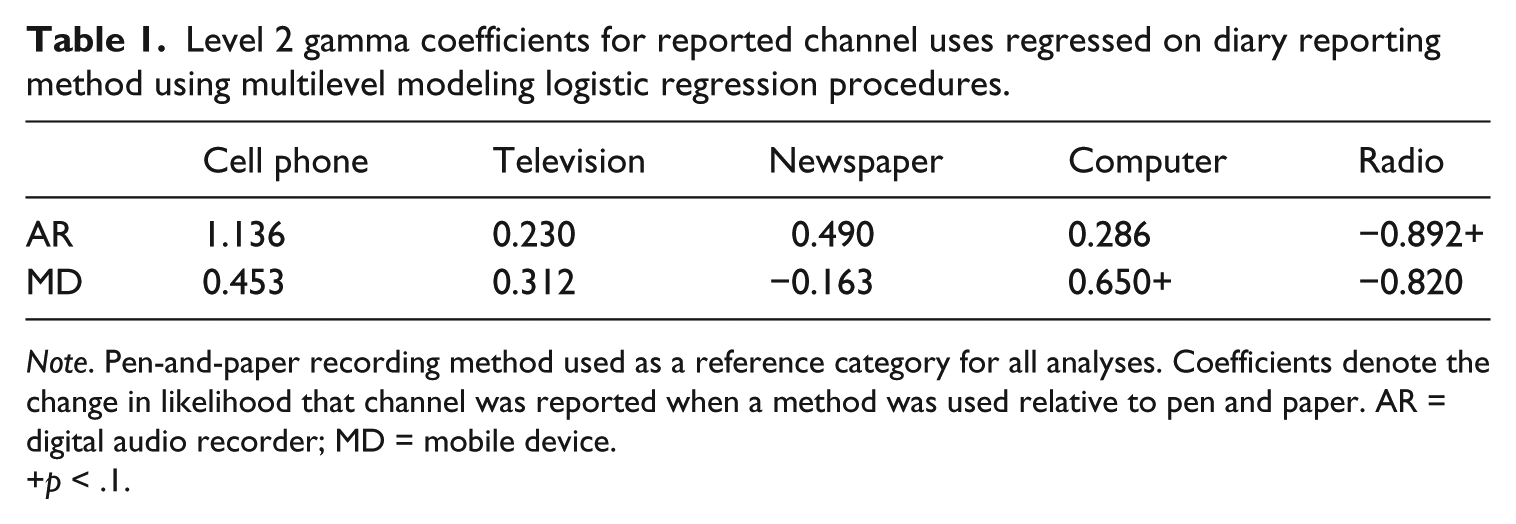
Note. Pen-and-paper recording method used as a reference category for all analyses. Coefficients denote the change in likelihood that channel was reported when a method was used relative to pen and paper. AR = digital audio recorder; MD = mobile device.
p < .1.
Research Question 2 asked if any of the three methods had a significant effect on the measured or observed competitive superiority of a channel in a given particular location. Prior to answering this question, the patterns of competitive superiority for use in different locations were analyzed across the three diary methods. The analyses for this initial step were set up in a fashion similar to those used in Research Question 1. The use locations were entered as predictors of the likelihood that each of the channels would be reported for a session over some other option. Use locations that made up the smallest 5% of the total uses for each medium were used as reference categories. In instances where near singularities occurred due to a lack of observations in a category, the dummy variable for that category was added to the reference. The variables that were used as reference categories for the analyses of each medium are labeled as “reference” in Table 2. As done in all previous studies using the time–space diary method, session locations that increased the likelihood for the report of a channel relative to some other option are interpreted as patterns of competitive superiority. Use locations that produced positive significant results were interpreted as part of the niche of the medium under analysis for the sampled population.
Level 1 beta coefficients for the reported channel uses regressed on news access locations using multilevel modeling logistic regression procedures.

Note. Positive coefficients are to be interpreted as an increase in the likelihood that a medium was reported for a session when the respective category was reported in the same session. Cells labeled “Reference” denote location categories that were part of the smallest 5% portion of the total uses for each respective medium. All significance levels interpreted from the robust standard errors portion of the HLM outputs.
p < .001. **p < .01. *p < .05. +p < .1.
When analyzed, evidence of competitive superiority was found for each of the channels under analysis. Access to news while in transit or while in a business location such as a restaurant marginally increased the likelihood of reports of cell phone use and newspaper use respectively. News access while in a residence and in a computer lab significantly increased the likelihood of reporting television and computers, respectively, for the sessions. News while in transit and while at work both significantly increased the likelihood that radio would be reported for a given session (see Table 2 for beta coefficients).
Once the baseline patterns of competitive superiority were analyzed, the effects of the different diary methods were assessed. For each channel, all location dummy variables except those that significantly increased the likelihood of its use were removed from the Level 1 model. In the Level 2 model, the AR and MD dummy variables were entered as predictors of the slope of the Level 1 predictor variables. Similar to interaction variables in regular regression procedures, these steps served to test if the use of any of the methods amplified or attenuated the slopes of the location variables in predicting the likelihood of the reports of the different channels under analysis. The results indicated that the diary methods only had noteworthy effects on the observed patterns of competitive superiority for the cell phone (p < .05). The marginally significant competitive superiority of the cell phone for news access sessions that occurred while in transit was strengthened for the respondents in the MD condition, relative to the PAP condition. While it is possible this effect is an artifact of respondents more easily retrieving their MD diary during a commute (relative to PAP diaries), alternatively this could represent a bias toward initiating news content search via the same technology as one’s assigned diary. Scholars utilizing survey apps on mobile devices should consider the potential influence of this diary method on participant behaviors, as research has found using a cell phone heavily for one activity (e.g., voice calls) increased the likelihood of using the phone for other data services (Wei, 2008).
Research Question 3 asked whether the three methods were viewed differently by the participants along affective or cognitive criteria, and was assessed through analysis of variance procedures (ANOVA). The ANOVA model indicated that participants reported different levels of affect for the different diary instruments, F(2, 73) = 8.837, p < .001. Pairwise comparisons indicated that individuals liked the MD (M = 6.16, SD = 0.73) more than the PAP (M = 5.39, SD = 1.08, p < .05) and AR conditions (M = 5.03, SD = 1.23, p < .05).
On the cognitive usability dimensions, diary effects also emerged, F(2, 73) = 3.224, p < .05. Follow-up analysis indicated that the PAP diary (M = 6.20, SD = 0.51) had stronger ease of use scores than the MD diary (M = 5.15, SD = 1.40, p < .05), but neither significantly differed from the AR diary (p < .05). Taken together, these findings indicate that affective and cognitive differences do exist between the diary conditions, with the MD being most liked, but the PAP diary evaluated as easiest to learn and use.
Discussion of diary methods
While previous research has successfully utilized the time–space diary with an adult (nonstudent) sample, it should be noted the present study may be limited in generalizability to college students. Given that research evidence has found similarities (Wiecko, 2010) and differences (Casler, Bickel, & Hackett, 2013) between college student and adult samples in behavioral measures, replicating the study findings outside a university setting is necessary before making broader claims of generalizability.
In summary, the results of this methodological study favor continued use of the PAP diary method, especially in situations where diarists are geographically dispersed, since it yields the same niche information as electronic methods. If researchers use this method for formative audience analyses, this capacity for geographic disbursement would yield significant economic, convenience, and adoption benefits over other methods which may require onsite training agents or detailed online instructions. While the MD was liked better than the other methods, liking did not translate into significant empirical benefits for mapping use patterns among the three methods. Finally, the PAP diary was rated higher on the cognitive evaluations which included important items as ease of learning and ease of use. For these reasons we consider the PAP diary superior to the two electronic methods evaluated in this study. Future research utilizing the time–space diary method will be best served by utilizing this format. Relative to the other methods evaluated in this study, the PAP diary best reaches a balance between usability and reliable measurement of media use patterns. Moreover, the consistent niche findings across the three diary instruments further support the reliability of the time–space media diary as method of capturing mobile media use.
Diary limitations and future directions
Though we argue for the merits of the time–space diary in this study, this method is not without its limitations for researchers to consider. Notably, relying on self-report for data collection means trusting participants are accurate in their reporting. Asking participants to record media consumption for short time periods (e.g., 24 hours or less) as well as making explicit that diary entries should be created immediately following instances of media use can help minimize inaccuracy of diary content, but does not fully prevent user error or faulty recall.
Another limitation to the diary method is the practicality of different instruments. Mobile devices must be charged in order to work, and participants may find themselves ready to record their media use only to find their device out of power. Alternatively, a paper diary could be cumbersome or difficult to carry, resulting in being left behind for portions of the day. Finally, social norms can potentially play a role in the ease with which participants may complete a time–space diary. Voice recorders cannot be used in some public places (e.g., libraries) as easily as a PAP diary, and mobile devices might be forbidden in a workplace or on a plane.
Despite these challenges, the time–space diary offers the ability to capture data which can address emerging use patterns of mobile and traditional media. For example, as coviewing or “second screen” behaviors are increasing (see Choi & Jung, 2016; Cohen & Lancaster, 2014), the concept of “interstices” as places where other forms of media are unavailable is beginning to change. Mobile media, coupled with “anytime, anywhere” access to the Internet, are creating novel times and places for communication behaviors, where media consumption or interpersonal interaction previously took place without intrusion. Turkle’s (2011) research highlights how time that was previously spent in face-to-face communication is being interrupted by the use of mobile media to communicate with others who are not present. While these “bits of time” do not fall under the formal definition of interstices (as other media or interpersonal contact are clearly available), the ubiquity and utility of the modern mobile phone has clearly created new norms of use which introduce new niches for the mobile device (van Damme et al., 2015). While it might be considered rude to pull out a newspaper and begin reading while talking with a friend at a coffee shop, pulling out one’s cell phone to text or check social media is relatively commonplace.
Future research can utilize the time–space diary method as a means of assessing specific uses of mobile media in order to better understand their specific time, location, content, or gratification niches in an ever-diversifying environment. For example, a diary could be developed examining why individuals use mobile devices during face-to-face interactions. By logging media use for 1 day (or more) whenever one used a mobile device during a face-to-face conversation, it would be possible to identify the niches of this media use context, as well as to compare it to other contexts (mobile media use when alone). Do individuals use their phones when in the presence of peers in order to communicate with others, or to access weather or news content? Are media use sessions shorter when in the presence of peers? Are search engine queries more likely to occur in the presence of others, or when alone? Where and when are individuals most likely to “interrupt” face-to-face conversation in order to use their phones?
Scholars looking to examine new media platforms (e.g., dating apps, mobile games) or technologies (e.g., virtual reality) may find time–space diaries particularly insightful, as they can be tailored to fit specific groups of participants or user behaviors. Future research examining dating apps (see Duguay, 2017; Sumter, Vandenbosch, & Ligtenberg, 2017) can design a diary instrument which asks participants to record specific information each time they use the app in a given day to identify when and where the app is used most often, capture the most common app behaviors (e.g., viewing partner profiles, contacting matches), or assess the user’s emotional state after app use. Alternatively, researchers interested in assessing how political information passes through social media (see Bode, 2016) may utilize a time–space diary to identify the niches of mobile and nonmobile media (e.g., desktop computers) regarding time, location, and duration of social media use. Moreover, scholars might assess whether learning about news via formal news sources (e.g., TV, online news sites) drives users to learn more about the topic via social media, or whether learning about breaking news informally via social media drives users to learn more by seeking formal news channels. While both of these processes are likely to occur, collecting data via a time–space diary which includes questions directly assessing this process can help shed light on the frequency and conditions under which these processes are observed.
There are a range of questions that can be addressed with a tailored time–space diary, especially as new platforms or games (e.g., Pokemon GO) lead to unique relationships between users, their devices, and the space around them (Humphreys, 2016; Tekinbaş, 2016). The present study sought to highlight this method as a means of capturing media behaviors which can occur at any time, in any place. Further, different methods of collecting time–space diary data were found to yield similar niche patterns, helping demonstrate its reliability for data collection. Finally, it should be noted that a particular strength of the diary method is that measuring media use or exposure to a range of channels is easily integrated, and allows for niche analysis to identify competitive superiority between new and emerging media options across time and space. While some mobile applications can be developed and deployed on smartphones which might automatically track user behaviors (such as interpersonal communication and mobile Web use), the time–space diary allows for media access from a range of channels (e.g., television, radio, laptop, outdoor media) to be recorded by participants and thus included in analysis. Such flexibility becomes particularly important when researchers are looking to compare different media channels (rather than solely a mobile medium) in terms of their superiority across a range of niche dimensions. As a result, the time–space diary method should be understood not simply as a means to measure mobile media use, but as a means to understand the complex use relationship between the range of media options that greet consumers, content producers, and advertisers today.
Footnotes
Appendix
Acknowledgements
Sadly, John Dimmick passed away in 2016. The authors would like to thank him for his friendship and mentorship throughout their careers.
Funding
The author(s) received no financial support for the research, authorship, and/or publication of this article.