



Abstract
How do people find answers to questions they encounter in everyday life? While extensive research has examined how people go about finding answers to questions online, there has been little work investigating the issue from a more holistic, in situ perspective that covers the various devices, resources, and contextual factors that influence everyday question-asking experiences. To address this, we developed a text-messaging-based data-collection framework. This paper details our approach including reflections on both the benefits and challenges of the methodology for researchers seeking to apply similar approaches to social science research. In doing so, we demonstrate how our methodology helps establish a contextually rich understanding of information-seeking processes. We also demonstrate our approach to analyzing data from a small but diverse group of adults across the United States about their everyday question-asking experiences.
Keywords
How do people find answers to questions they encounter in everyday life? While research has examined how people use the Internet for information seeking, there has been little work investigating the issue from a more holistic perspective. Missing are methods that can cover the vast array of questions that occupy people on a daily basis for which they use a wide range of devices and resources across numerous contexts. The overarching goal of our project was to develop a method of data collection that helps collect data to shed light on how people find answers to the everyday questions they have. The method would need to gather data in a way that would allow us to discern different aspects of the question-asking process. For example, for what types of queries are people most likely to turn to digital versus other sources? How do mobility-based attributes such as location, activity, and social context relate to question formulation? What types of questions result in unmet information needs? To begin to answer these types of research questions, we developed a text-messaging-based data-collection approach that can capture data from a diverse group of adults nationally about their everyday question-asking experiences without imposing constraints a priori on how they may find answers. Our approach has important benefits over most existing methods, which we detail in what follows.
In this paper, we report the methodological details of the project with important lessons learned. We start with a brief review of literature on question-asking as well as studies using experience sampling methods and text-messaging to gather data from participants. The bulk of our project description explains the nuts and bolts of getting the system up and running: details about system development, the instrument for asking about people’s question-asking experiences, pretesting, participant requirements, recruitment, and data collection. Then, to illustrate the breadth of responses collected with this method, we discuss the data collection focusing on response rates and our analysis process especially regarding our classification scheme. We end by summarizing the main challenges of the approach, offering next steps for future work, and explaining the applicability of the approach to other types of research.
Related literature
For decades, research has been concerned with how people find answers to questions, initially investigating library use (Lancaster, 1977) then later expanding to various information technologies (Marchionini, 1995). Such research has tended to focus on the use of specific platforms from library catalogs (Norden & Lawrence, 1981) and search engines (Jansen & Spink, 2006) to question-asking sites (Jeon & Rieh, 2015; Rodrigues & Milic-Frayling, 2009), social network sites (De Choudhury, Morris, & White, 2014; Morris, Teevan, & Panovich, 2010), and topic-specific forums such as online health communities (Wicks et al., 2010). These approaches, while valuable, restrict inquiry to the platform of interest inherently ignoring other possible sources of information. Even when studies have not restricted their investigation to one specific platform allowing users to look for answers anywhere online, requiring use of the Web on a computer still limits available options (Hargittai, 2002; Hargittai, Fullerton, Menchen-Trevino, & Thomas, 2010; Rieh, 2004).
While much research has focused on single sources for answers, scholarship has established that when faced with a question, people have different needs depending on where they are in the question-formulation process (Kuhlthau, 1991; Taylor, 1968), and they have numerous options to find an answer (Spink & Cole, 2006). These include approaching others in their physical environment (Borgatti & Cross, 2003; Fisher & Naumer, 2006), using various technologies for one-to-one or one-to-many correspondence, and querying a digital resource. Additional work reveals that question-askers make fine-grained distinctions based on topic and perceived audience when deciding how to route their questions to different resources (Litt & Hargittai, 2016; Oeldorf-Hirsch, Hecht, Morris, Teevan, & Gergle, 2014). Yet, little research has systematically investigated the opportunities provided by all of these various options (for notable exceptions, see Church, Cherubini, & Oliver, 2014; Sohn, Li, Griswold, & Hollan, 2008), and as a result, the majority of research poses artificial limits on how people may look for information, yielding an incomplete view of everyday question-asking. Furthermore, most studies tend to be of specific populations: either because they use convenience samples or due to studying specific technological platforms that have a restricted sample of users (Hargittai [2015] elaborates on how sampling on users of specific social network sites results in biased samples). To address these limitations, we aimed to develop a methodology that would allow us to capture data from a diverse sample of people and avoid limits put on how people of varying backgrounds find answers to their questions. We worked toward this goal by collecting data on any and all types of questions for which people may turn to accessing any and all types of sources using devices or not when looking to address a query.
The experience sampling method and ecological momentary assessment
Major methodological advances occurred in the behavioral sciences in the 1980s and 1990s that centered on addressing recall biases and temporal insensitivities associated with retrospective self-reports (Bradburn, Rips, & Shevell, 1987). A primary goal was to decrease reporting bias while at the same time increasing ecological validity (Shiffman, Stone, & Hufford, 2008), leading to the development of new data collection techniques such as the experience sampling method (ESM) (Csikszentmihalyi, 2014) and ecological momentary assessment (EMA; Stone & Shiffman, 1994). Early applications of the ESM and EMA approaches were carried out as paper-based diary studies that relied on reminders from pagers, landline phone calls, or wristwatch alarms (Bolger, Davis, & Rafaeli, 2003).
The technique has seen wide application in studies that range in their collection schedules, targeted behaviors, and the extent to which they integrate technology (e.g., Cohen & Lemish, 2003; Consolvo & Walker, 2003; Hargittai & Karr, 2009; Mehl, Pennebaker, Crow, Dabbs, & Price, 2001). Yet, they all have as their goal to capture repeated measures as close in time as possible to the relevant activities that take place in a participant’s natural environment, sidestepping recall challenges. This helps avoid both forgotten instances of the studied behavior as well as details about actions that may be difficult for respondents to recall later. In the context of question-asking research, this is useful because collecting data on the large number of questions that cross people’s minds during their daily activities would otherwise be extremely difficult. By repeatedly soliciting information about these questions throughout the day, respondents are able to give more nuanced answers than would otherwise be possible.
With the proliferation of cell phones (over 90% of Americans own cell phones, Anderson, 2015; with similarly large penetration elsewhere, The World Bank, 2017), researchers have started using text-messaging for data collection (Hargittai & Karr, 2009; Moreno et al., 2012; Phillips, Phillips, Lalonde, & Dykema, 2014; Willoughby, L’Engle, Jackson, & Brickman, 2017), although much of the work uses it as a way to deliver information to people (e.g., for health campaigns; see Head, Noar, Iannarino, & Grant Harrington, 2013, for a review) rather than as a way to collect data. While text-messaging can provide rich data about respondent experiences, such methods can pose major challenges (e.g., Hargittai & Karr, 2009), as we describe through our own project next.
Our approach
In this section, we discuss our framework building on experience sampling and text-message-based data collection with a particular focus on methodological considerations. We start by detailing the development of the system followed by a discussion of our measures, pretesting, requirements for being a participant in the study, and recruitment. Then we describe the data-collection process and the sample.
System development
We decided to develop our own system after having surveyed the landscape of available ESM options. Existing services tended to be proprietary without sufficient customization options, may have had high costs depending on messaging volume, and likely would not have been able to guarantee the confidentiality of participant contact information, something the ethics of our work and Northwestern University’s Institutional Review Board (IRB) required. Developing systems is itself very costly, both in time and money, but the advantage of tailoring the technology to one’s precise research needs serves as an important motivator.
We wrote the researcher side of the software application in Java and deployed it on a single Android smartphone as a custom app. An advantage of our approach was that participants did not need a particular type of phone operating system nor did they have to install a special app in order to be involved in the study. This passive form of enrollment is important as it makes participation simple across a wide range of devices and operating systems (e.g., Android, iOS, Windows Mobile, etc.). Requiring specific types of phones or apps may bias recruitment against people with different financial resources (e.g., phone-type ownership) and skills (e.g., ability to install and operate a novel app). Since our goal was to achieve a diverse respondent pool, these would have been hindering constraints.
Our application automatically sent the first text-message prompt to the participant at a preset time (i.e., a fixed time-based sampling strategy), and then sent follow-up prompts once the participant responded to the initial message (i.e., participant-triggered or event-based contingent responses). This sampling strategy allowed us to retain control over the temporal aspects of sampling while also permitting the participant to reply when they were available. This responsive interaction pattern of “wait-for-response-then-engage” let the participant defer an immediate follow-up if they were temporarily unavailable (e.g., driving, in a meeting). The use of text-messaging may also help to reduce noncompliance because the participants cannot easily switch it off like they can with many app-based notification approaches. Together, these design choices aimed to optimize the joint goal of balancing researcher control, participant compliance, and participant burden.
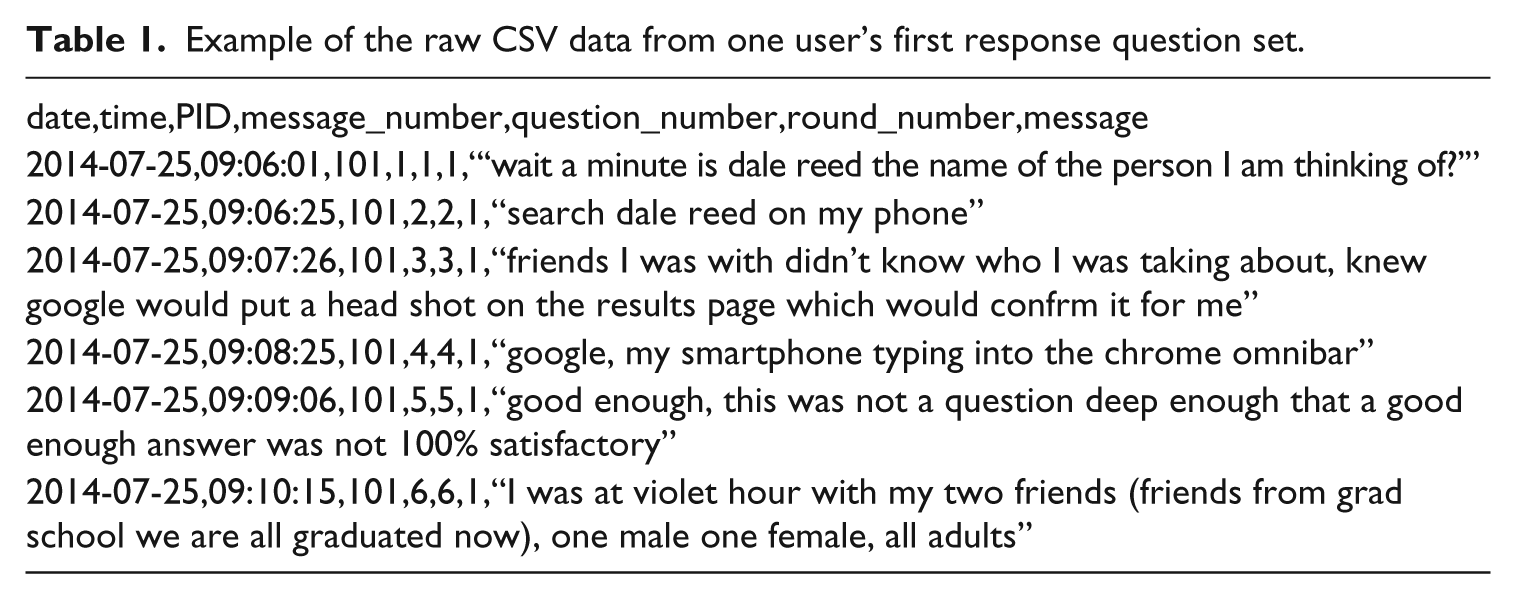
We stored participant responses locally on the Android smartphone’s file system in a CSV-formatted text file with fields for date, time, participant ID number, message number, question number, round number, and the content of the text message the respondent sent.
Measures
Our larger project goal was to develop a typology of question types and resource modes, and to gain a deeper understanding of how individuals route their particular questions to various resources. We devised the following set of text-message prompts to capture a broad set of question types participants encountered during their day. These ask about the participant’s most recent question and then elicit additional details about the resources and devices they used to find an answer, the physical and social context in which the process occurred, and their level of satisfaction with the response they found.
[Hour of day] What is the most recent question you had today?
What was the first thing you did to find an answer (include method and source used)?
Why did you choose that approach to find an answer?
What was the source of the best answer you found? Using what medium/device?
Was the answer a very good one or just good enough? If just good enough then why did you not continue searching for a better one?
Where were you and who were you with when this occurred (include gender, relationship, how many, kid/teen/adult)?
Not every question that would come to the participant’s mind would be a good fit for all of the message prompts; therefore, our instructions asked participants simply to do their best to report accurately on what came to mind at the moment of our prompt. The first prompt simply asked the participant to report on the most recent question they had pondered. The subsequent prompts (2–6) aimed to capture contextual information around the information need. Participants were instructed that when the message prompts referred to a potential answer source, the goal was to report on who or what provided the information (e.g., a coworker, a search engine such as Google, or the person themself). When the message prompts referred to a medium/device, participants were told that this concerned the method of contact the participant used to query the source (e.g., face-to-face conversation, the Facebook app on their smartphone, texting on a cell phone, using the Web on a laptop, thinking, etc.). We shared these instructions with respondents before sending any of our data-collection message prompts. Table 1 illustrates an example of one session of raw data from a single participant.
Example of the raw CSV data from one user’s first response question set.
One of the key challenges we faced when developing message prompts was to strike a balance between being too concrete and thus priming the respondents toward particular types of responses versus being too abstract to the point of receiving responses that did not provide relevant details on the facets of information-seeking of interest. Given the wide variety of responses we received, we seemed to achieve our goal of not limiting people too much. Generally speaking, most of what we received as responses were relevant so we achieved the targeted sweet spot.
Pretesting
Trying out the system before launching a new tool is essential for avoiding surprises. For our first pretests, we as team members participated in the study so that we could experience first-hand what may or may not work, both technically and regarding the substance of our study. For example, early on we discovered that responses with some emoticons would crash our software due to a parsing failure. Having to respond to our own message prompts also helped us appreciate whether any of them might be confusing to future participants. In other words, if we had a hard time figuring out how to respond to a prompt even though we knew the ins and outs of the study, then there was a good chance that a future participant would also be confused and thus the prompt needed to be revised.
After a few iterations updating the method and technology, we reached out to some friends unfamiliar with our research goals to pretest the study. Their feedback allowed for continued refinement of both the message prompts as well as the study process from getting people enrolled to handling the incoming data. For example, as we started engaging with more pretesters, we realized that our onboarding process—explaining the study to people and getting them technically enrolled—was too dependent on some manual steps to be scalable. Ideally, we would have started people on receiving our prompts immediately after they expressed interest and passed our screener survey (see more on that in what follows), but given how our process was set up, this would have required unrealistic constant human intervention that was not only financially prohibitive for the project, but also logistically unworkable. We thus refined the onboarding process, data collection, and payment aspects of the study so that we could handle larger numbers of concurrent participants. This led to handling onboarding and payment cycles in batches (e.g., once or twice a day) as opposed to enrolling each individual on their own timeline.
User testing and IRB requirements resulted in some specific issues we had not anticipated up front. First, our pretests revealed that participants sometimes tried to send multiple text messages in response to a single prompt and this resulted in misaligned responses to our message prompts. To address this, we modified the application so that the participant could type “WAIT” as the last four characters of their text-message, which would allow them to follow up with another text message for the same prompt. Second, IRB required that participants be able to skip questions, provide responses such as “I choose not to answer,” and be permitted to withdraw from the study at any time. Therefore, we developed our application so that participants could choose not to respond to a prompt, include a null response (e.g., blank spaces or “No question”), or reply with “QUIT” at any time in order to stop receiving prompts. Participants received information about all of these options in the instructional email we sent when they first enrolled in the study.
Participant requirements
Participants had to be 18 years old or older, have a smartphone with unlimited texting, and reside in the continental United States. The unlimited texting plan was necessary in order to avoid participants incurring large messaging costs. While this may have restricted participation to some extent, unlimited texting was available with many different phone subscription packages at the time of the study and thus was unlikely to pose major constraints for recruitment. We had to restrict participation to those residing in the continental United States due to the complexities introduced by different time zones. As is, running the study across the four time zones of Eastern, Central, Mountain, and Pacific posed challenges given our batched approach mentioned before.
Recruitment
We used three methods of recruitment: physical flyers, direct emails to people in our networks, and posts on social media with a link to a Web page with more information. We restricted flyers to public areas not on college campuses to avoid oversampling students, an approach that proved successful. The recruitment message included an email address. Once we heard from interested people, we asked them to fill out a short online screener survey that served to verify that they met the requirements of our study (adults 18 and over, residing in the continental US, unlimited text-messaging plan). The screener also asked potential participants to answer an attention verification question and provide the phone number that they would use for the study. We put these two measures in place to minimize gaming of the system made possible by the fact that enrollment took place remotely by anyone who may have encountered our recruitment materials, which promised financial remuneration. The attention verification question helped ascertain that enrolled participants would put in at least minimal effort to read and attend to the instructions. The phone number was for verifying each individual at the time of enrollment, and to make sure that they did not sign up for the study again using the same phone numbers.
Participant payment was tiered to provide additional incentive for continued involvement in the study. We did this to minimize participant drop-out and irregular responding that often plagues longitudinal and repeated-measures research designs. For filling out the initial survey, participants accrued $2.00 toward a gift card. For submitting responses to at least half of the text-message prompts on the first day, they accrued $4.00. If they also submitted at least half of the text-message prompts on the second day, they accrued another $4.00. Additionally, if they submitted text-message responses to at least half of the prompts, each text-message response counted for a ticket for an iPad drawing. Upon completion of the study, participants received up to a $10.00 gift card and an entry in a raffle for a chance to win an iPad Mini.
Data collection
We collected data in 2014. People who met the study requirements received a link to an online survey asking about their demographic background as well as details about their Internet access options, some of their online experiences, and their Web-use skills (since survey methods are not the focus of this piece, we do not detail these questions here, they were very similar to the ones used in Hargittai [2010]). After completing the survey, participants received an email with instructions on how to interact with the messages our app would send them. Once the participants read the instructions, they were required to text “READY” to our study phone number from their primary phone, which would log their phone number, check it against the number we had received on the survey, and mark the participant as activated in the study. The series of message prompts would begin the following morning.
We made use of a fixed-sampling ESM approach where for two days each participant received our six message prompts at 9:00 a.m., 11:00 a.m., 2:00 p.m., 4:00 p.m., 6:00 p.m., and 8:00 p.m. Central Time (for further details on ESM sampling strategies, see Bolger & Laurenceau, 2013). Each text prompt was accompanied by a “reminder alarm,” which resent the text if there was no response after 30 minutes. Given that we were reaching out to participants throughout the day, there was a good chance that some of our messages may reach them at times when they were unavailable (e.g., driving, work meeting), so we felt it important to send a single reminder when we had not received a response. We also developed participant-triggered response questions so that once the system received a message response from the participant, it would immediately proceed to the next message prompt.
The sample
Table 2 presents participants’ demographic characteristics. Twenty-five adults from a dozen U.S. states representing all four mainland time zones participated in the study. They ranged in age from 23 to 63 with 39 as the average. Just over two thirds were female, the majority were White with one Asian American, one African American, and one Native American respondent. The majority were employed, a few were stay-at-home adults, and one was a student. All but two respondents had a college degree. While clearly a relatively privileged group, the sample is nonetheless more diverse than restricting participation to a group of students or employees at a particular institution or geographical location, a sampling procedure common in related literature.
Participant background.
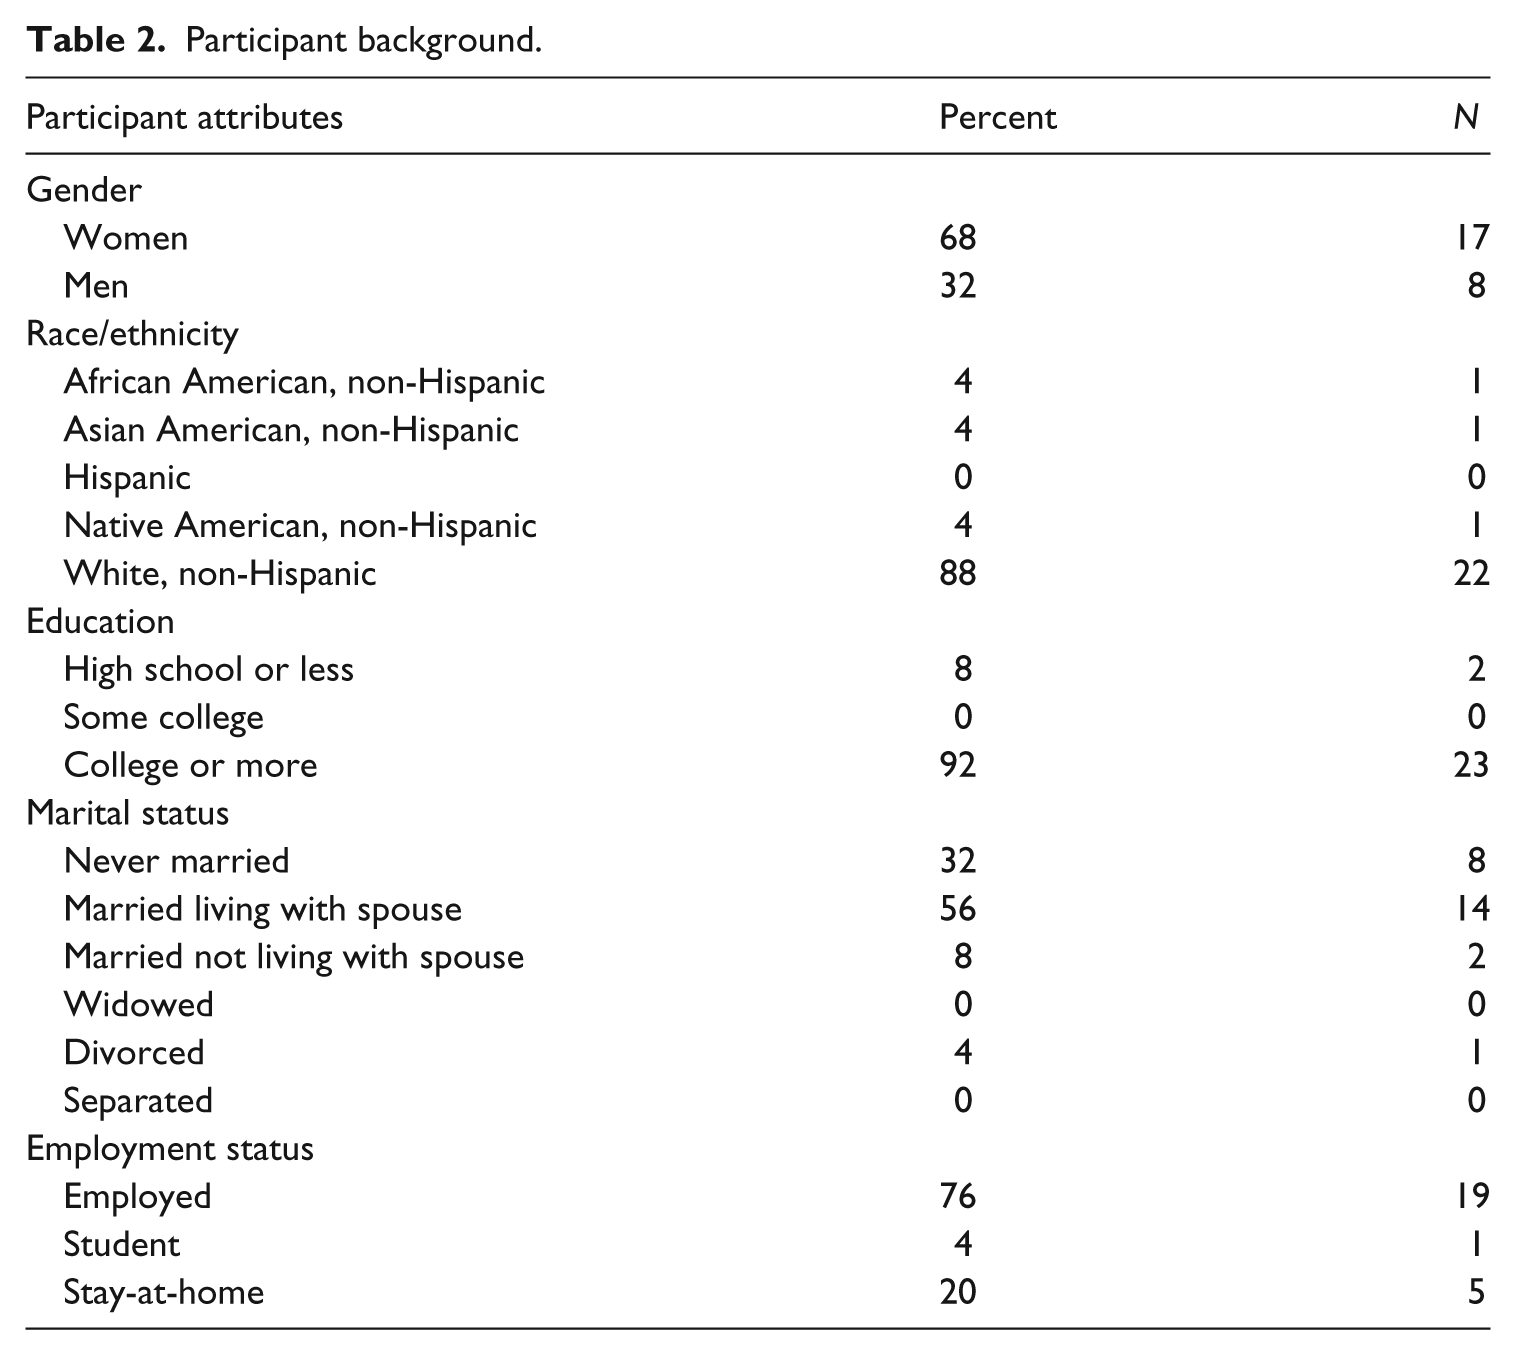
Table 3 presents the study participants’ experiences with the Internet and social media in particular. Respondents vary considerably in their use of digital media, which is relevant given the potential sources they may consult for finding answers to their questions. All used at least one social network site with Facebook the most popular (23 out of 25 people) followed by LinkedIn, Pinterest, and Twitter (10 people each). They were also diverse in their general Internet skills (Hargittai & Hsieh, 2012), based on our index measure of that construct (1–5 range, x– = 3.8, SD = 0.8).
General Internet and social network site experiences.

The data
Our project goal was to develop a data collection method that would help reveal people’s everyday questions and how they find answers to them. To achieve this, our method needed to be capable of collecting data from a wide variety of people across a range of locations and environmental settings, and we needed to be careful not to exclude participants by requiring expensive technology, advanced technological skills, or using an onerous data collection method (i.e., lowering compliance because of excessive reporting burden). To demonstrate our mobile data collection’s feasibility for this research problem, we report detailed response rates followed by a discussion of responses that highlight the breadth of question types, the variety of resources used, a description of answer quality, and the various locations and contexts which participants reported.
Response rates
We initiated prompts for 257 response question sets, which resulted in 1,166 text messages from the 25 participants concerning 214 response question sets (in other words, we did not get any responses to 43 response question sets). Table 4 presents the response rates to the initial question prompt for each of the participants that sent the “READY” text-message and activated their enrollment. Overall, the participants responded to just over 83% of the initial question prompts, with a median response rate of 90%, and a modal response rate of 100%. For cases in which the participants responded to the initial question prompt, they then responded to 89% of the subsequent prompts (i.e., Questions 2 through 6). Table 5 presents the response rates by time of day; while there is some decrease near morning and evening commute times, the differences were relatively small.
Response rates.
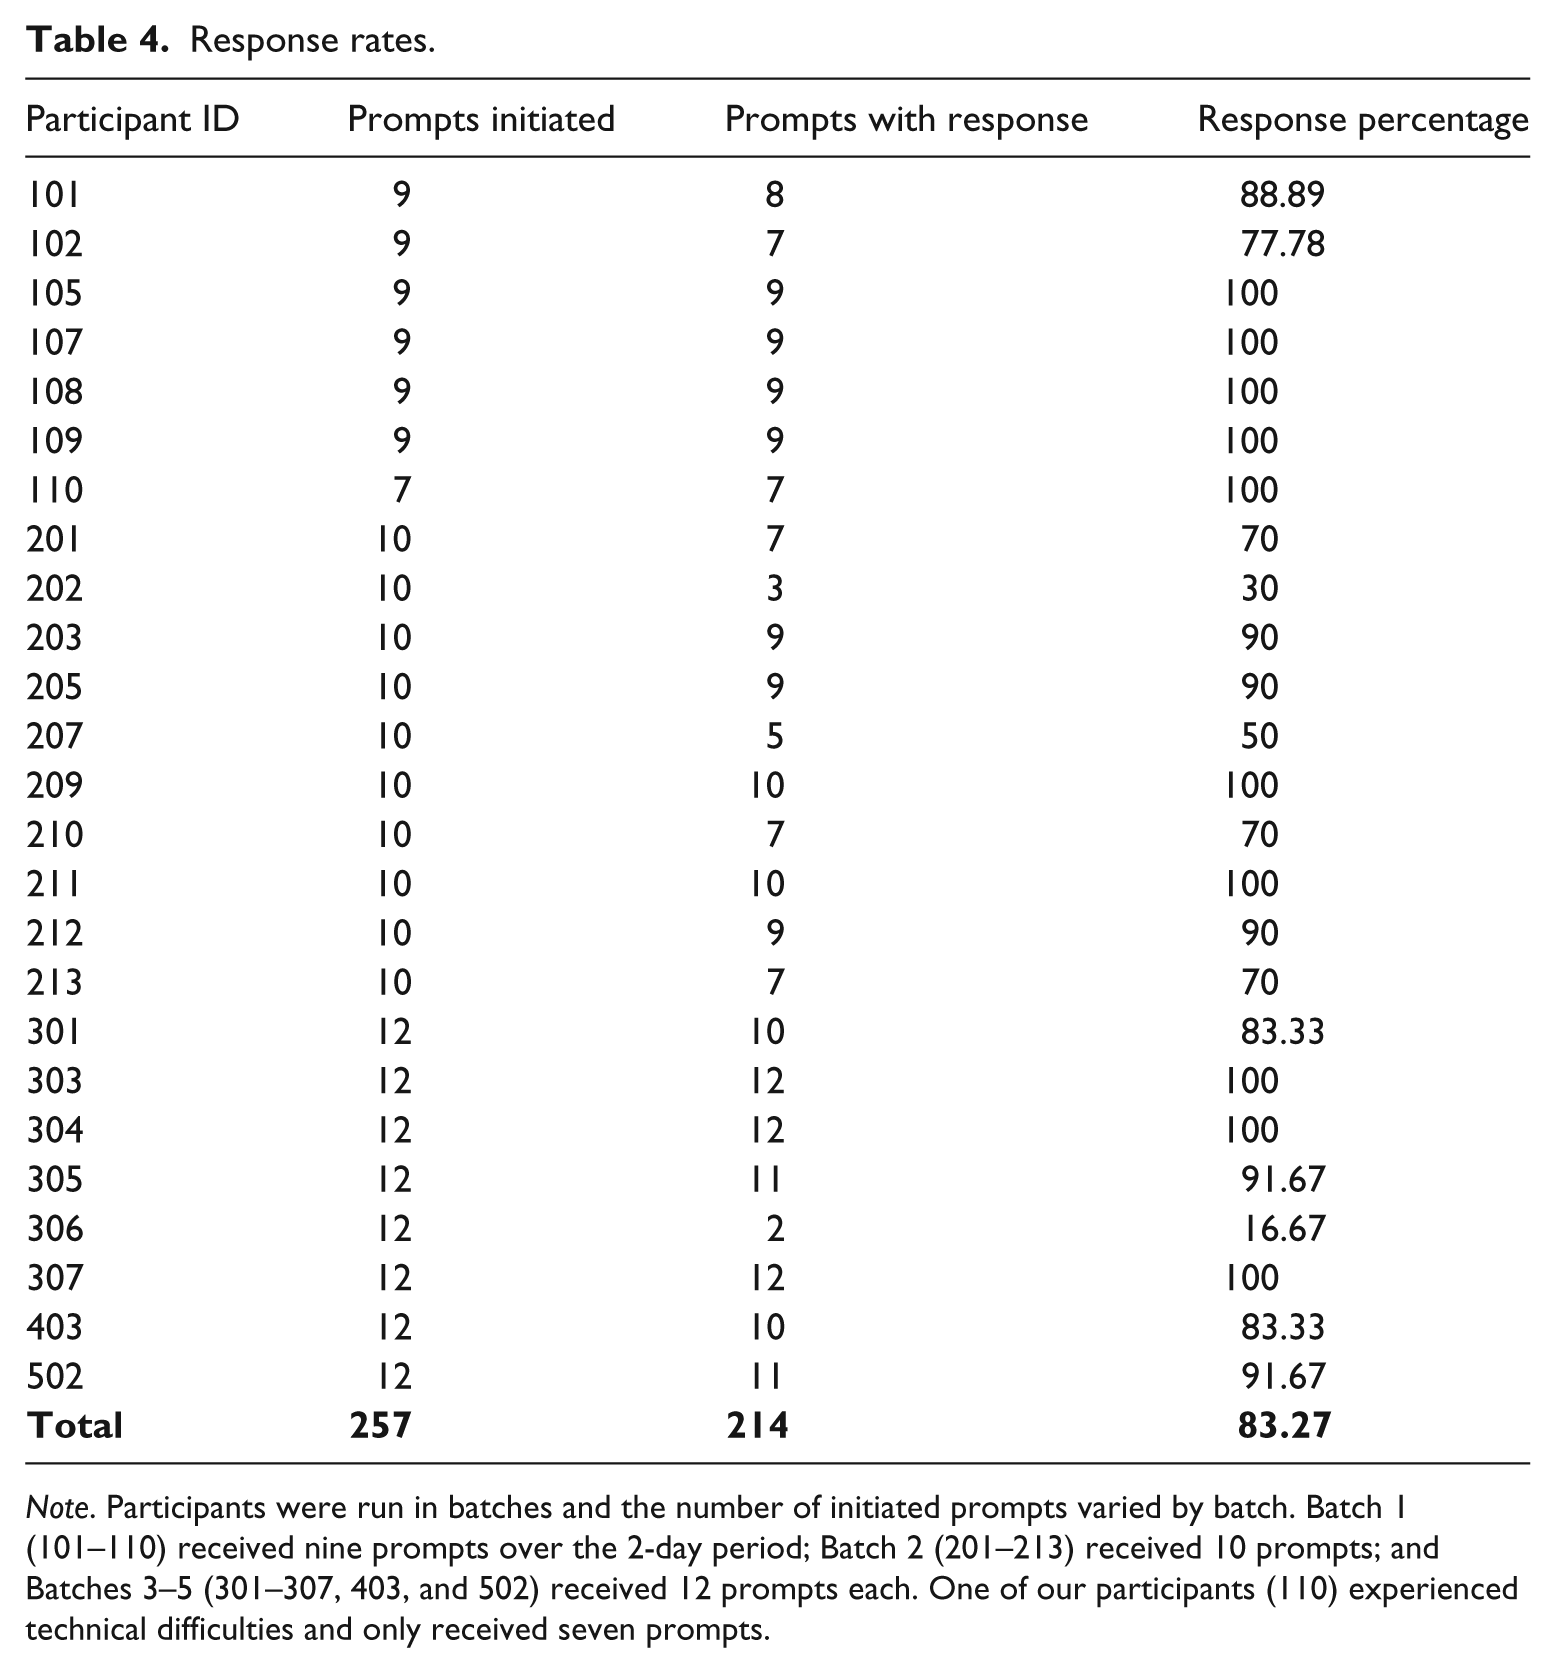
Note. Participants were run in batches and the number of initiated prompts varied by batch. Batch 1 (101–110) received nine prompts over the 2-day period; Batch 2 (201–213) received 10 prompts; and Batches 3–5 (301–307, 403, and 502) received 12 prompts each. One of our participants (110) experienced technical difficulties and only received seven prompts.
Response rates by time of day.

Note. Times based on U.S. Central Time.
Overall, we felt our approach struck a good balance between the invasiveness of the prompts and the potential for underreporting on the part of the participants. This may have been helped, in part, by the fact that participants could defer their responses until they were ready—something we hoped would help minimize interruptions and study drop-out, and instead, support response compliance.
Classification scheme
To demonstrate the breadth of responses we received with our methodology, we classified the answers to each question in our question set regarding respondents’ queries. While some of them have limited answer options (e.g., was the answer very good or just good enough, physical location of participant), others encompass nearly any and all possible topics and activities, resulting in a very complex coding scheme that has to account for vast diversity.
Question types
Our first prompt “What is the most recent question you had today?” has an unlimited number of possible replies exemplified in the responses we received ranging from “How long will it be before our friends can join us for drinks?” to “Are my daughter’s sudden hives associated with her strep throat?” to “Who is Jonathan the Tortoise?” We performed iterative coding to classify the range of topics that appeared in response to the first question prompt.
One of the most popular response types had to do with scheduling such as knowing the time of day when an event took place or getting in-the-moment coordination information (e.g., “What time is the polo match on Sunday?,” “What time does my meeting start?”). Location-based questions focused on topics such as how close the participant was to something of interest or geospatial questions like knowing the weather for a given locale (e.g., “Is there another sushi place nearby?,” “What will the weather be like today?”). Several questions covered travel-related topics such as what to do at certain destinations (e.g., “My family is vacationing soon in a rural place where we’ve never been before. I wondered about the availability of horseback trail rides”) or logistical issues (e.g., “What do I need to take with me on the camping trip?”).
Commerce-related questions concerned information about product options, the cost of an item, or comparison shopping (e.g., “What would be a good tool kit to get my daughter for her dorm room when she goes to college next month?,” “How much are dry erase markers, and where is the best price?”). Health-based topics were also common (e.g., “What is this bump on my arm?,” “Will walking help my anxiety?,” “Can I give my child Benedryl [sic] with Amoxicillin?”). Finally, there were numerous questions classified according to more specific subcategories such as definitional questions (e.g., “Are Sikhs a part of Islam?,” “What does 穷折腾 mean?”), how-to questions (e.g., “How long do you grill corn on the cob?”), or seemingly trivia-like questions (e.g., “What is the name of the big cartoon rooster?”).
Resources used
Our second, third, and fourth prompts asked about how people approached their answer-seeking (what was the first thing they did, why they chose that approach, and the source of the best answer). The most popular medium used in finding an answer was a phone, and it was used for both Web searching as well as correspondence with others. Face-to-face conversation was also a popular approach, as well as using a laptop, desktop, or another type of computing device. Participants reported finding an answer using their first source of inquiry 77% of the time.
Regarding respondents’ first approach to finding an answer, we coded for whether they used a device (e.g., “At my desktop computer,” “My phone. Windows Phone 8”), and what source they consulted (e.g., “Asked my husband who was in the car with the kids,” “Walked up the road using our legs,” “Twitter on smartphone app,” “Google on iPhone”). This category also must account for responses such as “I thought about it.” The motive for choosing the particular approach also resulted in a range of responses from convenience (“Availability & convenience”) to trust considerations (“I trust the internet’s crowdsourcing when it comes to recipes”) to perceived experiences of sources (“Their relevant experience”).
Some of the sources of best answer received were straightforward, ranging from online sources (e.g., “Google results on my work computer,” “Wikipedia on my iPhone”) to the person’s own thoughts (e.g., “Thoughts,” “My brain,” “My mind”), while others were murkier especially when a final result was not yet available (e.g., “My husband’s opinion vs my own. We’re still debating. I’m going to have to go w ‘talking it out’ as the medium”). Even in some cases where there was a best answer, the method may have been a bit circuitous and thus tricky for respondents to articulate (e.g., “Used the phone to ask the parent who then asked the children. So - phone and asking questions of humans?”).
Answer quality
Perhaps the easiest-to-code question we posed respondents was whether the answer they found was “a very good one or just good enough.” Seventy-two percent of the participants reported at least once that they settled for a suboptimal answer, and 19% of all answers were noted as suboptimal. Asking a binary question certainly helps with coding as many messages simply stated “very good” or did so with some elaboration. For those who were not very satisfied with what they found, our prompt also inquired: “If just good enough then why did you not continue searching for a better one?” which yielded more diverse responses (e.g., “It wasn’t a good answer but I couldn’t use Google maps because I was driving,” “Good enough. I didn’t need an exact recipe, so I could patch it together from the first few search engine hits,” “I concluded that, no, Snopes didn’t have anything on it. It would’ve been nice to get a different answer, but that one seemed conclusive for now”).
Location and context
Finally, we asked: “Where were you and who were you with when this occurred (include gender, relationship, how many, kid/teen/adult)?” which was also relatively straightforward to classify in most cases, both regarding location (e.g., “home,” “pizza joint,” “office”) and social context (e.g., “by myself,” “with my husband, age 29,” “with my wife (female & adult) and kids (18 yo female, 15 yo male). Also, our 8 yo male (neutered) dog”).
Significant challenges
While our approach proved to be helpful in collecting data on a much wider variety of question types than other methods allow, it did pose some significant challenges that we discuss in the interest of informing future researchers of what considerations must be made. Our goal of including a diverse set of respondents meant that we did not want to impose major geographical constraints on the study. We quickly learned that relying on a system that sends out all message queries at the same time posed some logistical complications. First, we had to develop and keep track of four different versions of our instructions to give to participants so that each mentioned the correct local time of message delivery. Second, it meant that we had to constrain our data collection to hours that were reasonable for intrusion across four time zones (i.e., not too late on Eastern Time and not too early on Pacific Time). In future iterations, we will spend the extra effort required to develop a system that can be customized to participants’ local time zones sending alerts separately rather than batched.
As much as we tried to eliminate question–response alignment issues (e.g., using the approach we described earlier with the “WAIT” note to allow people to add content to the prior message), on numerous occasions we nonetheless ended up with misaligned messages. In some cases, we received multiple text messages corresponding to a single prompt and as a result misalignment or having too many responses for our set of six prompts. In others, we had respondents mentioning answers to prior prompts with their response to the current prompt adding complexity to coding (e.g., “(In the previous message, I neglected to say that all that was Safari, iPhone, Web, Google+Wikipedia),” “(And I neglected in my preceding answer to say this was still using Safari on my iPhone).” We ultimately determined it was better to let people respond as they wanted than to try and control the responses since there were so many different ways the participants could “mess up” our system. While it provided flexibility for the participants, it put additional strain on us as researchers at various stages of the project from data cleaning to data coding and analysis.
Discussion and conclusion
The goal of the methodology we describe in this piece is to improve our understanding of everyday information needs by uncovering the broad range of questions that arise in everyday contexts, to understand the role that location, activity, and social context play in influencing questions and their formulation, and to reveal new opportunities for technological innovation to address unmet information needs. While a considerable up-front cost, building our own system was beneficial for addressing needs that ready-made options did not do, such as precise control over question delivery timing and the ability to determine programmatically how to respond to and process participant responses. It also means long-term cost savings since we do not have to pay for each study going forward. Running our own system also allows easier compliance with ethical guidelines. We were able to gather data from a diverse group of people representing countless types of questions and question-asking social contexts thanks to our method not having technological requirements beyond access to text-messaging, a nearly ubiquitous technology nowadays. We achieved a high response rate both across and within respondents, likely aided by our participant-triggered response approach.
We also learned what our system was not able to handle well. For example, processing emoticons required special error-handling by our program, and we were also unable to deal with images and photographs. We also needed to implement additional procedures in order to run the study on a national sample that allowed anyone to register (e.g., phone number and attention verification questions). Initial participant enrollment, tracking throughout the study, and final closeout and payment all required substantial personnel intervention—so much so that a wide-scale deployment with hundreds or thousands of users would have required a full-time position to help run the study. Drawing on these lessons learned, in future work, we will develop more automated components and fewer time-zone constraints thereby allowing us to deploy the study at a larger scale with the continued goal of further developing our understanding of how and why individuals route their various questions to particular resources.
While our study did not focus on a specific topical domain, the approach can be applied to more targeted studies such as those exploring health information-seeking or geographical way-finding. Considerable literature exists on health information seeking, yet most of it is limited by the usual constraint of related work: focusing on one particular source of information such as the Web (e.g., De Choudhury et al., 2014; Klawitter & Hargittai, 2018). The methodology described in this paper allows researchers to move past such constraints by collecting data on a wider range of resources. While our study did not put constraints on the topic of questions, other projects certainly could. A study on how people deal with a chronic condition could check in with participants regularly through text-messaging to gather similar data, but focused on health information- and support-seeking.
Our methodology can also be used to elicit data that can inform developers about search and retrieval system shortcomings. For example, it can reveal the kinds of questions and contexts that currently result in unmet information needs such as those that at present require a great deal of context (e.g., “What is this plant at the edge of the trail?”), are difficult to put into words (e.g., amorphous objects or abstract concepts), or trajectory-based queries and those that rely on results integrating multiple entities (e.g., “I’d like to know the nearest area to me that has both a grocery store and a car repair shop”). Data collected using our method can also help fill usage gaps by considering how various user experiences (e.g., Web-use skills, online behavior) and contextual factors (e.g., location and time of day) influence a person’s tendency to interact with those in their physical environment and/or available technologies to seek answers. But our methodology can inform more than research on information-seeking. It is well-suited to soliciting responses about all sorts of daily activities and thus can be applied to diverse types of time-diary studies, from exposure to various political messages throughout the day in person and through mediated communication, to type and frequency of social interactions in various places. While methods certainly exist for such questions, our approach allows collecting more contextual factors and a wider range of possible responses than prior approaches do.
Footnotes
Acknowledgements
The authors contributed equally to the project, author order is alphabetical. The authors are grateful to the two anonymous reviewers for their helpful comments and suggestions. The project benefited greatly from Richard Herndon’s and Devon Moore’s extensive assistance with system development and data collection. The authors also thank Scott Cambo, Karina Sirota, Dan Russell, Eden Litt, Jordana Graifman, and Alessandra Gabaglio for their input on various aspects of the project.
Funding
The authors disclosed receipt of the following financial support for the research, authorship, and/ or publication of this article: The authors appreciate the generous support of a Google Research Award that helped make this project possible.
