
Abstract
Mobile online platform data are inherently dynamic and often ephemeral: content can be deleted, added, or edited over time. Because mobile communication research relies heavily on such platform-derived data, systematic (non-random) changes can create serious data-quality and reproducibility problems. To address this, we developed Datcha, an application that quantifies dataset consistency using standardized indicators. Datcha additionally supports comparative analyses—word frequency comparisons, keyness, topic modeling, and sentiment analysis—between modified and remaining content, enabling researchers to detect whether content deletion, addition, or editing follows systematic patterns.
Problem and Purpose
Online platform data are a major source for mobile media research, yet they are inherently dynamic and often ephemeral (Yılmaz et al., 2021). Users delete and edit their posts (Jacobsen, 2022; Ringel & Davidson, 2022), and platforms moderate content for such reasons as hate speech, terms-of-service violations, or copyright infringement (Mekacher et al., 2023; Srinivasan et al., 2019). When changes to mobile platform data are systematic rather than random, they can introduce serious data quality issues and undermine reproducibility (Salvatore et al., 2021). Conclusions drawn from a single one-time collection may be highly time-sensitive if the underlying corpus changes substantially. Researchers should, therefore, track changes over time, measure dataset consistency, and evaluate potential systematic biases. To support this, we developed Datcha (abbreviation for “data change”), an R Shiny application that quantifies consistency using standardized metrics and provides comparative analyses—word frequency, keyness, topic modeling, and sentiment analysis—between modified and retained content, enabling the detection of systematic patterns in removal, addition, and editing. Datcha increases transparency about the ephemeral nature of online platform data by enabling better documentation of data quality. It also raises awareness of deleted content and heightens Datcha users’ sensitivity to the associated ethical challenges.
While Datcha was originally developed to analyze the consistency and ephemerality of textual data on online platforms (particularly posts), its functionality allows virtually any type of text data to be processed, provided there is a stable identifier for matching purposes. For example, it could be used to investigate changes in open-ended survey responses within panel studies as well. However, for non-online platform use cases, the meaningfulness of the results depends strongly on the specific context.
The Datcha Tool with the Example of Ephemeral Mastodon Data
The core use case of Datcha requires first collecting the same mobile platform data (posts) with the same query at two different points in time. The tool itself then systematically analyzes and compares these datasets. It accepts two CSV files; the only requirement is that each file includes a stable post ID (column names can be entered individually) and a text field (column name: text) (see Figure 1). Apart from these two requirements (an ID column and a text column), the CSV file has no additional constraints (e.g., both commas and semicolons are accepted as delimiters), allowing the tool to be used widely across a variety of platforms. For data uploads, Datcha users must also confirm that the datasets comply with the General Data Protection Regulation (GDPR); this may include anonymization and data minimization. Datcha users enter the collection date for dataset 1 and dataset 2 and click “Compare datasets.” Based on ID matching across the two files, a dataset overview appears on the start page that reports the number of posts in dataset 1 and dataset 2, as well as the counts of deleted, added, and edited posts.

Datcha starting page with example Mastodon data.
From the top menu, you can open dedicated tabs for each type of change. In the data deletion tab, Datcha reports indicators of consistency and data loss, the mean daily number of removed posts, and the daily removal rate. You can then compare removed versus remaining posts using word-frequency distributions, keyness analysis, topic modeling, and sentiment analysis. The “Data Addition” tab mirrors these metrics and analyses, allowing added posts to be compared against the original corpus. In the “Data Editing” tab, the metrics reflect editing behavior: Datcha reports the editing ratio, mean daily edits, the daily editing rate, and the (normalized) mean edit distance (Levenshtein distance) between original and edited text. Rather than running topic or sentiment analyses, this tab presents a side-by-side data table of original and edited posts, with all textual changes highlighted for inspection.
As an illustrative case, we collected Mastodon data from the hashtag “#protest” between February 1 and February 24 2026 using the Rtoot package. Mastodon data constitute a relevant use case for mobile communication research, as evidenced by the inclusion of Rtoot in the mobile communication resources section of Mobile Media & Communication. In addition, protests are currently highly mediatized through mobile media use. The dataset was initially collected on February 24 2026 and subsequently recollected on March 24 2026 using the identical query. Prior to upload, all columns except for the necessary ID and text or content fields were removed in accordance with data minimization principles. Furthermore, toot IDs were pseudonymized via hashing, resulting in the creation of a “new_id” column that is not part of the default Datcha structure.
Figure 1 presents the Datcha start page. On the right-hand side, the dataset overview is displayed. With 65 deleted toots, 1 added toot, and 4 edited toots, the protest-related Mastodon dataset is predominantly affected by deletions. Therefore, we examine the data deletion page in greater detail (Figure 2). In this case, we observe a high level of consistency in terms of deletion, amounting to 95.2%, with a corresponding data loss of 4.8%. This equates to an average removal of 2.3 posts per day and a daily removal rate of 0.17%. Despite the high consistency, it remains important to assess whether substantial differences exist between removed and retained textual data. Our analysis reveals no significant differences, for instance in word frequency distributions. Figure 2 also presents the sentiment analysis, which indicates similar distributions of positive, negative, and neutral content. Both subsets contain a higher proportion of negative content; however, the removed content is slightly more negative overall.
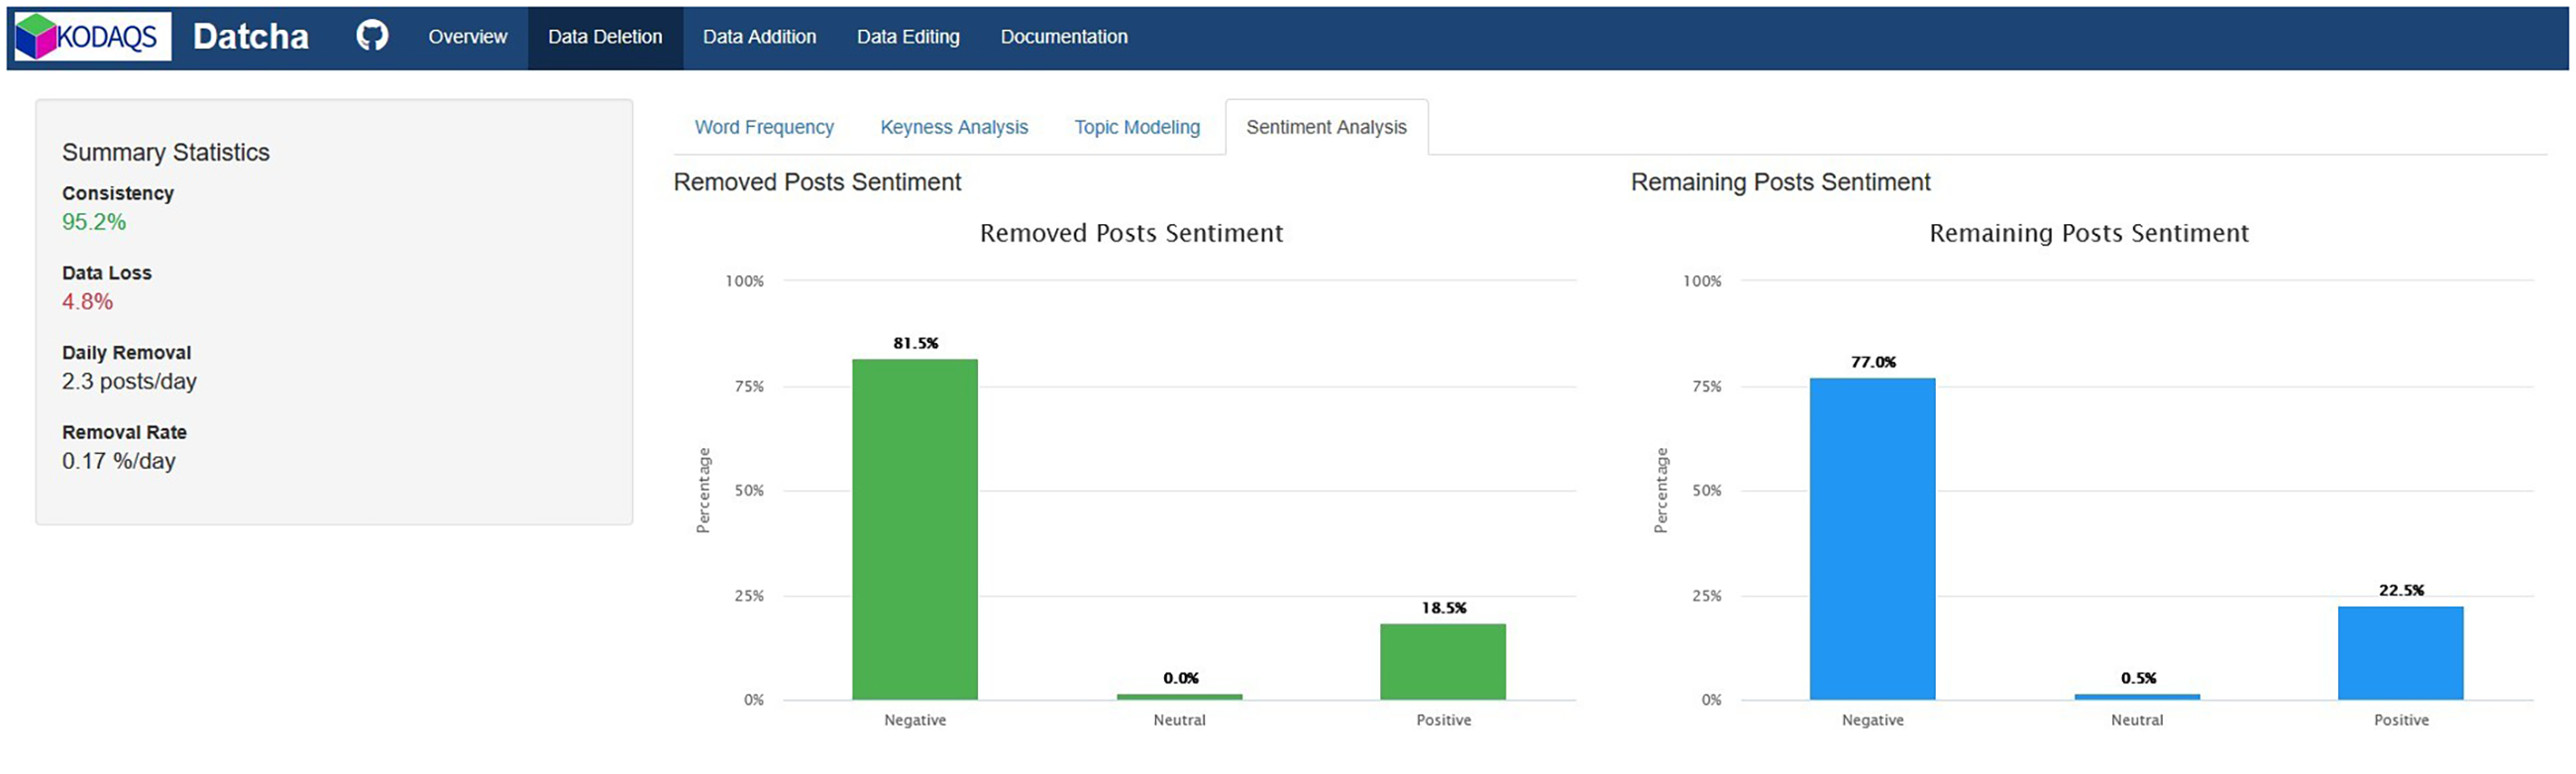
Datcha data deletion page and sentiment analysis tab.
In terms of data quality, our comparison suggests a relatively high level of consistency over the 1-month interval. However, assuming a constant daily removal rate of 2.3 posts, the projected data loss after 1 year would amount to 61.77%, corresponding to approximately 840 toots. In this respect, regular consistency checks still remain essential for this use case.
Relevance for Mobile Communication Research
Datcha makes two significant contributions to mobile communication research: (a) methodological and (b) substantive.
Methodologically, Datcha addresses the centrality of online platform data in the field (Humphreys, 2013) and complements the ecosystem of application programming interface (API)-based collection tools documented in Mobile Media & Communication's Mobile Research Resources section. Notable examples include Rtoot for Mastodon (Schoch & Chan, 2023), WhatsApp Explorer for WhatsApp (Garimella & Chauchard, 2025), Spotivey for Spotify (Radke et al., 2024), and Frog Scraper for Telegram (Primig & Fröschl, 2024), which illustrate how researchers can access and curate platform data via platform APIs or data donations. Datcha extends this toolkit by assessing its data quality, providing standardized indicators to quantify dataset consistency across repeated harvests and supporting transparent provenance and reproducibility reporting. With its focus on data changes and, especially, deletions, Datcha systematically tracks the ephemerality of mobile platform data. Welsh (2020) has conceptualized ephemerality in mobile media as an ethical design principle, interrogating why mobile platforms are built to facilitate nonretention and deletion. She argues that ephemerality functions as data prevention, aligning with such values as data protection, trust, and transparency. While Datcha does not audit the algorithmic design of mobile apps, it operationalizes ephemerality at the data level and enables researchers to analyze ephemeral content. This can increase transparency through better data quality documentation and strengthen data protection by making GDPR compliance obligatory. In addition, it increases the ethical awareness of Datcha users regarding deleted content.
Access and Reuse
The tool is an R Shiny app that runs on a server: https://shiny.gesis.org/datcha/
The tool's code is available in the corresponding Git repository: https://github.com/ECCdigital/gesis-datcha
In the future, a Datcha tutorial will be published as part of the Competence Center Data Quality in the Social Sciences (KODAQS) toolbox (Peters et al., 2026).
Limitations and Future Use
In general, Datcha is broadly applicable across platforms because it requires only a stable (hashed) post ID and a text field as input, making it useful for many text-based platform datasets. However, several limitations apply. At present, the tool is primarily focused on posts and textual data; future extensions could include tracking changes in numerical engagement metrics, such as “like” counts. Because some analyses are computationally intensive, Datcha is particularly suitable for small- to medium-sized datasets. Although the upload limit is 5 GB, certain analysis modules are constrained for performance reasons. For example, the topic modeling function is limited to approximately 15,000 posts to keep processing time reasonable and preserve usability. If the data size exceeds the working memory, there will be a disconnection from the server—particularly when the text volume is high. Because of this, the Datcha tutorial in the KODAQS Toolbox mentioned earlier will, first and foremost, provide the actual code required to compute all relevant indicators and run the different analyses. This means that, should users encounter these issues with the Shiny app, they will still be able to run the Datcha analyses locally in R. Of course, users can also contact the authors for further assistance. The tool will be regularly updated to reduce these limitations.
Footnotes
Funding
The author(s) disclosed receipt of the following financial support for the research, authorship, and/or publication of this article: The research was conducted within KODAQS, a competence center for data quality in the social sciences, and the Ephemera project at GESIS - Leibniz Institute for the Social Sciences. KODAQS is funded by the Federal Ministry of Research, Technology and Space (BMFTR) and the NextGenerationEU. The Ephemera project is funded by the Leibniz foundation.
Declaration of Conflicting Interests
The author(s) declared no potential conflicts of interest with respect to the research, authorship, and/or publication of this article.
Data Availability Statement
Owing to the data sensitivity and GDPR requirements, we cannot share the used Mastodon data publicly.