
Abstract
Background:
Chronic alcohol use is a global health concern with adverse effects on immune function, potentially altering the T-helper (Th)1/Th2 axis. This study modelled chronic alcohol consumption using Sprague–Dawley (SD) rats to determine whether chronic alcohol consumption during adolescence skews Th1/Th2 cytokine release.
Methods:
A two-bottle choice rat model was used for voluntary adolescent alcohol intake. Twenty (n = 20) male SD rats aged 25 days were randomised into alcohol (20% w/v) and control groups (n = 10/group) for 30 days. Blood was collected at termination via cardiac puncture. Th1/Th2 cytokines were analysed using the Rat LEGENDplex™ Panel (9-plex) kit and BD Accuri™ C6 flow cytometer. An unpaired two-tailed student’s t-test compared the cytokine level between the groups.
Results:
White blood cell and lymphocyte counts were elevated in the alcohol group, while platelet counts decreased (p < 0.05). Interleukin (IL)-2 (p = 0.0390) and interferon-γ (p = 0.0292) were lower in the alcohol group. Similarly, IL-5 (p = 0.0189), IL-6 (p = 0.0284) and IL-10 (p = 0.0117) levels decreased.
Conclusion:
Chronic voluntary alcohol consumption during adolescence does not skew the immune response towards Th1 or Th2 cytokine release. Instead, it is associated with an overall decrease in the levels of Th1/Th2 cytokines, thus suggesting the immune-suppressive effect of alcohol.
Introduction
Alcohol consumption is a global concern that affects many people’s health. Approximately 2.3 billion people worldwide consume alcohol, which is responsible for causing more than 5% of the global disease burden. 1 Notably, a significant portion of alcohol consumers are adolescents. This is congruent with the current increased trend in alcohol consumption amongst school-going adolescents, particularly in low- to middle-income countries. 2 In the sub-Saharan Africa, the prevalence of alcohol consumption amongst adolescents is estimated to be at 32.77%, 3 and it is even higher in South Africa at 44%. 4 The consumption of alcohol during this important developmental stage may have significant impact on the immune function.
Alcohol is an immune modulator, and its chronic consumption has the potential to affect both the innate and adaptive immune responses. With regards to the latter immunity, alcohol consumption may alter T-cell function by disrupting the T-helper (Th)1 and Th2 balance, leading to immune dysregulation which is associated with the pathogenesis of various diseases. 5 Th1 and Th2 cells are characterised by their distinct cytokine secretion profiles and immune functions. Th1 cells primarily produce cytokines such as interferon-gamma (IFN-γ), interleukin (IL)-2, tumour necrosis factor (TNF)-α and granulocyte-macrophage colony-stimulating factor (GM-CSF).6,7 In contrast, Th2 cells are defined by their secretion of IL-4, IL-5, IL-10 and IL-13. 7 With respect to functions, Th1 cytokines regulate cell-mediated immunity, while Th2 cytokines play a significant role in modulating humoral responses. 8 The exact effects of chronic alcohol consumption on Th1/Th2 balance remain contradictory in both humans and animal models. Some studies indicate that ethanol enhances Th1 responses whilst suppressing Th2-mediated immunity.9,10 Conversely, others suggest that chronic alcohol consumption suppresses Th1 responses, shifting the immune system towards a Th2-dominant state.8,11
Nonetheless, chronic alcohol consumption appears to skews the Th1/Th2 balance, and it seems that the direction of the dysregulation is dependent on the amount and duration of consumption, as well as route of administration and dosage in the case of animal models. 12 In this study, we utilised a modified rat model of chronic alcohol consumption during adolescence to determine the direction of the Th1/Th2 cytokine release imbalance. Most importantly, to closely mimic human behaviour, the consumption of alcohol was voluntary and the route of administration was oral.
Materials and methods
Animal handling
Twenty (n = 20) Sprague–Dawley (SD) adolescent male rats aged 25 days were sourced from the Wits Research Animal Facility. The rodents were housed in pairs (littermates) for socialisation in polycarbon cages, with food and water available ad libitum. The cages were maintained under a 12-h dark/light cycle (lights off at 19h00–07h00), with constant ambient room temperature of 26 ± 2°C at all times. The study protocol was approved by the University of the Witwatersrand Animal Research Ethics Committee (AREC), protocol number: (AREC23-03-012). This study was conducted and reported in accordance with the ARRIVE guidelines. 13
Study design
The minimum sample size was estimated using G*power software version 3.1.9.7 14 based on the primary outcome (IFN-γ/IL-10 ratio) reported in a previous study. 15 The following assumptions were made: an effect size (d) of 1.96, an alpha value (αerr prob) of 0.05, a group allocation ratio 1:1 and the power of the study (1-βerr prob) was set at 0.95. A minimum sample of 8/group was required; hence 20 SD rats were included (10/group). The study utilised a modified two-bottle choice model of chronic voluntary alcohol intake. 16 Briefly, the SD rats were placed into cages and allowed to acclimatise for a period of 7 days. On day 1, the 20 SD rats were randomised into two groups, viz alcohol and control groups (n = 10/groups) which both received normal rat chow (Nutritionhub, Stellenbosch, South Africa). The control group received two bottles of water, one containing pure water and one with added saccharin (0.06%).
The intervention group received sweetened alcohol and a bottle of pure water. In order to encourage voluntary consumption, the rodents were exposed to a gradual increase in alcohol concentration from 3% to 10% w/v ethanol sweetened with 0.06% saccharin for a period of 13 days. Thereafter, the ethanol concentration was increased to 20% w/v, while the saccharin concentration remained at 0.06%, and this regimen was maintained until the end of the experiment (Figure 1). On termination day (Day 33), the animals were first anaesthetised using 2% to 3% isoflurane delivered in 100% O2 by mask inhalation. A total of 8 mL of blood was collected from the left ventricle via cardiac puncture using a 10 mL syringe with a 20-gauge needle and transferred into serum separator tubes (SST) for cytokine profiling and the Ethylenediaminetetraacetic acid (EDTA) for analysing haematological profiles (BD; San Jose, USA). Thereafter, the rats were immediately euthanised aged 65 days old by cardiac excision while fully anaesthetised. Serum acetate levels were measured using the Acetate Assay colorimetric Kit (Abcam, Cambridge, UK) as an alcohol metabolite. 17
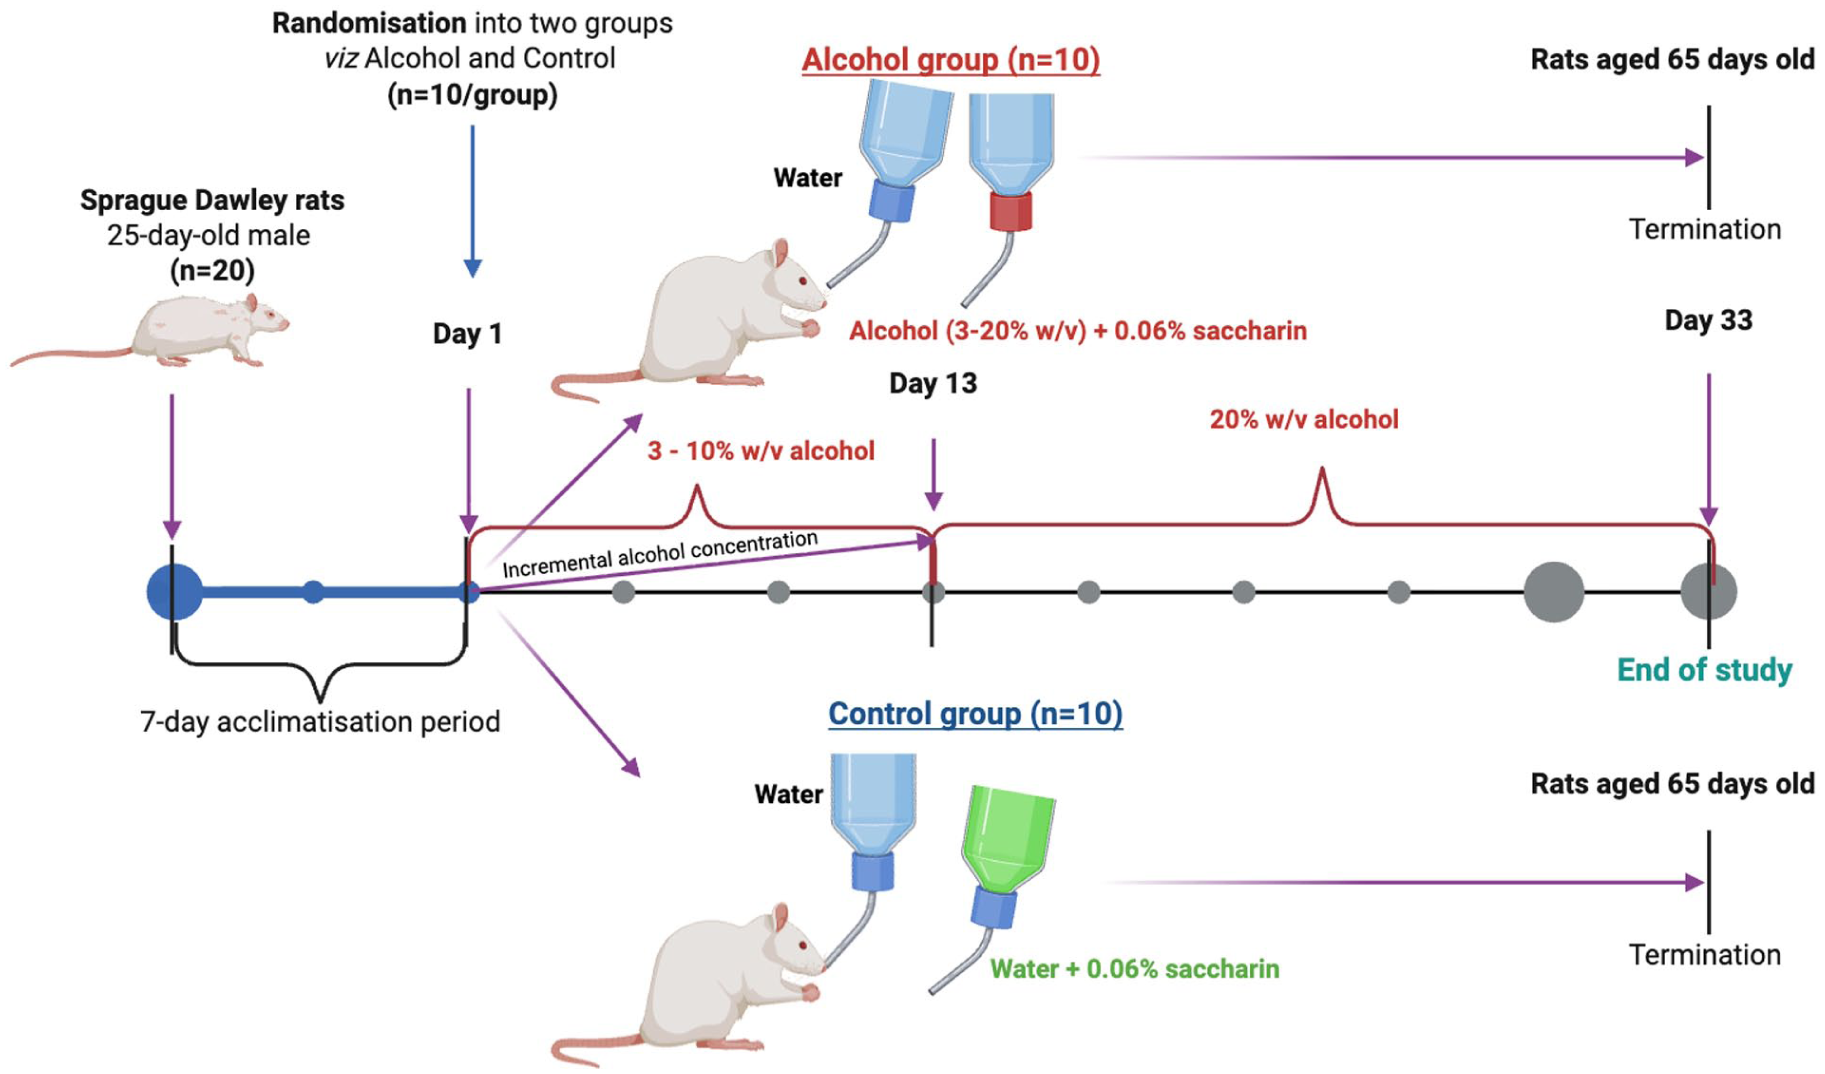
A modified two-bottle choice model of chronic voluntary alcohol intake. Briefly, a total of 20 adolescent Sprague–Dawley male rats aged 25 days were included and allowed to acclimatise for a period of 7 days. Thereafter, rodents were randomised into two groups, viz alcohol (incremental concentration of 3% to 10% w/v for 13 days and then 20% w/v for 20 days) and control (n = 10/group). The rodents received their normal chow and respective bottles over a 33-day period. Thereafter, they were anaesthetised, and blood was collected for analysis.
The volume of fluids consumed was recorded and measured daily to determine the overall weekly total water and alcohol intake. Ghost bottles were used to determine the actual fluid intake by correcting for leakage and evaporation in this modified two-bottle choice model of chronic voluntary alcohol intake. Briefly, ghost bottles containing similar volumes of the fluids offered to the study rats were placed into empty cages. The total volume of the fluid losses from the ghost bottles was subtracted from the fluid measurements differences recorded in the cages containing rats in the alcohol and control group, thus controlling for the ghost drinking. Random blood glucose measurements were done on day 33. Briefly, the tail of the rat was pricked with a hypodermic needle, and a drop of blood was transferred onto a blood glucose strip inserted in a glucometer (Contour Plus meter, Bayer HealthCare, Basel, Switzerland), and the reading was recorded. Body weights were measured by placing the rats in a pre-weighed container on a digital measuring scale (Clover Scales, Randburg, South Africa).
Measurement of haematological indices and Th1/Th2 cytokines
Complete blood counts were determined using the Beckman Coulter DxH 520 automated haematology analyser (Beckman Coulter, California, USA). The Rat Th1/Th2 LEGENDplex™ Panel (9-plex) kit (BioLegends CA, USA) was used to determine the levels of a total nine cytokines using the BD Accuri C6 flow cytometer (BD Biosciences, San Diego, USA), following the manufacturer’s instructions.
Statistical analysis
The Shapiro–Wilk test was performed to test for normality. For normally distributed data, the mean differences between the alcohol and control groups were assessed using a two-tailed unpaired student’s t-test and are reported as mean ± standard deviation. In cases of unequal variance, the Welch’s test was applied. The Mann–Whitney U test was used for skewed data, and the results are presented as median and interquartile range (IQR). Comparisons across the groups were assessed using a two-way analysis of variance (ANOVA). A posthoc Tukey’s multiple comparisons test was performed when the F-value reached statistical significance (p < 0.05). A p-value of <0.05 was considered significant. All statistical analyses were performed using GraphPad Prism version 8 software version 8.0.2 (GraphPad Software Inc, CA, USA) and the Review Manager (RevMan V.5.3) software.
Results
Alcohol consumption, changes in body weights and glucose control
As expected, the serum acetate levels were higher in the alcohol group (0.31 ± 0.03 nmol/uL) when compared to the control group (0.28 ± 0.03 nmol/uL), p = 0.0329. The volume of fluids consumed was recorded and measured daily to determine the total water and alcohol intake over 7-day periods (Figure 2(a)). The fluid intake significantly differed across the group (F (3, 15) = 181.9, p < 0.0001). The posthoc analysis of total volume consumed showed that the rats in the control group consumed a higher total volume of sweetened water (1439 ± 46.44 mL) when compared to total pure water (851.4 ± 114.5 mL), p < 0.0001. Moreover, the rats in the alcohol group consumed more total amount of pure water (1299 ± 109.6 mL) than the sweetened alcohol (370.2 ± 72.19 mL), p < 0.0001. Notably, the total volume of pure water consumed in the control and alcohol groups differed significantly (p < 0.0001). Assessment of body weights showed that the rats gradually gained through the 30-day period in both groups (Figure 2(b)), with the control group gaining 428% and the control group gaining 434%. The weight area under curve were comparable between the control (1130 ± 109.5 g × days) and alcohol group (1098 ± 115.5 g × days), p = 0.5240. Random glucose levels were comparable between the alcohol (5.16 ± 0.55 mmol/l) and control (4.94 ± 0.40 mmol/l) groups, p = 0.3224 (Table 1).

Fluid intake and body weight changes over a 33-day experimental period. Figure (a) shows a comparison of weekly fluid intake of pure and sweet water in the control (Ctrl) group (n = 10), and sweet alcohol and pure water in the alcohol (Alc) group (n = 10). Figure (b) illustrates a comparable weight gain (n = 10 per group) over the 33-day experimental period, with the lower percentage weight gain in the alcohol group.
Comparison of fluid intake, body weight and complete blood count.

MCHC: Mean corpuscular haemoglobin concentration. Results are presented as mean ± standard deviation or median [interquartial range]. Significant results (p<0.05) are indicated in bold.
Haematological indices
On termination, analysis of the complete blood count showed elevated white cell count (WCC) in the alcohol group (6.91 ± 1.86 × 10³/μL) when compared to the control group (5.05 ± 1.49 × 10³/μL), p = 0.0243 (Table 1). The absolute counts showed elevated lymphocytes (p = 0.0296) and monocytes (p = 0.0007) in the alcohol group in comparison to the control group (Table 1). Neutrophil, eosinophil and basophil counts were comparable between the groups (p > 0.05). Red cell counts and its associated indices were comparable between groups (p >0.05) (Table 1). However, platelet counts were lower in the alcohol group (477.9 ± 39.43 × 10³/μL) when compared to the control group (519.9 ± 28.67 × 10³/μL), p = 0.0140 (Table 1).
Acute phase reactants and Th1/Th2 cytokine release are reduced in alcohol consumption
In order to determine the inflammatory state in chronic alcohol consumption, acute phase reactants were measured. Notably, the levels of IL-6 were lower in the alcohol group (524.2 ± 72.88 pg/mL) when compared to controls (623.4 ± 107.7 pg/mL), p = 0.0284. However, the TNF-α levels were comparable between the alcohol (9.95 ± 3.18 pg/mL) and control (12.05 ± 3.11 pg/mL) groups, p = 0.1524. Assessment of Th1 cytokines showed that the levels of IL-2 were lower in the alcohol group (5.16 ± 1.49 pg/mL) when compared to the controls (7.90 ± 3.19 pg/mL), p = 0.0292 (Figure 3(a)). Similarly, IFN-γ levels were lower in the alcohol group (6.62 ± 1.02 pg/mL) in comparison to the controls (7.60 ± 0.95 pg/mL), p = 0.0390 (Figure 3(b)). However, GM-CSF levels were similar in the alcohol (509.6 ± 41.93 pg/mL) and control (525.3 ± 132.1 pg/mL) groups, p = 0.7279 (Figure 3(c)). Regarding Th2 cytokines, the levels of IL-5 were reduced in the alcohol group (6.35 ± 2.05 pg/mL) when compared to the control group (8.44 ± 1.54 pg/mL), p = 0.0189 (Figure 3(e)). IL-10 levels were reduced in the alcohol group (7.67 ± 3.17 pg/mL) in comparison to the controls (11.99 ± 3.70 pg/mL), p = 0.0117 (Figure 3(f)). However, there was no difference in the levels of IL-4 between the alcohol group (7.13 ± 1.18 pg/mL) and the controls (7.94 ± 1.47 pg/mL), p = 0.1906 (Figure 3(d)). The levels of IL-13 were also comparable between alcohol (8.12 [5.73–8.46] pg/mL) and control (10.17 [7.43–12.78] pg/mL) groups, p = 0.1712 (Figure 3(g)).

The effect of voluntary chronic alcohol consumption on the Th1/Th2 cytokine levels. Decreased levels of Th1 cytokines, interleukin (IL)-2 (a) and interferon (IFN)-γ (b), as well as Th2 cytokines; IL-5 (e) and IL-10 (f), were observed in the alcohol group compared to the controls. Granulocyte-macrophage colony-stimulating factor (GM-CSF) (c), IL-4 (d), and IL-13 (g), were comparable between the groups (p >0.05). All results are presented as mean ± standard deviation except for IL-13, which is reported as median, interquartile range.
In order to determine whether adolescent exposure to chronic alcohol consumption skews the immune system towards Th1 or Th2- weighted response, we plotted a forest plot, and the results showed that at termination, both Th1 and Th2 cytokine levels are reduced in the alcohol group when compared to the controls. Most importantly, the overall pooled estimate (SMD = −0.81, 95% CI: [−1.16, −0.46], p < 0.0001) showed a significant reduction in Th1/Th2 cytokine levels in the alcohol group (Figure 4), thus supporting the notion that chronic alcohol consumption leads to immune suppression, without a clear shift towards Th1 or Th2 polarisation in this case.
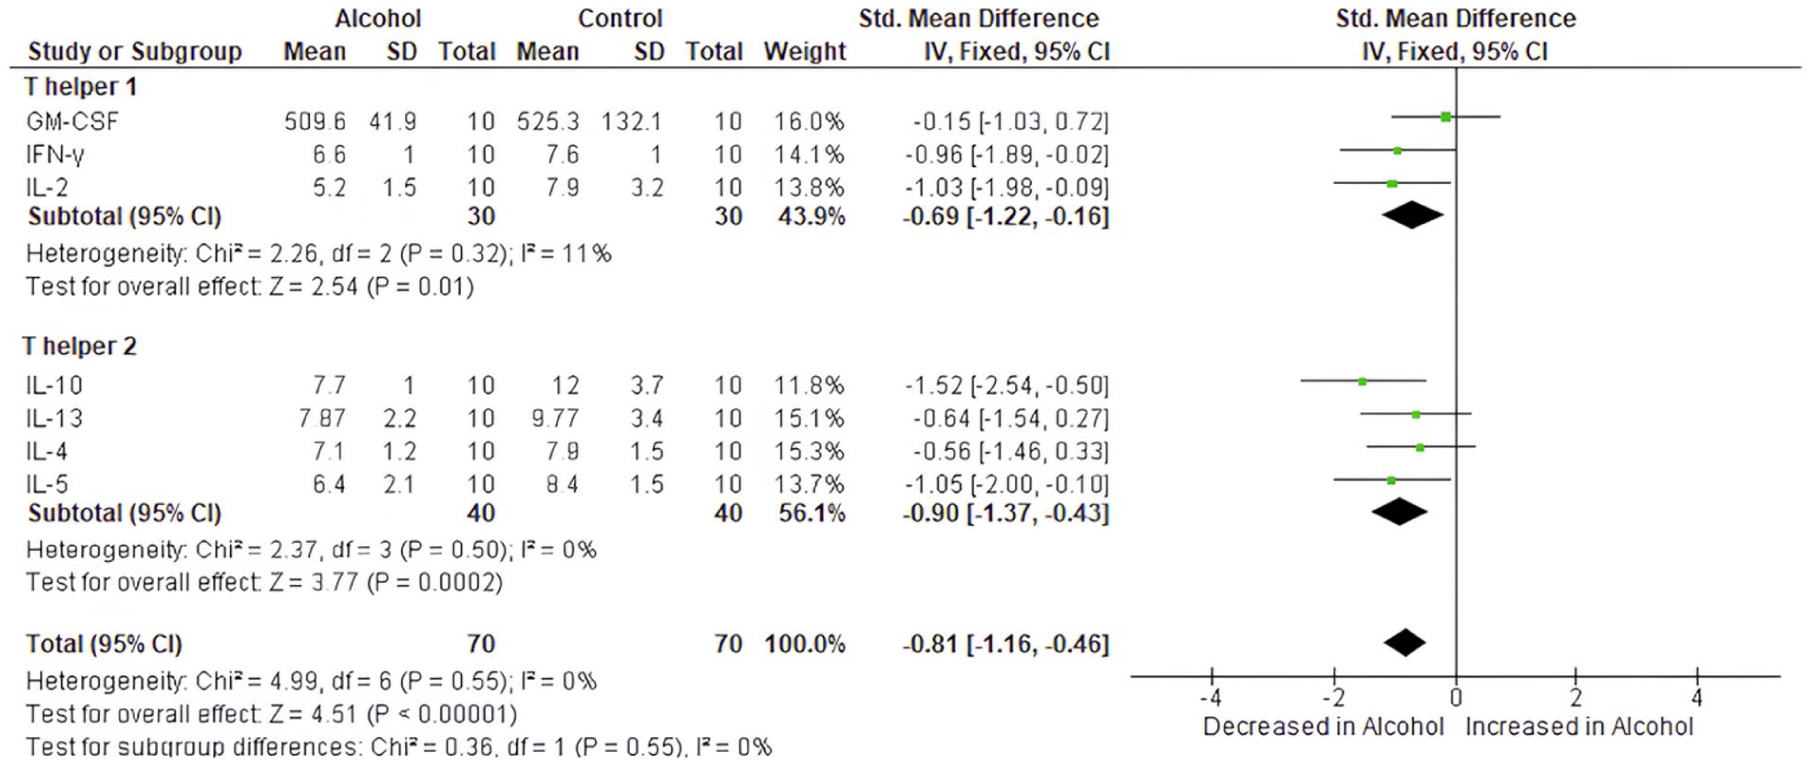
Forest plot illustrating the effect of chronic alcohol consumption on the Th1/Th2 cytokine release axis. Standardised mean differences (SMD) with 95% confidence intervals (CI) were calculated using a fixed-effects model to compare the groups. The overall negative pooled SMD indicates decreased Th1 (GM-CSF, IFN-γ, IL-2) and Th2 (IL-10, IL-4, IL-5) cytokine levels in the alcohol group relative to controls.
Discussion
The study aimed at investigating the impact of chronic alcohol intake during adolescence on the levels of Th1/Th2 cytokines using a rat model of chronic voluntary alcohol consumption. Notably, chronic voluntary alcohol consumption was associated with a reduction in the level of IL-6 (acute phase reactant), despite the increase in white cell and lymphocyte counts. This was also concomitant with an overall decrease in the levels of both Th1 (IL-2, IFN-γ) and Th2 (IL-5 and IL-10) cytokines, thus suggesting the immune-suppressive effect of alcohol without skewing the immune response towards Th1 nor Th2 subset. The percentage weight gain over the experimental period and random glucose levels were comparable between the two groups. Several human studies18–21 demonstrate that chronic alcohol use alters immune function and cytokine profiles, including that of T-cells, thus supporting the clinical relevance of immune dysregulation observed in our rat model.
The consumption of alcohol can have a deleterious impact on fat and glucose cell metabolism, particularly slowing it down, which is associated with increased weight gain and altered glucose control, 22 which are classical risk factors for cardiovascular disease. In this study, we report no differences in percentage weight gain nor area under curve. These findings are consistent with those of previous systematic reviews and a meta-analysis involving humans, that reported comparable glucose levels and insulin sensitivity between individuals that consumed alcohol (10–70 g/day) and controls 23 as well as no positive association between alcohol and weight gain. 24 Our findings seem to suggest that chronic alcohol consumption does not impair glucose metabolism unlike its acute consumption counterpart, as reported elsewhere.25,26 The similar glucose profiles between the groups may also have influenced the comparable weight gains over the 30-day experiment period.
The haematological complications of alcoholism have long been elucidated, 27 particularly its general adverse effects on haemopoiesis and the function of blood cells. In this study, complete blood counts were run to determine the effects of voluntary alcohol consumption on peripheral blood parameters. Chronic alcohol consumption is a major cause of macrocytosis that is independent of liver disease; hence, it is considered a useful biomarker for detecting chronic alcohol use even in the absence of anaemia. 27 Macrocytosis is characterised by increased mean cell volume (MCV). 28 In this study however, we report comparable red cell counts and its associated indices, including MCV. This discrepancy may be attributed to the alcohol dose-dependent effects 27 ; that is, the volume of the voluntarily consumed alcohol may not have been high enough to induce notable changes as it is in the case of heavy drinkers. 29 In fact, the rats alcohol consumption ranged from 2.4 to 3.9 g/kg/day which is equivalent to 0.4–0.6 g/kg/day in humans based on a conversion factor of 6.2. 30 This drinking pattern is moderate alcohol consumption in humans as it is less than 0.8 g/kg/day. Thus, the rodents in the alcohol group voluntarily followed a moderate alcohol consumption pattern.
Platelets play a huge role in primary haemostasis, and they interact with immune cells including T-cells to resolve inflammation. Current evidence suggests that alcohol consumption is associated with decreased platelet activity which offers cardioprotective effects, albeit not to the magnitude of blood thinners such as aspirin. 31 However, it is important to note that the suggested cardioprotective effect has potential to turn into overt alcohol-induced thrombocytopenia, 32 which is closely associated with an increased risk of bleeding. Herein, we report reduced platelet count in the alcohol group in comparison to the control group. Another important parameter in the complete blood count is WCC, which when elevated (leucocytosis), is associated with increased immune activation, and its reduction (leukopaenia) is linked to immune suppression. 33 In this study, chronic alcohol consumption was associated with elevated WCC caused by high monocyte and lymphocyte counts as per the absolute counts reported. The increase thereof of these indices seem to suggest increased immune activation in chronic alcohol consumption. However, these findings contradict the overall reduction in the Th1/Th2 cytokine release. Thus, suggesting that the increase in WCC may be due to increased proliferation of anti-inflammatory monocytes and other lymphocyte subsets.
A balanced Th1/Th2 cytokine release is imperative in maintaining immune homeostasis and modulating an effective immune response. An imbalance where either pro-inflammatory Th1 or anti-inflammatory Th2 cytokine release is exaggerated, can contribute to the pathogenesis of various metabolic diseases. 34 Likewise, the suppression of Th1/Th2 cytokine release may cause immune suppression which increases the risk of infection. 35 IL-2 and IFN-γ are secreted by Th1 subset, and they are responsible for T-cell proliferation and expansion as well as initiating key signals essential to enhance the cytotoxic activity of T-cells and favouring a Th1-dominated immune response.36,37 The increase in both these cytokines is therefore associated with an enhanced pro-inflammatory immune response, which is potent enough to mount an effective T-cell mediated defence against infection. Conversely, IL-5 and IL-10 cytokines are secreted by the anti-inflammatory Th2 subset, and they collectively inhibit excessive immune responses. IL-5 contributes to Th2 polarisation and promotes for the growth and differentiation of B-cells, thus augmenting humoral responses. 38 On the other hand, IL-10 is a potent anti-inflammatory cytokine that supresses the activities of IL-2 and IFN-γ,39,40 as well as the activation of antigen-presenting cells required for successful T-cell activation. 41 Therefore, an abnormal reduction in both IL-5 and IL-10 suggests loss of immune regulatory function mediated by Th2, which may result in exacerbated and chronic inflammation, a pathological features that are associated with immune dysfunction. 42 Herein, we report reduced Th1/Th2 cytokine release (IL-2, IFN-γ, IL-5 and IL-10) in voluntary chronic alcohol consumption. Notably, these findings are consistent with a previous report 15 and suggest immune suppression of T-cells without skewing towards Th1 or Th2 responses. It remains to be clarified whether this suppression reflects a reduced number of T-cells or a functional impairment of the existing cells. Moreover, mechanistic studies are required to investigate the exact causation of suppressed Th1/Th2 cytokine release following chronic alcohol consumption, which may involve impaired T-cell activation pathways, hormonal changes during adolescence and the immunomodulatory effects of alcohol metabolites.
The exclusive use of male rats, aimed at minimising the biological variability associated with hormonal fluctuations across the oestrous cycle that are known to influence immune responses and cytokine profiles, represents a limitation of the present study. Future studies should include females to determine whether sex-specific immune responses modify alcohol-induced Th1/Th2 dysregulation. The study has a number of strengths. Although some studies have investigated the impact of chronic alcohol consumption on Th1/Th2 responses,8,11 this study’s uniqueness is in its study design, particularly the voluntary alcohol intake aspect which mimics human behaviour. In addition, the study included rodents in adolescence stage which was crucial in elucidating the immune modulatory effects of alcohol during this crucial stage of human development. The findings also highlight the untoward immune effects mediated by Th1/Th2 imbalance that the adolescents consuming alcohol may suffer, particularly increased susceptibility to infections. Lastly, the study identified the exact Th1/Th2 cytokines (IL-2, IFN-γ/ IL-5, IL-10) to be therapeutically targeted, potentially through the exogenous administration of their recombinant forms to correct the imbalance. However, caution should be taken when interpreting these findings as substantial evidence indicates that rat strains differ in their physiological and immunological responses to alcohol, even at comparable blood alcohol levels.
Conclusion
Chronic voluntary alcohol consumption during adolescence neither skews the immune response towards Th1 nor Th2 cytokine release. Instead, it leads to an overall reduction in the levels of both Th1 and Th2 cytokines. This suggests that alcohol exerts a broad immunosuppressive effect rather than altering the balance between pro- and anti-inflammatory pathways in T-cells. The resultant suppression of Th1/Th2 cytokines may compromise the body’s ability to mount an effective immune response, potentially increasing susceptibility to infections. These findings highlight the need for further research into the long-term consequences of adolescent alcohol consumption on immune system development and function.
Footnotes
Ethical considerations
The study was approved by the University of The Witwatersrand Animal Research Ethics Committee (AREC), protocol number: (AREC23-03-012).
Author contributions
Funding
The authors disclosed receipt of the following financial support for the research, authorship and/or publication of this article: The study was partially funded by the University of The Witwatersrand Start-Up Research Grant 2024 awarded to TM Nyambuya.
Declaration of conflicting interests
The authors declared no potential conflicts of interest with respect to the research, authorship and/or publication of this article.