
Abstract
Background
Access to safe drinking water is essential for human health; however, water contamination remains a major concern in developing countries such as Ethiopia. Rapid urbanization and inadequate sanitation threaten water quality. This study evaluated the physicochemical and bacteriological quality of drinking water.
Objective
This study aimed to assess the physicochemical and bacteriological quality of drinking water in Debre Markos Town in 2024.
Methods
A cross-sectional study was conducted using 66 water samples collected from boreholes, disinfection points, water taps, and household storage containers through stratified simple random sampling. Sample collection and laboratory analysis were performed according to ES ISO 5667-1 (2001) guidelines.
Results
Among the physicochemical parameters assessed, temperature, pH, electrical conductivity, turbidity, nitrate, and fluoride levels generally met WHO standards, except for elevated temperatures (>15°C) at the source level. Free residual chlorine levels in source water, tap water, and household storage containers were below the recommended limits, whereas satisfactory levels were observed at the disinfection points. Bacteriological analysis revealed no detectable total or fecal coliforms at the disinfection points. However, total coliforms were detected in 22 (81.5%) tap water samples, 24 (88.9%) household water samples, and three borehole samples. In addition, fecal coliforms were detected in 3 (37.5%) borehole samples, 17 (63%) tap water samples, and 21 (77.8%) household water samples.
Conclusion and Recommendation
Although most physicochemical parameters met acceptable standards, water temperature, free residual chlorine, total coliforms, and fecal coliforms exceeded recommended limits in several samples. Strengthening source protection, ensuring effective disinfection, and maintaining regular water treatment are essential to improve drinking water quality in Debre Markos Town.
1. Introduction
The quality of water is essential for safeguarding human health and enhancing general well-being. Studies show that approximately 3.1% of global deaths (about 1.7 million) and 3.7% of global disability-adjusted life years (DALYs) (about 54.2 million) are caused by inadequate water, sanitation, and hygiene. 1 In Ethiopia, only 52% of the population can access safe water, highlighting challenges in the country’s water supply. 2 For this reason 60 - 80% of the population suffers from water borne and diseases associated with water. 3 Approximately 60% of the population relies on pit latrines. Most pit latrines are poorly constructed, inadequately maintained, and prone to frequent over flow. The majority households in the city dispose of waste water in nearby dry pits or septic tanks, but when these are lacking or inadequate, the waste often flows into open ditches and swamps, creating health and environmental risks. 4 Drinking water parameters such as temperature, pH, turbidity, and EC play important roles in the biological and chemical quality of drinking water. Temperature is a significant physical parameter in the assessment of drinking water quality. It is primarily related to appearance for drinking water. Generally, cool Water is more palatable compared to warm or cold water. 5
Water treatment efficiency for drinking purposes is temperature dependent to a large extent. In fact, the high temperature speeds up chemical reactions, thereby increasing the rate of pipe corrosion and scale formation. Moreover, turbidity and color might get indirectly affected. As per WHO guidelines, drinking water should be kept below the temperature of 15°C. 6 Low pH levels, on the other hand, contribute to more metal ions being released from pipes, while high pH levels make the disinfection process challenging and the exposure of microorganisms increases. 7 Turbidity is mainly due to the presence of solids that are in suspension, like clay, organic matter, bacteria, and algae, which come from the source water, poorly done filtration, or sediment that is being resuspended. The most important sources are soil erosion and construction, deforestation, mining, urban runoff, wastewater, and decaying matter. 8
Elevated turbidity is frequently associated with greater levels of pathogenic microorganisms such as viruses, parasites, and bacteria. 9 It may also result from the presence of inorganic particulate matter in some groundwaters or from the sloughing of biofilm within the distribution system. 10 For disinfection to be effective, turbidity must be kept as low as possible, preferably below 0.1 nephelometric turbidity unit (NTU). WHO states the guideline value as <5 NTU. 11
Electrical conductivity measures a water’s ability to carry current, reflecting the concentration, mobility, and charge of dissolved ions. Most inorganic substances ionize in water, contributing to its conductance. Determination of conductance in samples of drinking water provides a rapid and feasible assessment of variations regarding dissolved minerals. 12 Contaminated water can lead to severe health effects, including brain damage, death, 13 and other syndromes. 11 Studies on E. coli and enterococci,14,15 temperature effects, 16 pathogens, 14 biofilms,17,18 and chemical water-quality parameters have shown that household storage containers are often more contaminated than tap water. 19
A study in Ethiopia, showed that the mean turbidity, temperature, and EC value obtained were 0.98 NTU, 28.49°C and 192.14μs/cm respectively. Water sample obtained from the area were analyzed for total coliform bacteria, ranging from 1 to 4 per 100 ml, with a mean value of 0.78 colonies per 100 ml. 20 Although drinking water quality has been studied in Ethiopian towns, research in Debre Markos Town remains limited due to the lack of integrated physicochemical and bacteriological assessments, inadequate spatial coverage, neglect of household-level contamination, limited comparison with WHO and national standards, and outdated local data. This study therefore aims to assess drinking water quality from the source to the end user in Debre Markos Town to identify critical contamination points and support improved public health protection.
2. Materials and methods
2.1. Study area and period
This research was focused in Debre Markos Town, the main administrative town of East Gojjam Zone in the Amhara Region. Debre Markos is located about 299 km northwest of Addis Ababa. The elevation of the town is 2,446 m above sea level, and it has a woina Dega climate with a temperature range of 14°C to 25°C for mean annual temperatures and a yearly rainfall of 900 to 1,300 mm. The period of the study was from March to April, 2024.
2.2. Sample size determination
Water samples were collected from multiple points along the drinking water supply system in Debre Markos Town. A total of 66 samples were obtained from 8 boreholes (BHs), 4 disinfection points, 27 public taps, and 27 household (HH) storage containers.
The minimum sampling frequency for drinking water within the distribution system was determined based on the population served, in accordance with established drinking water monitoring guidelines. For populations ranging from 5,000 to 100,000, one sample per 5,000 population is recommended, whereas for populations exceeding 100,000, one sample per 10,000 population plus an additional 10 samples is required. 7
Number of populations served and selected samples of taps and HH containers at Debre Markos town, Ethiopia, 2024.

2.3. Sampling method
Water samples were collected from four distinct points: the source, disinfection sites, end-user taps, and household storage containers. A total of eight boreholes were included: BH1, BH6, BH10, and BH11 at Sentera; BH2, BH3, and BH4 at Wutirna; and BH5 at Aba Libanos. Four disinfection points were also included: DP1 at Sentera, DP2 at Yemeka, DP3 at Kidane Mehiret, and DP4 at Medihanialem.
In addition, 27 tap water samples and 27 household container samples were selected using a random sampling technique. Considering zones as strata, sampling locations (tap stands and household containers) were selected proportionally based on the population they serve. Data on the total number of taps and households were obtained from the Debre Markos Town water distribution system. Using a computer-generated random selection method, a total of 27 tap stands and 27 household containers were selected for sample collection.
2.4. Sample collection procedure
Water samples for physicochemical analysis were collected following the procedures outlined in ES ISO 5667-1 (2001) and ES ISO 5667-2(2001). Water samples for measuring temperature, pH, electrical conductivity, turbidity, and free chlorine residual were collected in clean 250 ml conical glass containers that had been thoroughly rinsed. A portion of water samples for nitrate and fluoride analysis was collected, preserved, and transported to Debre Markos university’s water quality laboratory unit in a 500 ml polypropylene container what had been cleaned with sample water. The container was completely filled with the sample after filtering it through 0.45 μm pore size filter paper, closed tightly, labeled, and transported to Debre Markos University’s water quality laboratory unit in an icebox.
Microbial test samples were collected between 6:00 and 8:30. Glass bottles of 250 ml capacity sterilized in the autoclave for a period of 15 minutes at 130°C with 0.2 ml of 10% sodium thiosulphate solution for chlorinated samples. All samples were collected after the taps were wiped with a cotton pad, opened, and allowed to run for 2 minutes. The taps were sterilized for 1 minute with the flame from ignited alcohol-soaked cotton and then allowed to run for 2 minutes. 9 The collected samples were transported to Debre Markos University’s water quality laboratory unit in an icebox for analysis.
2.5. Laboratory analysis procedures
2.5.1. Physicochemical analysis
The pH, temperature, turbidity, electrical conductivity (EC), and free chlorine residual (FCR) were measured onsite. In contrast, nitrate (NO3-) and fluoride (F-) analyses were conducted ex situ, away from the sampling location. Measurements of pH and temperature were carried out in accordance with ES ISO 10523 (2001), which was applied consistently to all samples.
A pH meter handled the measuring for both pH and temperature. So, from each source, we poured samples into a clean wide-mouth conical flask, rinsing it first with the sample water to make sure. Then the pH electrode and temperature probe went in, and we recorded the reading.
Turbidity was measured at each sampling point following the ES ISO 7027:2001 procedure, using a Wagtech turbidimeter. For each sample, 10 mL was placed in the provided measurement container, inserted into the turbidimeter, and the turbidity reading was recorded in NTU.
EC and FCR got analyzed in situ with the instrument’s conductivity meter. For EC, dipped the probe into the sample in a beaker and recorded in μs/cm. FCR measurement involved several steps: the test tube was rinsed with the sample, a few drops were left inside, a DPD No. 1 tablet was added and crushed, the tube was filled to 10 mL with the sample, and the mixture was stirred until the tablet dissolved. After that, set the photometer to 520 nm wavelength, read it right away the usual way, and record.
Nitrate (NO3-) analysis was conducted using the photometer method. The nitrate tube was filled with 20 mL of the sample, after which one level spoonful of nitrate powder and one nitrate tablet were added without crushing. The cap was screwed on and the tube was shaken for one minute, then allowed to stand for one minute. The tube was gently inverted three to four times to promote flocculation and left to stand for a further two minutes for settlement. The cap was removed, the top wiped with a clean tissue, and the clear solution was decanted into a round test tube up to 10 m One Nitricol tablet was then added, crushed, and mixed. The solution was allowed to stand for 10 minutes for full color development. Absorbance was measured at 570 nm using a photometer, and the results were recorded. We attempted to analyze the samples; according to WHO, chemical samples like nitrate and fluoride should be properly preserved and analyzed within 24 hours to ensure reliable results.
2.5.2. Bacteriological analysis
The detection and enumeration of total coliforms and fecal coliforms were carried out using the membrane filtration technique in accordance with standard methods. Membrane lauryl sulfate broth (MLSB) was freshly prepared for each batch to ensure the quality of the medium and the reliability of the results.
Prior to analysis, water samples were allowed to equilibrate to room temperature (approximately 20–25 °C). For each sample, a 100 mL aliquot was aseptically filtered through a sterile membrane filter with a pore size of 0.45 µm using a vacuum filtration unit. Following filtration, the membrane filter was carefully transferred with sterile forceps onto an absorbent pad saturated with MLSB and placed in sterile aluminum Petri dishes to maintain aseptic conditions and prevent external contamination. The prepared plates were incubated in a POTALAB incubator under selective temperature conditions: 37 °C for total coliforms and 44 °C for fecal coliforms, each for 22 ± 2 hours. These incubation temperatures were used to differentiate total coliforms from thermotolerant (fecal) coliform bacteria.
After incubation, colonies showing characteristic yellow coloration, indicative of lactose fermentation, were identified and counted using a magnifying lens or colony counter. Only well-defined colonies were included in the enumeration to ensure accuracy.
The results were expressed as colony-forming units (CFU) per 100 mL of water sample. All analyses were conducted under aseptic conditions, and appropriate quality control measures were followed to ensure the validity and reproducibility of the results. 9
2.6. Data analysis
Data were entered into Microsoft Excel and analyzed using SPSS version 25. Pearson’s correlation analysis was used to assess the relationship between bacteriological and physicochemical parameters. The assumptions of Pearson’s correlation, including linearity, normality, and absence of significant outliers, were checked and found to be reasonably satisfied. A p-value of <0.05 was considered statistically significant.
2.7. Operational definition
❖ Bacteriological quality of water: the water which has zero(no) fecal and total coliform bacteria in any 100 ml of sample. ❖ Physical quality of water: drinking water that has the recommended amount of turbidity < 5 NTU, temperature < 15
❖ Chemical quality of water: drinking water having recommended values of Nitrate < 45mg/l, Fluoride < 3mg/l, electrical conductivity < 500µm/s, PH 6.5-8.5, free residual chlorine 0.2-0.5mg/l by WHO. ❖ Zone: a piece of village stratified seven kebeles to ten villages by water supply office for the sake of facilitating simple water pipe installation.
2.8. Materials and chemicals
Apparatus (instrument): Thermometer, Incubator, Photometer, Conductivity Meter, pH meter, Oven, Glass Bottles, Measuring Cylinder, Filter paper, conical flask, pipette, measuring flask. Reagents (Chemicals): Membrane Lauryl sulfate, nitrate, fluoride and DPD.
2.9. Quality assurance and quality control
Standard methods for drinking-water analysis were evaluated under local accuracy and precision conditions, accepted nationally, and applied globally. Successful supervision of on appropriate methodologies for site testing includes all field activities, including water testing. Complete checklist that guides users toward effective analytical quality assurance was followed.
3. Results
3.1. Water quality at the source or boreholes
This study assessed the physicochemical and bacteriological quality of water from eight boreholes. The results showed that temperature (15–20 °C), pH (6.5–8.5), electrical conductivity (<500 µS/cm), turbidity (0.1–1.99 NTU), nitrate (<45 mg/L), and fluoride (1.5–3 mg/L) were within acceptable ranges.
Physicochemical and bacteriological analysis of water at different points in Debre Markos Town, 2024.

3.2. Water quality at disinfection point
In the study, from a total of 4 disinfection points, analysis of Physicochemical parameters showed that 3 (75%) Tem, all PH, EC, Tur, NO3- and 2 (50%) F- were in the range < 15°C, 6.5–8.5, < 500 µm/s, 0.1-1.99 NTU, < 45mg/l and 1.5-3 mg/l, respectively. Regarding to FCR 2(50%) and 1(25%) were > 0.5 and 0.2-0.5 mg/l, respectively. Bacteriological analysis revealed no detectable total or fecal coliforms at disinfection points (Table 2).
3.3. Water quality at distribution system (taps)
Out of 27 tap water samples, the result of Physicochemical parameters showed that all Tem, PH, EC, Tur, NO3- and F- were in the range <15°C, 6.5–8.5, <500µm/s 0.1-1.99 NTU, < 45mg/l and 1.5-3 mg/l, respectively. Regarding to FCR 4 (14.8%) and 23 (85.2%) were in the range 0.2 - 0.5 and 0.01- 0.19 mg/l, respectively. Bacteriological analysis also showed that 12(44.5%), 10(37%) and 5(18.5%) water samples had total coliform counts extending from 1.01–9.99, 0.01–1.00, and 0 CFU/100ml, respectively. Nine (33.3%), 8 (29.7%) and 10 (37%) samples had 1.01- 9.99, 0.01–1.00, and 0 CFU/100 ml of fecal coliform counts, respectively (Table 2).
3.4. Water quality at household containers
Out of 27 household containers water samples, analysis result of Physicochemical parameters showed that all Tem, PH, EC, Tur, NO3- and F- were in the range <15°C, 6.5–8.5, <500µm/s 0.1-1.99 NTU, < 45mg/l and 1.5-3 mg/l, respectively. Regarding to FCR 1(3.7%) and 26(96.3%) were in the range 0.2- 0.5 and 0.01- 0.19 mg/l, respectively. Bacteriological analysis on the other hand showed that 17 (63%), 7 (25.9%) and 3 (11.1%) water samples had total coliform counts ranging from1.01–9.99, 0.01–1.00 and 0 CFU/100ml, whereas 12 (44.5%), 9 (33.3%) and 6 (22.2%) samples had 1.01-9.99, 0.01-1.0 and 0 CFU/100 ml of Fecal coliform counts, respectively (Table2).
3.5. Correlation of water quality parameters at tap water
Pearsons’s correlation matrix between Physicochemical and bacteriological parameters of tap water Debre Markos, Ethiopia, 2024.
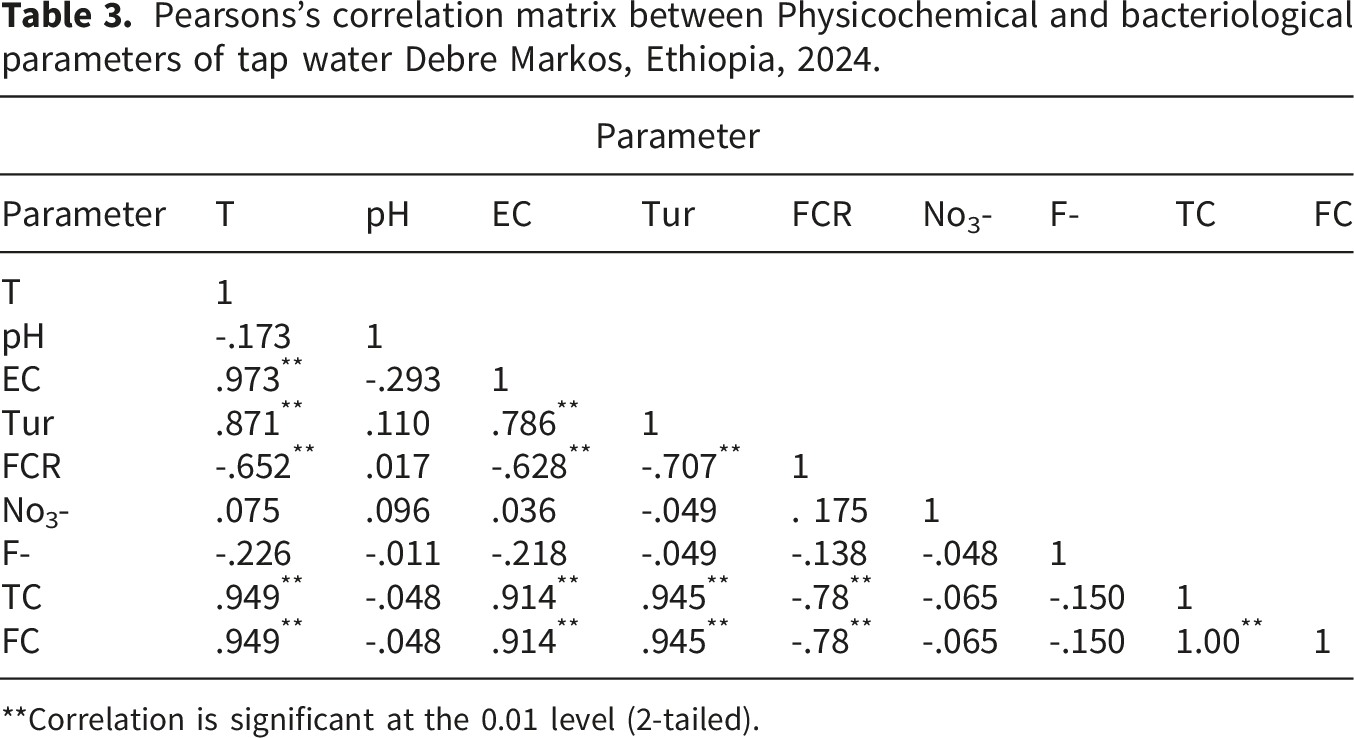
**Correlation is significant at the 0.01 level (2-tailed).
3.6. Correlation of water quality parameters at household container
The results of the Pearson correlation analysis showed significant positive associations among several water quality parameters. Electrical conductivity (EC) was strongly positively correlated with temperature (r = 0.97), while temperature also showed a strong positive correlation with turbidity (r = 0.85). In addition, temperature was positively associated with total coliforms (r = 0.71) and fecal coliforms (r = 0.72).
Turbidity exhibited a positive correlation with EC (r = 0.78), total coliforms (r = 0.83), and fecal coliforms (r = 0.80). Similarly, EC was positively correlated with total coliforms (r = 0.68) and fecal coliforms (r = 0.69). A very strong positive correlation was also observed between total coliforms and fecal coliforms (r = 0.98).
Pearson’s correlation matrix between Physicochemical and bacteriological parameters of HH container Debre Markos, Ethiopia, 2024.

**Correlation is significant at the 0.01 level (2-tailed).
4. Discussion
The water quality parameters for all boreholes in this study were found to be in accordance with the WHO (2022) and ES (2001) standards, except for temperature, the total number of coliforms, and fecal coliforms. Temperature is a crucial factor that controls both chemical and biological activities. The borehole waters’ average temperature was between 15.90°C and 17.80°C, thus greater than the suggested limits determined by both WHO and ES. Although Debre Markos is located in the “Woyna Dega” climatic zone, which is characterized by moderate temperatures, the high temperature of the groundwater might be due to the deeper water table. Research in Jigjiga, the southeast part of Ethiopia, revealed that half of the boreholes were at 15-20°C, while the other half were above 20°C. 21 A survey in Jimma town revealed all nine boreholes were above the WHO guideline of <15°C. 22
Groundwater that comes from deeper and confined aquifers is usually free of microorganisms and stable chemically, if not under direct contamination. 16 In this research, 3 (75 %) boreholes indicated the presence of TC and FC. The locations of these boreholes were near livestock grazing areas or pollution sources upstream, not more than 15 meters away, plus two sites in Sentara were also near agricultural activities, very probably causing the contamination. Similar works validate this finding: a study done in Akaki 23 stated that all contaminated sources were due to sewer leakage and livestock grazing nearby, whereas another study in Debre Birhan indicated poor water quality in two boreholes next to grazing and agricultural fields. 19
All water samples tested for parameters in the disinfection point in this study were found within WHO (2008) and ES (2001), except FCR, which did not maintain the minimum values of 0.6 – 1 mg/L, by the WHO (2008) guideline and ES (2001) at disinfection point. The average amount of (0.62 mg/L) FCR at outlet of this study, it could be sufficient in concentration to destroy pathogens at that point, however, this does not guarantee disinfection of water recontamination at the distribution and HH level. According to WHO (2002) regrowth of FC in the distribution system and at the household level is likely if there is no sufficient (0.6 – 1 mg/L) FCR. Evidence from a similar study in Ziway town indicated that water leaving the treatment plant, despite effective disinfection, contained both FC and TC at the end-user level. 24 Another study conducted in Jimma, Ethiopia, showed that the water effectively disinfected at the treatment site with FCR of 0.4 was found positive for TC. 22
Like other sampling points in this study, all water samples tested for parameters in taps were found within WHO (2008) and ES (2001), except TC, FC, and FCR. Whereas 81.5% and 63% samples from the taps were tested to be positive for TC and FC, respectively. The presence of bacteria in water taps may be due to leaky pipes in the distribution system. 25 It is supported by a study in Debre Markos town that the pipelines in the distribution system were badly installed and coincide with the sewerage lines, which may be the cause to bacteriological contamination in the distribution system. 26 A similar study conducted in Debre Zeit found that regarding bacteriological quality, 70% and 62% of the samples taken from taps were positive for TC and FC ranging between 1 and 4 CFU/100ml. 27 The presence of TC and FC, in this study emphasizes the necessity to uphold the recommended minimum value of 0.2 mg/L FCR at the point of end users. But the result of tap water samples tested for FCR, 23 (85.2%) at the point of delivery was 0.01–0.19 mg/L which is probably because the amount of chlorine at the time of disinfection in the treatment site was not as per the WHO (2022) guideline value (0.5-1 mg/L).
In this study also twenty-seven HH water samples were tested, in which all of them were found within the permissible limit of WHO (2022) and ES (2001) except the values of FCR, TC and FC. The FCR was found below the WHO guideline of 0.2 - 0.5mg/L at the point of consumption, which is probably because the amount of chlorine at the time of disinfection in the treatment site was not based on WHO2022 guideline value (0.5-1 mg/L). Free chlorine residual levels varied across sampling points, with a substantial proportion of samples from sources, taps, and household containers falling below the recommended residual chlorine concentration, indicating inadequate disinfection and possible chlorine decay along the distribution system.
Samples collected from household containers, in this research, showed that 88.9% and 77.8% tested positive for total coliforms and fecal coliforms, respectively. The high counts of TC and FC in household drinking water containers indicate fecal contamination. Poor sanitation and hygiene practices within the household may be major factors that contribute to contamination during transportation and storage of water. This finding is supported by gray literature from Debre Markos town, which reported household water-handling practices as very poor and could be a justification for the high level of TC and FC. Contamination can occur at the tap and household level due to distribution system issues and poor hygiene or storage practices. Additionally, chlorine decay during distribution reduces residual protection, allowing microbial regrowth and increasing the risk of unsafe drinking water. Similarly, a drinking water quality assessment conducted in Ethiopia showed that the majority of household water containers were positive for TC and FC and classified as high risk to health. This result is consistent with other studies conducted in Ethiopia. 28 Correlation of water Quality parameters at tap water results were in line with the findings of a similar study in Adama. 29 The correlation results at household shown that in physicochemical and bacteriological parameters correspond with those of the studies done in Bahir Dar, Ethiopia. 30 The observed similarity may be due to comparable treatment processes and household water handling practices in the study areas, which influence physicochemical and bacteriological parameters in a similar way. The results should be considered with a certain level of caution, bearing in mind the limitations. For instance, the study design used is cross-sectional, which only gives a snapshot of the data. This design does not take into account the seasonality of the data. In addition, the study may be affected by the number of sampling sites used, as well as the possible errors in the sampling process.
5. Conclusion
The study results demonstrated that all physicochemical parameters of borehole water except for temperature complied with WHO (2022) standards. Some boreholes contained total coliforms and fecal coliforms as contaminants. The disinfection point showed compliance with all WHO standards except for free chlorine residual which measured below 0.6 mg/L. The distribution system showed a high risk of fecal contamination because tap water guidelines were mostly met yet it contained coliforms and low FCR levels. Household containers kept the highest contamination levels which created a serious public health danger.
A comprehensive approach to addressing these issues involves extending pumping time to allow for stabilization and reduction of groundwater temperature, securing boreholes with protective fencing extending at least 15 meters from their boundaries, and ensuring proper chlorination alongside routine monitoring of water quality. In addition, all damaged pipes should be replaced and disinfected during maintenance activities. Furthermore, public awareness programs should be strengthened to educate communities on safe household water handling practices.
Footnotes
Acknowledgement
The Authors gratefully acknowledges Debre Markos University, College of Medicine and Health Sciences, for approving the research application and issuing the ethical clearance. Sincere gratitude is also prolonged to the supervisor and data collectors for their valuable time, guidance, and commitment during data collection.
Ethical considerations
Ethical clearance for the study was gotten from the Ethical Review Committee of Debre Markos University, College of Health Sciences. Permission letters were also held from the Debre Markos Town Administration Water Supply Office. Prior to data collection, the purpose of the study was described to all concerned bodies, informed consent was obtained, and confidentiality as well as voluntary participation were fully ensured specially to take a sample from house hold container.
Author contributions
BA and AB conceptualized and designed the study and contributed in data analysis and interpretation. BA administered the study design, analysis, and interpretation, and provided continuing critical guidance throughout the research process. AA made known sample collection, performed data entry, and contributed to rewording the manuscript. BA organized the initial draft of the manuscript. All authors reviewed and approved the final manuscript.
Funding
The authors disclosed receipt of the following financial support for the research, authorship, and/or publication of this article: This research was supported by Debre Markos University through the providing of ethical clearance for doing this research &data collection; however, the university had no role in the study design, data analysis, decision to publish, or preparation of the manuscript.
Declaration of conflicting interests
The authors declared no potential conflicts of interest with respect to the research, authorship, and/or publication of this article.
Data Availability Statement
The dataset used in this research will be made available on the corresponding author upon rational request.