
Abstract
Market orientation positively affects an organization’s commercial and financial performance in both the short and long term. Why does the manager’s transformational leadership style encourage the emergence of a market-oriented culture in the organization? Under what conditions is this influence stronger? In this research note, we analyze 163 manager–employee dyads in Senegalese Small and Medium-sized Enterprises (SMEs) and show, in line with social learning theory, (1) that the manager’s transformational leadership stimulates market orientation through its effects on the quality of exchanges between manager and employees, and (2) that this indirect effect is positively moderated by the manager’s own level of market orientation (moderated mediation).
Introduction
Market orientation – “the organizational culture that most effectively and efficiently creates the necessary behaviors for the creation of superior value for buyers and, thus, continuous superior performance for the business” (Narver and Slater, 1990: 21) – boosts a company’s commercial and financial performance in both the short and long term (Kirca et al., 2005; Kumar et al., 2011). Three meta-analyses have established that market orientation positively affects profits, market share, sales, and innovation capacity (Cano et al., 2004; Ellis, 2006; Kirca et al., 2005). It is, therefore, surprising that the issue of creating a market-oriented culture has received so little attention (Van Raaij and Stoelhorst, 2008). The question remains: “Why are managers reluctant to deploy [a market-oriented culture]? What is preventing or slowing down this transformation, despite the growing awareness of its benefits?” (Antonietti and Ray, 2022: 96).
A market-oriented culture may be either formal (deliberate) or informal (emergent) (Moorman and Day, 2016). In both cases, leaders play a critical role. Formally, they decide, organize, and steer the company’s cultural transformation process (Gebhardt et al., 2006; Kirca et al., 2005). Informally, and in accordance with the theory of social learning (Bandura, 1977), they affect the degree of market orientation of their colleagues by acting as a reference point, and these colleagues in turn influence the level of market orientation of other members of the organization (Lam et al., 2010; Liao and Subramony, 2008). However, not all leaders can be a role model for their colleagues. To do so, they must adopt a transformational leadership style (TFL), that is, they must demonstrate confidence and charisma, and arouse strong feelings of loyalty in their employees (be influential), set them high goals and convince them of the importance of these goals (be inspirational), encouraging them to think in new ways and to act outside existing routines and norms (being stimulating), and responding individually to their needs, acting as their coach and listening to their concerns (being respectful) (Bass and Avolio, 1993). “One way to build market orientation is to either nurture or hire a transformational leader” (Menguc et al., 2007: 320). Kraft and Bausch (2016) confirm by meta-analysis a significant and high effect (γ = 0.41) of transformational leadership style on market orientation.
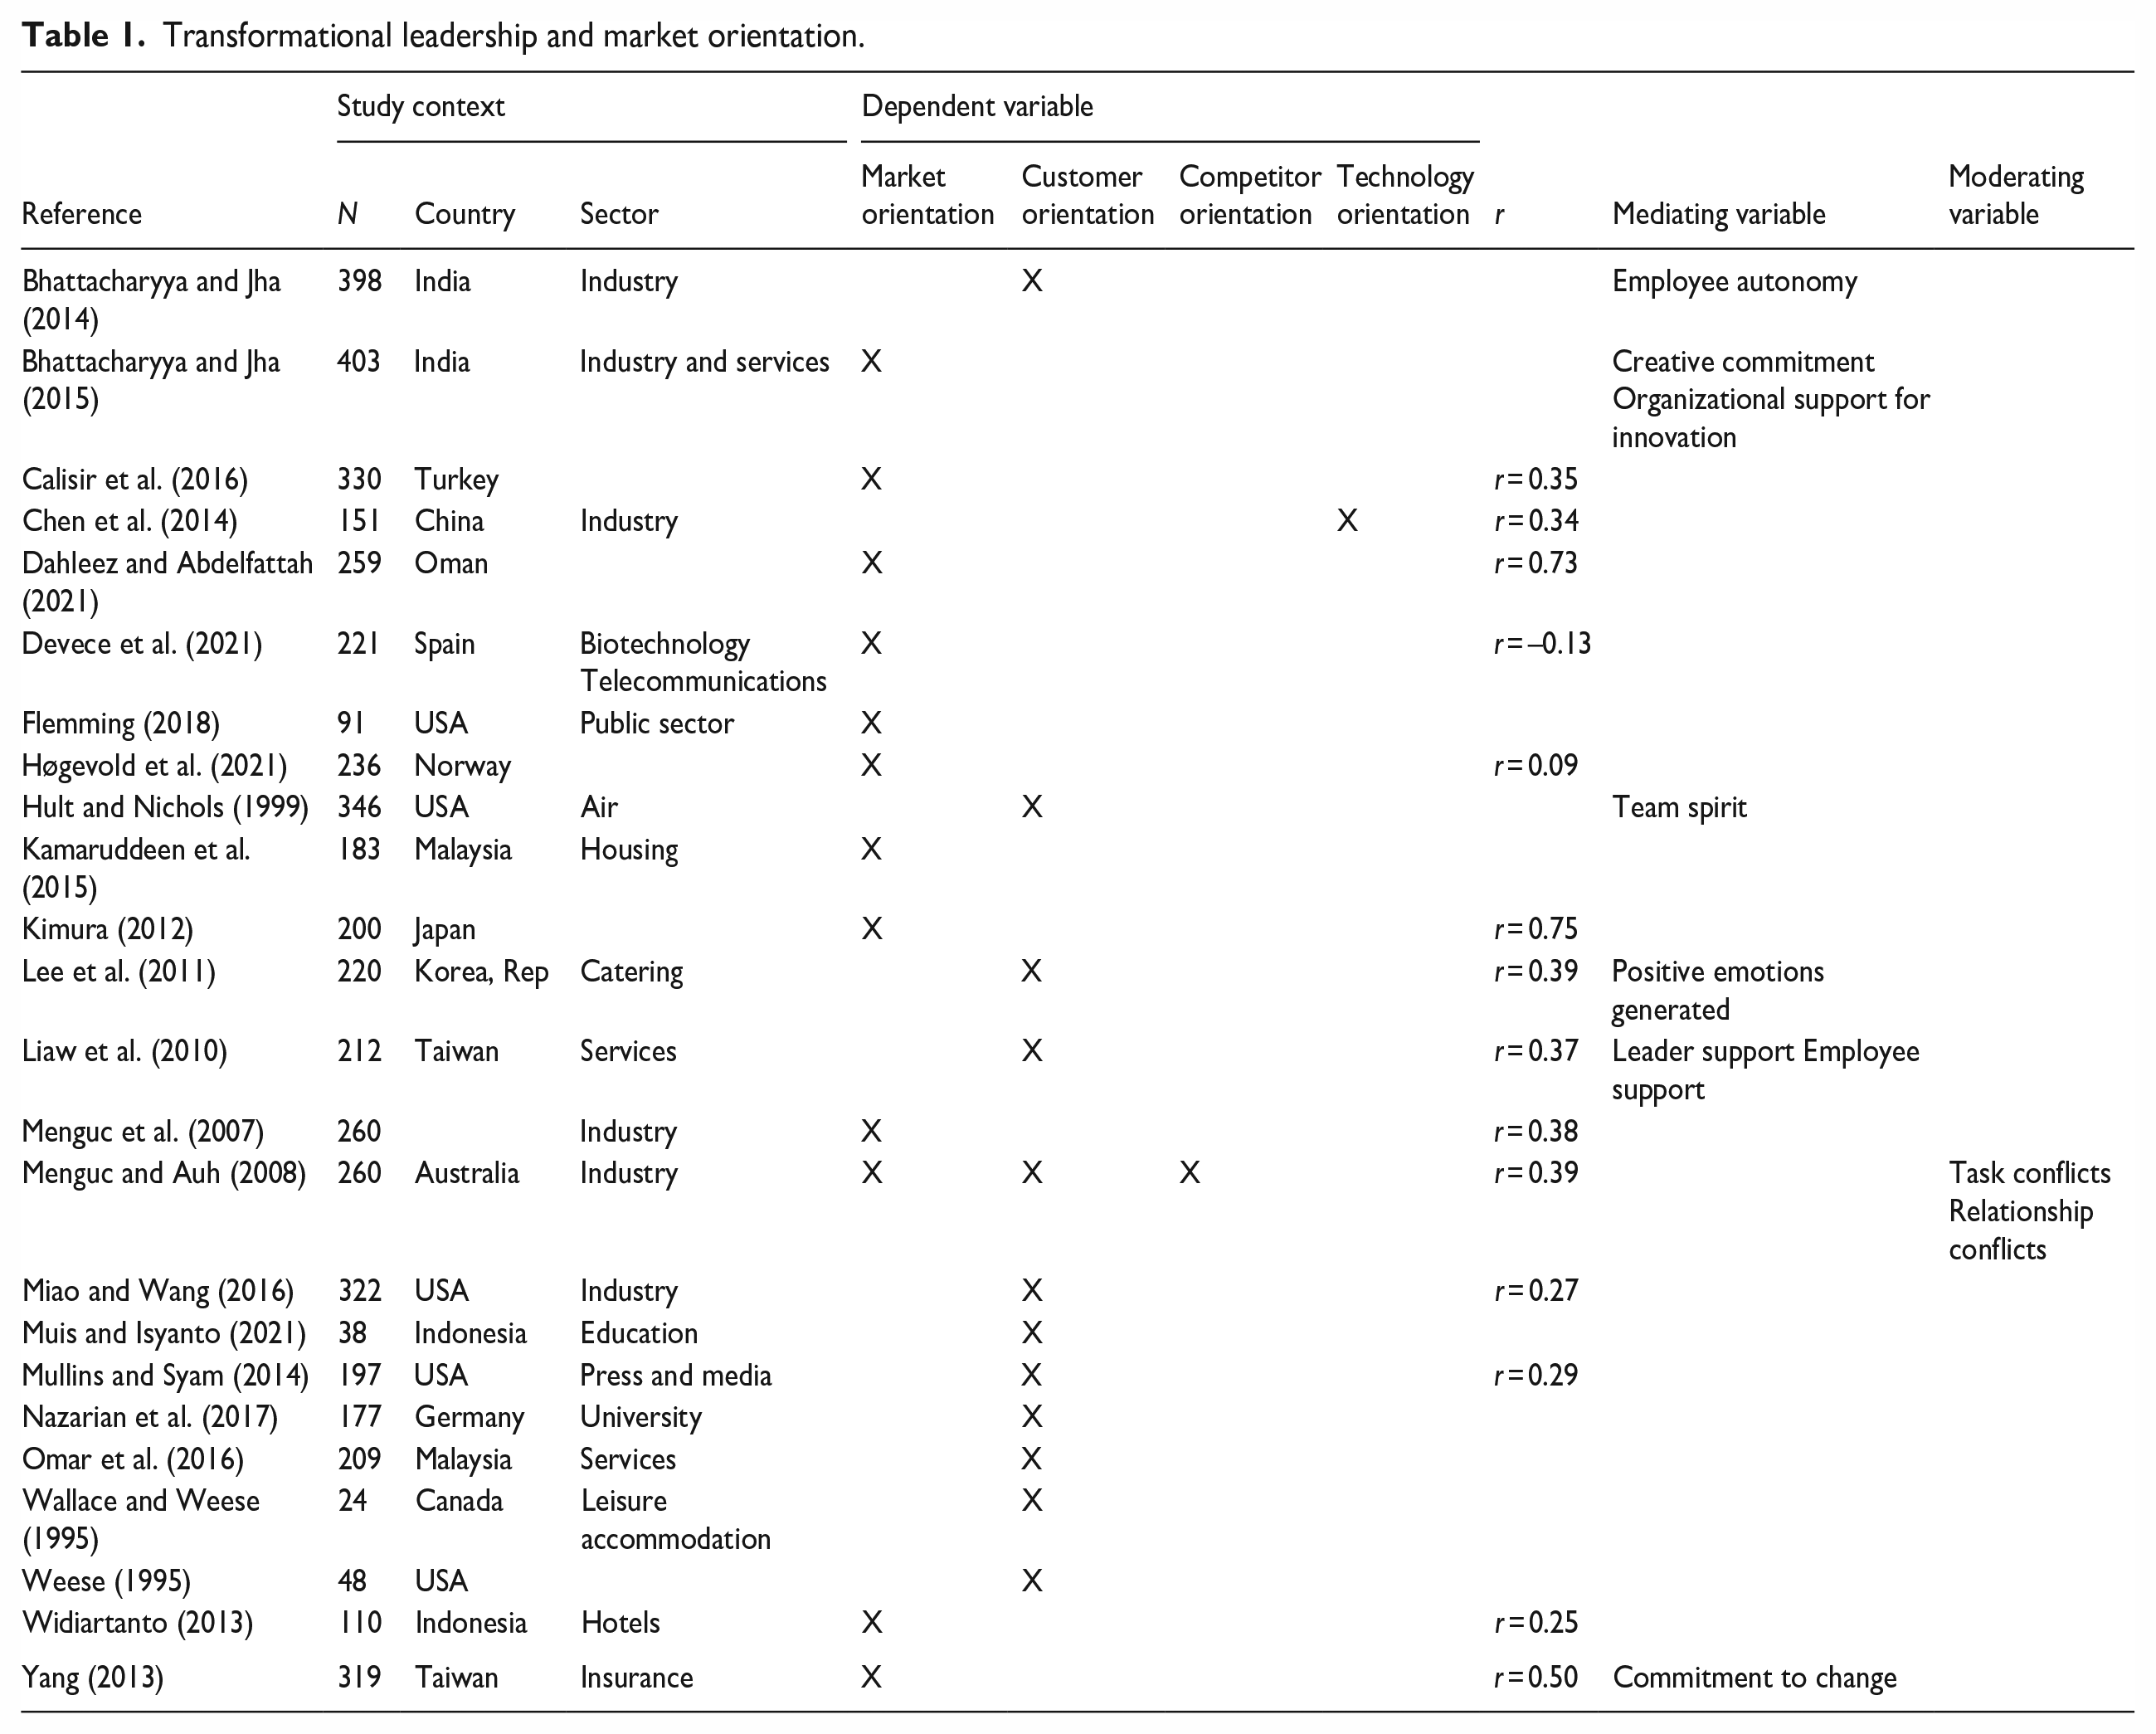
Despite these advances, two questions remain unanswered. First, how do leaders with a transformational leadership style stimulate their organization’s market orientation? This question refers to the mediating variables in the TFL–market orientation relationship. Moreover, while the effect of TFL on market orientation proves to be positive overall (see Table 1 for a summary of existing work), a close examination of the correlations between TFL and market orientation reveals that while some studies establish a link that is positive and high (r = 0.73; Dahleez and Abdelfattah, 2021), others observe relationships that are, on the contrary, very weak (r = 0.09; Høgevold et al., 2021), or even negative (r = −0.13; Devece et al., 2021). Thus, a second question arises: Under what conditions can leaders whose leadership is transformational stimulate the market orientation of their organization? This question refers to the moderating variables in the TFL–market orientation relationship.
Transformational leadership and market orientation.
Our study is based on a sample of managers and employees from 163 Senegalese SMEs, within the framework of social learning theory (Bandura, 1977). In line with this theory, we establish that manager’s transformational leadership stimulates market orientation through its effects on the quality of exchanges between the manager and employees (or LMX). We also show that this indirect effect is positively moderated by the manager’s own level of market orientation (i.e. moderated mediation). This research note is organized as follows. After setting out the theoretical framework of our work, we detail the methodology employed and present our main findings. Finally, we discuss the theoretical and managerial contributions of our study, present its limitations, and consider avenues for future research.
Theoretical framework and hypotheses
The origins of market orientation lie in the concept of marketing (Kohli and Jaworski, 1990). This places the customer at the center of the organization, so that “the whole enterprise [is] seen from the point of view of its ultimate objective, that is, from the customer’s point of view (Drucker, 1954: 39). This requires, first and foremost, that the organization implements customer orientation, which means “the sufficient understanding of one’s target buyers to be able to create superior value for them continuously” (Narver and Slater, 1990: 21). As the marketing concept focuses not only on satisfying customers’ needs but also on understanding the environment within which the company operates (Zeithaml and Zeithaml, 1984), two additional components of market orientation are competitor orientation – which means “that a seller understands the short-term strengths and weaknesses and long-term capabilities and strategies of both the key current and the key potential competitors” (Narver and Slater, 1990: 21–22) – and technology orientation – or “the ability and will to acquire a substantial technological background and use it in the development of new products” (Gatignon and Xuereb, 1997: 78).
How and under what conditions do transformational leaders stimulate their organization’s market orientation? In the Dimensions 1 bibliographic database, we identified 35 publications with the keywords “transformational leadership” AND (“market orientation” OR “customer orientation” OR “competitor orientation” OR “technological orientation” OR “technology orientation”) in the titles or abstracts. Eleven articles were not retained for reasons of form (e.g. one article was a duplicate, one article was published as conference proceedings, and one article could not be found despite our efforts) or content (four articles did not measure market orientation and were therefore not relevant to our study). Table 1 summarizes the 25 articles finally retained. Where they are available, we detail the article reference, the context of the study, the dependent variable of interest, the correlation between TFL and the dependent variable, and the mediating and moderating variables examined.
Transformational leaders stimulate their organization’s market orientation (Kraft and Bausch, 2016) by inducing positive individual and group dynamics. At a micro level, they grant autonomy to their employees (Bhattacharyya and Jha, 2014) and stimulate their commitment to change and creative processes (Bhattacharyya and Jha, 2015; Yang, 2013). At a organizational level, they strengthen team spirit (Liaw et al., 2010) and demonstrate support for their employees (Hult and Nichols, 1999). However, the effect of TFL is still determined by the level of conflict among employees – which may account for the variations in correlations reported in Table 1 (mean r = 0.355; σ r = 0.223; min r = −0.13; max r = 0.75). The effect of TFL decreases as relational conflicts among employees increase, and increases as conflicts of opinion become more intense (Menguc and Auh, 2008). We schematically incorporate the existing literature into Figure 1.
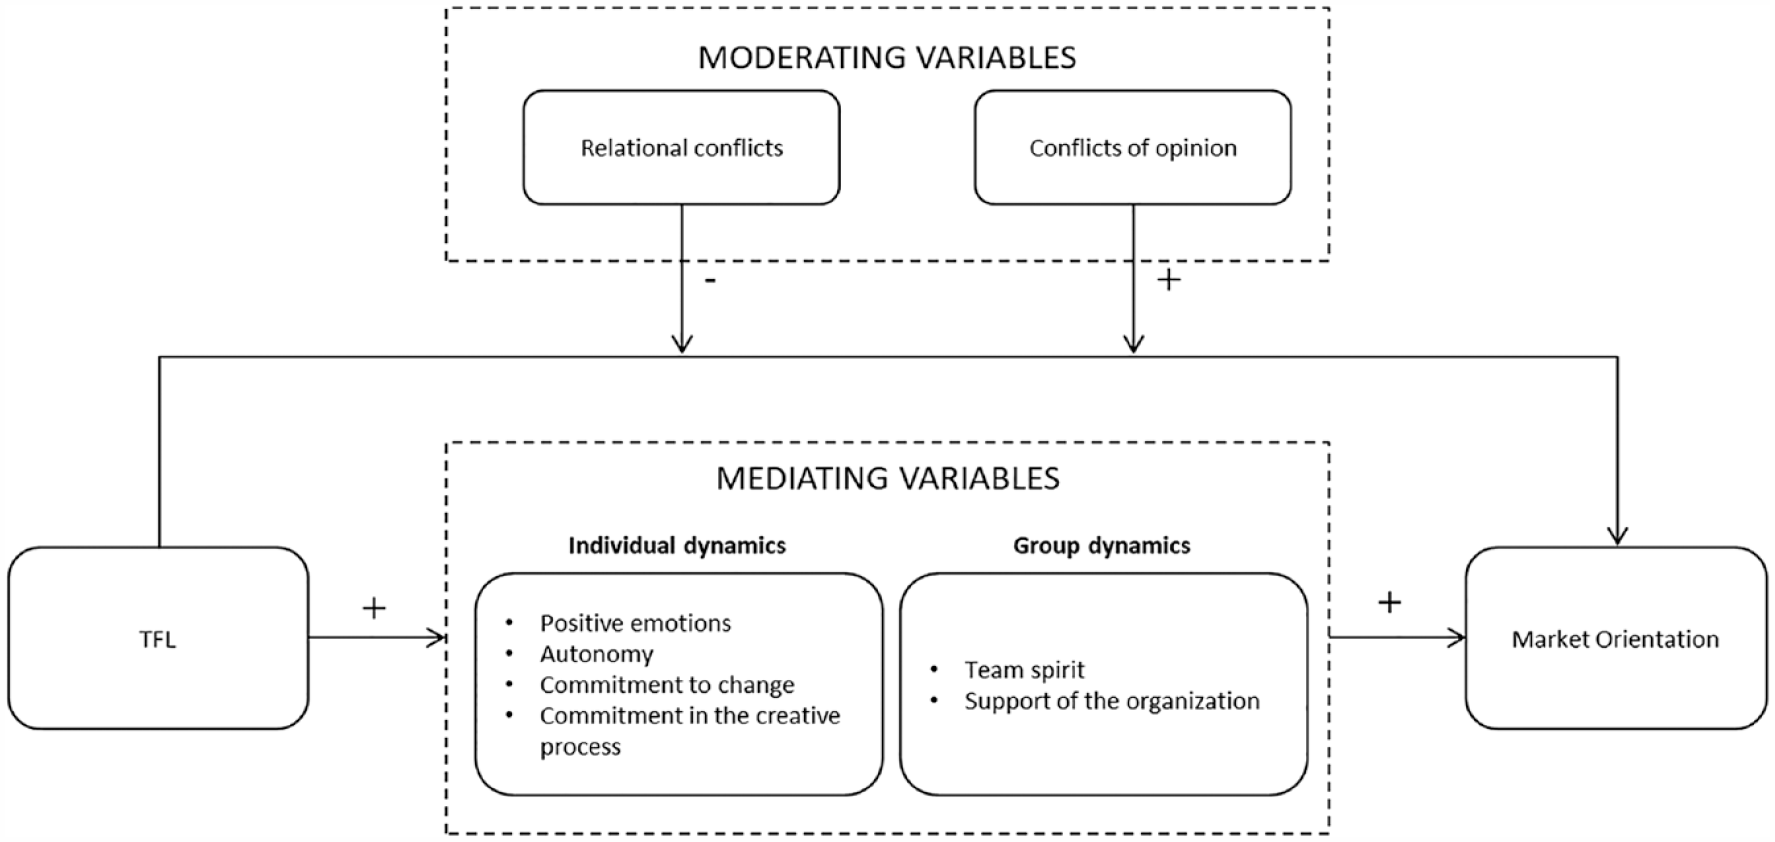
Transformational leadership and market orientation.
As stated in the introduction, the two objectives of this research note are to better understand how and under what conditions transformational leaders can stimulate their organization’s market-oriented culture. Creating a market-oriented culture is a process of organizational change. According to the social identity model of organizational change (Mühlemann et al., 2022), members of an organization define themselves not only as individuals (i.e. by their personal identity), but also as members of the organization (i.e. by their social identity). Social identity is “that part of an individual’s self-concept which derives from membership of a social group (or groups), and from the value and emotional significance attached to that membership” (Tajfel, 1978: 68). Therefore, for a market-oriented culture to develop, the members of the organization must be able to identify socially with a new system of values and beliefs, namely that of a market-oriented company. Leaders play a decisive role in this process of social identification. They help members of the organization to make sense of the change they are going through, by serving as reference points with whom the members can identify (Bandura, 1977; Mühlemann et al., 2022). However, not all leaders can serve as reference points: for this to happen, the members of the organization must identify with their leader. A leader whose leadership style is transformational (TFL) is demonstrably influential and inspiring for his or her colleagues (Bass and Avolio, 1993), in other words charismatic (Kark et al., 2003; Shamir et al., 2000). Ng (2017) was able to meta-analytically confirm a positive and significant effect of TFL on employees’ identification with their manager (β = 0.67; 11 studies; n = 3262). Consequently, if managers are individually market-oriented, their employees will adopt and conform to their value and belief system, and will in turn tend to become market-oriented themselves (Kirkland et al., 2021; Paparoidamis and Guenzi, 2009). If managers are not individually market-oriented, this identification mechanism will not be effective. In this regard, we maintain that leaders must be both market-oriented and exercise a transformational leadership style if they are to provide the stimulus that will induce the emergence of a market-oriented culture as an organizational response.
What mechanisms are involved in this process? In social exchanges, with a view to improving the quality of the mutual relationship, people tend to respond in kind toward those whom they perceive to have acted positively (Cropanzano and Mitchell, 2005; Wang et al., 2011). Leaders with a transformational leadership style are both stimulating and respectful of their colleagues (Bass and Avolio, 1993). As a result, they are perceived as seeking to build a quality relationship (Ng, 2017). Their colleagues will then tend reciprocally to want to reinforce the quality of the relationship. What follows is a process of reciprocal reinforcement of the quality and intensity of the relationship between leaders and colleagues, or LMX (Leader–Member Exchange) (Molm et al., 2012; Ng, 2017). Dulebohn et al. (2012) were able to meta-analytically confirm a positive and significant relationship between TFL and LMX (r = 0.66; 20 studies; n = 5451). This effect is all the stronger the more market-oriented the individual manager. On one hand, being market-oriented implies both “horizontal” and “vertical” – that is, hierarchical, especially on the part of the manager – sharing of market information throughout the organization (Kohli et al., 1993: 467; Homburg and Pflesser, 2000). Being market-oriented means collaborating and exchanging, in that collaboration and openness are two cardinal values of market orientation (Gebhardt et al., 2006). On the other hand, being market-oriented also implies being oriented toward the organization’s “internal customers” (Conduit and Mavondo, 2001), that is, its employees. Internal market orientation means “identifying and satisfying the wants and needs of employees” (Lings, 2004: 408), and consequently interacting with them in an empathetic, open and respectful way (Gebhardt et al., 2006) so as to identify and satisfy these needs (Gounaris, 2006; Yu et al., 2022). It follows that market-oriented leaders cultivate a culture of exchange and are empathetic, open, and respectful toward their associates.
As LMX increases, employees pay more attention to their manager; they remember his or her behaviors more vividly, and their motivation to adopt and reproduce the manager’s value and belief system – that of a market-oriented organization – increases (Wong et al., 2022). In this regard, we put forward a moderated mediation hypothesis, stating that the indirect effect of the manager’s transformational leadership (TFL) on market orientation – through its effects on the quality of exchanges between manager and employees (LMX) – is positively moderated by the manager’s own level of market orientation. Since we distinguish three dimensions of market orientation in this research note – namely, customer, competitor, and technology orientation – we posit the following three moderated mediation hypotheses:
Our theoretical model is presented in Figure 2.
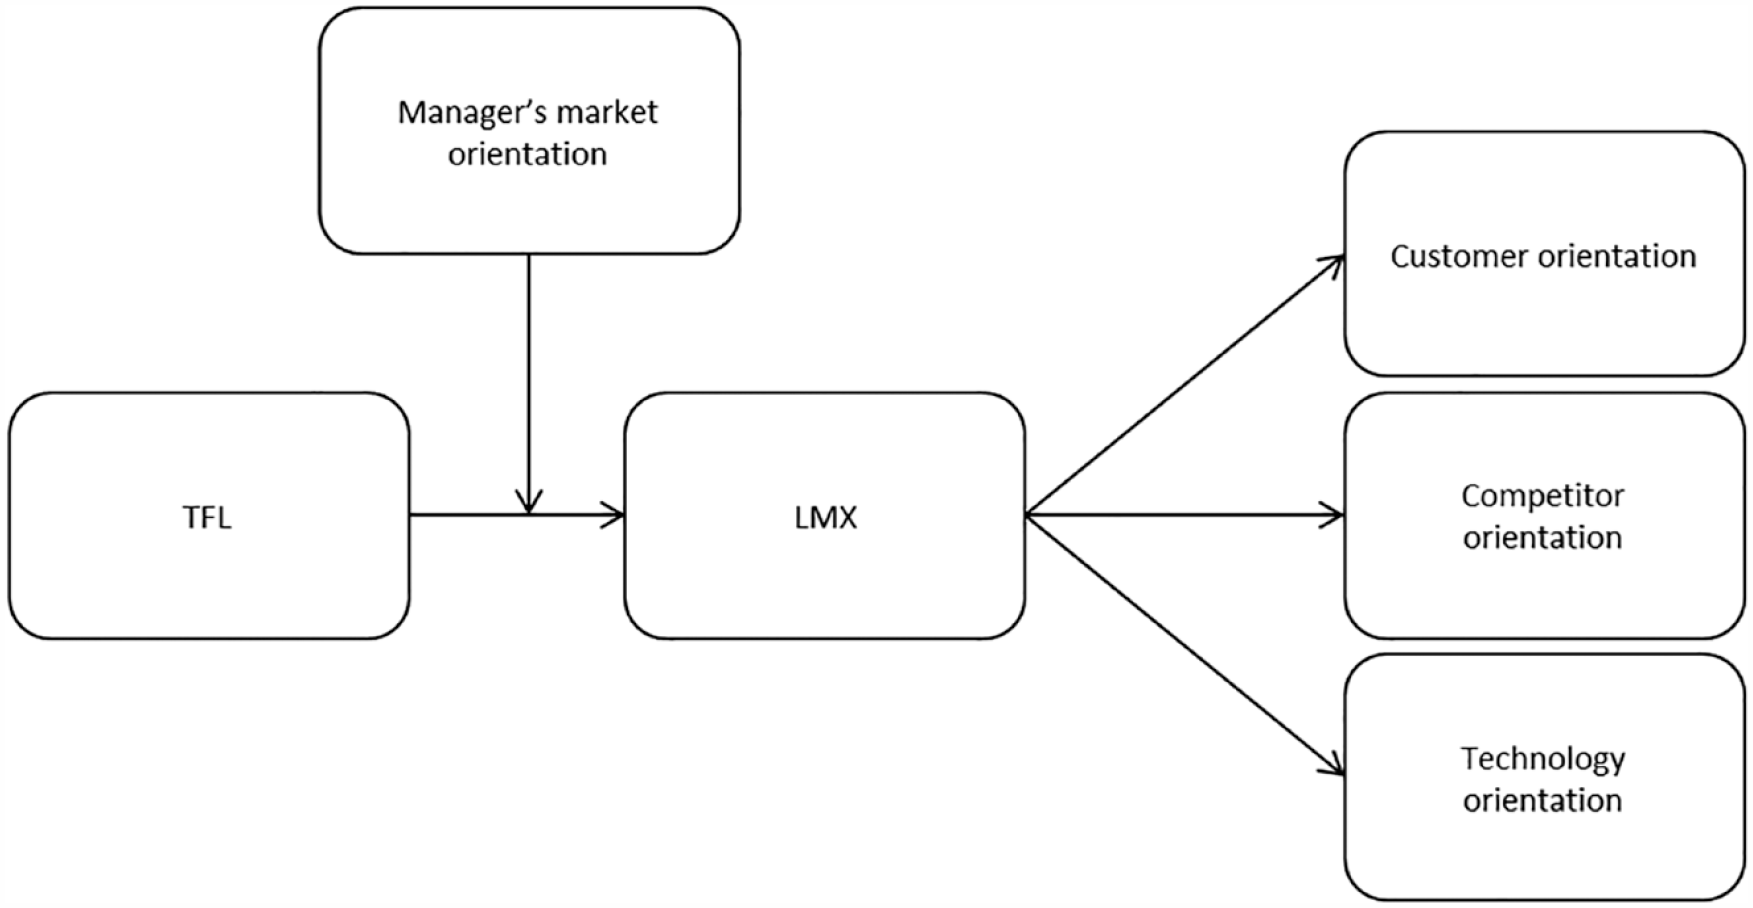
Research model.
Methodology and results
Study context and sample
There are still few studies on market orientation in developing economies, even though it has a positive impact on the performance of companies operating within these countries (Ellis, 2005). For our study, we chose Senegal, a country that the United Nations considers to be a developing economy. In Senegal, 99.8% of businesses are SMEs, that is, companies with fewer than 250 employees (according to the Agence Nationale de la Statistique et de la Démographie, ANSD). A specialized research firm working regularly with the ANSD selected a sample of 200 SMEs by stratified random draw from an ANSD sampling frame of 7945 companies (in their meta-analysis, Kirca et al., 2005 report a median sample size of 147 companies). Fourteen strata corresponding to 14 business sectors were selected.
The research firm hand-delivered a questionnaire to the sample, which consisted of the manager as well as the individual directly below the manager in the company’s hierarchy. This second person was asked to complete the questionnaire so that we could more reliably assess both the quality of the relationship between the manager and employees (LMX) and the manager’s level of transformational leadership (TFL). In their meta-analysis of LMX effects, Gerstner and Day (1997) argue that assessment by a close colleague is the most reliable. 2 To overcome common variance bias, measurements of dependent and independent variables should involve different respondents (Podsakoff et al., 2003). The other variables in the model were measured directly with the manager. Before being administered, the questionnaire was pretested with 10 SME managers. Minor modifications were made to the questionnaire, involving rewording. In the end, 181 questionnaires were completed, and 163 were retained after deleting those with missing data.
Measurements
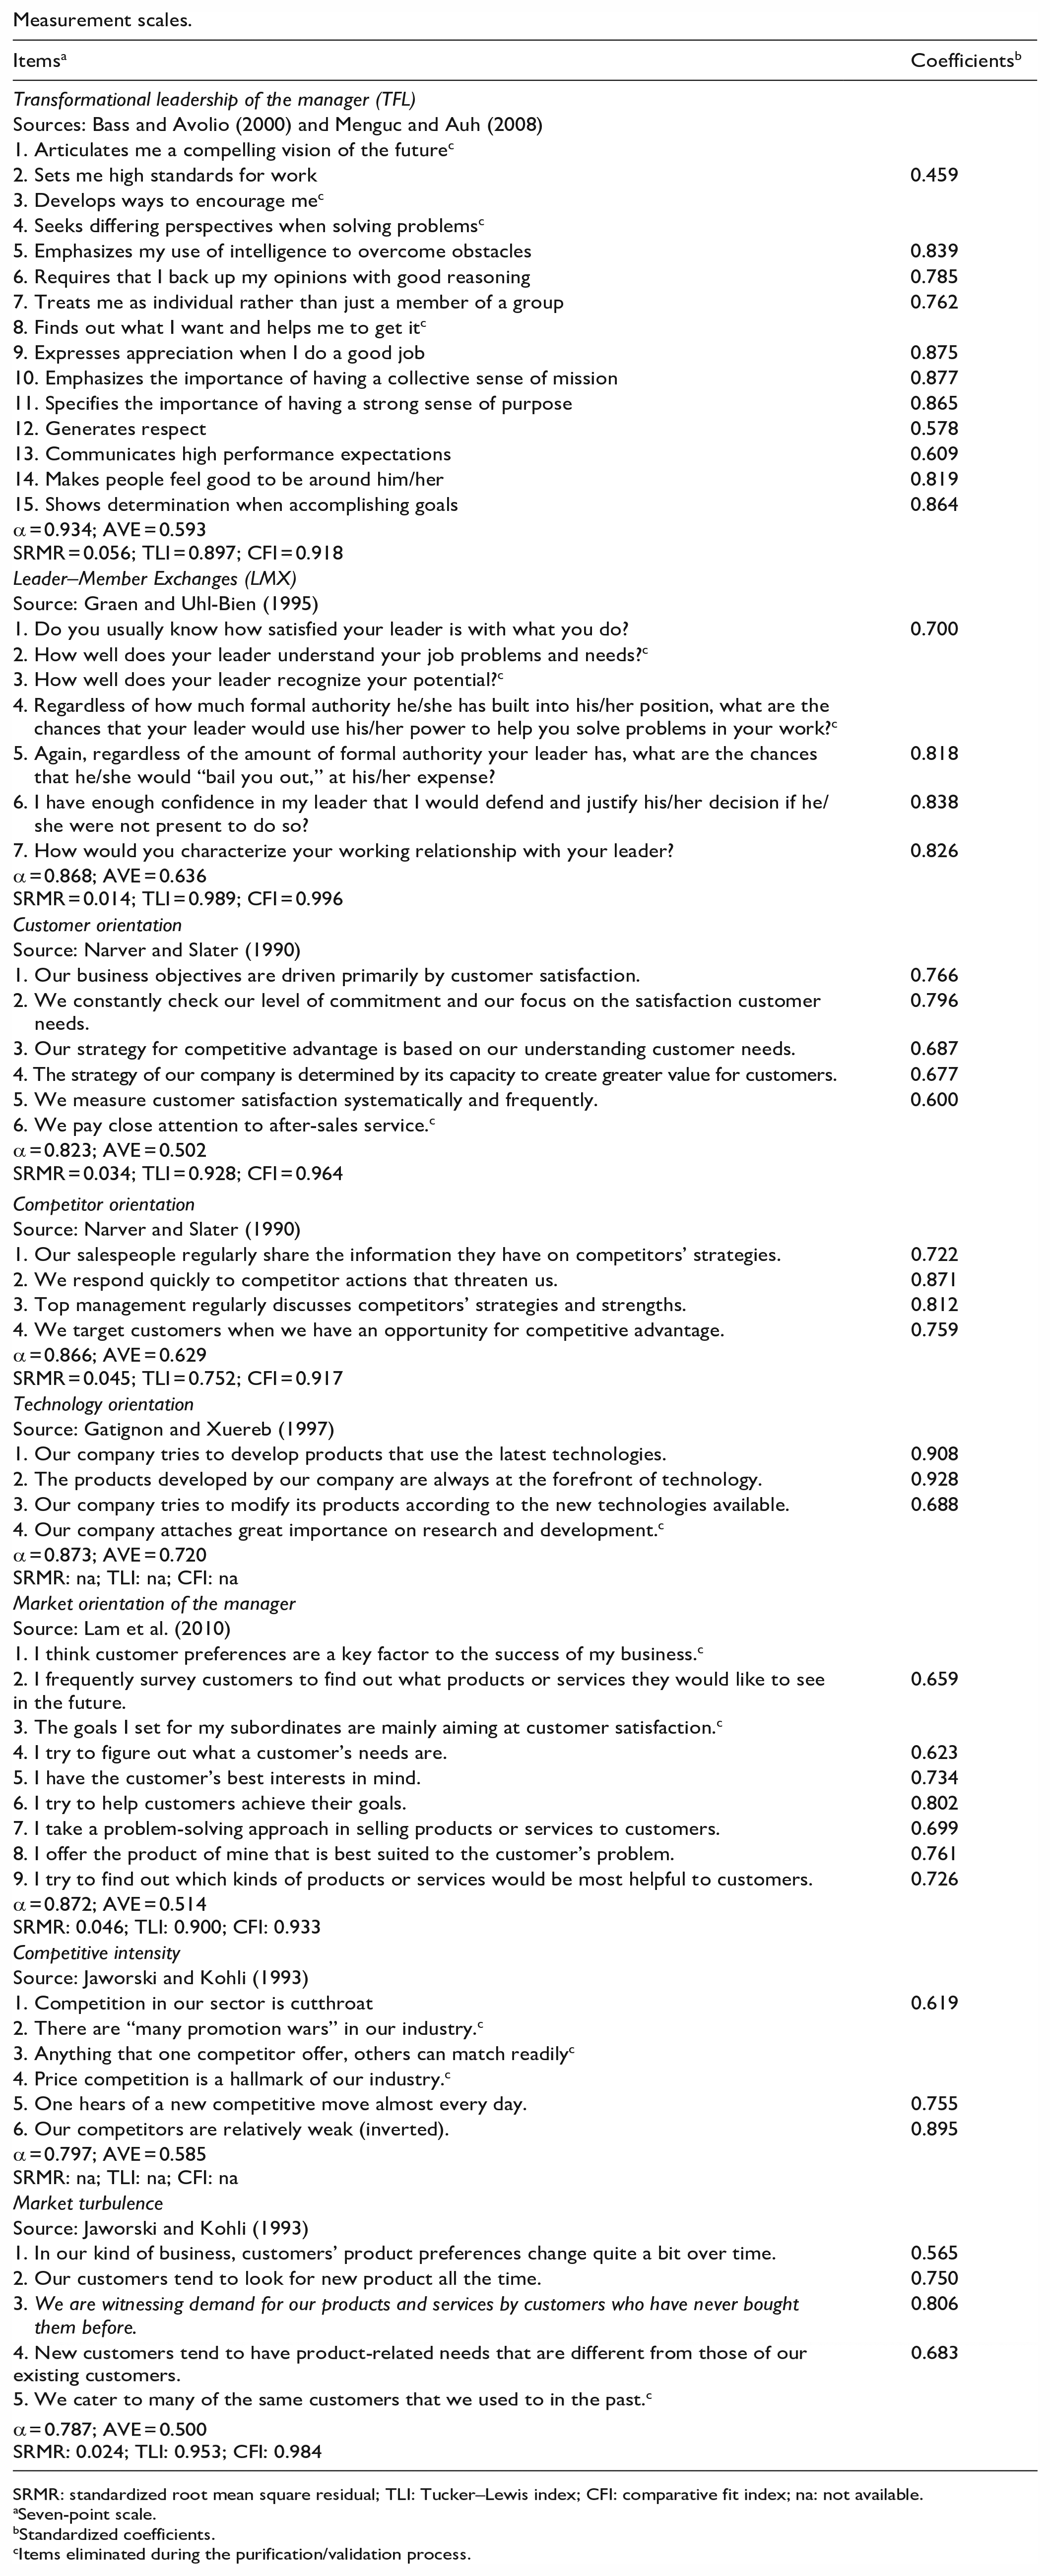
For reproducibility purposes, the model variables were measured using existing scales. Details are given in Appendix 1. Furthermore, because a company’s level of market orientation is not only affected by the transformational leadership of its top manager, we first controlled for the effect of the manager’s socio-demographic characteristics (i.e. age, gender, and business experience) (Diao et al., 2017). Moreover, since Senegal is a “collectivist” society in the sense defined by Hofstede et al. (2010), family associates can influence the company’s strategic orientations. We, therefore, controlled for the effect of family concentration of power, measured by the number of members of the manager’s family working within the company. Finally, as a company’s market orientation is affected by the market conditions in which it operates (Kirca et al., 2005), we controlled for the effects of market turbulence and competitive intensity.
Appendix 1 gives details of the items retained following principal component analyses, the standardized coefficients for each item, and the fit indices. These meet or are very close to the standards of acceptability usually recommended, in particular the comparative fit index (CFI) and standardized root mean square residual (SRMR) indices whose use is recommended for a confirmatory factor analysis (CFA) when n ⩽ 200 (Mai et al., 2021): CFI > 0.95, Tucker–Lewis index (TLI) > 0.95, and SRMR < 0.080 (MacCallum et al., 1996). The reliability of the scales is also verified – Cronbach’s alpha values range from 0.787 to 0.934 – as is their convergent validity (average variance extracted (AVE) > 0.500). Particular attention was paid to the discriminant validity of the TFL and LMX measurements, as these two concepts can be considered theoretically close (Rowold and Borgmann, 2013). We employed four procedures. First, we verified that the AVEs of each construct (AVETFL = 0.593; AVELMX = 0.637) are well above the variance shared between the two constructs (0.560) (Fornell and Larcker, 1981). Second, we compared a free model where the correlation between the two constructs was left free, with a constrained model where it was fixed at 1: the fit of the free model is significantly better than that of the constrained model (χ2Free_model = 240.49; χ2Constrained_model = 370.46; Δχ2 = 129.87; p < 0.01). Third, we verified that the HTMT ratio is well below the most conservative threshold (0.850): HTMT = 0.761 (Voorhees et al., 2016). Finally, we verified that the upper bound of the 95% confidence interval of the HTMT inference criterion (HTMTInference) is less than 1 (CI95% = [0.631–0.862]) (Henseler et al., 2015). We, therefore, conclude from these four procedures that the discriminant validity of the TFL and LMX measures is established.
Model estimation and results
The choice of PROCESS or structural equation modeling (SEM) to test moderated mediation continues to be a topic of debate in the literature (Hayes, 2017). In this research note, we have chosen to use both approaches jointly, so as to offer a cross-validation of our results. We model an interaction between two latent variables (i.e. manager’s market orientation and TFL). To model this effect, we followed the recommendations of Pieters et al. (2022). When the reliability of the interaction term is less than 1 (in our case 0.815; equation (6); Pieters et al., 2022: 943), the factor score method is recommended for calculating the interaction term between latent variables. We, therefore, carried out two estimations: one by CB-SEM/ML (covariance-based structural equation modeling/maximum likelihood) and the other by partial least squares structural equation modeling (PLS-SEM). As our results are likely to be biased by the violation of the multi-normality condition of the indicators (Pieters et al., 2022), it was important to cross-validate them using an estimation method that is not sensitive to this condition (i.e. PLS-SEM). Our results are detailed in Table 2 (and Figure 3). Regardless of the estimation method used (CB-SEM/ML or PLS-SEM), our conclusions regarding hypothesis testing remain unchanged. We confirm our hypothesis H1a: transformational leadership (TFL) has a positive and significant effect on the quality of exchanges between the manager and employees (LMX) (p < 0.01; two-tailed); this effect is stronger the more market-oriented the manager (p < 0.05; two-tailed); and LMX has a positive and significant effect on the company’s customer orientation (p < 0.05; two-tailed). On the contrary, we reject hypotheses H1b and H1c: the effect of LMX on the company’s competitor and on technology orientations is found to be non-significant (p > 0.10).
Model estimation (SEM).
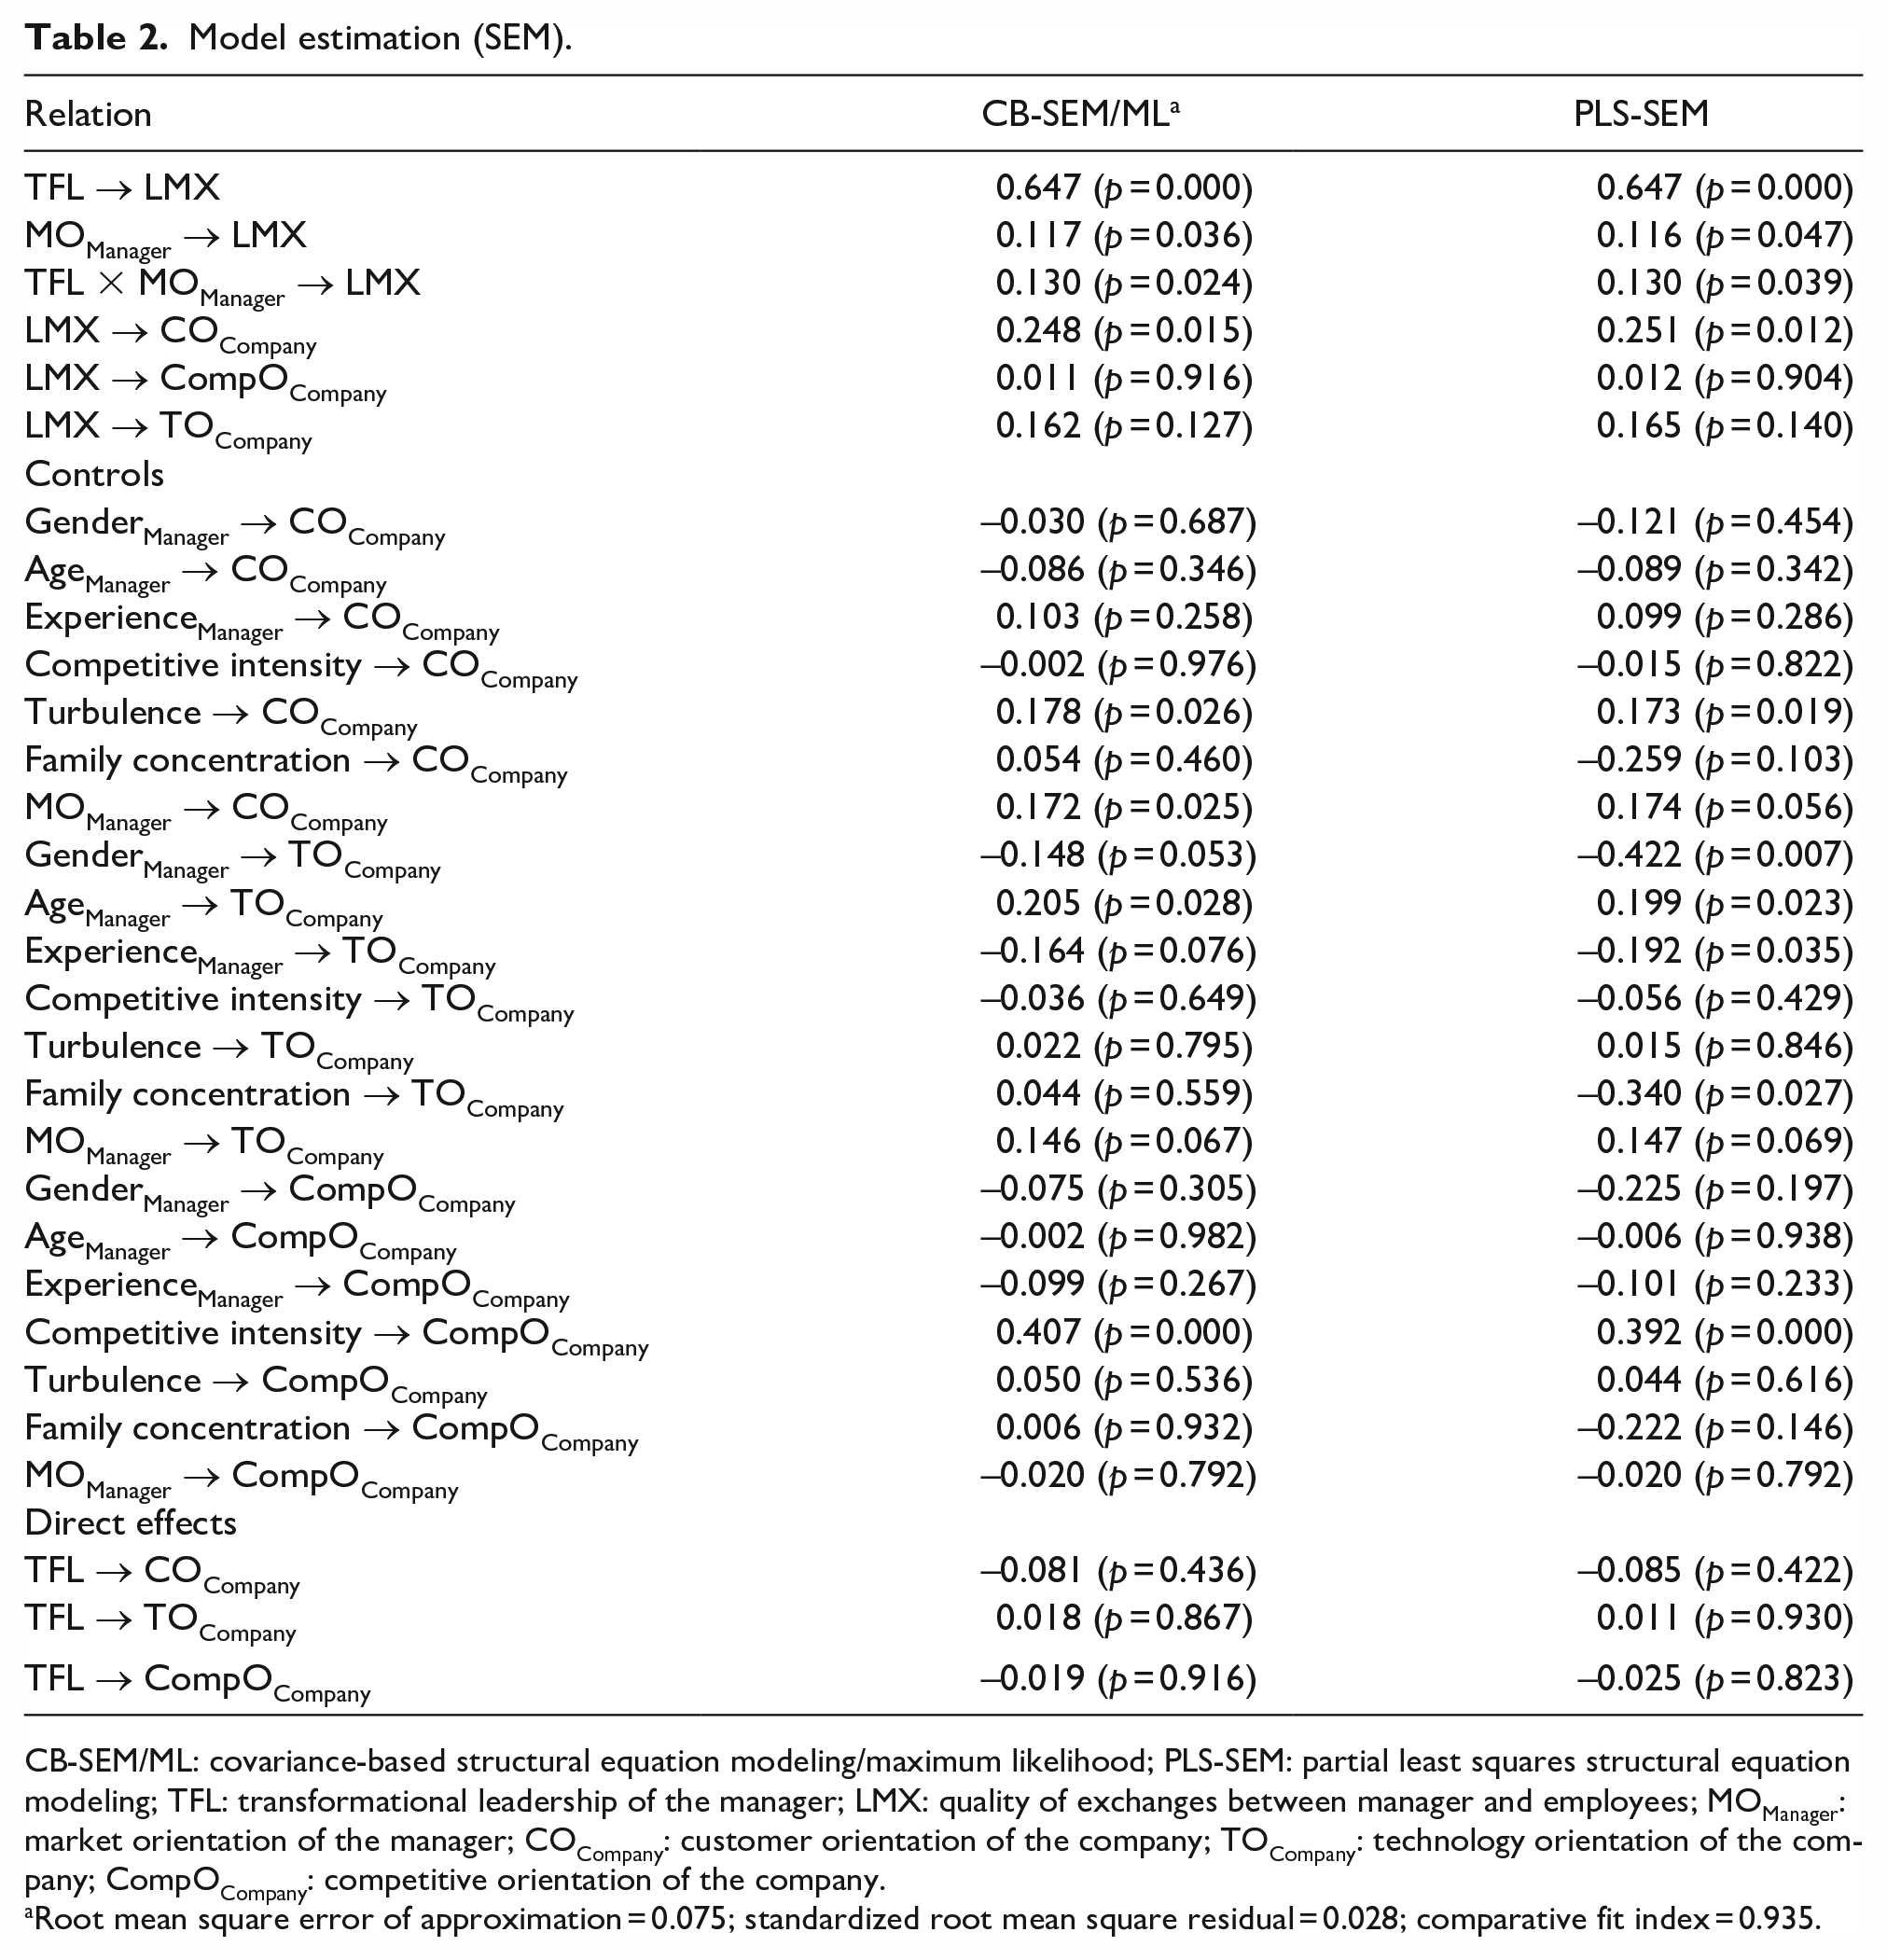
CB-SEM/ML: covariance-based structural equation modeling/maximum likelihood; PLS-SEM: partial least squares structural equation modeling; TFL: transformational leadership of the manager; LMX: quality of exchanges between manager and employees; MOManager: market orientation of the manager; COCompany: customer orientation of the company; TOCompany: technology orientation of the company; CompOCompany: competitive orientation of the company.
Root mean square error of approximation = 0.075; standardized root mean square residual = 0.028; comparative fit index = 0.935.
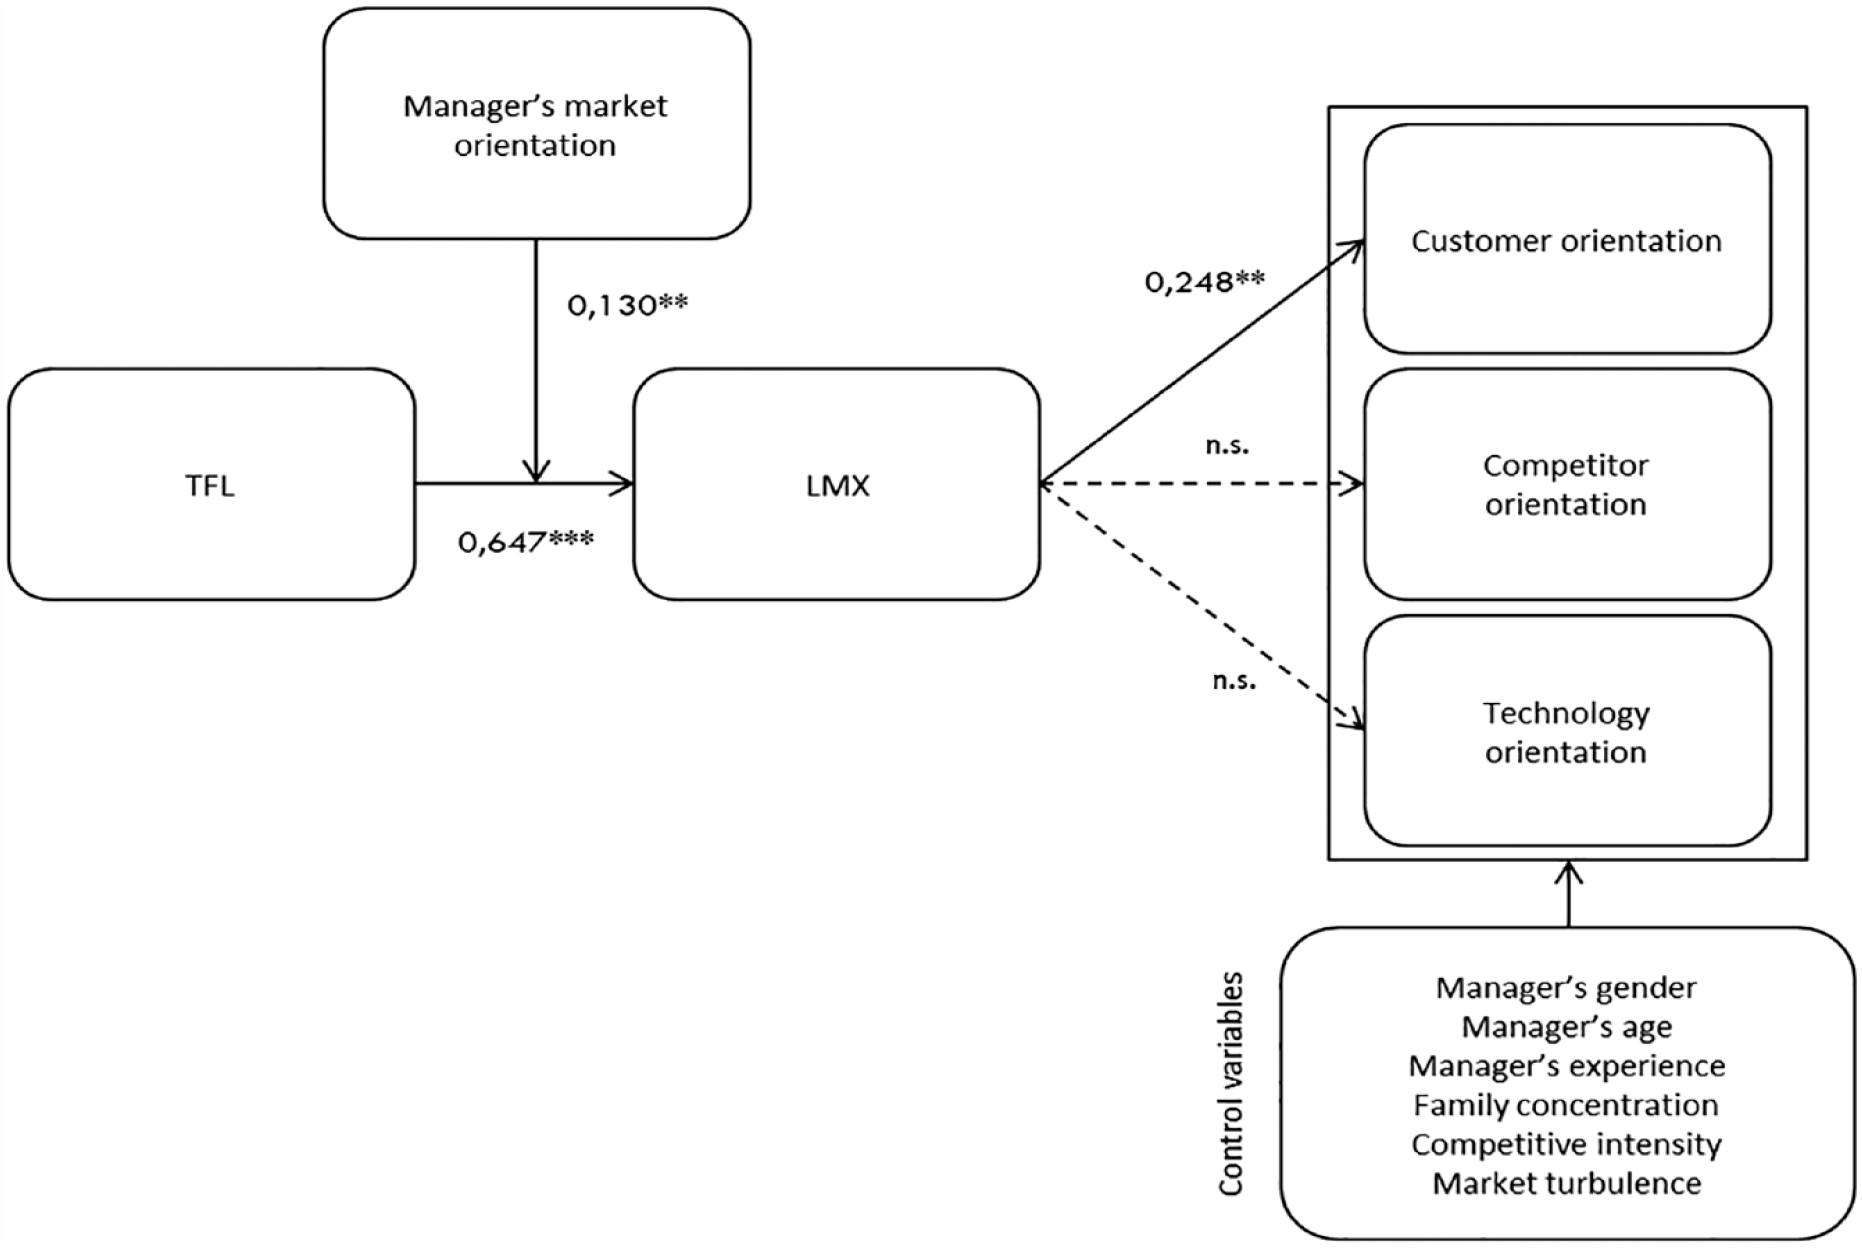
Model estimation (CB-SEM/ML).
To cross-validate our results, we used Macro PROCESS Model 7 (Hayes, 2017), introducing the same control variables as those specified for SEM modeling (CB-SEM or PLS-SEM). We present the results of these estimations in Table 3. The moderated mediation index is significant when customer orientation and technology orientation are introduced as dependent variables: 0.037 (CI95% = [0.000–0.087]) and 0.007 (CI90% = [0.003–143]), respectively. It is, however, marginally significant when the dependent variable is technology orientation (Pritschet et al., 2016). 3 As expected, TFL has a positive and significant effect on LMX: CI95% = [0.607–0.871]. This effect is positively moderated by the manager’s market orientation: CI95% = [0.022–.406]. LMX also exerts a positive and significant effect on customer orientation (CI95% = [0.065–0.285]) and on technology orientation (CI90% = [0.025–0.592]). We, therefore, conclude that our hypotheses H1a and H1c are confirmed. On the contrary, we again reject hypothesis H1b: LMX has no significant effect on the company’s competitor orientation (CI95% =[ –0.430–0.245]). In the end, if we compare the results obtained by SEM and PROCESS, hypothesis H1a is supported, but hypotheses H1b and H1c are rejected. We discuss our results below.
Estimation of moderated mediation (PROCESS Model 7).
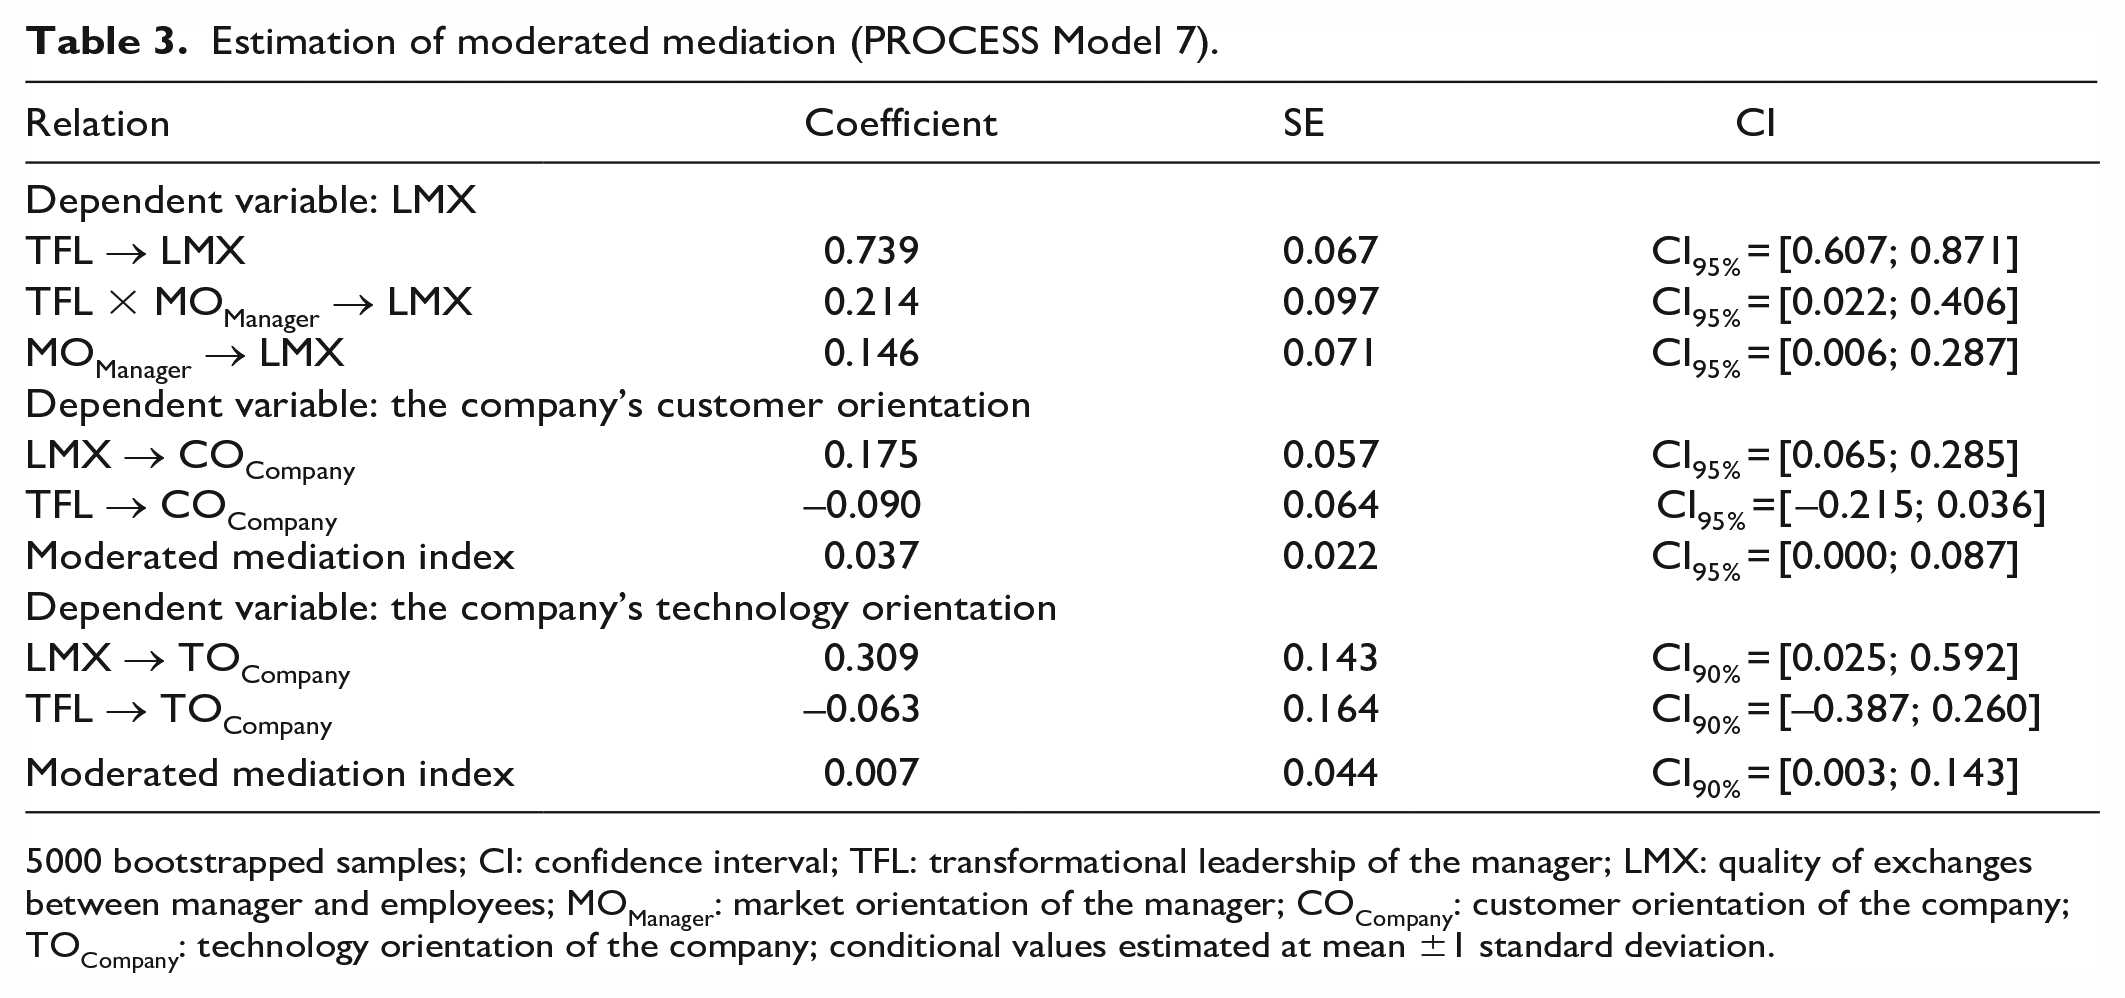
5000 bootstrapped samples; CI: confidence interval; TFL: transformational leadership of the manager; LMX: quality of exchanges between manager and employees; MOManager: market orientation of the manager; COCompany: customer orientation of the company; TOCompany: technology orientation of the company; conditional values estimated at mean ±1 standard deviation.
Discussion
Managers play a decisive role in creating and developing a market-oriented culture. The effect of the manager’s transformational leadership (TFL) has received more specific attention (Gotteland, 2019). In this research note, we enrich existing knowledge in two ways. First, we establish that TFL indirectly influences the company’s customer orientation through its effects on the quality of exchanges between manager and employees (LMX). Unlike studies that have established a direct effect of TFL on market orientation (see Table 1), we observe a total mediation of LMX. In other words, adopting a transformational leadership style has an effect on customer orientation only through higher-quality exchanges between the manager and employees. This result confirms, on one hand, that a market-oriented culture can develop informally (emergently) in an organization (Moorman and Day, 2016), and, on the other hand, the relevance of social learning theory for understanding how a market-oriented culture is created (Bandura, 1977).
Second, we show that the indirect effect of TFL is all the stronger when the manager is individually market-oriented. This result helps explain why some studies have found a positive effect of TFL on market orientation (e.g. Dahleez and Abdelfattah, 2021), while others have found a negative impact (e.g. Devece et al., 2021). From an operational standpoint, this means that adopting a transformational leadership style is necessary for developing a customer-oriented culture, but not sufficient. In this note, we show that managers need to maintain quality exchanges with their employees (LMX) and to be market-oriented themselves. In line with social learning theory, it is by serving as a referent (Bandura, 1977) that managers can stimulate a market-oriented culture in their organization.
Our study has a number of limitations, which in turn open up new avenues of research. We would like to mention three limitations in particular. On one hand, LMX is not the only mediator of the TFL–market orientation relationship (see Table 1). Would the affective, motivational, and organizational justice mechanisms identified by Ng (2017) provide a better understanding of how a transformational leadership style stimulates market orientation? Are these mechanisms mutually antagonistic? If so, how could their potentially opposing effects be reconciled? In addition, we recognize that the context chosen for our study – even though we have discussed its relevance – could limit the scope of our results. In SMEs, the possibilities and opportunities for exchanges between managers and employees are undoubtedly more frequent than in large companies, and it, therefore, seems more likely that SME employees can identify with their managers. Moreover, SME managers have a potentially stronger influence on their organization than managers of large companies (Raju et al., 2011). In this sense, we recognize that our results may be biased toward positive conclusions, and we encourage replication of our work with reference to large companies. Furthermore, the factors influencing an organization’s market orientation vary according to cultural zones (Ellis, 2005). As we point out, Senegal is a “collectivist” society as understood by Hofstede et al. (2010) and we, therefore, consider our results to be generalizable to this context (see https://geerthofstede.com/country-comparison-graphs/). But can the same results also be observed in more “individualistic” societies? Finally, a manager is not characterized solely by a leadership style that is purely transformational. For example, Jaramillo et al. (2009) have shown that servant leadership positively affects employees’ customer orientation (β = 0.13, p < 0.05), while Feng et al. (2019) observe a positive and significant link between two dimensions of ethical leadership and customer orientation (r = 0.536 and r = 0.484, respectively). How do different leadership styles affect market orientation? Are their effects complementary or antagonistic? In our view, these questions prompt us to continue studying the practicalities of creating a market-oriented culture.
Footnotes
Appendix 1
Measurement scales.
| Items a | Coefficients b |
|---|---|
| Transformational leadership of the manager (TFL) | |
| Sources: Bass and Avolio (2000) and Menguc and Auh (2008) | |
| 1. Articulates me a compelling vision of the future c | |
| 2. Sets me high standards for work | 0.459 |
| 3. Develops ways to encourage me c | |
| 4. Seeks differing perspectives when solving problems c | |
| 5. Emphasizes my use of intelligence to overcome obstacles | 0.839 |
| 6. Requires that I back up my opinions with good reasoning | 0.785 |
| 7. Treats me as individual rather than just a member of a group | 0.762 |
| 8. Finds out what I want and helps me to get it c | |
| 9. Expresses appreciation when I do a good job | 0.875 |
| 10. Emphasizes the importance of having a collective sense of mission | 0.877 |
| 11. Specifies the importance of having a strong sense of purpose | 0.865 |
| 12. Generates respect | 0.578 |
| 13. Communicates high performance expectations | 0.609 |
| 14. Makes people feel good to be around him/her | 0.819 |
| 15. Shows determination when accomplishing goals | 0.864 |
| α = 0.934; AVE = 0.593 |
|
| Leader–Member Exchanges (LMX) | |
| Source: Graen and Uhl-Bien (1995) | |
| 1. Do you usually know how satisfied your leader is with what you do? | 0.700 |
| 2. How well does your leader understand your job problems and needs? c | |
| 3. How well does your leader recognize your potential? c | |
| 4. Regardless of how much formal authority he/she has built into his/her position, what are the chances that your leader would use his/her power to help you solve problems in your work? c | |
| 5. Again, regardless of the amount of formal authority your leader has, what are the chances that he/she would “bail you out,” at his/her expense? | 0.818 |
| 6. I have enough confidence in my leader that I would defend and justify his/her decision if he/she were not present to do so? | 0.838 |
| 7. How would you characterize your working relationship with your leader? | 0.826 |
| α = 0.868; AVE = 0.636 |
|
| Customer orientation | |
| Source: Narver and Slater (1990) | |
| 1. Our business objectives are driven primarily by customer satisfaction. | 0.766 |
| 2. We constantly check our level of commitment and our focus on the satisfaction customer needs. | 0.796 |
| 3. Our strategy for competitive advantage is based on our understanding customer needs. | 0.687 |
| 4. The strategy of our company is determined by its capacity to create greater value for customers. | 0.677 |
| 5. We measure customer satisfaction systematically and frequently. | 0.600 |
| 6. We pay close attention to after-sales service. c | |
| α = 0.823; AVE = 0.502 |
|
| Competitor orientation | |
| Source: Narver and Slater (1990) | |
| 1. Our salespeople regularly share the information they have on competitors’ strategies. | 0.722 |
| 2. We respond quickly to competitor actions that threaten us. | 0.871 |
| 3. Top management regularly discusses competitors’ strategies and strengths. | 0.812 |
| 4. We target customers when we have an opportunity for competitive advantage. | 0.759 |
| α = 0.866; AVE = 0.629 |
|
| Technology orientation | |
| Source: Gatignon and Xuereb (1997) | |
| 1. Our company tries to develop products that use the latest technologies. | 0.908 |
| 2. The products developed by our company are always at the forefront of technology. | 0.928 |
| 3. Our company tries to modify its products according to the new technologies available. | 0.688 |
| 4. Our company attaches great importance on research and development. c | |
| α = 0.873; AVE = 0.720 |
|
| Market orientation of the manager | |
| Source: Lam et al. (2010) | |
| 1. I think customer preferences are a key factor to the success of my business. c | |
| 2. I frequently survey customers to find out what products or services they would like to see in the future. | 0.659 |
| 3. The goals I set for my subordinates are mainly aiming at customer satisfaction. c | |
| 4. I try to figure out what a customer’s needs are. | 0.623 |
| 5. I have the customer’s best interests in mind. | 0.734 |
| 6. I try to help customers achieve their goals. | 0.802 |
| 7. I take a problem-solving approach in selling products or services to customers. | 0.699 |
| 8. I offer the product of mine that is best suited to the customer’s problem. | 0.761 |
| 9. I try to find out which kinds of products or services would be most helpful to customers. | 0.726 |
| α = 0.872; AVE = 0.514 |
|
| Competitive intensity | |
| Source: Jaworski and Kohli (1993) | |
| 1. Competition in our sector is cutthroat | 0.619 |
| 2. There are “many promotion wars” in our industry. c | |
| 3. Anything that one competitor offer, others can match readily c | |
| 4. Price competition is a hallmark of our industry. c | |
| 5. One hears of a new competitive move almost every day. | 0.755 |
| 6. Our competitors are relatively weak (inverted). | 0.895 |
| α = 0.797; AVE = 0.585 |
|
| Market turbulence | |
| Source: Jaworski and Kohli (1993) | |
| 1. In our kind of business, customers’ product preferences change quite a bit over time. | 0.565 |
| 2. Our customers tend to look for new product all the time. | 0.750 |
| 3. We are witnessing demand for our products and services by customers who have never bought them before. | 0.806 |
| 4. New customers tend to have product-related needs that are different from those of our existing customers. | 0.683 |
| 5. We cater to many of the same customers that we used to in the past. c | |
| α = 0.787; AVE = 0.500 |
|
SRMR: standardized root mean square residual; TLI: Tucker–Lewis index; CFI: comparative fit index; na: not available.
Seven-point scale.
Standardized coefficients.
Items eliminated during the purification/validation process.
Appendix 2
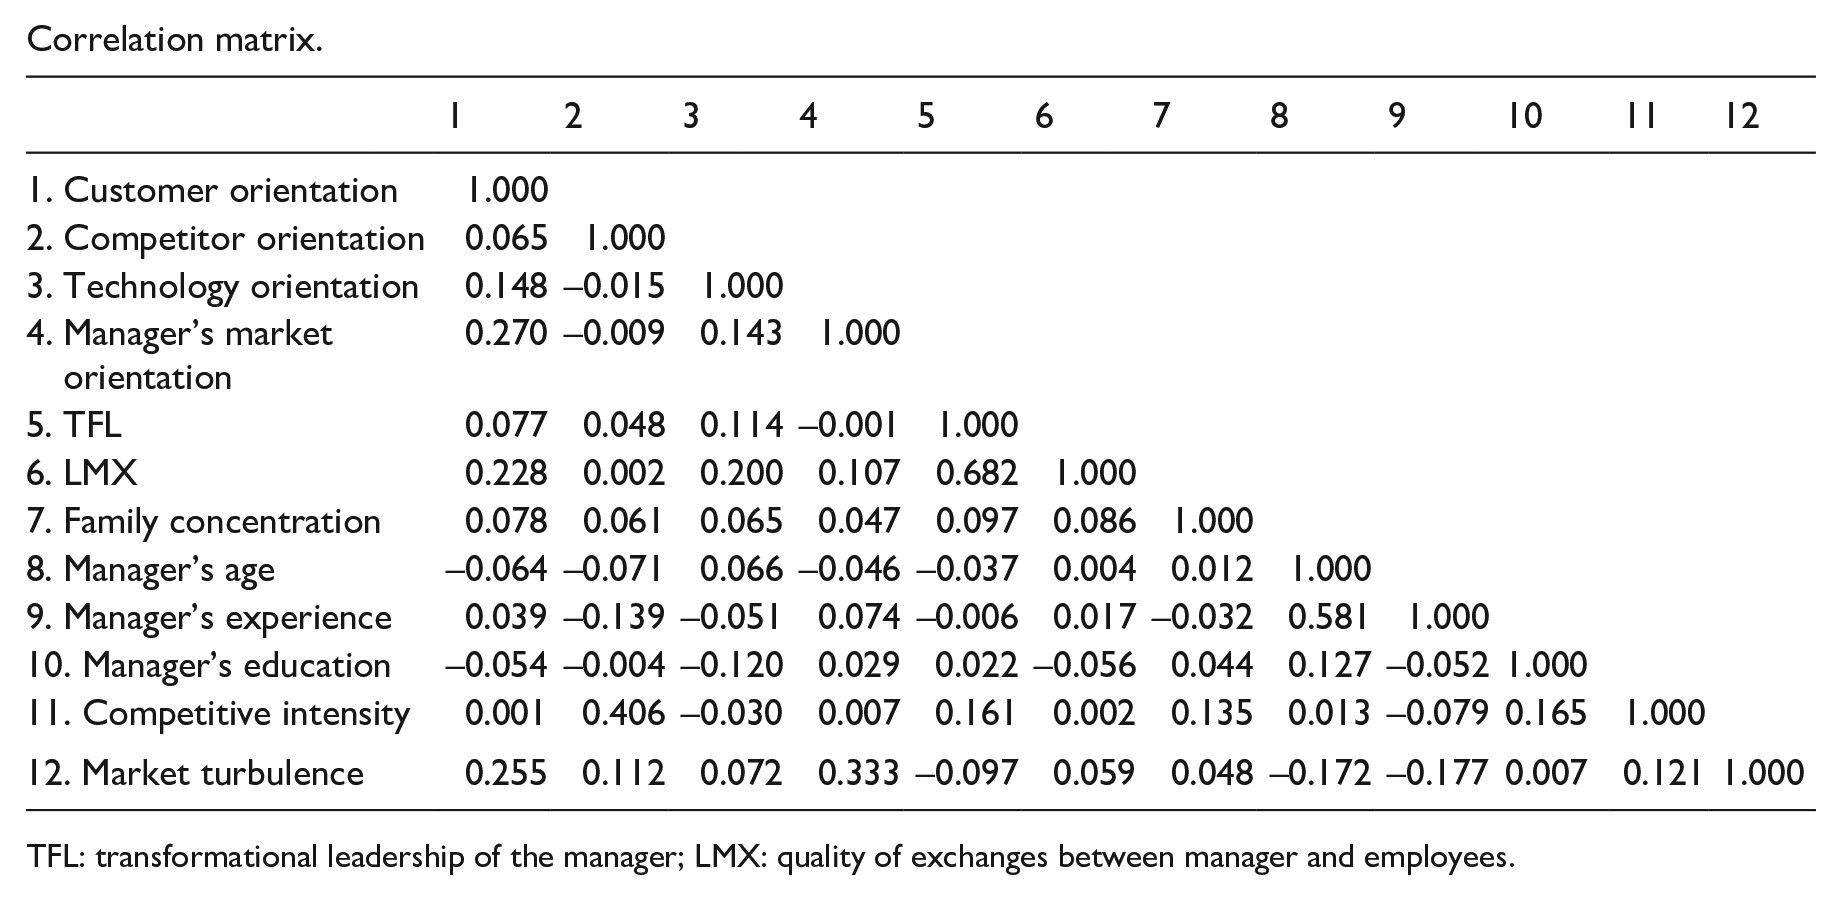
Correlation matrix.
| 1 | 2 | 3 | 4 | 5 | 6 | 7 | 8 | 9 | 10 | 11 | 12 | |
|---|---|---|---|---|---|---|---|---|---|---|---|---|
| 1. Customer orientation | 1.000 | |||||||||||
| 2. Competitor orientation | 0.065 | 1.000 | ||||||||||
| 3. Technology orientation | 0.148 | –0.015 | 1.000 | |||||||||
| 4. Manager’s market orientation | 0.270 | –0.009 | 0.143 | 1.000 | ||||||||
| 5. TFL | 0.077 | 0.048 | 0.114 | –0.001 | 1.000 | |||||||
| 6. LMX | 0.228 | 0.002 | 0.200 | 0.107 | 0.682 | 1.000 | ||||||
| 7. Family concentration | 0.078 | 0.061 | 0.065 | 0.047 | 0.097 | 0.086 | 1.000 | |||||
| 8. Manager’s age | –0.064 | –0.071 | 0.066 | –0.046 | –0.037 | 0.004 | 0.012 | 1.000 | ||||
| 9. Manager’s experience | 0.039 | –0.139 | –0.051 | 0.074 | –0.006 | 0.017 | –0.032 | 0.581 | 1.000 | |||
| 10. Manager’s education | –0.054 | –0.004 | –0.120 | 0.029 | 0.022 | –0.056 | 0.044 | 0.127 | –0.052 | 1.000 | ||
| 11. Competitive intensity | 0.001 | 0.406 | –0.030 | 0.007 | 0.161 | 0.002 | 0.135 | 0.013 | –0.079 | 0.165 | 1.000 | |
| 12. Market turbulence | 0.255 | 0.112 | 0.072 | 0.333 | –0.097 | 0.059 | 0.048 | –0.172 | –0.177 | 0.007 | 0.121 | 1.000 |
TFL: transformational leadership of the manager; LMX: quality of exchanges between manager and employees.