
Abstract
Background
The prevalence of Major Depressive Disorder (MDD) is increasing at an alarming rate globally. There is a need for a digital tool that enables continuous and real-time data collection, helps overcome stigma, and improves mental health awareness. Here, we describe mHealth, an open-source, scalable mobile health application (iPhone operating systems, iOS, and Android) and present the details about the pilot phase of the application.
Methods
We built the mHealth application using Xamarin, an open-source framework. Active data included four questions on mood administered twice daily and were collected as numerical data and mapped onto respective outcomes. Passive data included pedometer, location, device usage (calls, text, application usage), and location networks. Data were updated on the web-based portal and mobile application hourly.
Results
Of the 199 Texas Resilience Against Depression (T-RAD, observational, longitudinal study) study participants who consented to participate in the mHealth substudy, 113 (110 iOS testers and 3 Android testers) participated in the pilot. During the iOS pilot phase, application usage rates were high for the first three months with 90% engagement. We present detailed descriptive data from a participant to illustrate the types of data that can be extracted from the mobile application and how the data can be integrated into an observational study.
Conclusions
Our pilot observations highlight opportunities to integrate mHealth into clinical studies. While this work demonstrates technical feasibility and user acceptability, the pilot phase was not powered to evaluate predictive utility. Further research will focus on testing and validating the application in independent cohorts to establish its clinical utility.
Introduction
Major Depressive Disorder (MDD) is one of the most common psychiatric disorders, with lifetime depression rates increasing at an alarming rate (20.6% in 2017 to 29% in 2023) among American adults. 1 The prevalence of depression is higher in individuals with chronic medical conditions, including diabetes (28%), stroke (18%), and cancer (16%).2,3 Despite this, depression often remains undiagnosed and untreated, which exacerbates existing medical conditions and is associated with poor quality of life, functional impairments, disease-related complications, and increased risk of suicidality and all-cause mortality.4–9 Thus, early diagnosis and prompt treatment will improve the quality of life of those with medical and psychiatric comorbidities and reduce the burden of depression. The U.S. Preventive Services Task Force (USPSTF) currently recommends depression and suicide screenings for adults, including older adults over 65 years and pregnant and postpartum women in primary care settings. 10
Historically, diagnosis of depression is based on clinician-administered and self-report questionnaires related to mood, anhedonia, sleep, and appetite, completed during medical appointments or research visits. 11 This mode of evaluation overlooks daily behavioral patterns and is often influenced by recall, reporting (patients and clinicians), and mode of administration (unintentional or intentional patient or clinician biases) biases and also places burden on patients. 12 Additionally, most cases of depression remain undiagnosed due to delays in seeking care, stigma, and a lack of mental health awareness. 13 Thus, there is a need for scalable tools capable of continuously capturing behavioral and self-reported data relevant to mood and functioning in real-world settings. Integration of tools that collect data on daily behavioral patterns and mood-related symptoms into clinical research studies will help researchers identify gaps in clinical practice. Such tools may also help researchers better understand temporal relationships between behavioral changes and mood-related symptoms. 14
Digital phenotyping refers to the continuous collection of behavioral, psychological, and physiological data using a smartphone application, smart devices, or sensors. This data will provide insights into human behavior and allow for monitoring of daily fluctuations in behavioral patterns.15,16 This method enables the collection of comprehensive and dynamic information related to social activities, current mood symptoms, and overall health. In the United States, 98% of adults use cell phones, with smartphones, primarily the iPhone operating system (iOS, Apple) and Android devices, accounting for over 97% of all cell phone users.17,18 Smartphones can passively capture behavioral data, such as activity levels using step count, social media engagement, and indicators of social connectedness via Wi-Fi networks, text messages, and call logs. Active data can also be collected using software applications that require users to record their responses to questions on current mood and health.19,20 The ease of collecting passive data without any input or effort from a user makes it ideal to assess factors associated with mental health, such as activity levels and involvement in social activities. 21 Digital phenotyping has shown promise in identifying behavioral patterns related to anxiety, stress, and mild depression. 15 For example, passive Global Positioning System (GPS) data revealed that individuals with social anxiety or depression tend to visit fewer locations and spend more time at home than those without these conditions.15,22–24 To our knowledge, prior research has not examined how multi sensor-derived behavioral patterns relate to changes in specific depressive symptoms and correlates of depression (e.g., sleep) over extended periods. 15
The primary goal of this manuscript is to present the design, development, methodological framework, and pilot implementation of our Mobile Health Application (mHealth) (Principal Investigator: Dr. Madhukar H. Trivedi). The mHealth application is an open-source, scalable mobile application (Apple and Android) that collects active and passive data. While mHealth currently collects a focused list of passive data (GPS, accelerometer, call log, text log, application usage, and network connectivity), the platform is built for easy expansion to other passive measurements (including wearable data). We describe the technical architecture, implementation framework, participant engagement patterns, and feasibility of integrating passive and active smartphone-derived data collection into an ongoing longitudinal research cohort. In this article, we present sample data from the various sensors for illustration purposes and the rationale behind the design choice.
Methods
Study design
This is a pilot testing of our mHealth application to assess feasibility in a subgroup of participants enrolled in the Texas Resilience Against Depression (T-RAD) study, a longitudinal study of mood disorders at the University of Texas Southwestern Medical Center (UTSW), Dallas, TX. The pilot phase began in 2024, is still ongoing, and estimated to be completed by the end of 2026. An overview of the T-RAD study description and the pilot phase is provided in the sections below. The institutional review board (IRB) at UTSW approved the T-RAD study protocols (D2K: STU 112015-021 and RAD: STU 062016-042).
Overview
The mHealth application, a cutting-edge mobile application built for iOS and Android, was developed using Xamarin (a free, open-source framework for building mobile apps for iOS and Android) with pages for the user to view account information, access their personalized feed, view the results from the active and passive data over the past two weeks, and links to resources for mental wellness. In the subsections below, we describe the key characteristics of the application, its integration with clinical data (including the pilot testing phase), data security, and analytical workflow. The primary feasibility endpoints of the pilot phase are to ensure successful capture of at least three months of continuous passive data (particularly phone application usage) and the completion of at least one daily survey for three months. The open-source framework of this application enables inclusion of other passive measures, such as sleep, exercise, and additional device-related measures (such as the number of times the phone is unlocked) in future releases of the mHealth application. We followed general STROBE (Strengthening the Reporting of Observational Studies in Epidemiology) principles for observational research and CONSORT-EHEALTH (Consolidated Standards of Reporting Trials of Electronic and Mobile HEalth Applications and onLine TeleHealth) guidelines. 25
Characteristics of the mHealth application
mHealth has two main components: a mobile application that collects passive data (steps, distance travelled, GPS, Wi-Fi network connections, application usage, and phone and text logs) and active data (four mood questions sent twice daily), and a web-based administrative platform (Figure 1). The mHealth application was first released in 2024 on iOS mobile devices, with extensive testing first performed by the developers and team members. The Android version of mHealth was first released in late Spring of 2025 and is still undergoing testing. The mHealth data is stored on secure servers in the data hall at UTSW. Overview of the mHealth Application. mHealth has two main components: a mobile application that collects passive data (steps, distance travelled, GPS, Wi-Fi network connections, application usage, and phone and text logs) and active data (four mood questions sent twice daily), and a web-based administrative platform. The mHealth data is stored on secure servers in the data hall at the University of Texas Southwestern Medical Center (UTSW).
The mHealth application has four pages: (1) Learn page which displays customized content and tips, (2) Feed page which lists activities to be completed and information sent from the administrators, (3) Data page which summarizes the data (active and passive) being collected in the form of charts and tables, and (4) Account page which provides personal information and application settings.
The web-based administrative portal was released in conjunction with the iOS application. The portal offers extensive features, including user management, data and analytics, and learning and tips. Tips are categorized into seven categories (mood, sleep, social, coping, nutrition, physical wellness, and goal settings). These tips can be sent to an individual or a group, either instantly or scheduled for a particular time of day. Several tips are predefined within the portal (e.g., “Spend some time outside! Sunshine and nature have been found to increase energy levels and boost mood.”), and new tips are added frequently to the system.
Integration with clinical data
After testing mHealth internally, the iOS version was available to clinical study participants enrolled in the Texas Resilience Against Depression (T-RAD) study26,27 who consented to data collection. The T-RAD study has two study arms, D2K (participants with a past or current diagnosis of MDD or bipolar disorder, ages 10 or older) and RAD (participants at risk for mood disorders, ages between 10 and 24). The T-RAD study participants complete comprehensive in-person visits every 3 months and brief remote surveys monthly. In addition to the in-person and remote assessments, participants who consented to being part of the mHealth sub-study are registered in the mHealth application (Figure 2). Texas resilience against depression study (T-RAD) timeline.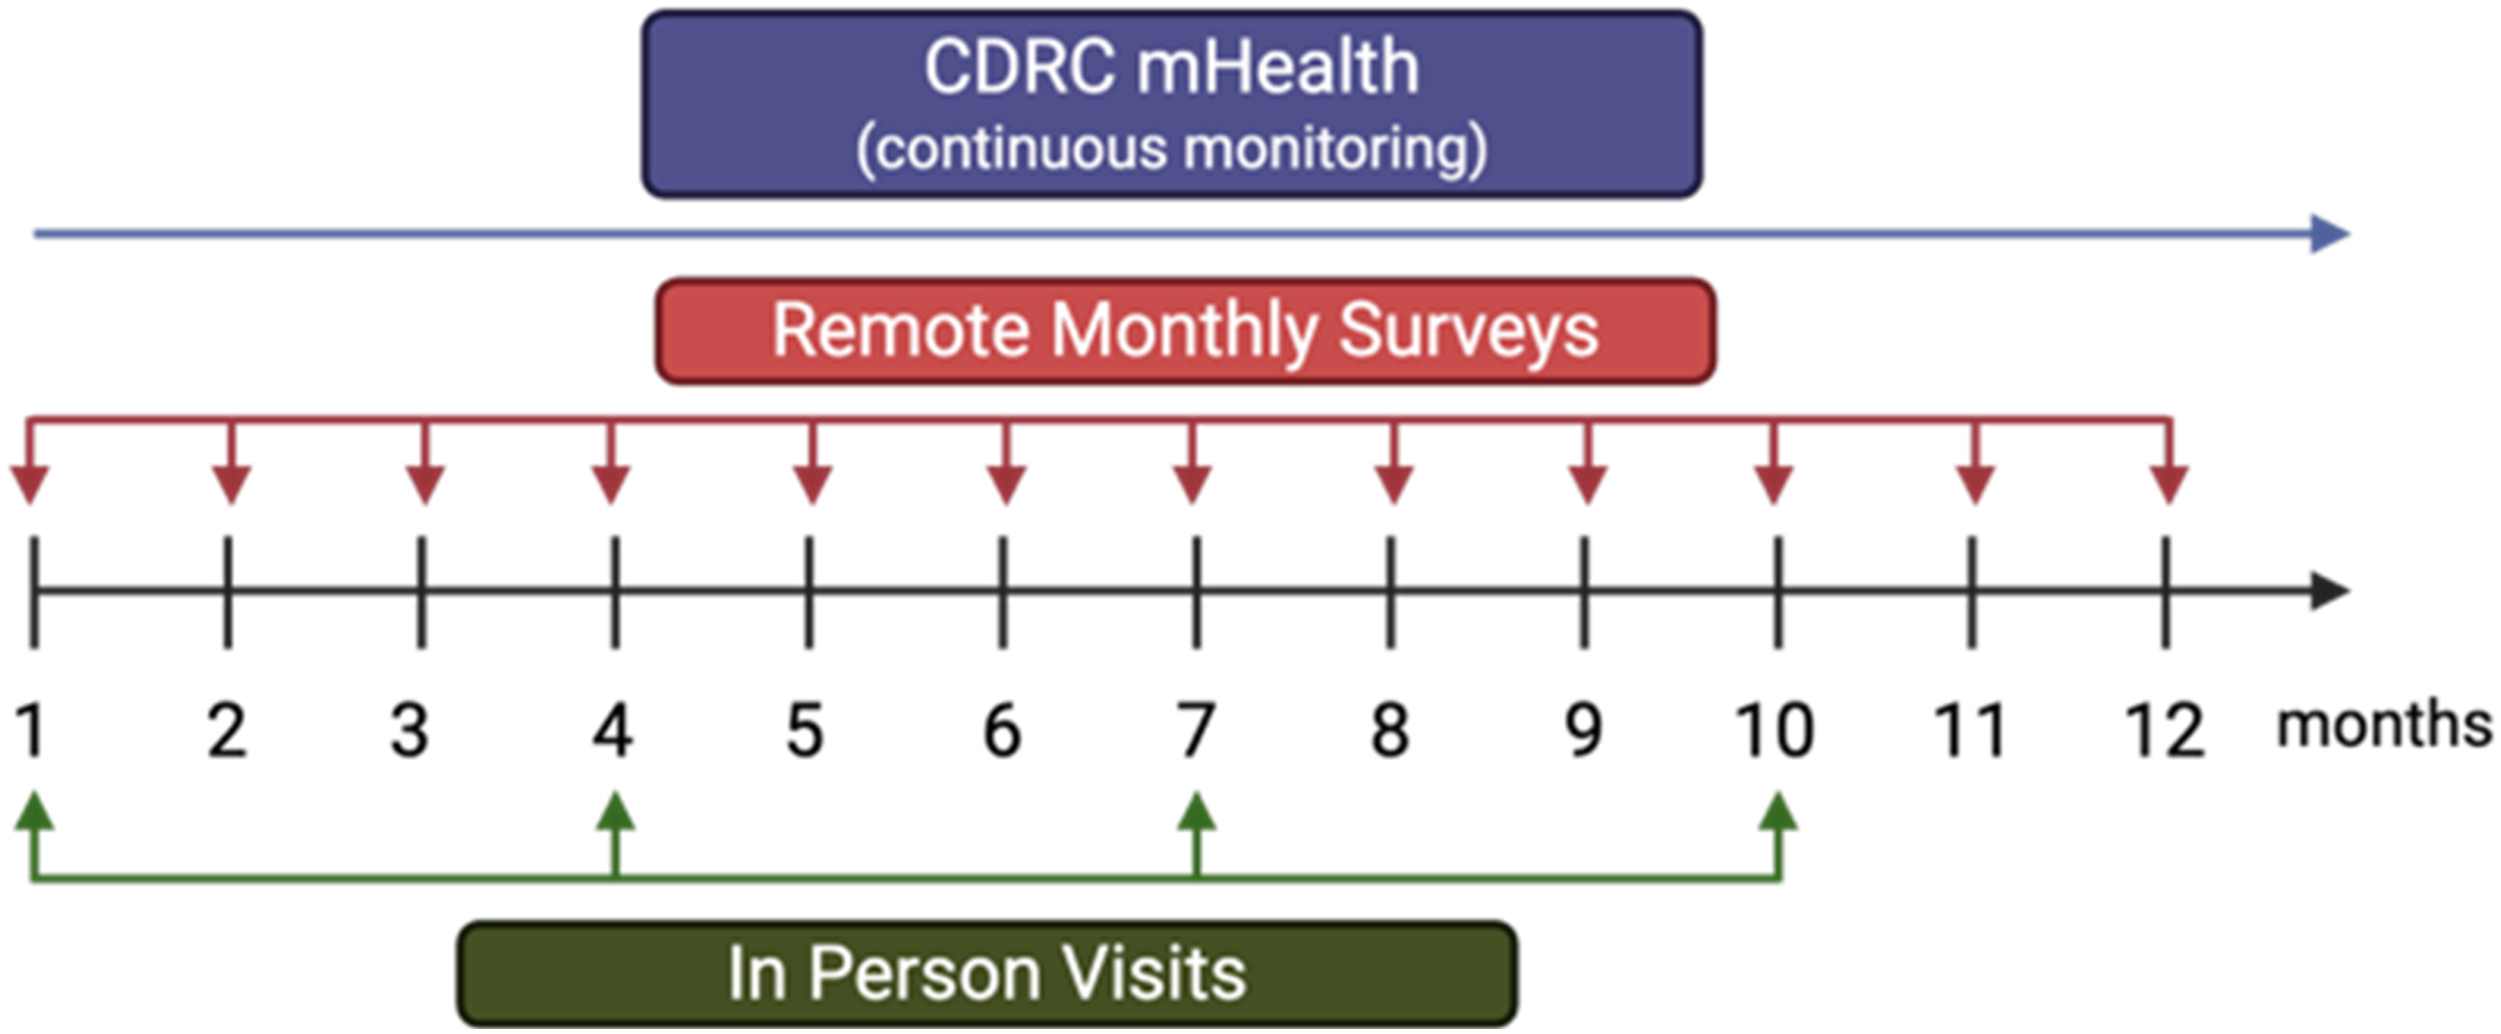
During the consenting process, both existing and new participants are informed that they can opt in or out of the mHealth substudy at any time, and that their choice would have no impact on their participation in D2K and RAD. Details about the types of data collected and the phone permissions required are also explained during this process. Once consent is completed, participants receive instructions for installing the application. During installation, participants are prompted to grant the necessary phone-level permissions, which are managed through the device’s system settings rather than within the application. Although these permissions can be changed after installation, full permissions are required for participation in the substudy.
In the mHealth administrative platform, the participant’s first name, last name, and email address are used to register participants. The participant identifier within the mHealth platform is a consecutive running number starting from 1. Once a new participant is registered on the mHealth web-based platform, the next consecutive running number is assigned to the participant. This number is then entered into the respective study’s Research Electronic Data Capture (REDCap) project. 28 Thus, for analytics, deidentified mHealth data can be linked to clinical REDCap data seamlessly. This backend process enables merging the core demographic variables (e.g., age at consent, sex, race, ethnicity), clinical features (baseline measures of depression, anxiety, and anhedonia) and biological data (such as neuroimaging and cognitive data) with the mHealth dataset.
Data encryption, security, and privacy
Once enrolled, an automated email is sent to the participant with a link to the application and a unique access code. Data is encrypted in transit from the mobile device to the UTSW server using Hypertext Transfer Protocol Secure (HTTPS) connections with a Secure Sockets Layer (SSL) certificate supplied by UTSW. Access to the Application Programming Interface (API) is restricted by user login. When a user completes the login activity, it generates a JavaScript Object Notation (JSON) Web Token, which the mHealth App uses to communicate with the API securely.
Once the mHealth application is installed on an iOS device, the user must approve the collection of data using multiple sensors, including the research sensor and usage data, prior to using the application. Research sensor and usage data are divided into three sections: device usage, message usage, and phone usage. The ‘device usage’ feature records the type and number of applications that are used but not the specific names of the applications. The ‘message usage’ feature records the total number of messages (sent and received) and the number of unique individuals that are contacted but not the names, phone numbers, and the content of the messages. The ‘phone usage’ feature records the number of incoming and outgoing calls, and the number of unique people that have been contacted but not personal identifiers (names and phone numbers) from the call records. Information on the three components of the iOS research sensor and usage data, and a request for approval are presented to the participant. Only when the participant grants permission to all three areas can the mHealth application be accessed.
Data analysis
Data from the mood surveys are collected as numerical data, which are then mapped to the respective outcome and presented as a line graph in the two platforms to track mood symptoms over time (Figure 3). The passive data (pedometer, GPS, calls & text, location networks, and phone usage) are minimally processed to get the necessary data for display within the application and in the administrative portal (Figure 3). Briefly, the sensor-level raw data are extracted from the smartphones and uploaded to the UTSW server, with a timestamp in coordinated universal time (UTC). The created, start, and end date and time fields are available for call logs, text logs, application usage, and pedometer. For GPS data, only the created date field is available. Distance travelled (reported in meters) is computed using the latitude and longitude coordinates from the last location and current location (where the last and current location is derived from the ‘created’ date field). Using the ‘created’ date (GPS) and ‘start/end’ date (calls, text, pedometer, application usage), daily summarized information is computed and presented on the web-based portal and mobile application. Data are updated on the web-based portal and mobile application hourly. Active data of a participant enrolled in the mHealth pilot: Sample data from a participant enrolled in the mHealth pilot using an iPhone from January to June 2025 are provided. The color of the lines indicates the time of date the surveys were sent, namely purple (a.m.) and green (p.m.).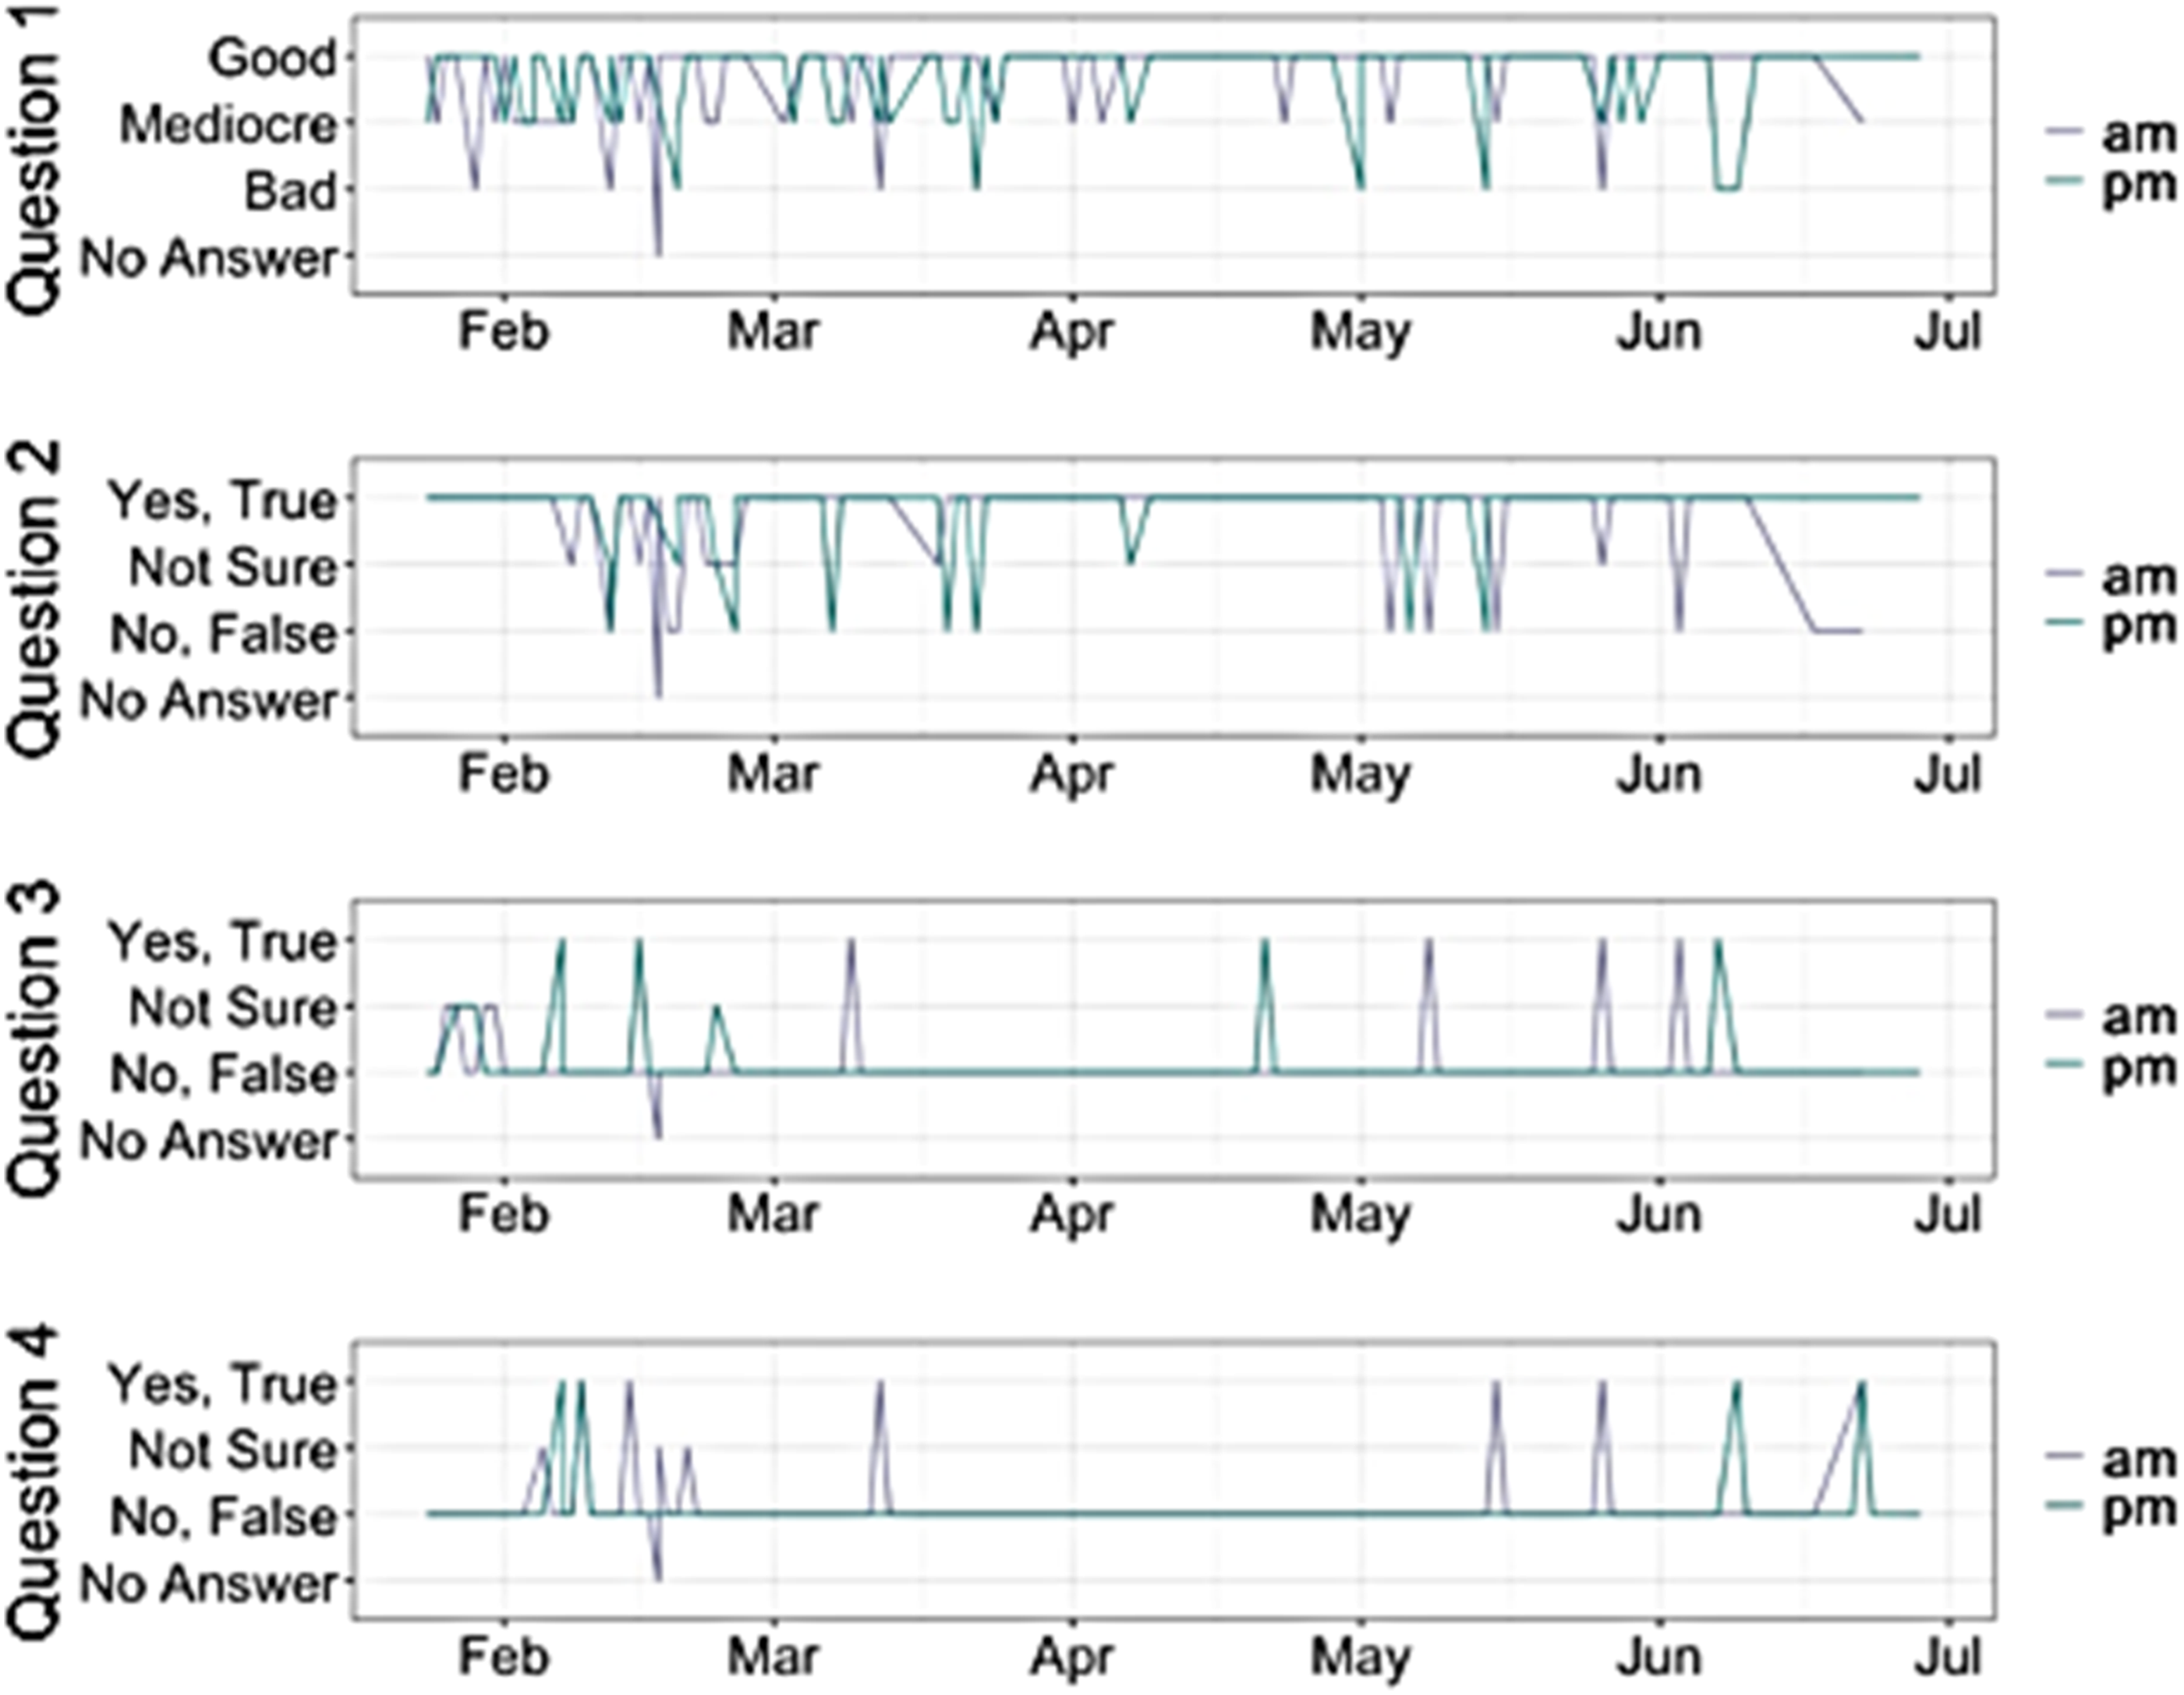
Data will be subjected to quality-control procedures and preprocessing to ensure accuracy, completeness, and consistency prior to analyses. Missing data will be evaluated through sensitivity analysis using varying missingness thresholds to determine which data should be retained, which can be imputed, and which should be excluded.29,30 GPS data will be analyzed using the Deep Phenotyping of Location (DPLocate) pipeline, which allows extraction of multiple mobility-related indices. 31 This pipeline applies temporal and spatial filters to clean the data and identify frequently visited locations, enabling estimation of metrics such as distance from home, radius of movement, and number of places visited.
Future investigations will evaluate whether combinations of passive and active measures demonstrate potential associations with depressive symptoms and related clinical outcomes. The initial analysis will involve clustering time-series data and examining associations between the data-driven clusters and depressive symptoms.
Example data from the mHealth application
The primary analytic objective of the current manuscript is descriptive feasibility (enrollment patterns, participant engagement, and acceptability). The current manuscript does not include hypothesis-driven or inferential statistical analyses. In addition, the overall purpose of the pilot phase is to evaluate feasibility, rather than testing hypotheses, as well as to investigate a broad range of passive markers and their interaction with depressive symptoms. Thus, sample size determination and power calculations were not conducted.
Data from a participant with at least three consecutive months of data was selected to illustrate the active and passive data outputs generated by the application. For statistical analyses, all data will be processed following the steps outlined in the data analysis section above prior to conducting any statistical modeling. The illustrative case example is provided solely to demonstrate the platform’s functionality and is not intended to support generalized conclusions.
Results
Pilot phase
Demographics and engagement metrices for the mHealth pilot sample.

SD – Standard Deviation.
For participants who attended in-person, coordinators assisted them in setting up the mHealth application on their smartphone. For those completing assessments remotely, an installation video was sent by secure email to guide them through the installation process. Once the participant’s mHealth account was active, the study coordinators reviewed the administrative portal weekly to ensure that the diverse types of data were collected. If data were not being collected, the study coordinators contacted the participants to troubleshoot the application. The two most common solutions to the lack of data collection were reinstalling the application and ensuring that the participants logged in to the application weekly to synchronize the data between the smart phone and mHealth application. The two major updates occurred in March 2025 and September 2025, both of which required participants to reinstall the application. It is important to note, however, that while the application continued to function on older versions, the sensor-level data was not extracted correctly. During each update, participants received a notification instructing them to reinstall the application and log in again. Additionally, during the implementation of the mHealth application, intermittent outages occurred; outages lasting longer than 24 hours were communicated to the participants.
Among early iOS pilot participants, application usage remained relatively stable during the first three months, although engagement fluctuated over longer follow-up periods. Longer-term use of the application will allow us to gain insights into the potential reasons for periods of reduced engagement followed by re-engagement. We continue to request general feedback from the participants during in-person visits to improve the mHealth application. One of the main concerns was the limited time range that the surveys were required to be completed. Initially, the survey window completion time was 7 a.m. to 9 a.m. and 5 p.m. to 7 p.m. Participants reported that the time windows often overlapped with getting to and from work or getting kids to/from school. The windows were increased to four hours and were revised to 7 a.m. to 11 a.m. and 5 p.m. to 9 p.m. Participants also reported a lack of motivation to use the application, which was addressed by sending reminders and tips to the participants routinely. These brief, yet informative tips motivated users to continue using the application.
Available data types in mHealth
Active data
mHealth is designed to overcome challenges in patient engagement by presenting individuals with four brief surveys twice daily (7 a.m. and 5 p.m.) with only three answer choices, and a four-hour completion window, which is designed for quick completion and minimal effort. The mood surveys are brief and intended to target the core features of depression, namely mood (current mood), anhedonia (ability to derive pleasure from activities), irritability (feeling easily annoyed and angered), and anxiety (feeling worried and dreadful). The responses to these brief questions will allow us to capture daily fluctuations in one’s mental health. However, these brief questions are not validated scales, making it imperative for future work to compare them against standard measures, such as the Patient Health Questionnaire-9 (PHQ-9) (deployed within the application).
For the mood question (Question 1), answer options are displayed as three emoticons (smiling face, neutral face, and sad face). For the other three questions, the three answer choices are ‘Yes, True,’ ‘Not Sure,’ and ‘No, False.’ Figure 3 shows an example of the responses to the four questions for one individual from January to June 2025. This example illustrates how behavioral patterns fluctuate over time, a key feature to consider when evaluating the relationship between passive monitoring and mood changes.
Distance travelled using GPS and accelerometer
Using the GPS and accelerometer sensors, the mHealth application captures the number of steps, as well as latitude and longitude. Latitude and longitude are used to capture distance travelled and are stored in six decimal places, which equates to accuracy within 111 millimeters (mm). Data are retrieved after 30 seconds or after traveling 50 meters or more, whichever occurs first. Distance between coordinates was calculated using the haversine method, which estimates the shortest distance between two points on a sphere based on their latitude and longitude. These calculations were performed using the distHaversine function from the geospehere R package. 32 Filtering for implausible speeds was not applied on the administrative portal; however, such filtering may be incorporated during analysis, depending on the specific research question.
To illustrate the GPS data extracted from the application, a map was generated to display the locations visited by a participant from January to June 2025 (Figure 4(a)). This visualization enabled identification of the frequently visited locations, infrequently visited locations, and the furthest distance travelled (Figure 4(b)). Passive data of a participant enrolled in the mHealth pilot: Sample passive data from a participant enrolled in the mHealth pilot using an iPhone from January to June 2025 are provided. (A) GPS data showing places visited. (B) Distance travelled. (C) Number of Wi-Fi network connections. (D) Minutes spent using the different iOS categories of applications. The colors of the lines correspond to the different iOS categories of applications. (E) Volume of incoming and outgoing text messages, and the number of unique contacts. The colors of the circles correspond to incoming (blue), outgoing (green), and number of unique contacts (pink). The size of the circle corresponds to the number of incoming and outgoing text, and number of unique contacts per day.
Network connectivity via Wi-Fi
The mHealth application scans Wi-Fi signals to estimate time spent indoors at various locations and determine whether the participant is around other individuals. Wi-Fi scans include 2.4 GHz, 5 GHz, and 6 GHz frequency bands. The mHealth app captures the name of the network with the timestamp hourly. Number of unique connections was defined as the count of distinct Internet Protocol (IP) addresses detected within a specific period. An example of Wi-Fi network connectivity patterns over time that can be extracted from the application is shown in Figure 4(c).
Device usage
Apple and Android devices generate different levels of application-use data. On Apple devices, applications are grouped into broader categories such as social networking whereas Android devices report the names of the individual applications directly. The analytical plan for the mHealth application data includes mapping Android application names into the corresponding Apple iOS categories to ensure comparability across platforms. An example of Apple-level application data from a participant is shown in Figure 4(d).
Phone calls and text messages
The mHealth app captures anonymized phone call logs and text messages hourly. These call and message logs contain the number of incoming and outgoing calls or messages, call duration, and the number of unique contacts. An example mHealth phone calls and text message data from a participant is shown in Figure 4(e).
Discussion
Research over the past decade has shown that factors including social media usage and preference for solitude are associated with depressive symptoms. However, there is an unmet need for an open-source platform for digital phenotyping that is flexible to handle various active and passive measures, and one that can be adaptable to different study designs and institutional requirements. The quantitative data presented in this manuscript highlights the mHealth application’s capabilities and demonstrates how data can be captured remotely and processed. We demonstrate the feasibility of data collection and implementation of the mHealth application in a highly engaged subset of T-RAD study participants. Further, we provide a framework for seamless integration of the application into clinical research study design. The mHealth application has thus far shown to be a robust open-source mobile application that will enhance mental health research and be flexible to different study designs.
A major concern about collecting passive data from smartphones is data privacy and security. 33 The rates of willingness to participate in studies involving passive data collection vary drastically from 5% to 67%. 34 This variation in willingness to consent to passive data collection is attributed to the type of data being collected and data security. For example, in a group of smartphone users, 39% agreed to share their GPS location while only 28% agreed to share information about phone usage. 35 We addressed this challenge by ensuring that the mHealth data are encrypted in transit from the mobile devices to the UTSW server using HTTPS connections with an SSL certificate and securing access to the API. All data processing remains within the UTSW infrastructure and is secured through HTTPS/SSL protocols and token-based API access. Further, the mHealth platform assigns a unique identification number to users that can then be linked to their study’s REDCap record, thus enabling deidentification and seamless integration into clinical data.
Android and Apple devices have different privacy features and controls. For Android devices, the specific names of applications used are recorded and shared with mHealth. For iOS devices, the applications are classified into 25 categories (e.g., Books, Business, Education, Entertainment, Social Networking, Sports, and Travel). Thus, Android has the potential for richer application-level data than Apple iOS. However, since Apple provides the categories that the applications are classified into, the data provided by Android can easily be summarized in the same manner (e.g., summarize the applications that iOS considers as social media on Android to equate to the time spent on social media applications).
One of the main challenges in the use of mobile applications for passive and active data collection is patient engagement. 36 During the consenting process in the pilot phase of mHealth, the participants were informed of the purpose of collecting passive and active data. This included information on how the data would then be integrated with the biological data, clinician assessments, and self-reported assessments to better understand the features associated with depressive symptoms, depression onset, and resilience. This information was delivered to the pilot group of participants to encourage continuous use of mHealth. Once the pilot phase ends, drop-off rates will be carefully monitored to ensure sufficient data is captured to achieve the study’s goals. We also promoted patient engagement by delivering four brief questions twice daily to assess the presence of depressive symptoms. The intention behind the brief nature of the four questions is for participants to provide a quick gut instinct response to how they are feeling rather than dwelling on the questions. However, the application can easily be expanded to include additional active data collection. For example, the Patient Health Questionnaire (PHQ-9), 37 a brief nine-item questionnaire used to assess depression severity, can be added to the application to track depression severity regularly.
The mHealth data of an individual enrolled in the T-RAD study indicated that the participant did not experience depressive symptoms (sad mood, anhedonia, irritability, and anxiety) most of the time from January to June 2025. The participant’s mHealth data also revealed travel patterns, Wi-Fi connectivity patterns, and phone usage for calls and text messages during the six months. The breadth of data collected through mHealth creates opportunities for future studies examining relationships between behavioral patterns, social connectedness, and mood-related outcomes. Social connectedness has been shown to promote mental and physical well-being,38,39 and is often reflective of a person’s current mood.40–42 Feeling socially connected as an adolescent is crucial for their well-being and identity. 43 Apart from physical interactions, digital spaces are avenues to exchange ideas and maintain social and emotional connections with friends.44,45 Beyond social media usage, text messaging and phone calls are avenues to engage with peers and friends. In a previous study, adolescents reported that they felt more connected with their peers when they communicated by video calls, texting, or social media, but not by phone calls. 46 In addition to assessing phone usage, the number of Wi-Fi connections can be used as a proxy for assessing physical interactions. Smartphones can connect to Wi-Fi networks at public places (e.g., restaurants, airports, gyms), at workplaces, or at friends’ homes. Thus, an increased number of connections may be associated with increased physical interactions and less isolated phone usage. While individuals may also have Wi-Fi at home (indicating potential lack of social interactions), by linking GPS data and Wi-Fi connections, how much time a participant spends in various locations (even if that location has multiple Wi-Fi signals) can be determined. Previous studies have examined the relationship between phone use and depression,15,47 with some studies reporting that depression and anxiety are risk factors that lead to problematic phone usage.48,49 Previous studies have also noted that depression and anxiety were the consequences of problematic cell phone use.50–52 Our case observations presented in this manuscript provide an overview of the mHealth data and highlight the opportunities to integrate with clinical data. A key strength of our application is its integration with a well-characterized and deeply phenotyped observational longitudinal cohort. Thus, our platform enables linking passive and active digital markers to clinical and biological data, thereby enhancing the scientific value of digital phenotyping using mHealth application. Further investigations using the mHealth app to track daily patterns in phone usage will help understand the associations between cell phone use, social connectedness, and depressive symptoms. Additionally, longitudinal data from the RAD (at risk of mood disorders) participants may support future investigations examining whether temporal changes in passive behavioral patterns are associated with subsequent mood symptom trajectories.
Limitations
There are several limitations associated with the implementation of the mHealth application. First, the pilot participants were invited based on their active engagement in completing monthly remote surveys in the T-RAD study. This enrichment strategy likely selected for individuals with higher engagement and adherence, and thus, the observed 90% engagement rate in the first three months may overestimate real-world engagement. These findings are not representative of all T-RAD study participants and may not be generalizable to broader or less engaged populations. The primary objective of this pilot study is to demonstrate the feasibility of data collection using the application in an engaged subgroup, rather than to establish population-level uptake. Second, the pilot phase was dominated by Apple users, resulting in limited data from Android users and insufficient information regarding the quality of data from Android devices. Finally, only a single illustrative case was presented. Investigations are ongoing to analyze the data from all participants enrolled in the mHealth substudy, and the data will be reported in future publications.
Next steps
As mHealth undergoes further testing and optimization, future work will prioritize evaluation in more representative and less selectively engaged populations, including individuals with varying levels of adherence, digital literacy, and device usage. Pragmatic study designs, in clinical or community-based settings, will be employed to assess real-world adoption, engagement over time, and barriers to sustained participation. There are opportunities to integrate other sensors, such as fitness trackers, into the data collection. Previous studies have reported associations of higher daily step counts, especially 5000 or more steps, with fewer depressive symptoms, and individuals reporting 7000 or more daily steps exhibited a lower risk of depression. 53 During the development phase, we faced challenges in setting up the mobile application, including obtaining the necessary permissions from Apple and Android, determining the optimal method to compute daily metrics, and delineating the different metrics from different smartphone operating systems. Over the past two years, we resolved these issues, and thus, other passive sensors can be added in future as possible data points (that can be easily turned off or on in various SQL databases) seamlessly. By linking to fitness trackers, there are opportunities to include heart rate, respiratory rate, calories burnt, time asleep, time awake, and time in various sleep cycles.
Conclusion
The mHealth is an open-source, scalable mobile application (Apple and Android) that collects active and passive data. While this work demonstrates technical feasibility and user acceptability in a selected subgroup of T-RAD study participants, further research is needed to establish its utility. While mHealth currently collects GPS, accelerometer, call log, text log, application usage, and network connectivity data, the platform is built for easy expansion to other passive measurements (including wearable data). In addition to passive data collection, the mHealth application collects active data through four brief questions. As the mHealth application is a robust open-source mobile application, it can be adapted to different study designs. Our mHealth application allows continuous and real-time data collection, ensures privacy, and provides useful information related to mental wellness, thereby supporting longitudinal behavioral and symptom data collection within mental health research settings. Further testing and validation using large cohorts will help establish its utility.
Footnotes
Acknowledgements
We thank the participants, their families, staff, and colleagues who made this project possible. We thank Ms. Afrida Khurshid and Ms. Dani Spano for leading the implementation of this project.
ORCID iDs
Ethical considerations
The institutional review board (IRB) at UTSW approved the T-RAD study protocols (D2K: STU 112015-021 and RAD: STU 062016-042).
Consent to participate
The mHealth was released to T-RAD study participants who consented to data collection.
Author contributions
Funding
The authors disclosed receipt of the following financial support for the research, authorship, and/or publication of this article: The D2K study was funded by the Hersh Foundation and the Rose Foundation. The RAD study was funded in part by the W.W. Caruth Jr. Foundation (15-D-56563), the Elizabeth Jordan Harris Foundation, the Rose Foundation, and the Hersh Foundation. The content is solely the responsibility of the authors and does not necessarily represent the official views of the various funding organizations. In addition, this work was funded in part by Dr. Madhukar H. Trivedi. The mHealth application was developed under the leadership of Dr. Madhukar H. Trivedi.
Declaration of conflicting interests
The authors declared the following potential conflicts of interest with respect to the research, authorship, and/or publication of this article:
Data Availability Statement
Data is available upon reasonable request from the corresponding author Dr. Madhukar H. Trivedi.
Statements and declarations
All authors approved the final version of the manuscript before submission.