
Abstract
Background
Patients with chronic lung disease (CLD) are at a significantly increased risk of developing cardiovascular disease (CVD); however, specific risk assessment tools tailored for this high-risk population are currently lacking. This study aimed to develop, validate, and interpret a machine learning model specifically designed to predict the risk of concurrent CVD in patients with CLD.
Methods
Based on the China Health and Retirement Longitudinal Study (CHARLS) cohort, 2,639 patients with CLD were included. Core features were selected using univariate and multivariate logistic regression. Seven machine learning algorithms were systematically compared. After identifying the optimal model, external validation was conducted using the English Longitudinal Study of Ageing (ELSA) cohort (n = 1,303). The SHapley Additive exPlanations (SHAP) framework was employed to interpret the model’s predictive mechanisms, and an interactive web application was developed based on the optimal model.
Results
The study ultimately identified 8 core predictors: age, body mass index (BMI), depression score, hypertension, dyslipidemia, impaired instrumental activities of daily living (IADL), and medication history for lung diseases and lipid-lowering drugs. The XGBoost model demonstrated the best performance, achieving Area Under the Curve (AUC) values of 0.838, 0.797, and 0.695 in the training, testing, and external validation sets, respectively, while exhibiting excellent calibration and clinical net benefit. SHAP analysis revealed that hypertension, depression score, and age were the primary contributing variables, and confirmed a significant synergistic amplification effect between lipid metabolism and psychophysical functional indicators.
Conclusion
The model constructed based on the XGBoost algorithm can accurately and robustly predict CVD risk in patients with CLD. Coupled with SHAP interpretability analysis and the online prediction tool, this study provides reliable digital decision support for CVD risk stratification, early identification, and personalized intervention among patients with CLD in primary care settings.
1. Introduction
Chronic lung diseases (CLD), including chronic obstructive pulmonary disease (COPD), asthma, and interstitial lung disease, represent a group of common chronic conditions characterized by persistent airflow limitation or lung parenchyma damage. In recent years, CLD has emerged as a major global public health challenge due to its increasing contribution to the overall disease burden and mortality rates.1,2 According to the Global Burden of Disease (GBD) 2021 study, COPD is the fourth leading cause of death worldwide, accounting for approximately 3.5 million deaths in 2021, which represents 5% of total global deaths. It is projected that by 2050, the global prevalence of COPD will reach 600 million cases, reflecting a 23% increase compared to 2020.3–5
Beyond respiratory symptoms, patients with CLD frequently suffer from multisystem comorbidities, particularly a significantly elevated risk of cardiovascular disease (CVD). Studies have demonstrated that chronic hypoxia, systemic inflammation, vascular dysfunction, and medication-related adverse effects in patients with CLD synergistically promote the development of atherosclerosis, arrhythmias, and heart failure.6,7 CVD is not only the leading cause of hospitalization and readmission among patients with CLD but also one of the primary causes of non-respiratory-related mortality. 8 Therefore, developing CVD risk prediction models specifically tailored to the CLD population is crucial for the early identification of high-risk individuals and the improvement of long-term prognosis through timely intervention.
Current evidence suggests that various demographic, behavioral, and health-related factors are closely associated with CVD risk. Age and sex serve as fundamental predictors, while lifestyle behaviors such as smoking, alcohol consumption, and sleep disorders are intrinsically linked to cardiovascular outcomes. 9 Furthermore, comorbidities and psychosocial factors—including renal disease, depression, functional impairment, and low life satisfaction—are significantly correlated with adverse cardiovascular events.10–12 Given the high prevalence of these overlapping risk factors in patients with CLD, assessing CVD risk in this population is inherently more complex. Consequently, there is an urgent need for comprehensive prediction models that integrate multidimensional variables to achieve more precise risk stratification and targeted interventions.
Although various CVD risk assessment tools (such as the Framingham Risk Score and QRISK3) have been widely applied in the general population, they do not adequately account for the unique pathophysiological characteristics and comorbidity burdens of patients with CLD, limiting their applicability to this specific group. Some studies have attempted to develop COPD-specific models, such as nomograms based on multivariate logistic regression (integrating traditional risk factors like age, sex, smoking, and hypertension), which have shown some clinical utility. 13 However, these models primarily rely on traditional statistical methods, making it difficult to capture non-linear relationships and complex interactions among variables. Moreover, they frequently lack external validation across different populations, which restricts their generalizability. Thus, more flexible and generalizable modeling strategies are required to improve the accuracy of CVD risk assessment in the CLD population.
Against this backdrop, machine learning (ML) technologies have shown great potential in predicting chronic disease risks due to their strengths in automatic feature selection, modeling complex non-linear relationships, and robust generalization. Recent studies have further explored novel approaches for cardiovascular disease (CVD) risk prediction, providing valuable insights for applying ML in high-risk populations.14–16 Studies indicate that ML algorithms, such as XGBoost, Random Forest, and LightGBM, outperform traditional methods in predicting CVD within the general population. 17 Nevertheless, their application in high-risk subgroups, such as patients with CLD, remains relatively limited. Therefore, it is imperative to develop more targeted and highly accurate prediction models to enhance early risk identification and provide proactive support for clinical decision-making.
In this study, we utilized large-scale data from the China Health and Retirement Longitudinal Study (CHARLS) to develop machine learning-based CVD risk prediction models for the CLD population, integrating multidimensional variables including demographics, lifestyle, and health status. We selected key predictors based on clinical relevance and statistical analysis, comparatively evaluated multiple algorithms, and ultimately identified Extreme Gradient Boosting (XGBoost) as the optimal prediction model. To enhance the model’s robustness and external applicability, we introduced data from the English Longitudinal Study of Ageing (ELSA) for external validation, further confirming the model’s generalizability across diverse populations. Additionally, we employed SHAP analysis to elucidate the impact of key features on the prediction outcomes and developed an interactive online assessment tool using the Shiny framework, demonstrating its practical application potential in primary care and telemedicine settings.
2. Methods
2.1. Data sources and study population
This study utilized harmonized data from Wave 3 (2015) of the China Health and Retirement Longitudinal Study (CHARLS) as the model development cohort. The CHARLS data were accessed from the official CHARLS website after user registration and approval for research use. CHARLS is a nationally representative cohort covering 28 provinces in China and targets adults aged 45 years and older. 18 It systematically collects multidimensional information on demographics, lifestyles, health status, and blood biomarkers.
The inclusion and exclusion criteria for the training cohort in this study were as follows: (1) aged 45 years or older; (2) self-reported physician-diagnosed chronic lung disease or asthma; and (3) complete information on cardiovascular disease status. Participants with missing key variables were excluded. The eligible CHARLS data were randomly partitioned into a training set and a testing set at a ratio of 7:3 for model training and internal validation, respectively.
2.2. Definitions of CLD and CVD
CLD was defined based on self-reported physician diagnoses, which included chronic bronchitis, emphysema, cor pulmonale, or asthma. CVD, serving as the primary outcome variable, was similarly determined based on self-reported physician diagnoses, encompassing heart diseases (e.g., myocardial infarction, angina, heart failure) and stroke. 19
Additionally, the “community_id” variable was utilized to calculate the provincial-level prevalence of CLD and CVD within the CHARLS cohort, and geographic distribution maps were generated using the sf and geojsonio packages in R.
2.3. Covariates
Multidimensional covariates were included to comprehensively assess the risk of incident CVD in patients with CLD. Specifically, these variables comprised:
Sociodemographics and lifestyle: age (continuous variable), sex, educational level, marital status, residence type (urban/rural), annual per capita household expenditure, smoking history, drinking history, and average daily sleep duration.
Physiological, functional, and psychological status: body mass index (BMI), dominant hand grip strength, systolic and diastolic blood pressure, impaired activities of daily living (ADL), impaired instrumental activities of daily living (IADL), hearing/vision impairment, chronic pain, life satisfaction, and depression score.
Comorbidities and medication history: diabetes, hypertension, dyslipidemia (core cardiometabolic comorbidities), as well as the medication history of lung diseases, antihypertensives, lipid-lowering agents, and antidiabetic drugs (binary variables).
Blood biomarkers: 11 core indicators related to cardiometabolic health and systemic inflammation, such as white blood cell count, platelet count, and glycated hemoglobin (HbA1c).
All covariate data were derived from CHARLS questionnaires, physical examinations, or laboratory assays.
2.4. Data cleaning and preprocessing
Standardized data cleaning was performed on the CHARLS dataset. Extreme values of continuous variables were handled using the Winsorization method to minimize the influence of outliers. Missing covariate values were imputed via multiple imputation using predictive mean matching with the mice package (50 iterations, generating 5 datasets that were subsequently pooled). Cross-cohort variables were uniformly recoded, and the consistency of baseline distributions was evaluated using the tableone package.
2.5. Feature selection, model construction, and evaluation
Feature selection was performed in the training set using a logistic-regression-based feature-reduction approach. This approach was adopted to obtain a parsimonious and clinically interpretable predictor set composed of variables that were consistently available across the CHARLS and ELSA cohorts. First, univariable logistic regression analysis was conducted, and variables significantly associated with the CVD outcome (P < 0.05) were included in a multivariable logistic regression model. Variables that remained statistically significant after multivariable adjustment (P < 0.05) were retained as the final feature subset for subsequent machine learning model construction.
Based on this feature subset, seven machine learning models (GLM, SVM, GBM, NNET, RF, XGBoost, and AdaBoost) were constructed using the caret package in R to predict CVD risk in patients with CLD. All models were trained and optimized using 10-fold cross-validation, and the optimal hyperparameter configurations are detailed in Supplementary Table S1. Model performance was comprehensively evaluated using multidimensional metrics, independently assessed across the training, testing, and external validation sets. Specifically, the Area Under the Curve (AUC) and its 95% confidence interval (CI) were calculated using the pROC package to evaluate discrimination. The Brier score (defined as the mean squared difference between predicted probabilities and actual outcomes, ranging from 0 to 1, with values closer to 0 indicating better agreement and higher prediction accuracy) was calculated, and calibration curves were plotted to assess model calibration. Precision-Recall (PR) curves were generated to address potential data class imbalance issues. Finally, Decision Curve Analysis (DCA) was performed using the dcurves package, incorporating 50 bootstrap resamples to calculate the clinical net benefit across different risk thresholds, thereby evaluating the clinical utility of the models.
2.6. SHAP analysis
The SHapley Additive exPlanations (SHAP) method was employed to enhance model interpretability. 20 SHAP values were calculated using the fastshap package and visualized using the shapviz package. First, the global feature importance was demonstrated using a mean absolute SHAP value plot. Second, a SHAP beeswarm plot was utilized to present the distribution of contributions and the direction of impact for each feature at the individual level. Finally, SHAP dependence plots and force plots were generated to elucidate the non-linear effects, interaction effects of core features, and the predictive composition of individual cases, achieving both global and local model interpretation.
2.7. Subgroup analysis
Subgroup analyses were conducted in the combined CHARLS dataset (training and testing sets), stratified by sex (male/female) and age tertiles (divided at the 33rd and 66th percentiles of age within the training set). The AUC was calculated within each subgroup to evaluate model discrimination and verify the model’s robustness across different populations, providing a reference for personalized risk stratification.
2.8. External validation cohort
Data from Wave 7 (2014–2015) of ELSA were used as the external validation cohort. The ELSA data were accessed through the UK Data Service after registration and acceptance of the applicable data use agreement. This cohort, led by University College London, covers the UK population aged 50 years and older. 21 The collected data are highly consistent with those of CHARLS. ELSA received ethical approval from relevant NHS Research Ethics Committees, and all participants in the original survey provided informed consent. Inclusion criteria consistent with the model development cohort were applied, including valid CLD and CVD status information. The ELSA dataset was solely used for validating the CHARLS-trained model and was not internally partitioned. Data cleaning and preprocessing strictly followed the protocols established for the CHARLS cohort. 22
2.9. Development and deployment of the web–based tool
An interactive online prediction tool was developed using the Shiny framework in R and deployed on the shinyapps.io platform. By inputting individual feature variables, this tool can generate real-time CVD predicted risk probabilities based on the optimal machine learning model. It also integrates core feature visualization functions, providing decision support for individualized risk assessment for clinicians and public health professionals, which is particularly applicable in primary care and resource-limited settings.
2.10. Statistical analysis
Among baseline characteristics, continuous variables were expressed as weighted means ± standard deviations (SD), and categorical variables were presented as weighted frequencies and percentages. Group comparisons were performed using the Student's t-test for continuous variables, and the Chi-square test or Fisher’s exact test for categorical variables. Results were reported as odds ratios (OR) with their 95% CI. All statistical tests were two-sided, and a P-value < 0.05 was considered statistically significant. All analyses were conducted using R software (version 4.4.0).
3. Results
3.1. Characteristics of the study population and construction of model datasets
Based on the standardized 2015 CHARLS dataset, this study had an initial sample size of 25,586 individuals. After strict screening (excluding those aged under 45 years and those with missing key variables), a final total of 2,639 patients with CLD were included. Among the patients with CLD, there were 2,337 cases of chronic lung diseases and 976 cases of asthma (including 674 overlapping cases). Concurrently, 903 patients with concurrent cardiovascular disease were identified, comprising 816 cases of heart-related diseases and 141 cases of stroke, with 54 overlapping cases (see Figure 1). Flowchart of participant selection from the CHARLS 2015 dataset.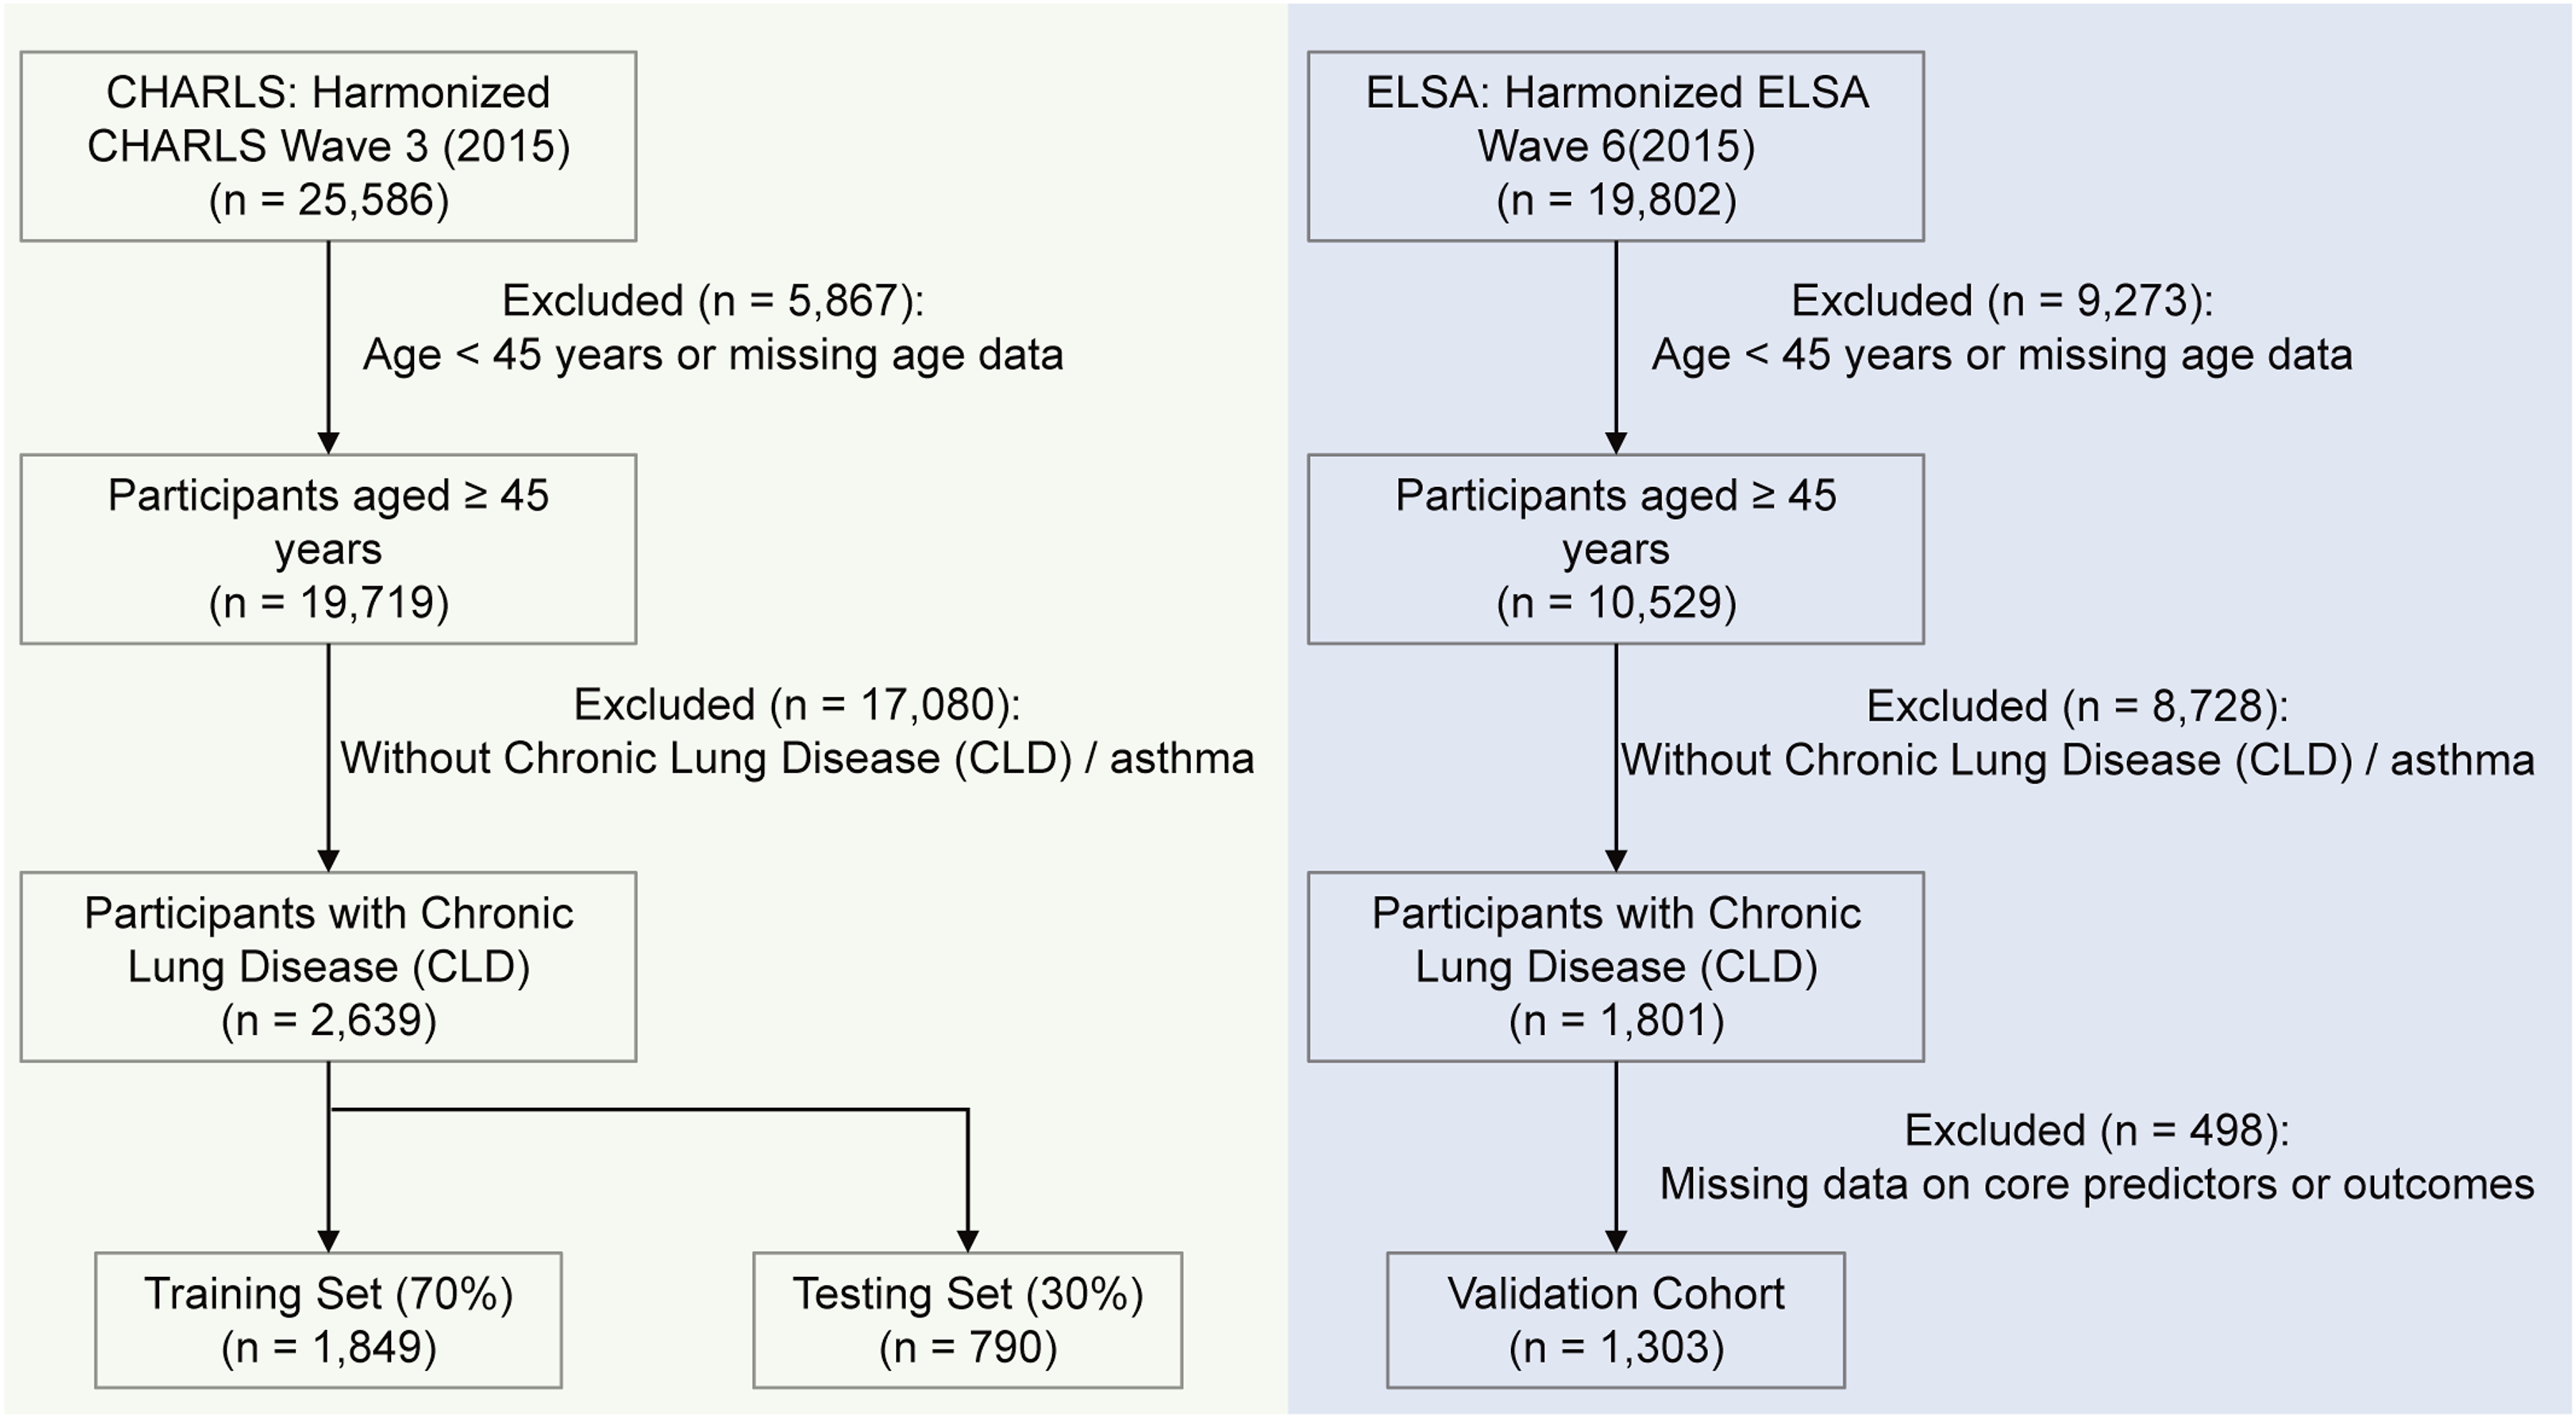
Geographic distribution analysis revealed that CLD was highly prevalent in central and western regions such as Xinjiang and Chongqing, whereas CVD was more common in economically developed or high-latitude regions such as Shanghai and Heilongjiang. This suggests significant regional disparities driven by environmental and socioeconomic factors (Figure 2, Supplementary Table S2, epidemiological distribution of the overall CHARLS 2015 population: n = 25,586; with a total crude prevalence of 2,749 cases for CLD and 6,660 cases for CVD). Geographic distribution of disease prevalence across Chinese provinces. (a) Prevalence of chronic lung disease (CLD) among CHARLS participants by province. (b) Prevalence of cardiovascular disease (CVD) across the same regions.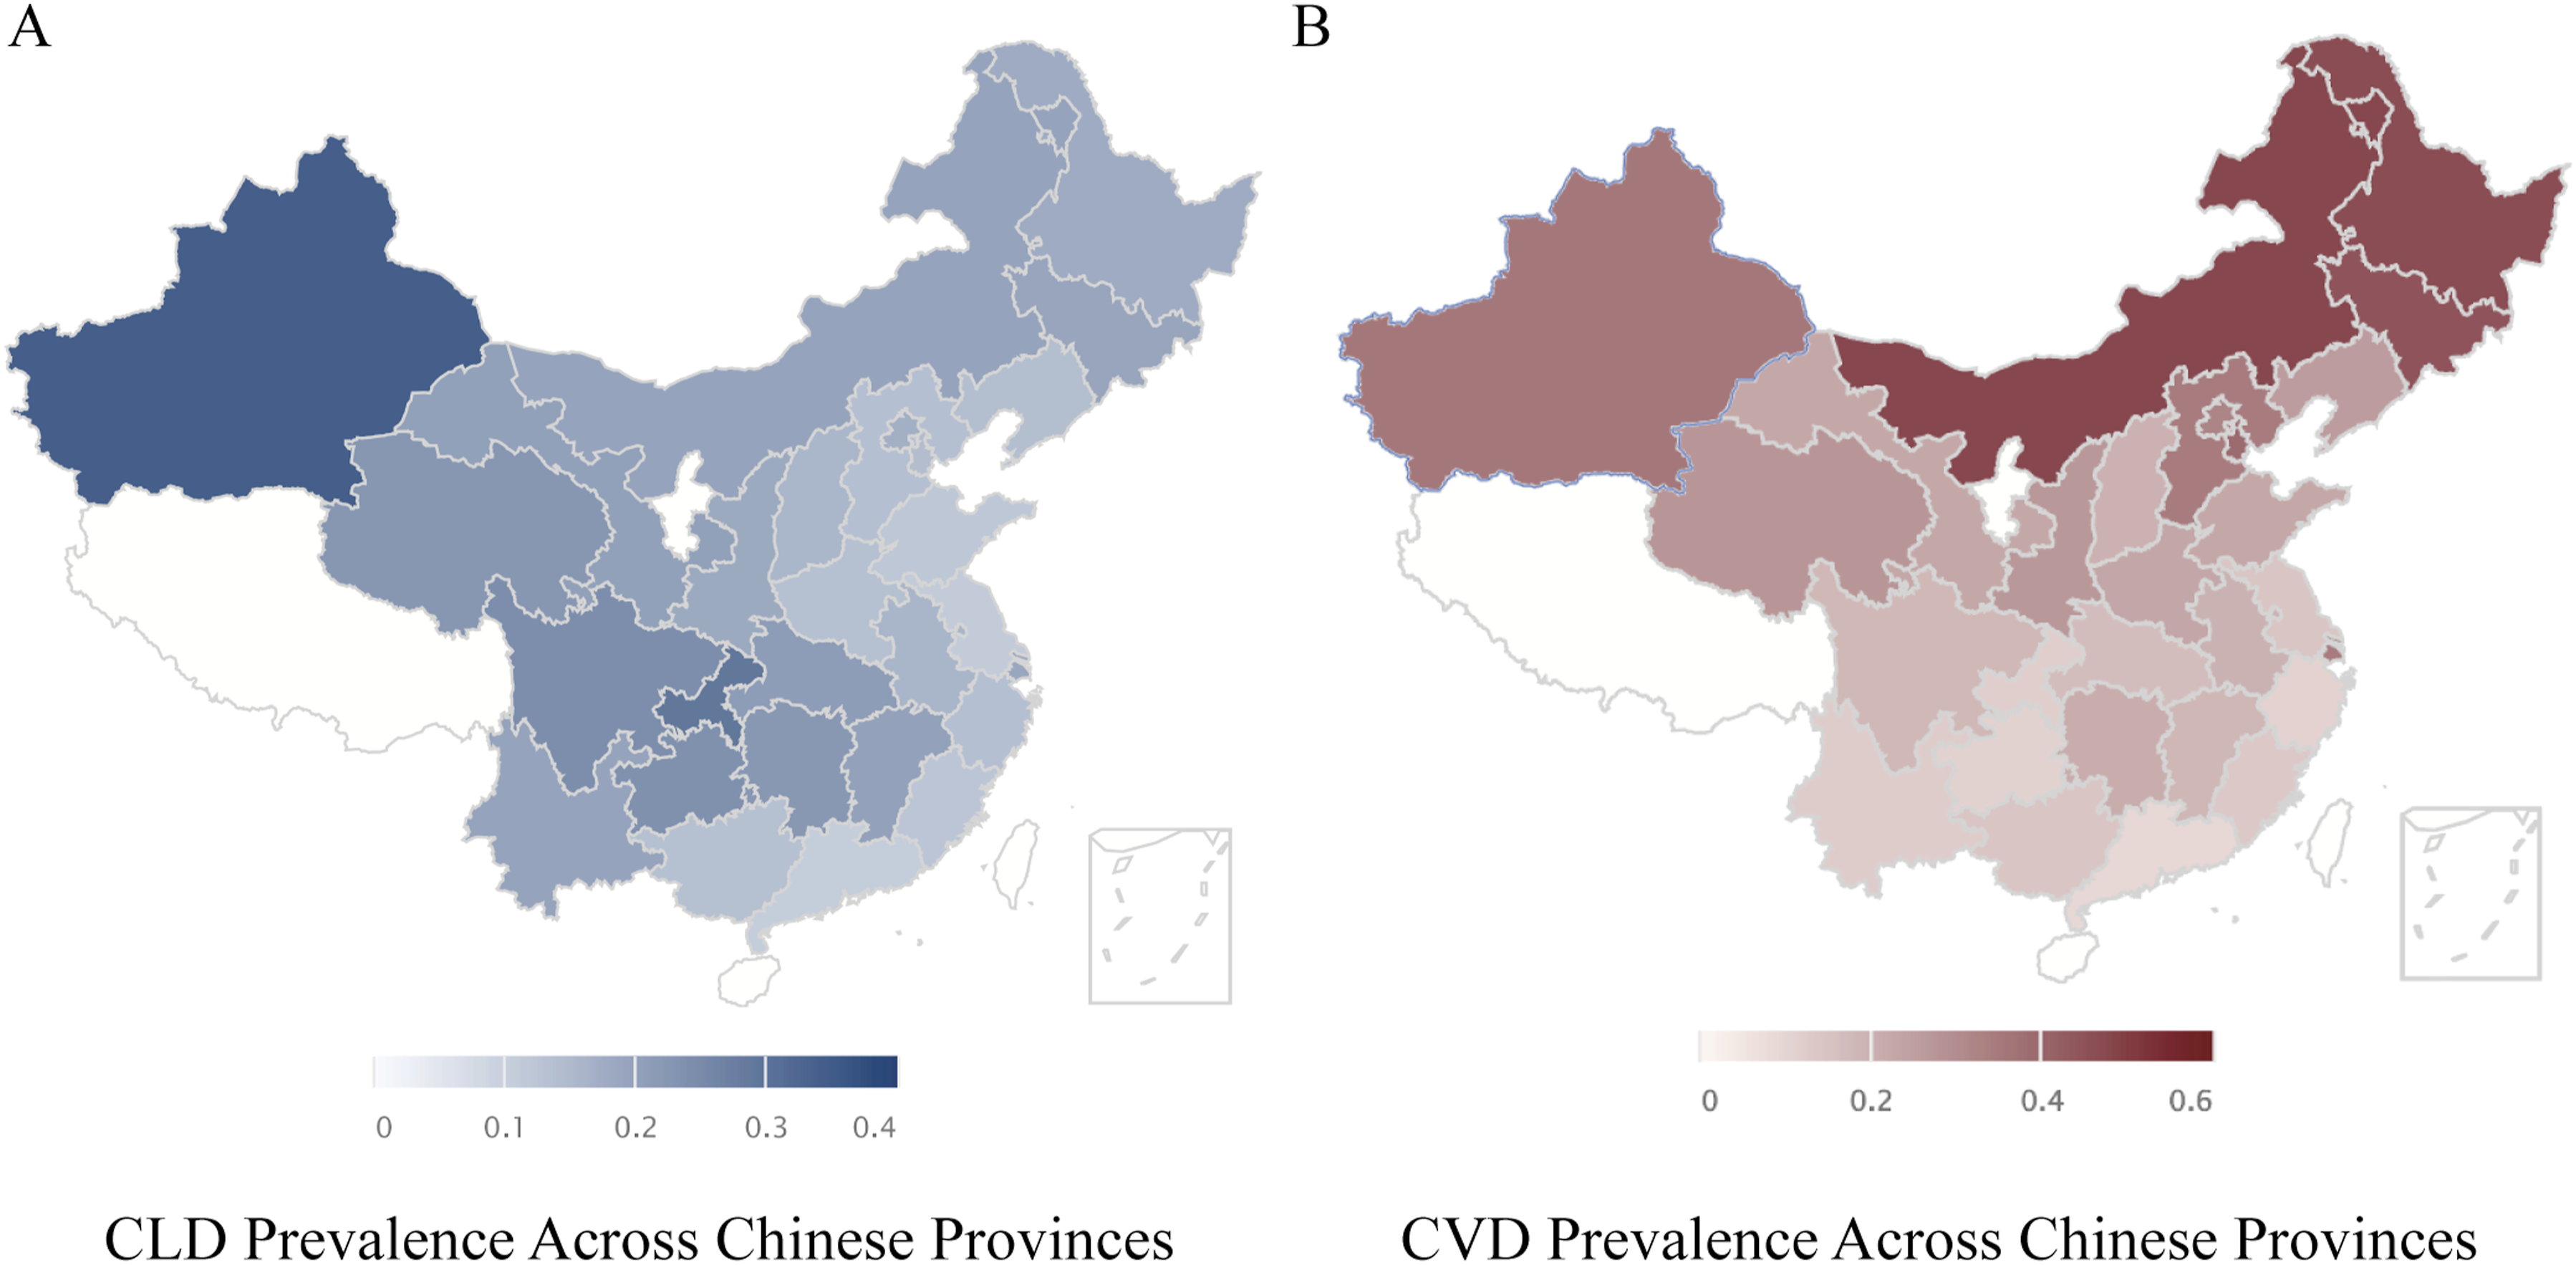
After randomly dividing the enrolled patients into a training set (n = 1,849) and a testing set (n = 790) at a 7:3 ratio, analysis showed that the two groups were highly balanced in the distribution of demographic characteristics, physiological indicators, and biomarkers (all variables P > 0.05), providing a robust foundation for model development (Supplementary Table S3).
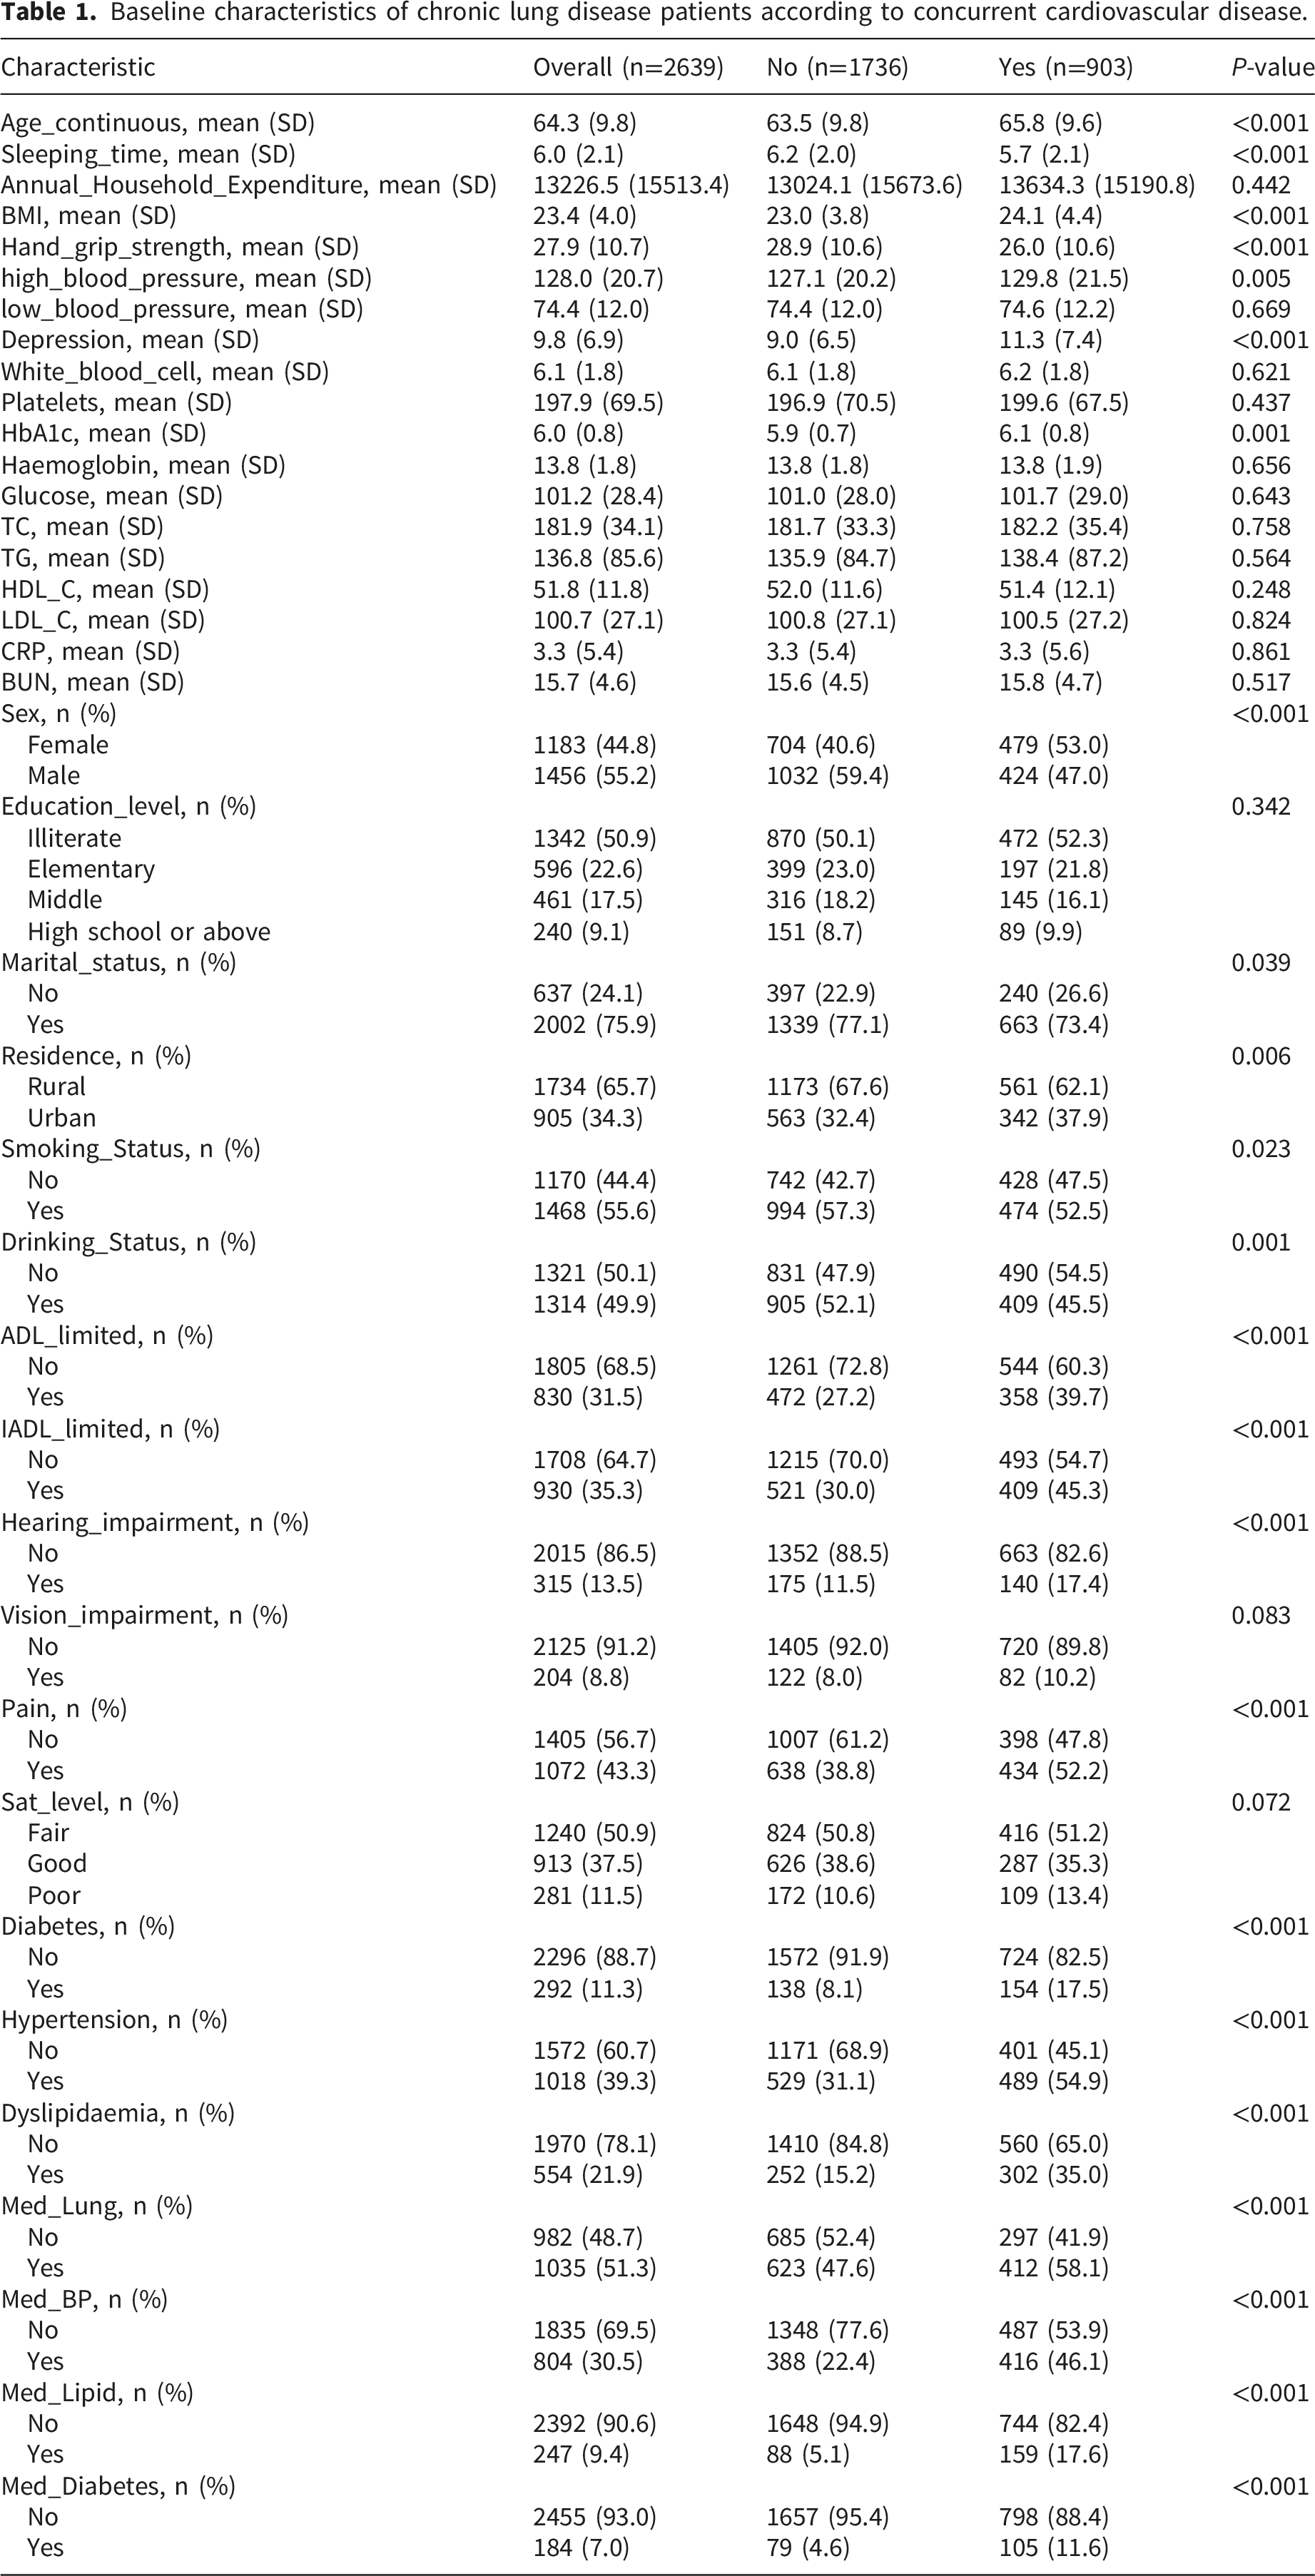
Baseline characteristics of chronic lung disease patients according to concurrent cardiovascular disease.
3.2. Feature selection results
Multivariate logistic regression analysis results.
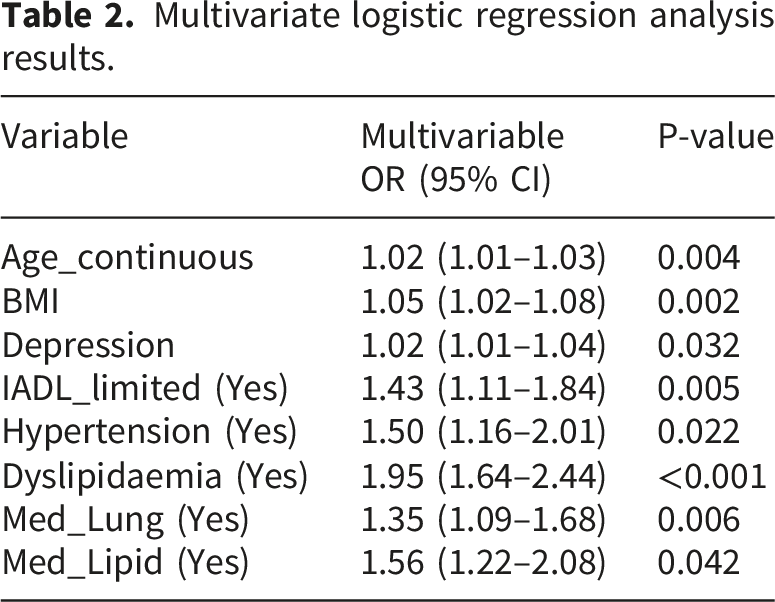
These core features encompass multiple clinical dimensions, including: age (Age_continuous) and BMI as continuous variables; IADL_limited as an indicator of functional status; prevalent hypertension (Hypertension), dyslipidemia (Dyslipidaemia), medication history for lung disease (Med_Lung), and history of lipid-lowering medication (Med_Lipid) within the domain of clinical comorbidities and treatments; and depression score (Depression) representing mental health.
The selected features delineate the cardiovascular risk profile of patients with CLD from diverse perspectives, including biological aging, physical functioning, metabolic burden, mental health, and clinical interventions. Such a combination of multidimensional features not only enhances the biological plausibility of the model but also establishes a robust data foundation for the subsequent construction and optimization of various machine learning algorithms.
3.3. Model performance
Based on the 8 selected core features, this study constructed and compared 7 machine learning models to evaluate their performance in predicting the risk of concurrent CVD in patients with CLD.
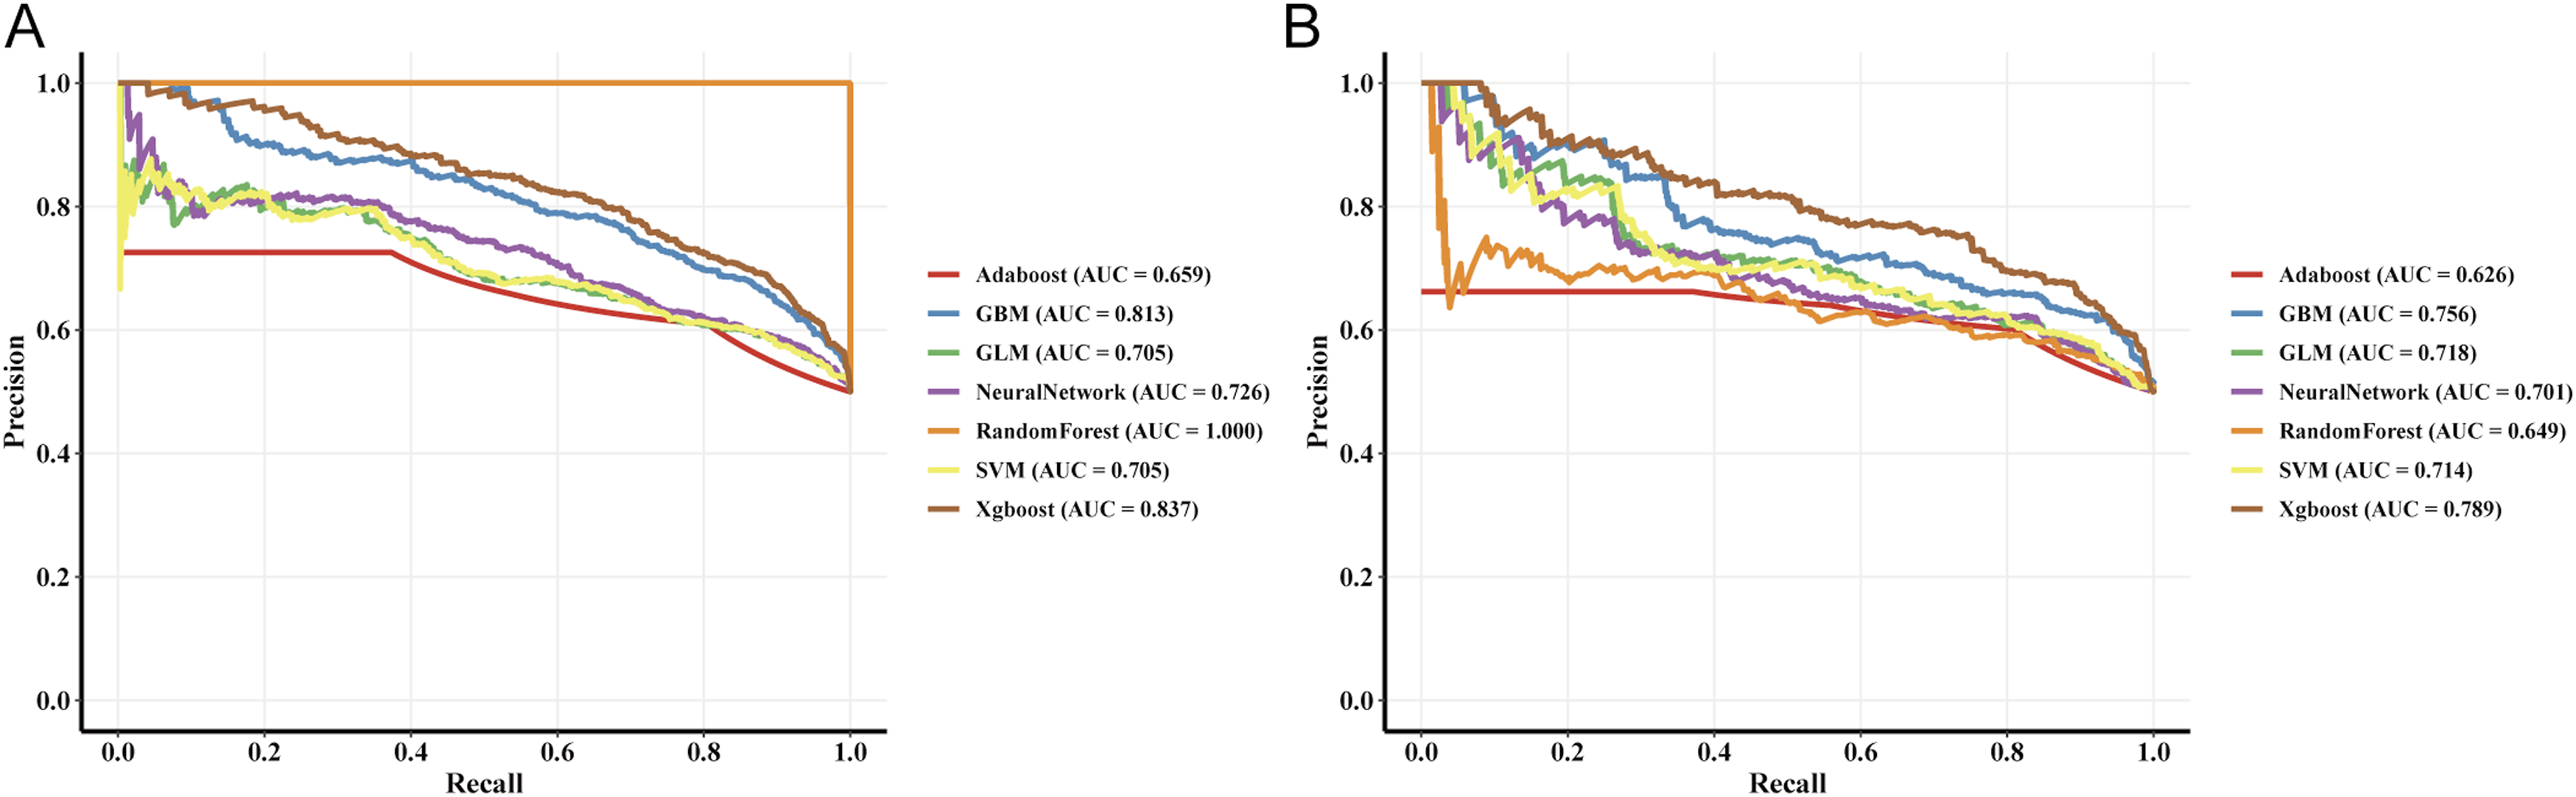
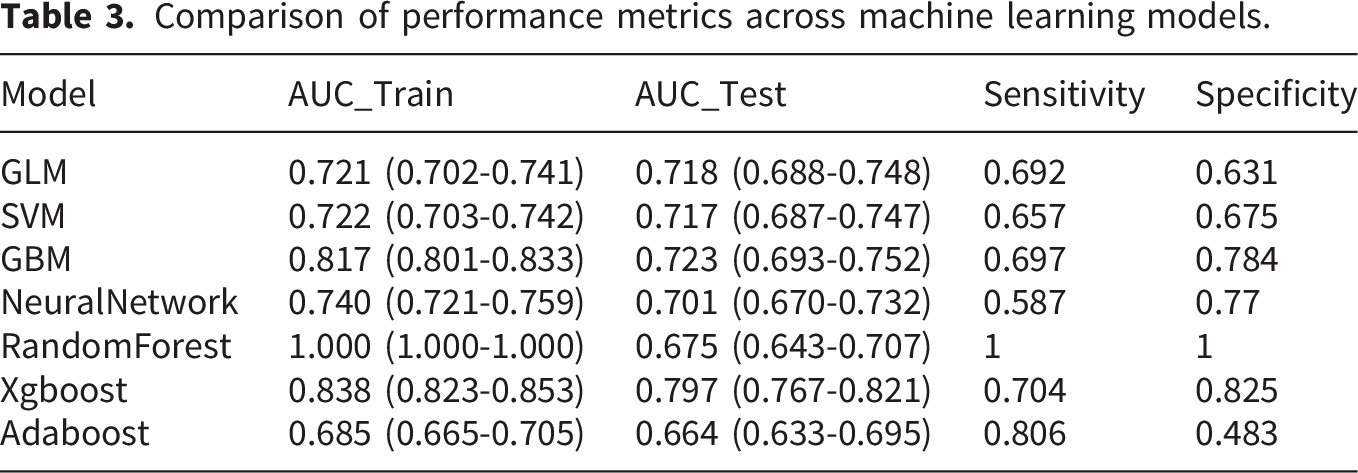
In terms of model discrimination, the XGBoost model demonstrated performance significantly superior to other algorithms. In the training and testing sets, its AUC reached 0.838 and 0.797, respectively (Figure 3(a) and (b)), exhibiting excellent risk identification capability (testing set sensitivity: 0.704, specificity: 0.825). PR curve analysis further confirmed its leading position, with PR-AUC values reaching 0.837 and 0.789 in the training and testing sets, respectively (Figure 4(a) and (b)). ROC curves of the seven machine learning models in the training set (a) and testing set (b). PR curves of the seven machine learning models in the training set (a) and testing set (b).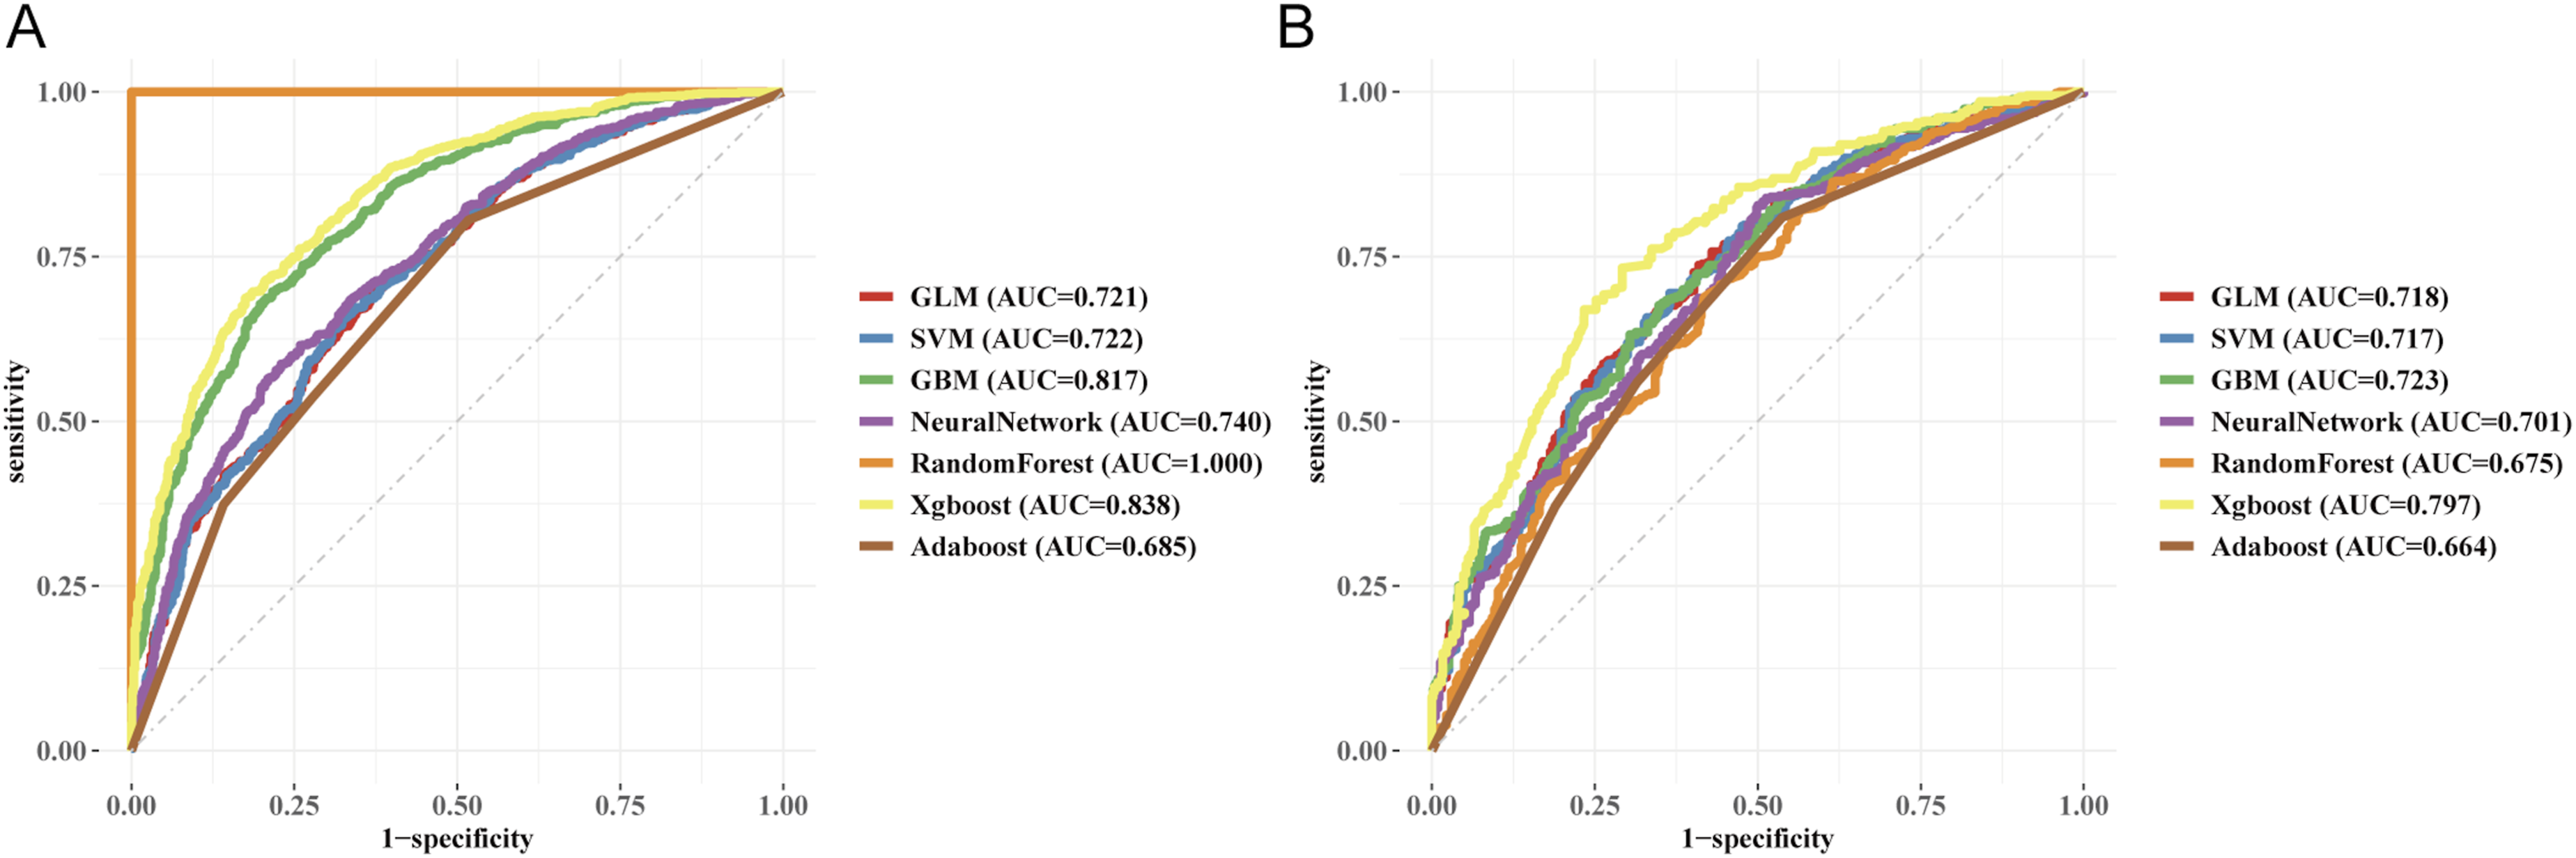
Comparison of performance metrics across machine learning models.
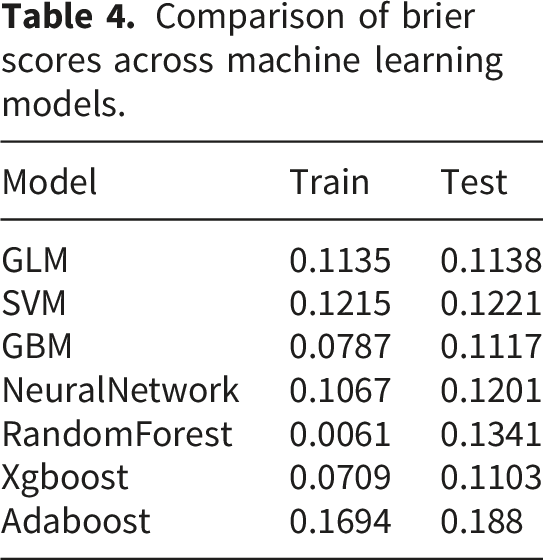
Regarding model calibration, the calibration curves indicated that XGBoost had an extremely high degree of overlap with the ideal curve in both datasets (Figure 5(a) and (b)). Calibration curves of the seven machine learning models in the training set (a) and testing set (b).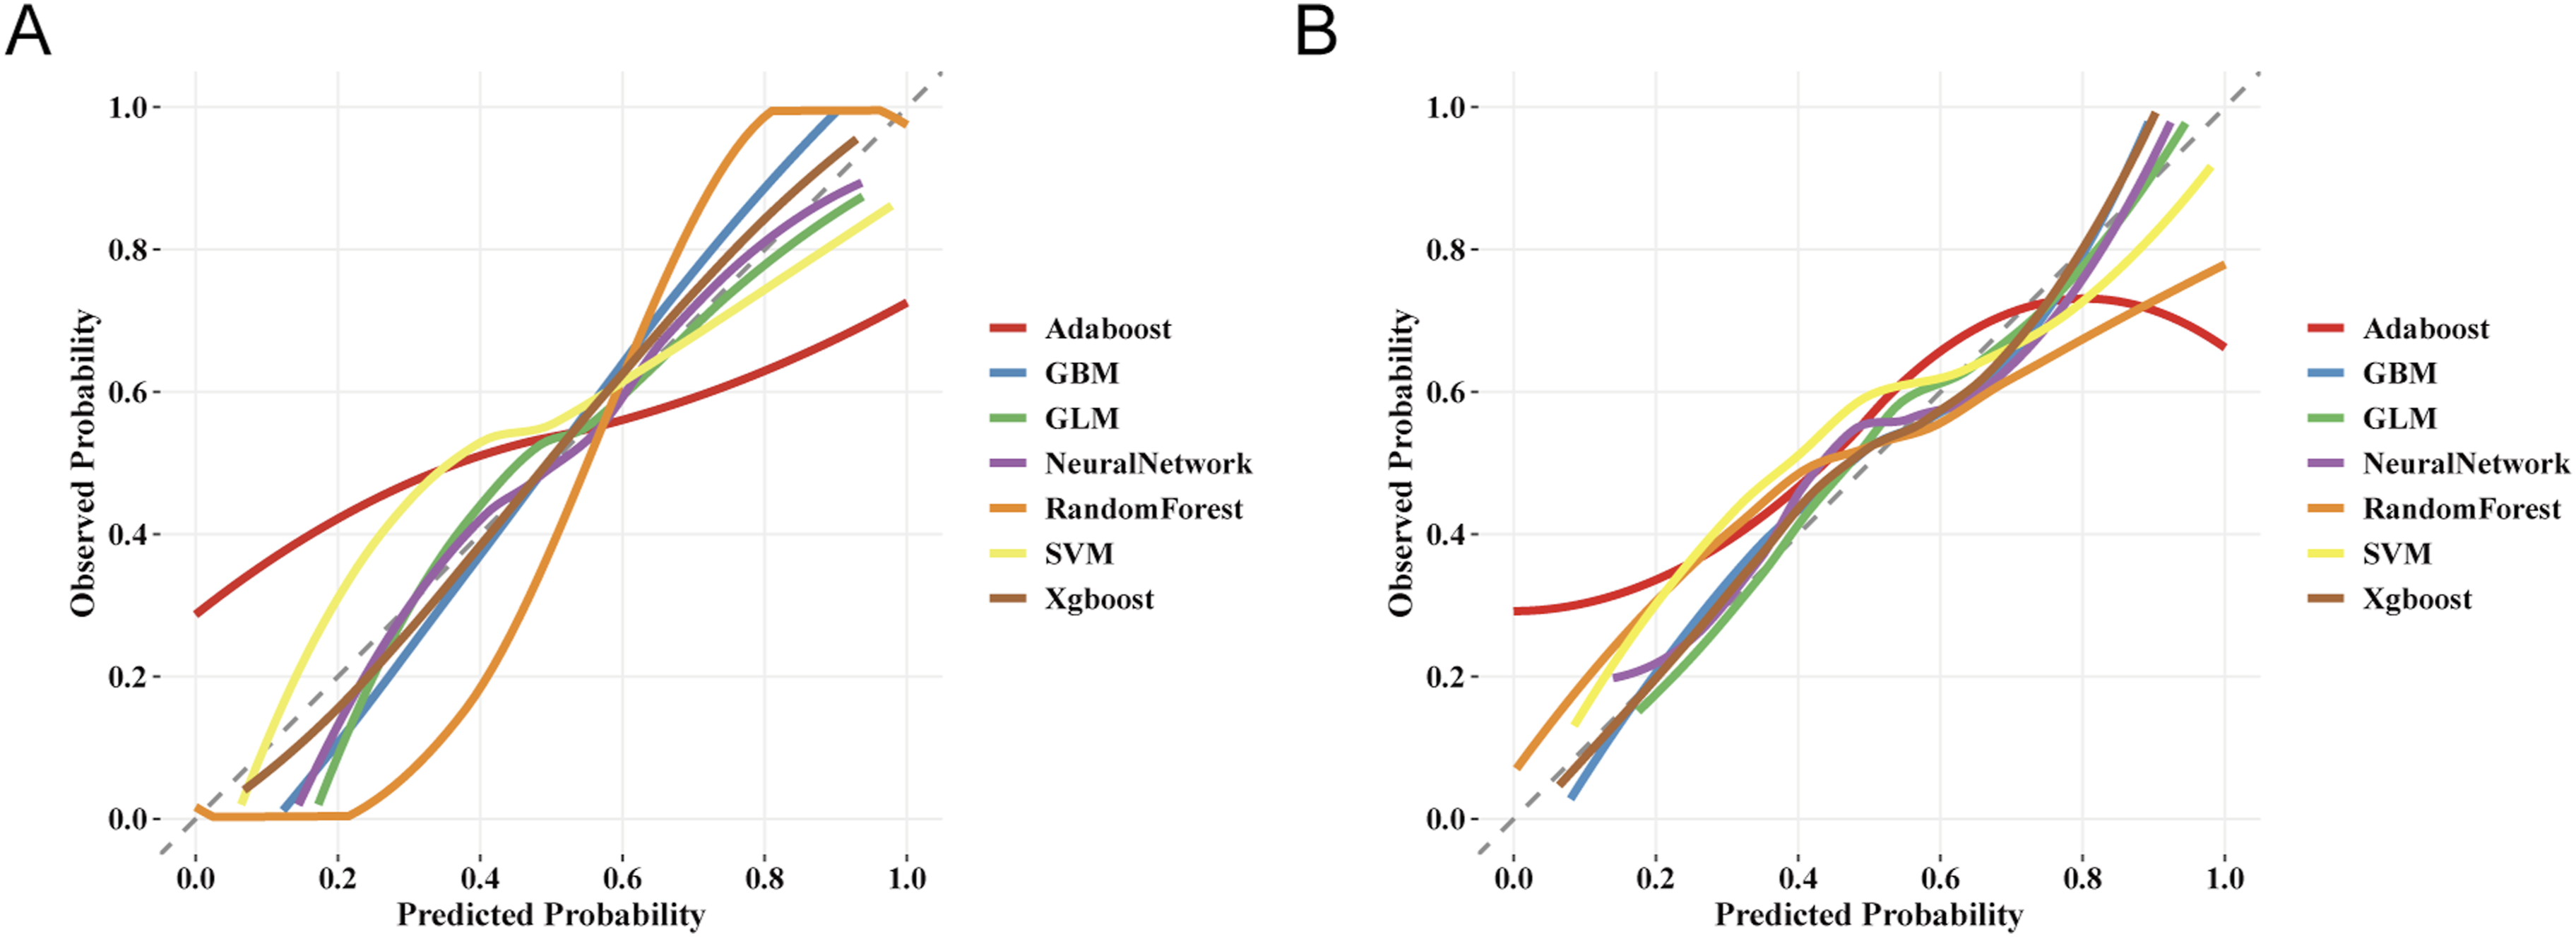
Comparison of brier scores across machine learning models.
In terms of clinical decision value evaluation, this study performed DCA on the training set (Figure 6(a)) and the testing set (Figure 6(b)). DCA curves of the seven machine learning models in the training set (a) and testing set (b).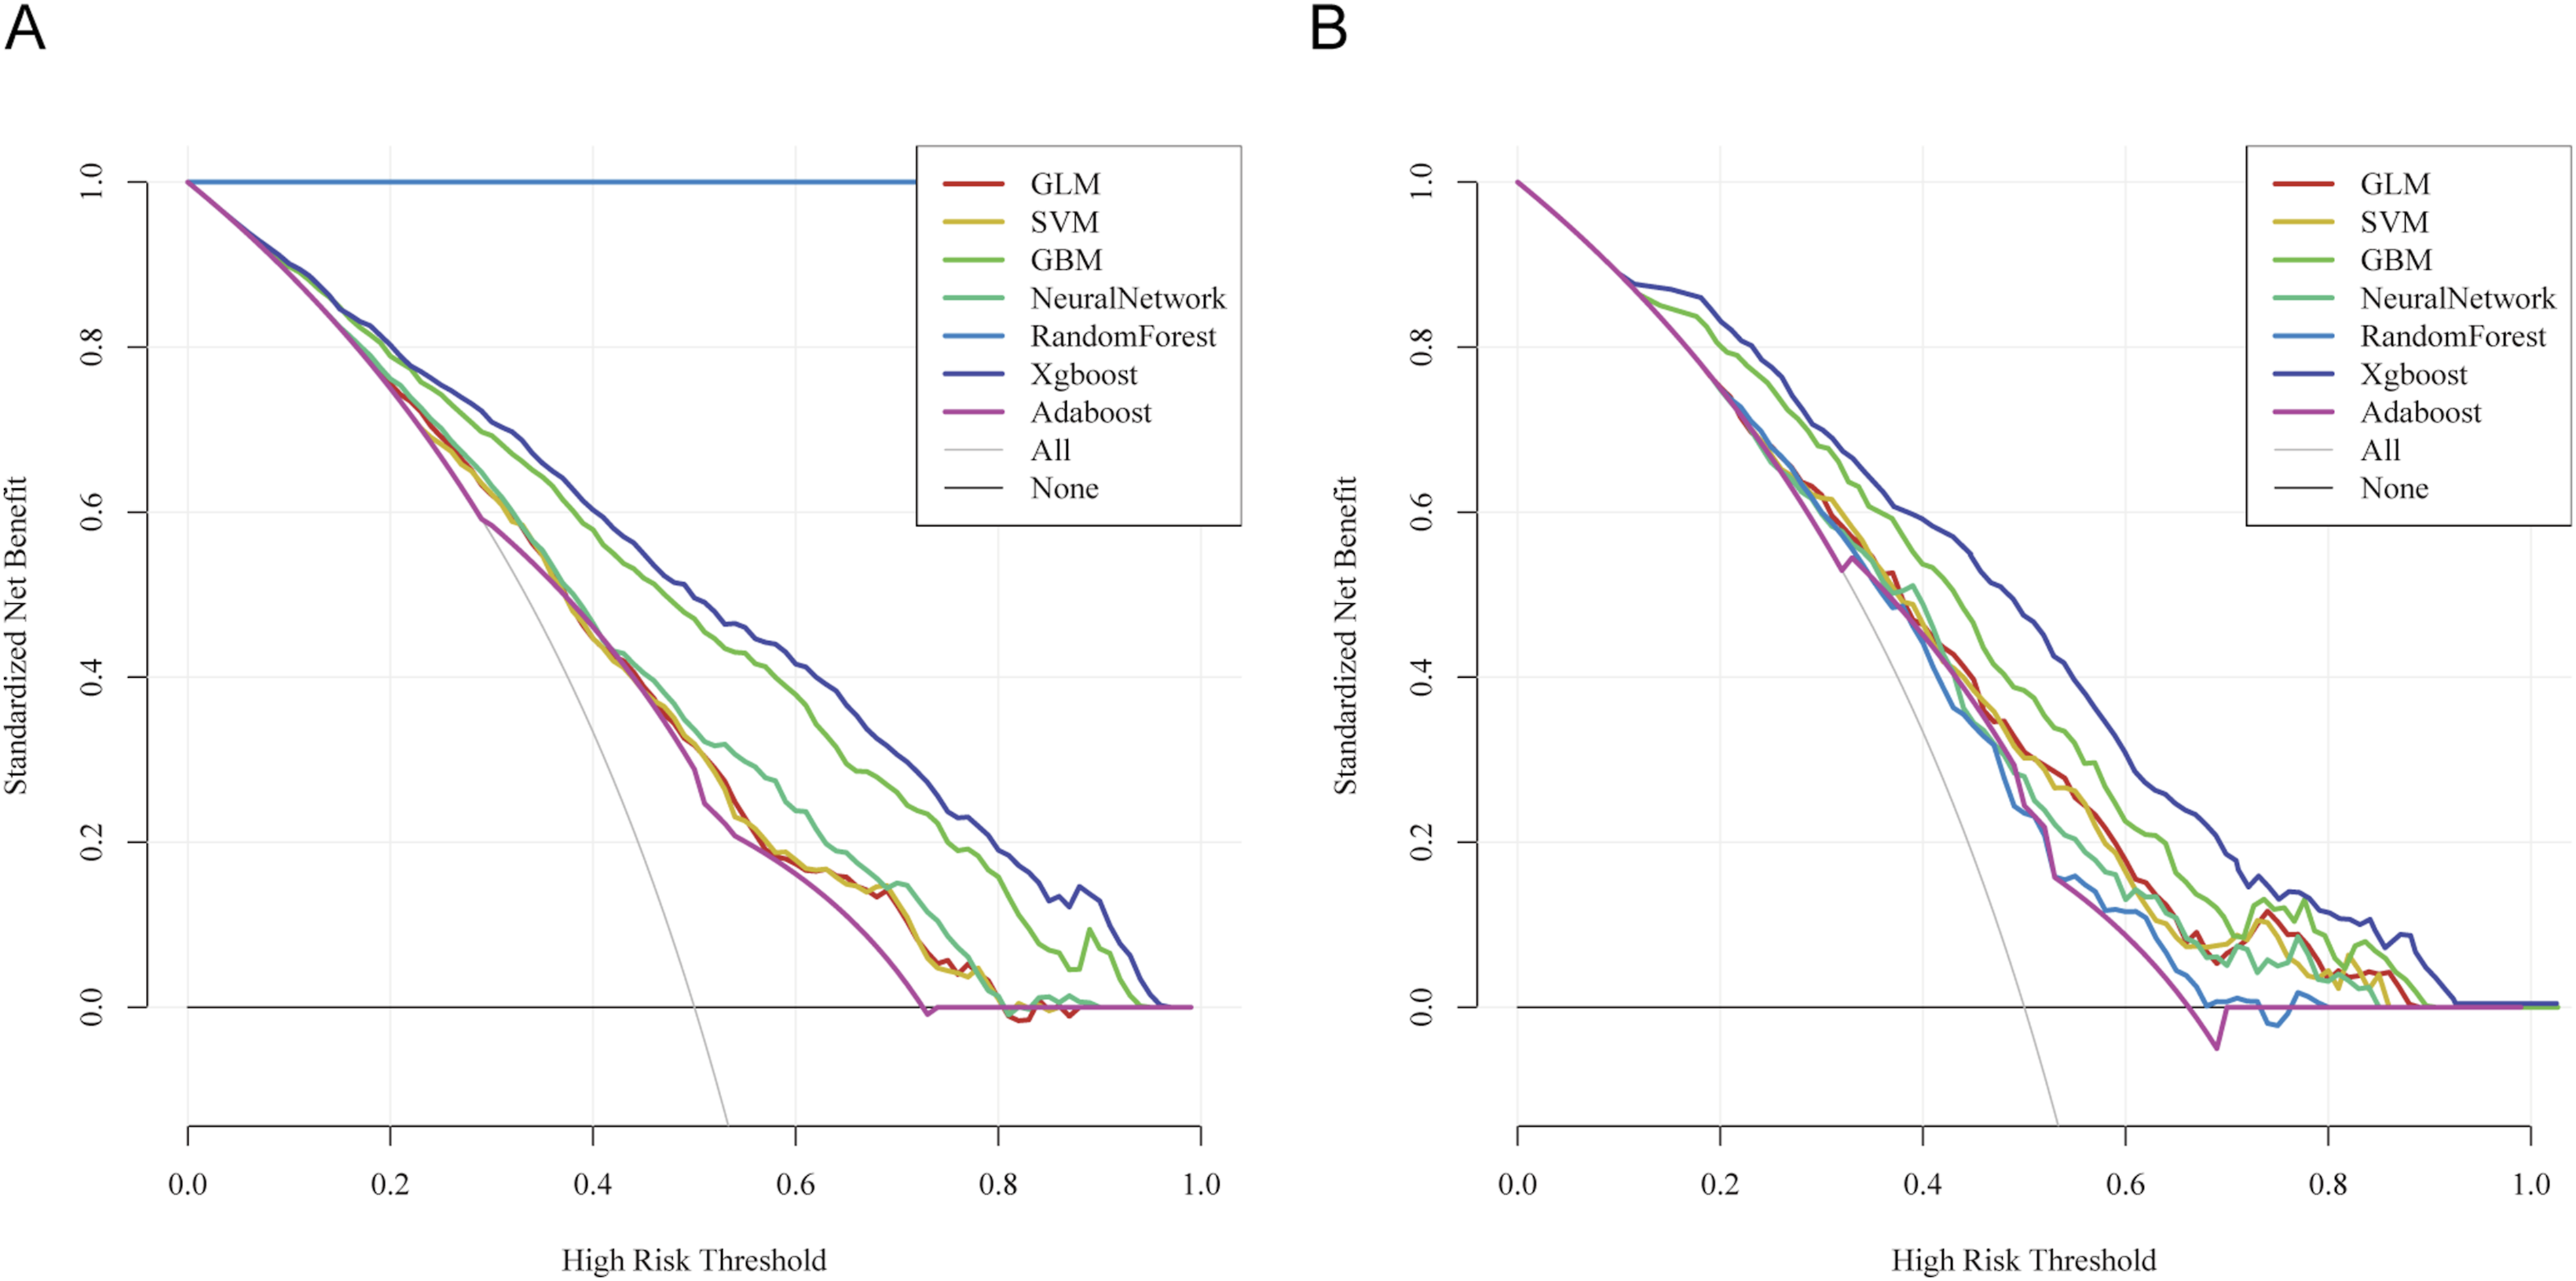
The results showed that the standardized net benefit of the XGBoost model was significantly higher than both the “treat-all” and “treat-none” strategies across most high-risk threshold ranges. Specifically, in both the training and testing sets, when the high-risk threshold was set between 0.2 and 0.8, the XGBoost model maintained a consistently high and stable net benefit curve. This indicates that the model can provide reliable decision support across a wide range of risk assessment intervals. In contrast, models such as GLM, SVM, and AdaBoost yielded lower net benefits within the same threshold range, suggesting relatively limited clinical applicability.
In summary, the XGBoost model demonstrated the best balance and generalization ability across discrimination, calibration, and clinical net benefit, exhibiting excellent clinical utility. Therefore, this study ultimately identified XGBoost as the core model for predicting CVD risk in patients with CLD.
3.4. Subgroup analysis
To further evaluate the applicability and robustness of the XGBoost model across different populations, stratified analyses were conducted in the training and testing sets according to sex and age tertiles (Figure 7). AUC results of the XGBoost model stratified by sex (a–b) and age tertiles (c–d) in the training and testing sets.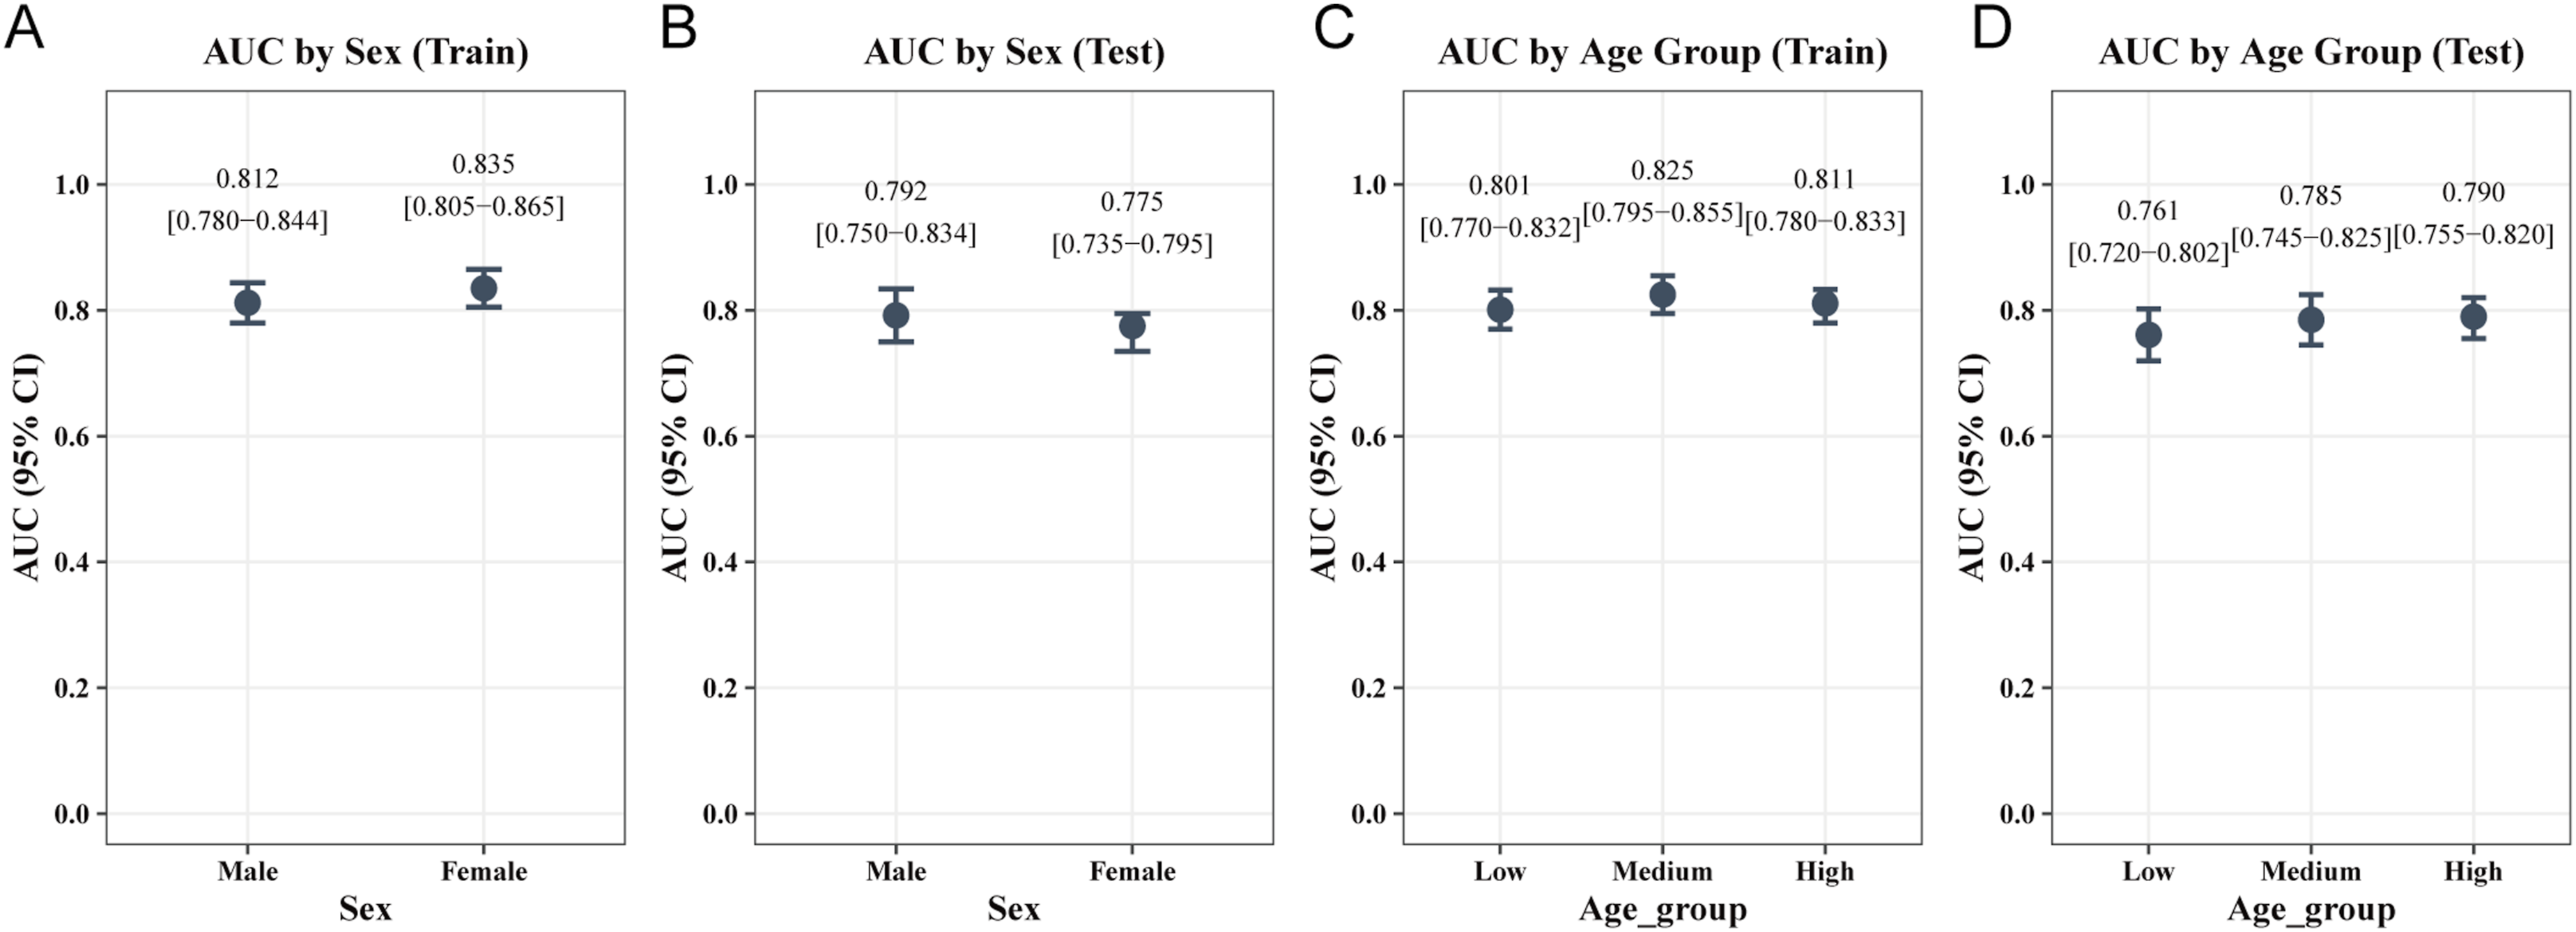
In the sex subgroups (Figure 7(a) and (b)), the model demonstrated excellent stability. In the training set, the AUCs for males and females were 0.812 and 0.835, respectively; in the testing set, the AUCs were 0.792 and 0.775, respectively. The minor difference in discrimination between the two groups suggests that the model possesses good predictive fairness across different sexes.
In the age subgroups (Figure 7(c) and (d)), the model similarly maintained robust predictive capability. In the training set, the AUCs for the Low, Medium, and High groups, defined by age tertiles, were 0.801, 0.825, and 0.811, respectively. In the testing set, the corresponding AUCs for each group were 0.761, 0.785, and 0.790, respectively. The stratification results indicate that the model performs highly consistently across populations with different age distributions, without apparent predictive bias.
In summary, the XGBoost model exhibited stable and reliable predictive performance across all subgroups, further validating its broad applicability within the chronic lung disease population.
3.5. External validation
This study performed external validation of the XGBoost model using data from Wave 7 of the English Longitudinal Study of Ageing (ELSA, n = 19,802). Following the same inclusion criteria as the CHARLS cohort, 1,303 CLD patients aged 45 years and older were included, with 1,023 cases of asthma, 455 cases of lung disease, and 175 overlapping cases. For cardiovascular diseases (CVD), 80 patients had strokes, 308 had heart diseases, and 32 had overlapping conditions (Figure 1; baseline characteristics are shown in Supplementary Table S5).
The validation results revealed that the model performed robustly in a heterogeneous population, achieving an AUC of 0.695 and a PR-AUC of 0.704. The calibration curve showed a high degree of concordance between the predicted risk and actual observed outcomes, demonstrating excellent predictive consistency. Furthermore, DCA indicated that the model still yielded significant clinical net benefit in the validation set (Supplementary Figure S1).
Taken together, the external validation results confirm that the XGBoost model possesses strong geographic and cross-population generalizability, rendering it capable of providing reliable cardiovascular risk assessment for patients with CLD from diverse backgrounds.
3.6. SHAP–based model interpretation
To enhance the transparency of the XGBoost model in clinical applications, this study introduced the SHAP framework to deeply analyze the model’s predictive mechanisms from three dimensions: global contribution, feature interaction, and individual decision-making.
The SHAP beeswarm plot in Figure 8(a) demonstrates that all 8 included core variables are positively associated with an increased risk of CVD; that is, higher feature values or the presence of corresponding symptoms correspond to a greater predicted risk. Ranked by mean absolute SHAP values (Figure 8(b)), hypertension, depression score, and age are the three most powerful predictors, followed by BMI, dyslipidemia, lung disease medication history, impaired IADL, and lipid-lowering medication history. This indicates that for patients with chronic lung disease, vascular health and psychological status are the key weighted factors determining their cardiovascular risk. Model interpretation using SHAP framework, including feature importance (a–b), dependence plots (c–e), and individual prediction waterfall plot (f).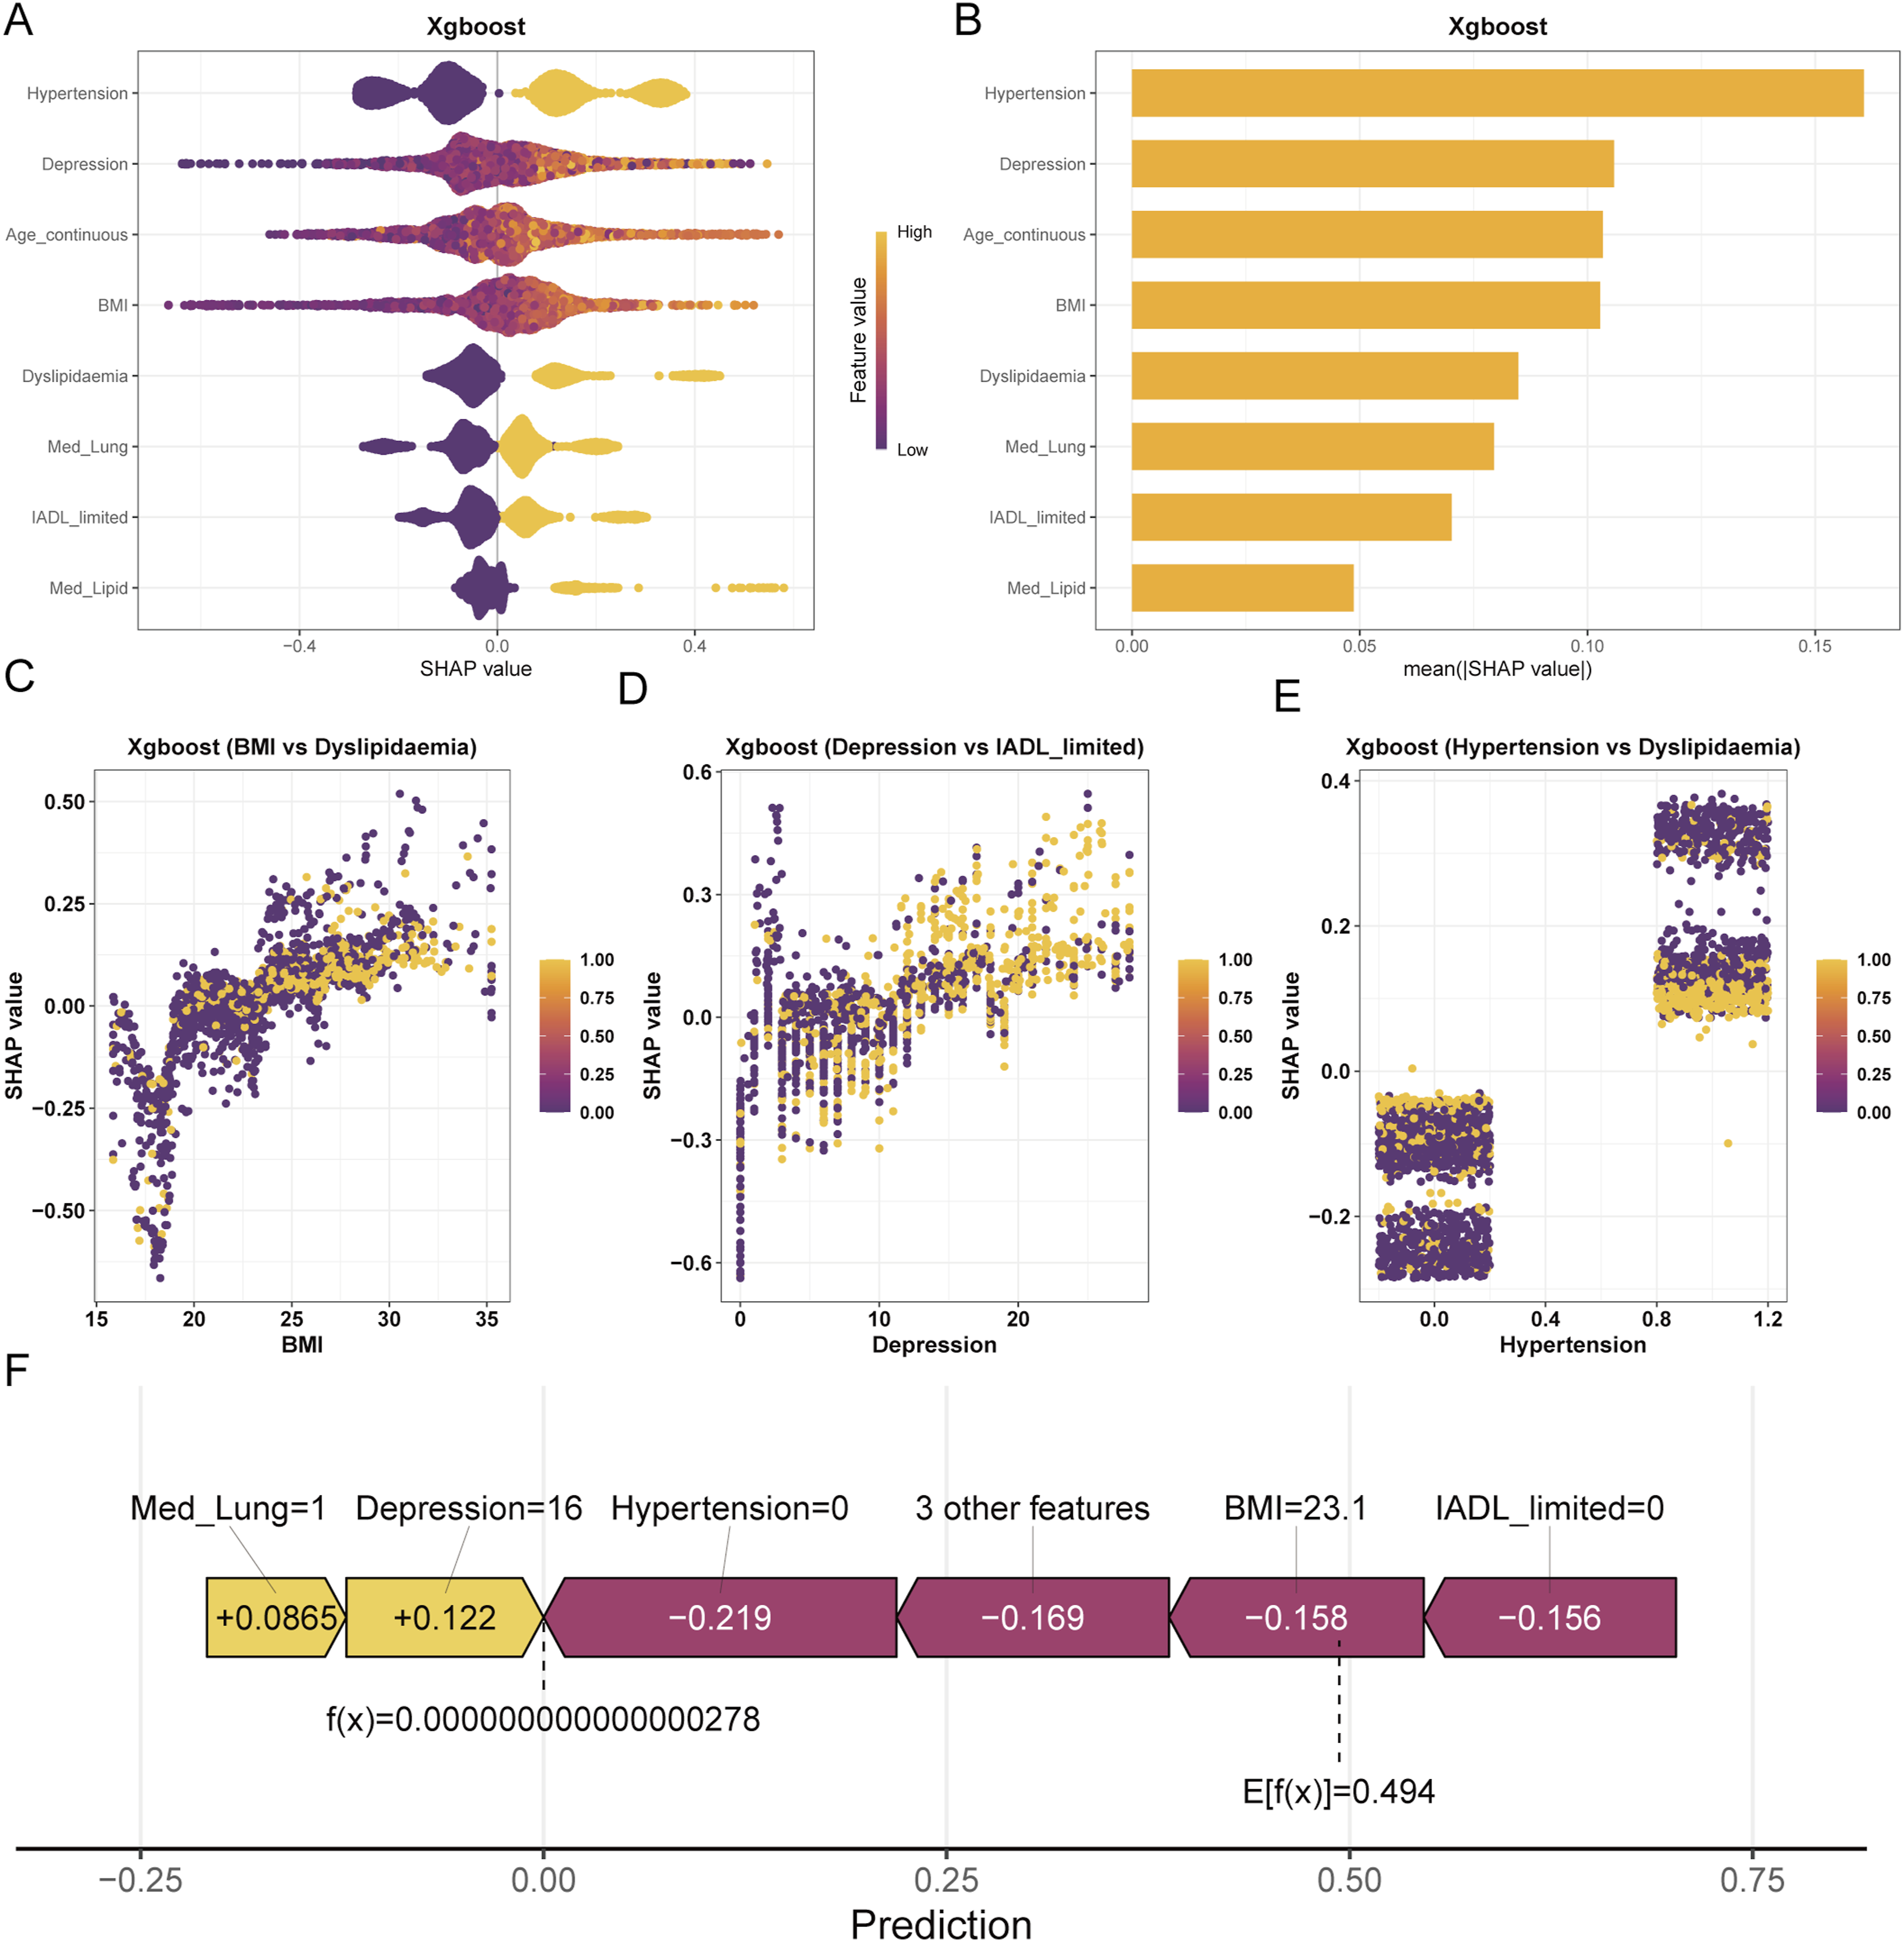
Meanwhile, SHAP dependence plots further reveal the synergistic mechanisms among variables. A strong interaction was found between BMI and dyslipidemia, reflecting the cumulative damage of metabolic burden on the cardiovascular system. The depression score and IADL also exhibited potential interaction effects, suggesting that the dual decline of physical and psychological functions accelerates risk progression. Furthermore, hypertension and dyslipidemia demonstrated a significant synergistic risk amplification effect (Figure 8(c)–(e)), meaning that when both are present, an individual’s predicted risk is significantly higher than the linear superposition of either single risk factor.
At the individual level, a representative SHAP waterfall plot in Figure 8(f) intuitively illustrates how features push an individual’s predicted value from the baseline (expected) value to the final outcome. In this sample, although lung disease medication history (Med_Lung = 1) and depression score (Depression = 16) contributed risk increments of +0.0865 and +0.122, respectively, the dominant role of protective factors—specifically the absence of hypertension (Hypertension = 0, contributing -0.219), a normal BMI (23.1, contributing -0.158), and no IADL limitation (contributing -0.156)—resulted in a final predicted probability f(x) close to 0, which is far below the population expected value of 0.494. This suggests that the individual is at an extremely low risk level.
In conclusion, SHAP analysis not only validates the biological plausibility of the XGBoost model but also uncovers the interaction patterns among complex risk factors, providing clinicians with precise and actionable insights for identifying high-risk patients with CLD and tailoring individualized intervention strategies.
3.7. Preliminary model application
This study developed an interactive web-based prediction platform (https://zzaakk.shinyapps.io/make_web/) based on the Shiny framework, integrating the core XGBoost model to achieve clinical translation. Users simply need to input the 8 core features—age, BMI, depression score, hypertension, dyslipidemia, IADL impairment, and medication history for lung disease and lipid-lowering drugs—to obtain personalized, real-time CVD predicted risk probabilities.
The platform is compatible with multi-device access and employs a local computation mode to ensure data security and personal privacy. As a convenient and efficient digital tool, this platform provides robust support for risk stratification of patients with chronic lung disease in primary care screening and remote health management.
4. Discussion
Based on large-scale population cohort data from CHARLS, this study developed and validated a risk prediction model specifically tailored for predicting concurrent CVD in patients with CLD. By integrating multidimensional clinical indicators—including demographic characteristics, clinical comorbidities, physical function, and mental health—this study identified 8 independent predictors using logistic regression and systematically compared the predictive performance of 7 machine learning algorithms. The results demonstrated that the XGBoost model exhibited the optimal comprehensive performance in terms of discrimination, calibration, and clinical decision benefit. Furthermore, its robustness and cross-population applicability were confirmed through external validation in the UK ELSA cohort. Additionally, SHAP analysis revealed that hypertension, depression score, and age were the most important contributing variables for predicting CVD risk, and it confirmed the presence of significant synergistic amplification effects among certain risk features (e.g., BMI and dyslipidemia, depression and impaired activities of daily living). Finally, based on the core XGBoost model, this study developed and deployed an online risk prediction tool, providing direct clinical decision support for primary care screening and remote health management.
The SHAP analysis in this study indicated that hypertension and age are the core clinical features for predicting incident CVD in patients with CLD. Chronic lung diseases (such as COPD and asthma) are frequently accompanied by systemic inflammation, oxidative stress, and chronic hypoxia. These pathological changes can trigger vascular endothelial dysfunction and increase arterial stiffness.23–25 When patients with CLD present with comorbid hypertension, long-term hemodynamic abnormalities and systemic inflammation exert a superimposed effect, significantly accelerating the progression of atherosclerosis and ischemic heart disease. 26 Moreover, advancing age is intrinsically associated with the physiological degeneration of the cardiovascular system, which further amplifies the dual damage inflicted on target organs by hypertension and hypoxia.
Notably, the mental health dimension (depression score) and physical function status (IADL limitation) exhibited highly predictive contributions in the model. Due to chronic dyspnea and decreased exercise tolerance, the incidence of adverse psychological states such as depression is significantly higher in patients with CLD than in the general population. Current psychoneuroimmunological evidence suggests that depression can directly increase susceptibility to cardiovascular events by activating the hypothalamic-pituitary-adrenal (HPA) axis, causing sympathetic nervous system overactivation, and exacerbating systemic inflammatory responses.27–29
Furthermore, SHAP interaction analysis confirmed a significant synergistic risk effect between depression and IADL limitation. The decline in physical function restricts patients’ daily activities, leading to decreased metabolic levels, and this reduction in physiological function further exacerbates depressive symptoms. These two factors intertwine to form a vicious cycle, jointly accelerating the occurrence of cardiovascular complications.
In the metabolic and clinical treatment dimensions, strong interactions were observed between BMI and dyslipidemia, as well as between hypertension and dyslipidemia, reflecting the cumulative damage of lipid metabolic disorders and metabolic syndrome on the cardiovascular system.30,31 Meanwhile, the Med_Lung and Med_Lipid were identified as independent predictors. In epidemiological surveys, specific medication histories generally provide an objective reflection of the severity of the patient’s underlying disease or the frequency of acute exacerbations. More severe pulmonary lesions often correspond to a more pronounced increase in right ventricular overload and systemic inflammation, thereby resulting in a higher incidence of cardiovascular events. Integrating these multidimensional features into the XGBoost model effectively captured the complex pathophysiological states of patients with CLD.
Compared with existing clinical risk assessment tools, this study possesses several notable advantages. First, this study specifically modeled the high-risk subgroup of CLD, overcoming the inadequate applicability of traditional general-population models in this specific cohort. Second, the employed XGBoost algorithm effectively handles non-linear relationships and high-order interactions among multidimensional variables, yielding predictive performance significantly superior to traditional generalized linear models. Third, the study introduced the highly heterogeneous UK ELSA cohort for external validation, confirming the model’s excellent cross-geographic and cross-population generalizability. Recent studies highlight the role of explainable AI in healthcare, providing context for interpreting machine learning models.32,33 Finally, the Shiny-based online tool further enhances accessibility, allowing users to obtain personalized risk assessments via a web browser without requiring specialized technical expertise.
However, this study has several limitations. First, disease diagnoses in the CHARLS and ELSA cohorts were based on self-reporting, which may introduce recall bias. Second, objective clinical measures, such as pulmonary function tests and echocardiography, were unavailable due to the limitations of public datasets. Detailed information on medication type and dosage was also lacking. Third, because of the cross-sectional design, the model assessed prevalent CVD rather than future CVD risk, and causality cannot be inferred. Fourth, the logistic-regression-based feature-reduction strategy may have excluded predictors with potential value in nonlinear or interaction-based models. Future studies should compare different feature-selection strategies in larger prospective datasets and incorporate multidimensional objective data to improve clinical applicability.
5. Conclusion
Based on nationally representative population data, this study successfully developed and validated a risk prediction model specifically tailored for predicting concurrent CVD in patients with CLD. Through logistic regression feature selection and the XGBoost machine learning algorithm, this study accurately identified 8 core predictors. The model demonstrated excellent predictive performance and robust generalizability across the training set, testing set, and the external validation cohort (ELSA). Furthermore, SHAP analysis enhanced the interpretability of the model, highlighting the critical roles of hypertension, depressive status, age, and lipid metabolic disorders in the development of CVD risk among the CLD population, while also revealing the synergistic interaction mechanisms among these complex risk factors. Finally, an interactive online risk prediction tool was developed to facilitate model visualization and clinical translation. This platform holds significant promise for supporting the early identification and personalized management of cardiovascular risk in CLD patients within primary care settings, thereby providing more precise risk stratification and targeted interventions for patients with chronic diseases.
Supplemental material
Supplemental material - Development and external validation of a machine learning model for cardiovascular risk prediction in individuals with chronic lung disease: Evidence from CHARLS and ELSA
Supplemental material for Development and external validation of a machine learning model for cardiovascular risk prediction in individuals with chronic lung disease: Evidence from CHARLS and ELSA by Ankang Zhu, Shuai Wei, Haobo Wang, Shaodong Liu, Yang Li, Xiaojie Pan, Xingcai Gao, and Xing lin in Digital Health.
Footnotes
Ethical considerations
This study was a secondary analysis of publicly available, de-identified CHARLS and ELSA data. The original CHARLS study, including participant recruitment, informed consent, and data collection, was approved by the Institutional Review Board at Peking University (IRB00001052-11015), and ELSA received ethical approval from the relevant NHS Research Ethics Committees.
Consent to participate
All participants in the original surveys provided written informed consent. CHARLS data were obtained from the official CHARLS website after registration and approval for research use, and ELSA data were accessed through the UK Data Service under the applicable data use agreement. Therefore, no additional ethical approval or informed consent was required for the present secondary analysis.
Author contributions
Ankang Zhu, Shuai Wei, and Haobo Wang contributed equally to this work and should be considered co-first authors. Ankang Zhu was responsible for conceptualization, methodology, and supervision; Shuai Wei handled data analysis and writing – original draft; Haobo Wang performed data curation, software development, visualization, and writing – review & editing; Shaodong Liu conducted literature review and result interpretation; Yang Li performed investigation, data preprocessing, and statistical analysis; Xiaojie Pan, Xingcai Gao, and Xing Lin provided supervision and served as corresponding authors. All authors read and approved the final manuscript.
Funding
The authors received no financial support for the research, authorship, and/or publication of this article.
Declaration of conflicting interests
The authors declared no potential conflicts of interest with respect to the research, authorship, and/or publication of this article.
Declaration of generative AI and AI-assisted technologies in the writing process
ChatGPT (OpenAI) was used solely for language polishing. All content was reviewed and approved by the authors.
Supplemental material
Supplemental material for this article is available online.
Appendix
References
Supplementary Material
Please find the following supplemental material available below.
For Open Access articles published under a Creative Commons License, all supplemental material carries the same license as the article it is associated with.
For non-Open Access articles published, all supplemental material carries a non-exclusive license, and permission requests for re-use of supplemental material or any part of supplemental material shall be sent directly to the copyright owner as specified in the copyright notice associated with the article.