
Abstract
Objective
To determine which data augmentation technique yields the best performance for deep learning models in classifying age-related macular degeneration (AMD), diabetic retinopathy (DR), glaucoma, and normal fundus images.
Methods
This study employed an in silico experimental study design. Six data augmentation techniques: Colour Jitter, Contrast-Limited Adaptive Histogram Equalisation (CLAHE), Rotation, Translation, Gaussian Noise, and Poisson Noise were evaluated using controlled experiments with an EfficientNet-B0 model on a balanced dataset of 1,200 fundus photographs, 250 cases each for AMD, DR and glaucoma, and 450 normal fundus images curated from four main publicly available databases. The experiments were conducted in four phases: baseline, single augmentations, combined augmentations, and the impact of augmented dataset volume. Evaluation metrics and visualisations were computed with Python-based statistical and visualisation libraries.
Results
The results from this study show that data augmentation consistently increased the area under the curve (AUC) from 96.55% to 97.23% and accuracy from 85.83% (baseline) to 89.58%. The results indicate that augmentation effectiveness is disease-specific: Rotation and Colour Jitter yielded the highest sensitivity for AMD (99%), CLAHE maximised sensitivity for Diabetic Retinopathy (96%), and Translation was most effective for Glaucoma (83%). While single augmentations provided descriptive clinical improvements, the comprehensive combination of photometric, geometric, and noise augmentations yielded the best overall performance and achieved a statistically significant improvement over the baseline (Mean bootstrapped AUC = 0.9800, 95% CI: 0.9678, 0.9895; p= 0.0050).
Conclusion
Data augmentation effectiveness is disease-dependent; specific pathologies respond better to distinct augmentation techniques due to different retinal biomarkers.
Introduction
Glaucoma, age-related macular degeneration and diabetic retinopathy are among the leading causes of irreversible blindness, with a profound global burden that is projected to affect more than 560 million people collectively by 2040.1–3 This escalating prevalence poses a formidable public health challenge, demanding more efficient and scalable diagnostic solutions.
Although modern retinal imaging systems, such as OCT and Fundus Photography, provide high-resolution images of retinal structures and pathological changes, their interpretation remains largely dependent on the clinical expertise of eye care professionals. Manual interpretation is time-consuming, subjective, and inconsistent across practitioners.4,5 This limitation has motivated the adoption of Artificial Intelligence (AI) tools, particularly Deep Learning (DL), to automate image classification and support diagnostic decision-making. 6
Deep Learning models have achieved diagnostic accuracy comparable to, and sometimes exceeding, that of experienced clinicians in diagnosing retinal diseases.5,7 Their consistency and scalability make them highly suitable for application in resource-limited clinical environments. 8 Despite these advancements, the optimal performance of DL models depends heavily on the availability of large, diverse training datasets, which are expensive and labour-intensive to acquire and often limited by privacy and ethical restrictions. 9 Data scarcity limits the potential to train and develop robust DL models, thereby limiting the performance of AI systems. In addressing this challenge, data augmentation techniques are employed to artificially expand training datasets by generating synthetic images or modified versions of existing images that mimic natural variability.10–12
The main purpose of data augmentation is to make deep learning models more accurate and reliable. It expands small datasets and prevents models from “overfitting.” Overfitting occurs when models perform well on training images but poorly on new ones or validation images. 13 Data augmentation exposes models to a wider range of image variations, thereby helping them to focus on important disease features instead of noise or artefacts.14,15 This strategy not only counteracts class imbalance in rare disease categories but also simulates real‐world imaging variability, from camera settings to patient movement, resulting in more robust performance across diverse clinical environments. 14
While widely used, most studies apply data augmentations without a clear evidence-informed perspective. Most studies apply generic augmentations without considering disease-specific visual biomarkers. This is a critical gap, as different retinal diseases are defined by distinct visual biomarkers. It is unclear which augmentations are most effective, what combinations work best, and how they impact the classification of different retinal diseases. 16
This study, therefore, sought to comparatively evaluate the effectiveness of six common data augmentation techniques on the performance of a deep learning model for classifying AMD, DR, and glaucoma from fundus images. We hypothesise that disease-specific augmentations will perform better compared to baseline and generic augmentations because retinal diseases manifest through different structural and visual biomarkers. Due to this, AMD, DR and glaucoma will exhibit distinct DL model performance to different augmentation types. The primary objective is to determine which image data augmentations, across photometric, geometric, and noise-based categories, yield the most significant performance gains for each specific disease, to guide the development of more robust and clinically reliable AI diagnostic systems, particularly for data-scarce regions.
Methods
Study design
This study adopted an experimental study design to evaluate how different data augmentation techniques influence the performance of deep learning models in classifying retinal diseases. While the dataset consists of a retrospective cross-sectional sample of fundus images, the algorithmic evaluation itself is experimental. We systematically manipulated the independent variables (the type and volume of data augmentation) to observe their effect on model performance metrics. The experiment followed an ablation framework comprising four stages: the baseline model trained without augmentation, models trained with individual augmentation techniques, models trained with combined augmentation techniques, and models trained on datasets of varying sizes. This design enabled a rigorous, comparative examination of how data augmentation affects deep learning performance in fundus image classification.
Datasets and data acquisition
The study used four publicly available retinal fundus image datasets covering diabetic retinopathy (DR), age-related macular degeneration (AMD), glaucoma, and healthy eyes. These disease categories were selected because they represent major global causes of irreversible vision loss. 1 To ensure comparability, a subset of images was randomly sampled from each dataset so that all disease categories had equal representation.
Summary of datasets used.
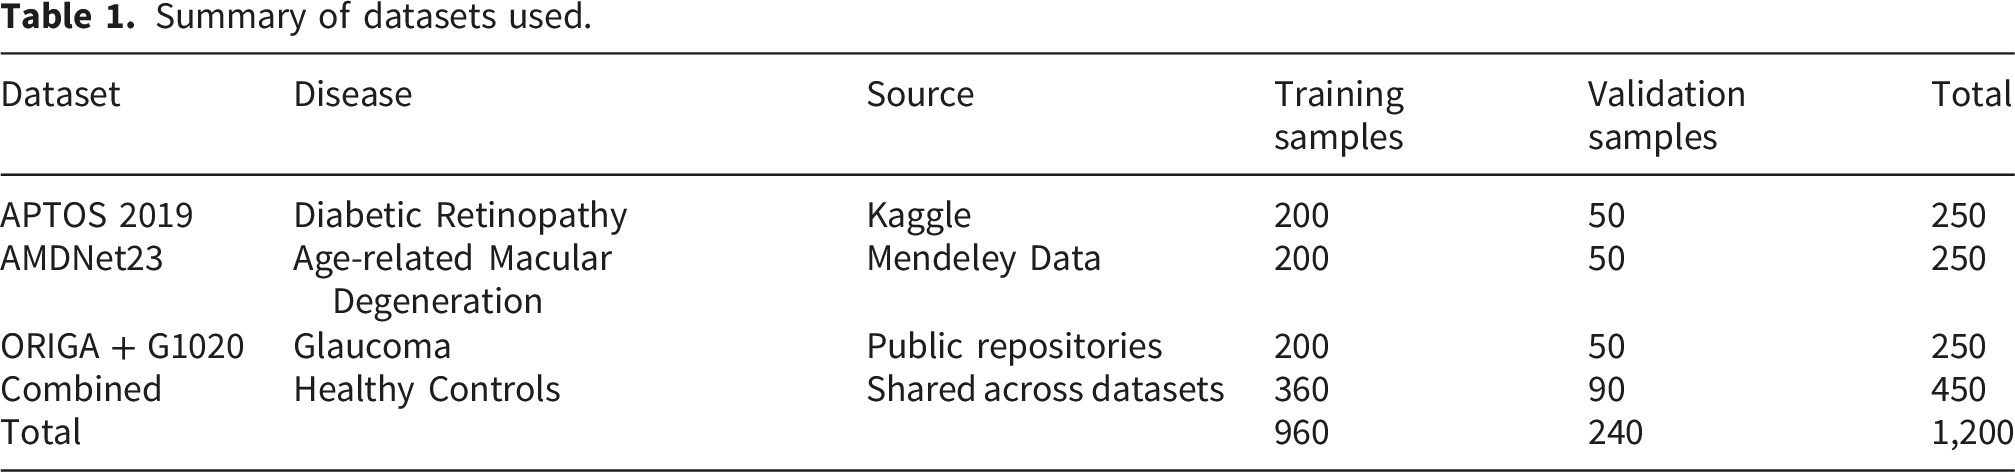
The complete data curation process, from the initial pooling of public repositories to the random sampling for class balance and the final dataset used for the study, is detailed in the image selection flow diagram (Figure 1). Flow diagram showing dataset aggregation, quality control, random sampling, and division into training and validation sets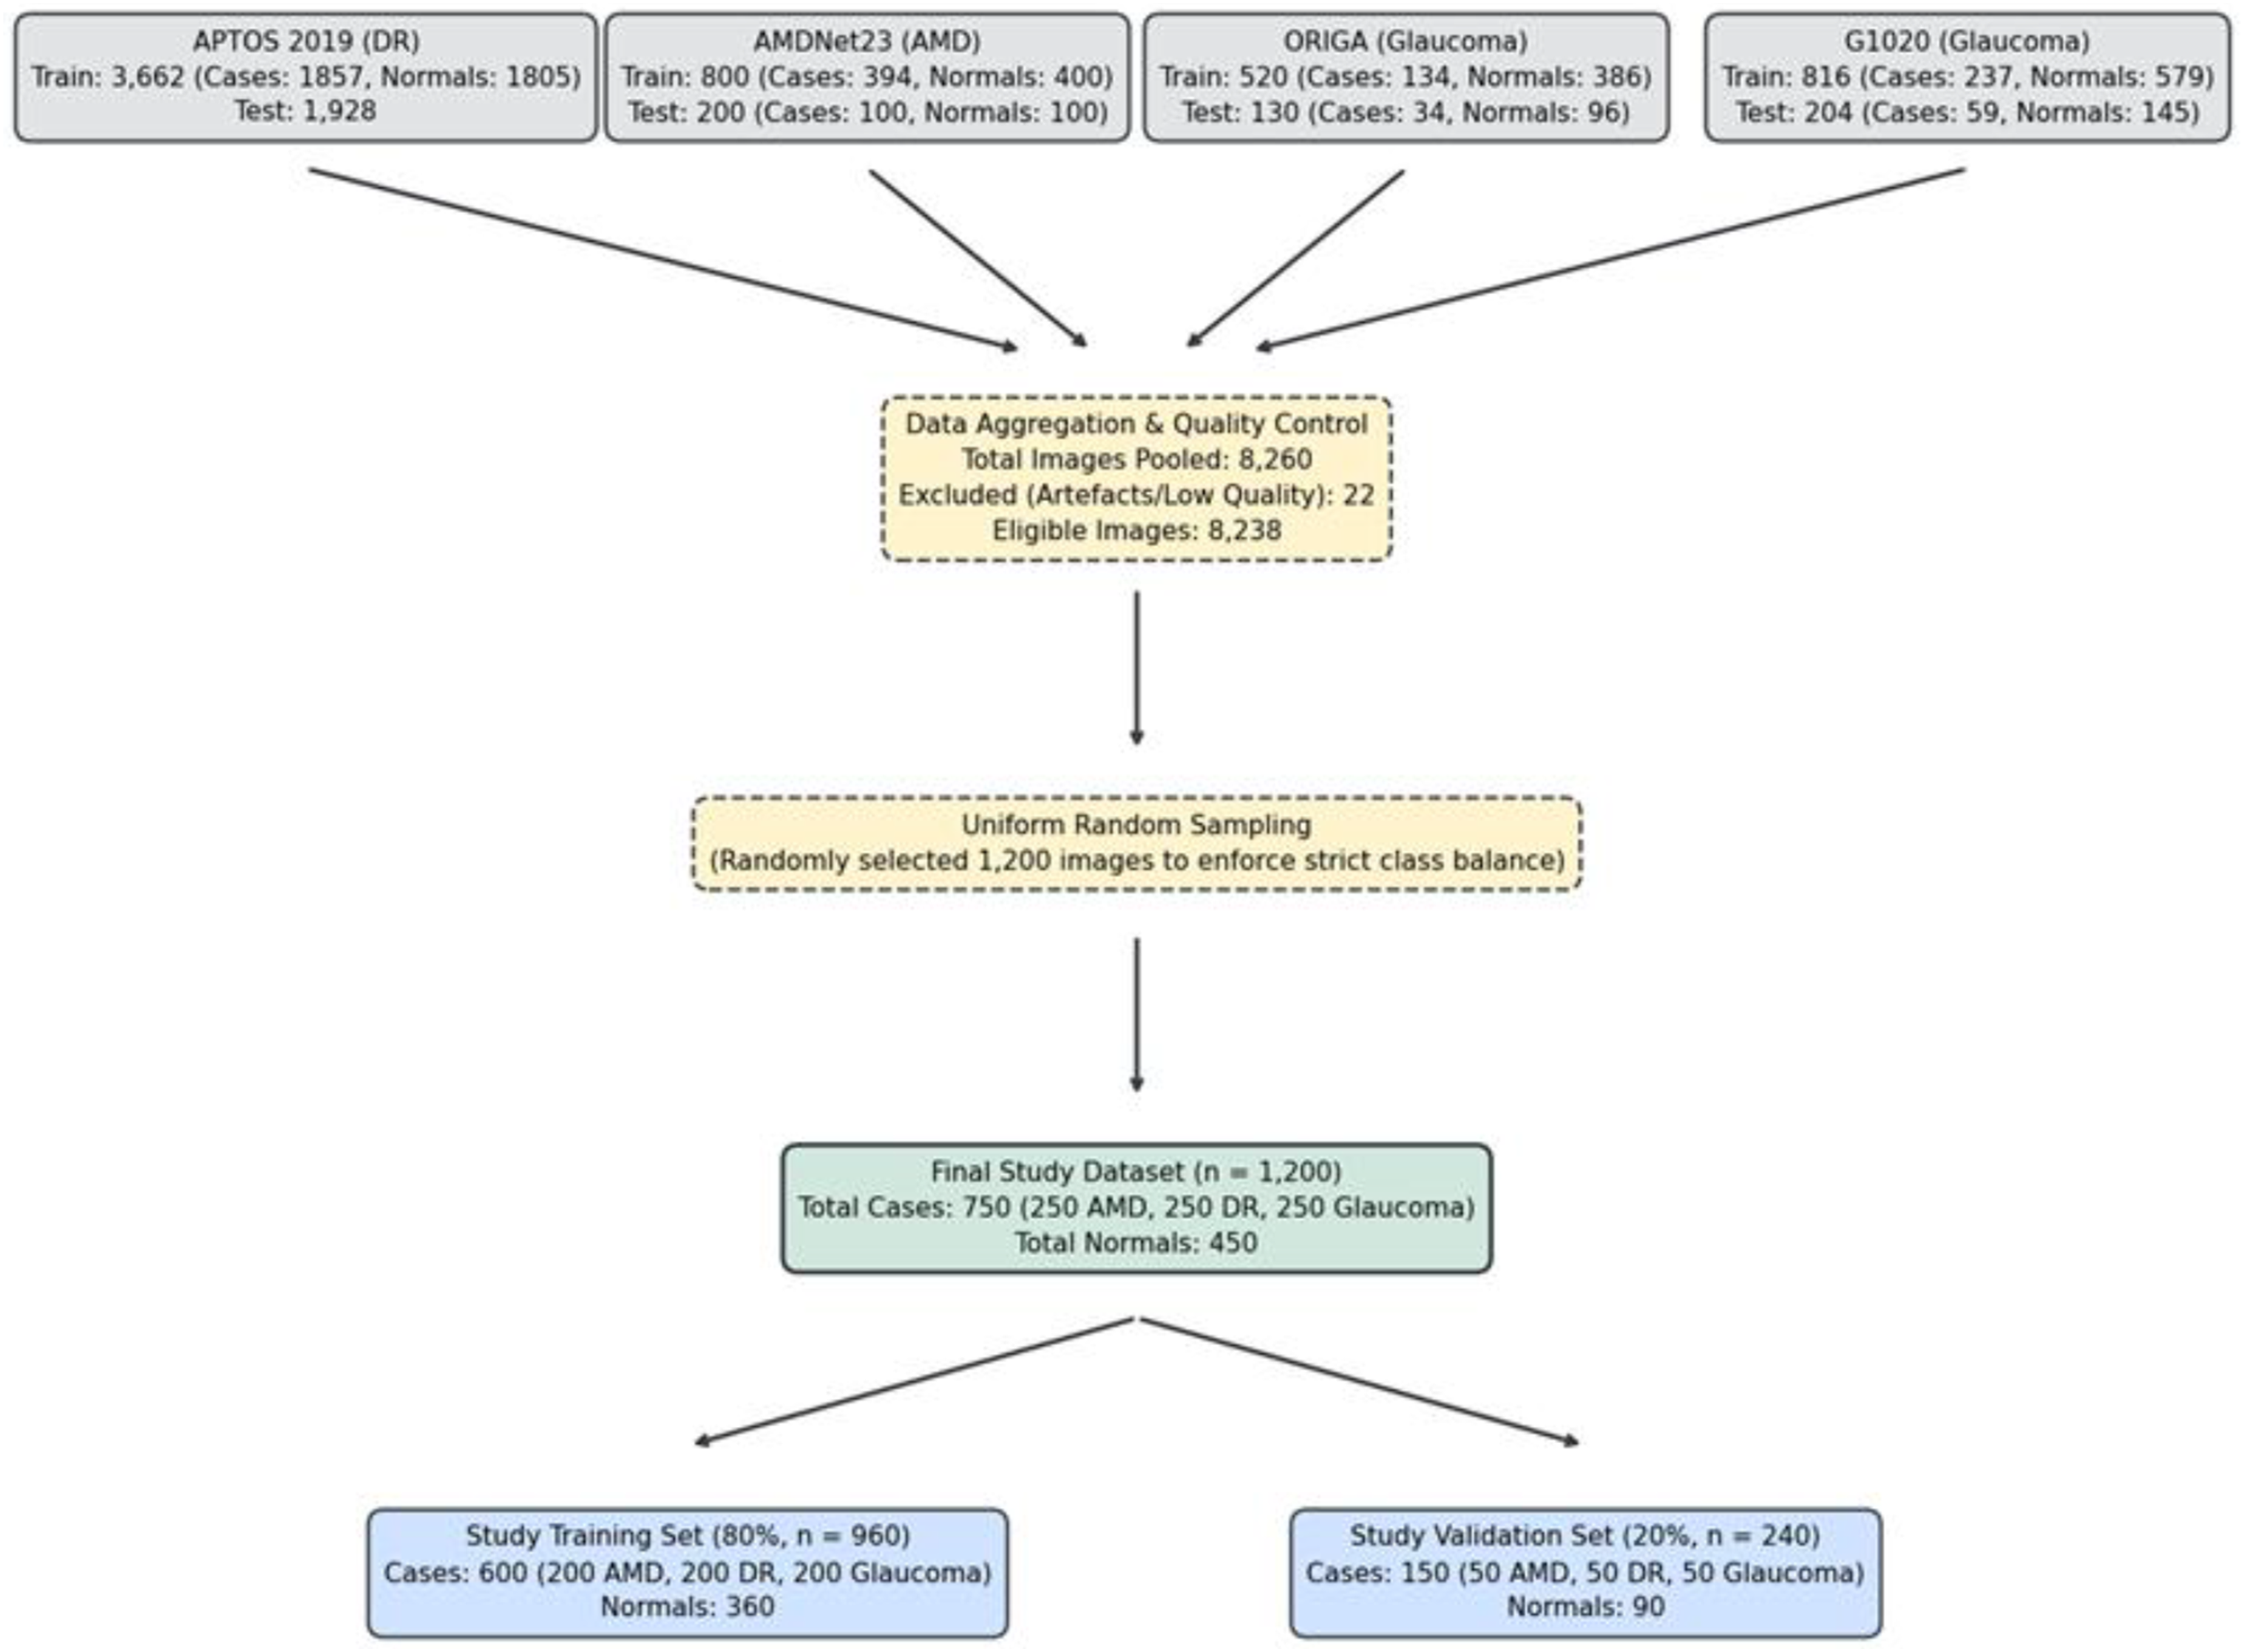
After importing the images into the experimental platform, counts and visualisations of samples were made (Figure 2). Sampled original fundus images of age-related macular degeneration, diabetic retinopathy, glaucoma, and normal classes used for the baseline experiments. Data were sourced from public repositories (APTOS2019, AMDNet23, ORIGA and G1020)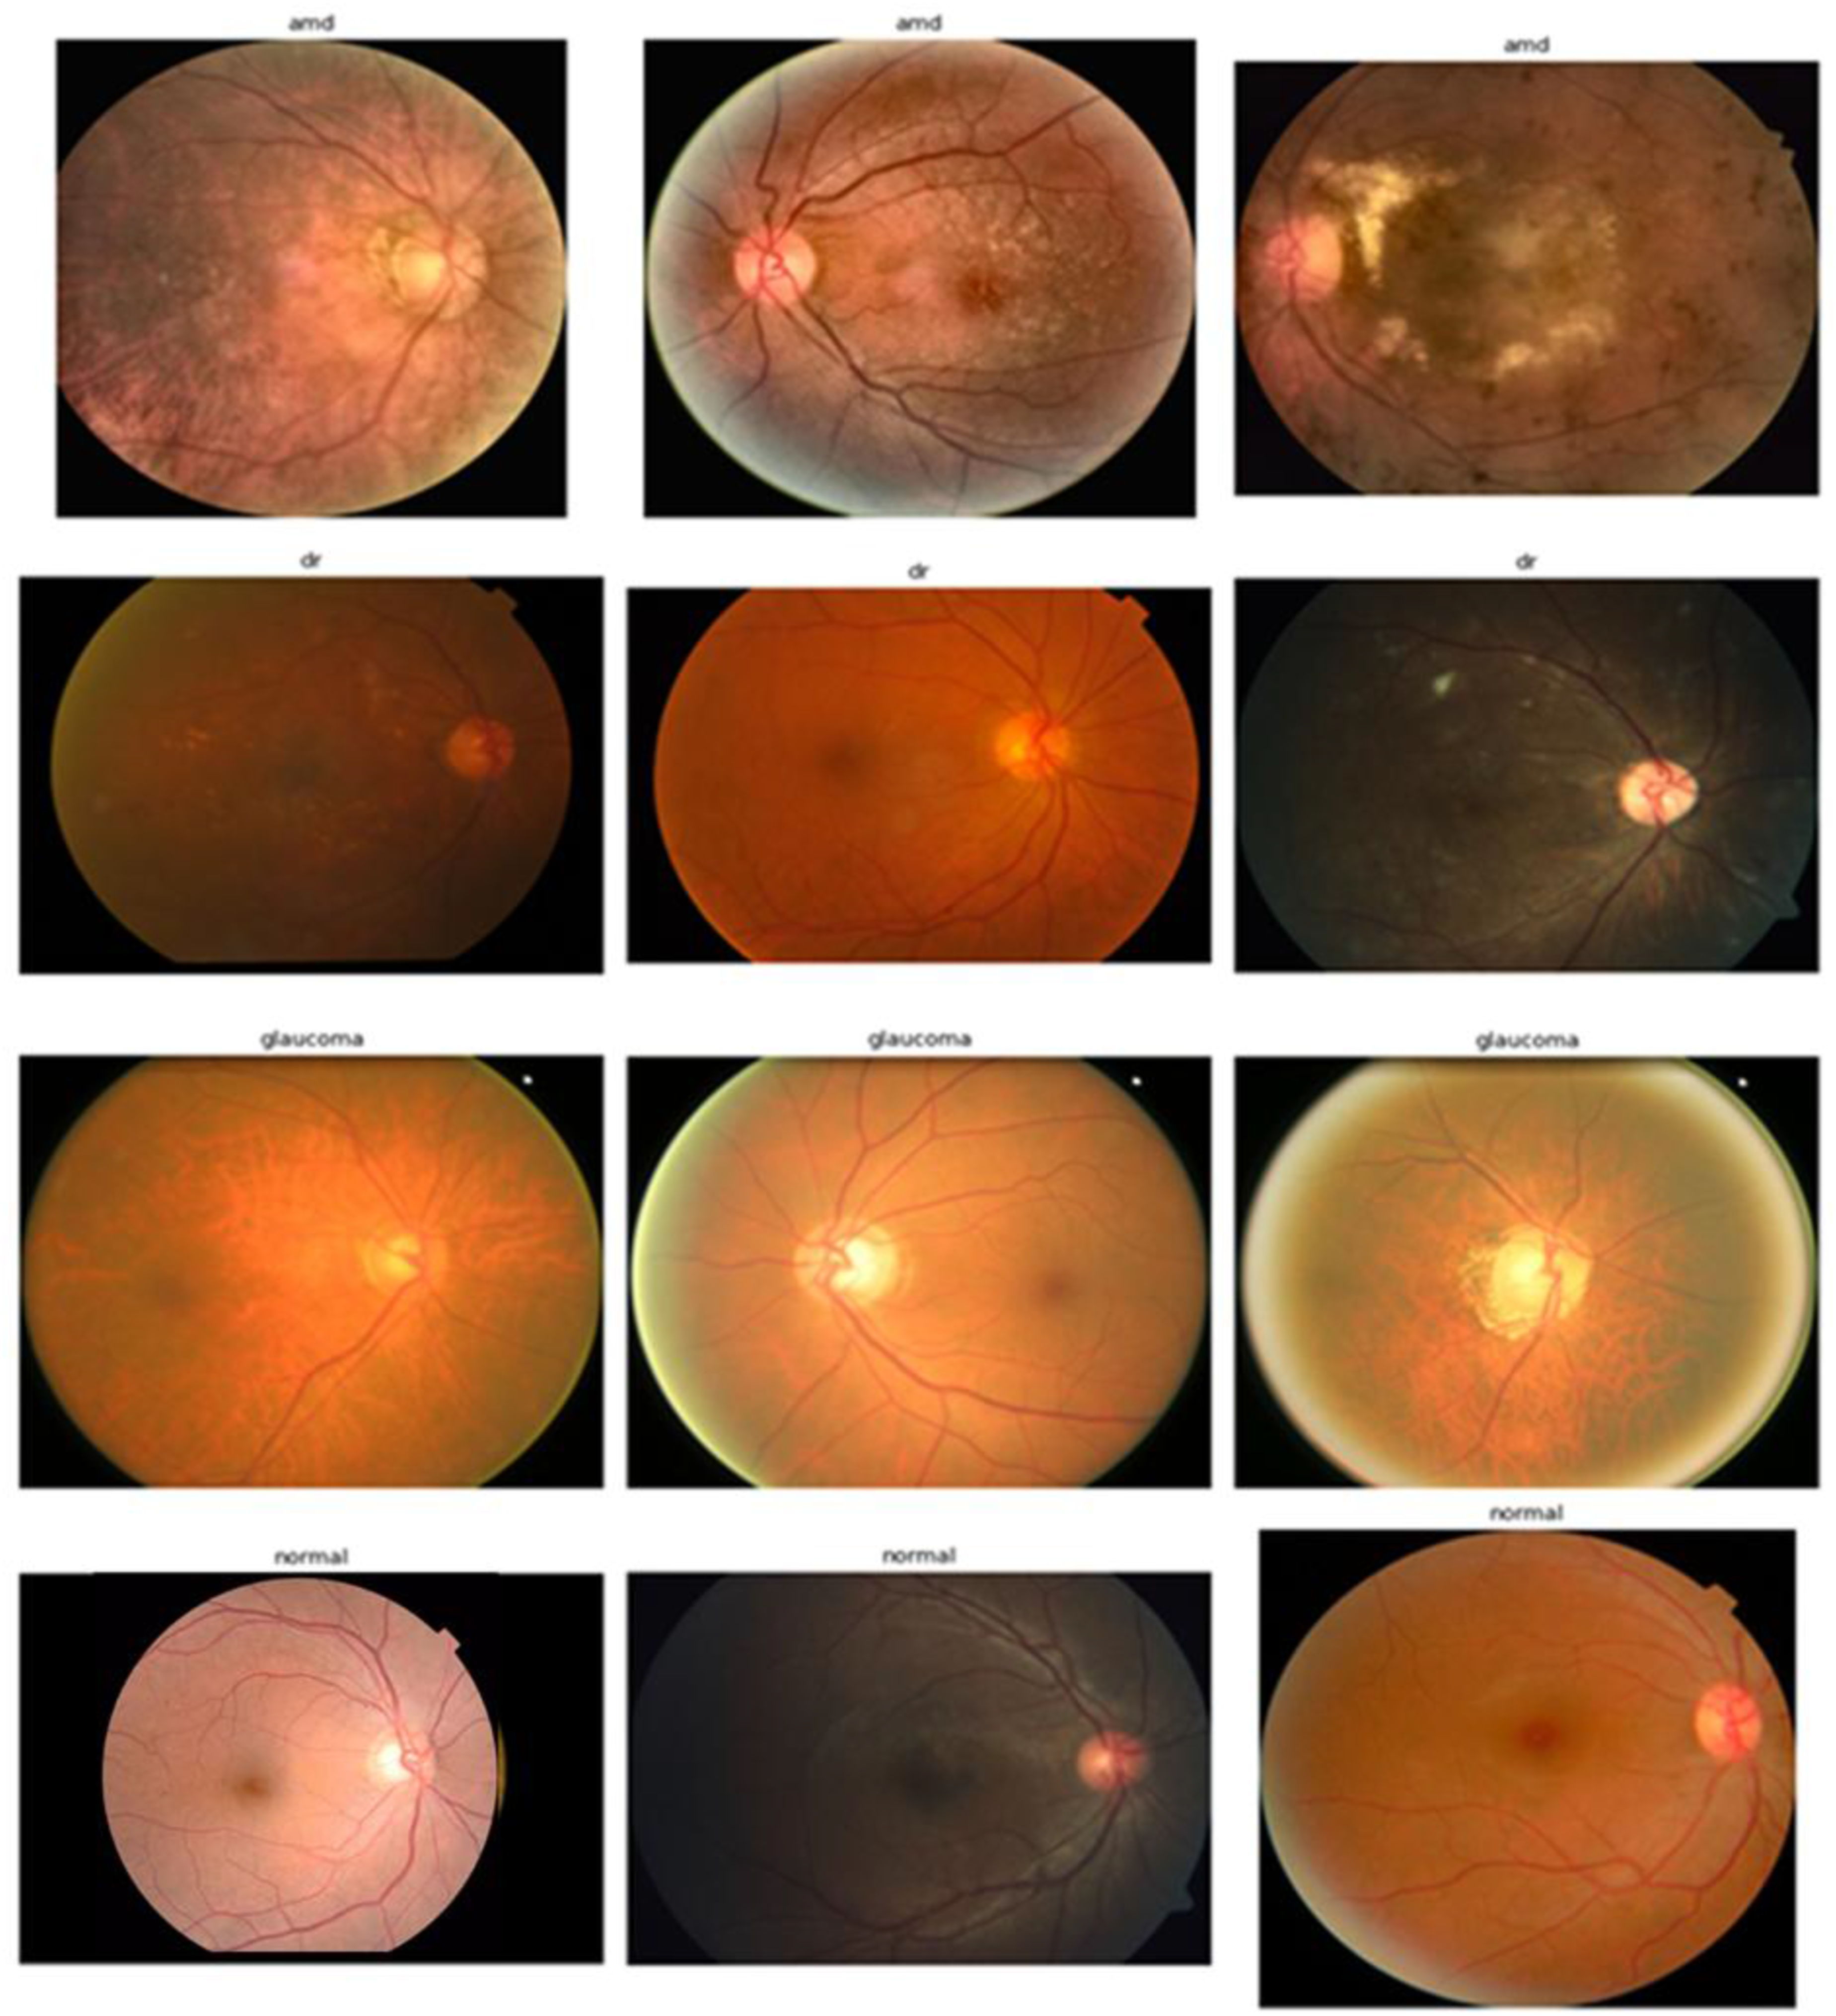
Computational environment
All experiments were implemented in Python and executed on Google Colaboratory Research Platform (Pro version) using an NVIDIA L4 GPU.
Data preprocessing
A standardised preprocessing pipeline was implemented to ensure uniform image quality and model compatibility. Each image was cropped to isolate the circular retinal region, removing surrounding black borders. The original RGB fundus photographs were converted to an 8-bit grayscale format to facilitate pixel intensity analysis. A binary thresholding function was subsequently applied to distinguish the illuminated retinal fundus from the dark background. This involved setting a strict low-intensity threshold to segment near-black background pixels from the brighter foreground structures. Following binarisation, a topological contour detection algorithm was used across the mask to map all continuous foreground regions. To filter out disconnected artefactual blobs, such as light reflections or sensor noise, the algorithm calculated the spatial area of all detected contours. It then isolated the single contour possessing the maximum continuous pixel area, identifying it as the primary region of interest (ROI) defining the retinal field of view. A rectilinear bounding box was then computed to encapsulate the extreme spatial coordinates of this primary contour. Then, the original RGB image was cropped to the exact coordinate dimensions of this bounding box, to remove the redundant black borders.
The cropped images were resized to 224 × 224 pixels and normalised using ImageNet statistics with mean values [0.485, 0.456, 0.406] and standard deviations [0.229, 0.224, 0.225].
To prevent data leakage, the 80/20 train-validation split was executed before any image cropping, normalisation, or augmentation. The validation set remained strictly isolated and locked throughout all experimental phases.
Data augmentation techniques
Six augmentation techniques were implemented, selected to represent three broad categories of image transformations (Figure 3). Photometric augmentations included colour jitter and contrast-limited adaptive histogram equalisation (CLAHE). Geometric augmentations included random rotation and translation, while noise-based augmentations included Gaussian noise and Poisson noise. Each technique was applied independently and in paired combinations during different experiment phases. The following augmentation parameters were used: (a) Colour Jitter (random ±30 % brightness/contrast/saturation, ±0.1 hue); (b) CLAHE (clip limit = 2.0 over 8×8 tiles); (c) Random Rotation (±10°); (d) Translation (±10 % horizontal/vertical shift); (e) Gaussian Noise (σ = 0.1); (f) Poisson Noise (photon-count noise via scale = 1.0). Visualisation of data augmentation techniques. Rotation has been set to an angle of 180 degrees for visualisation purposes.
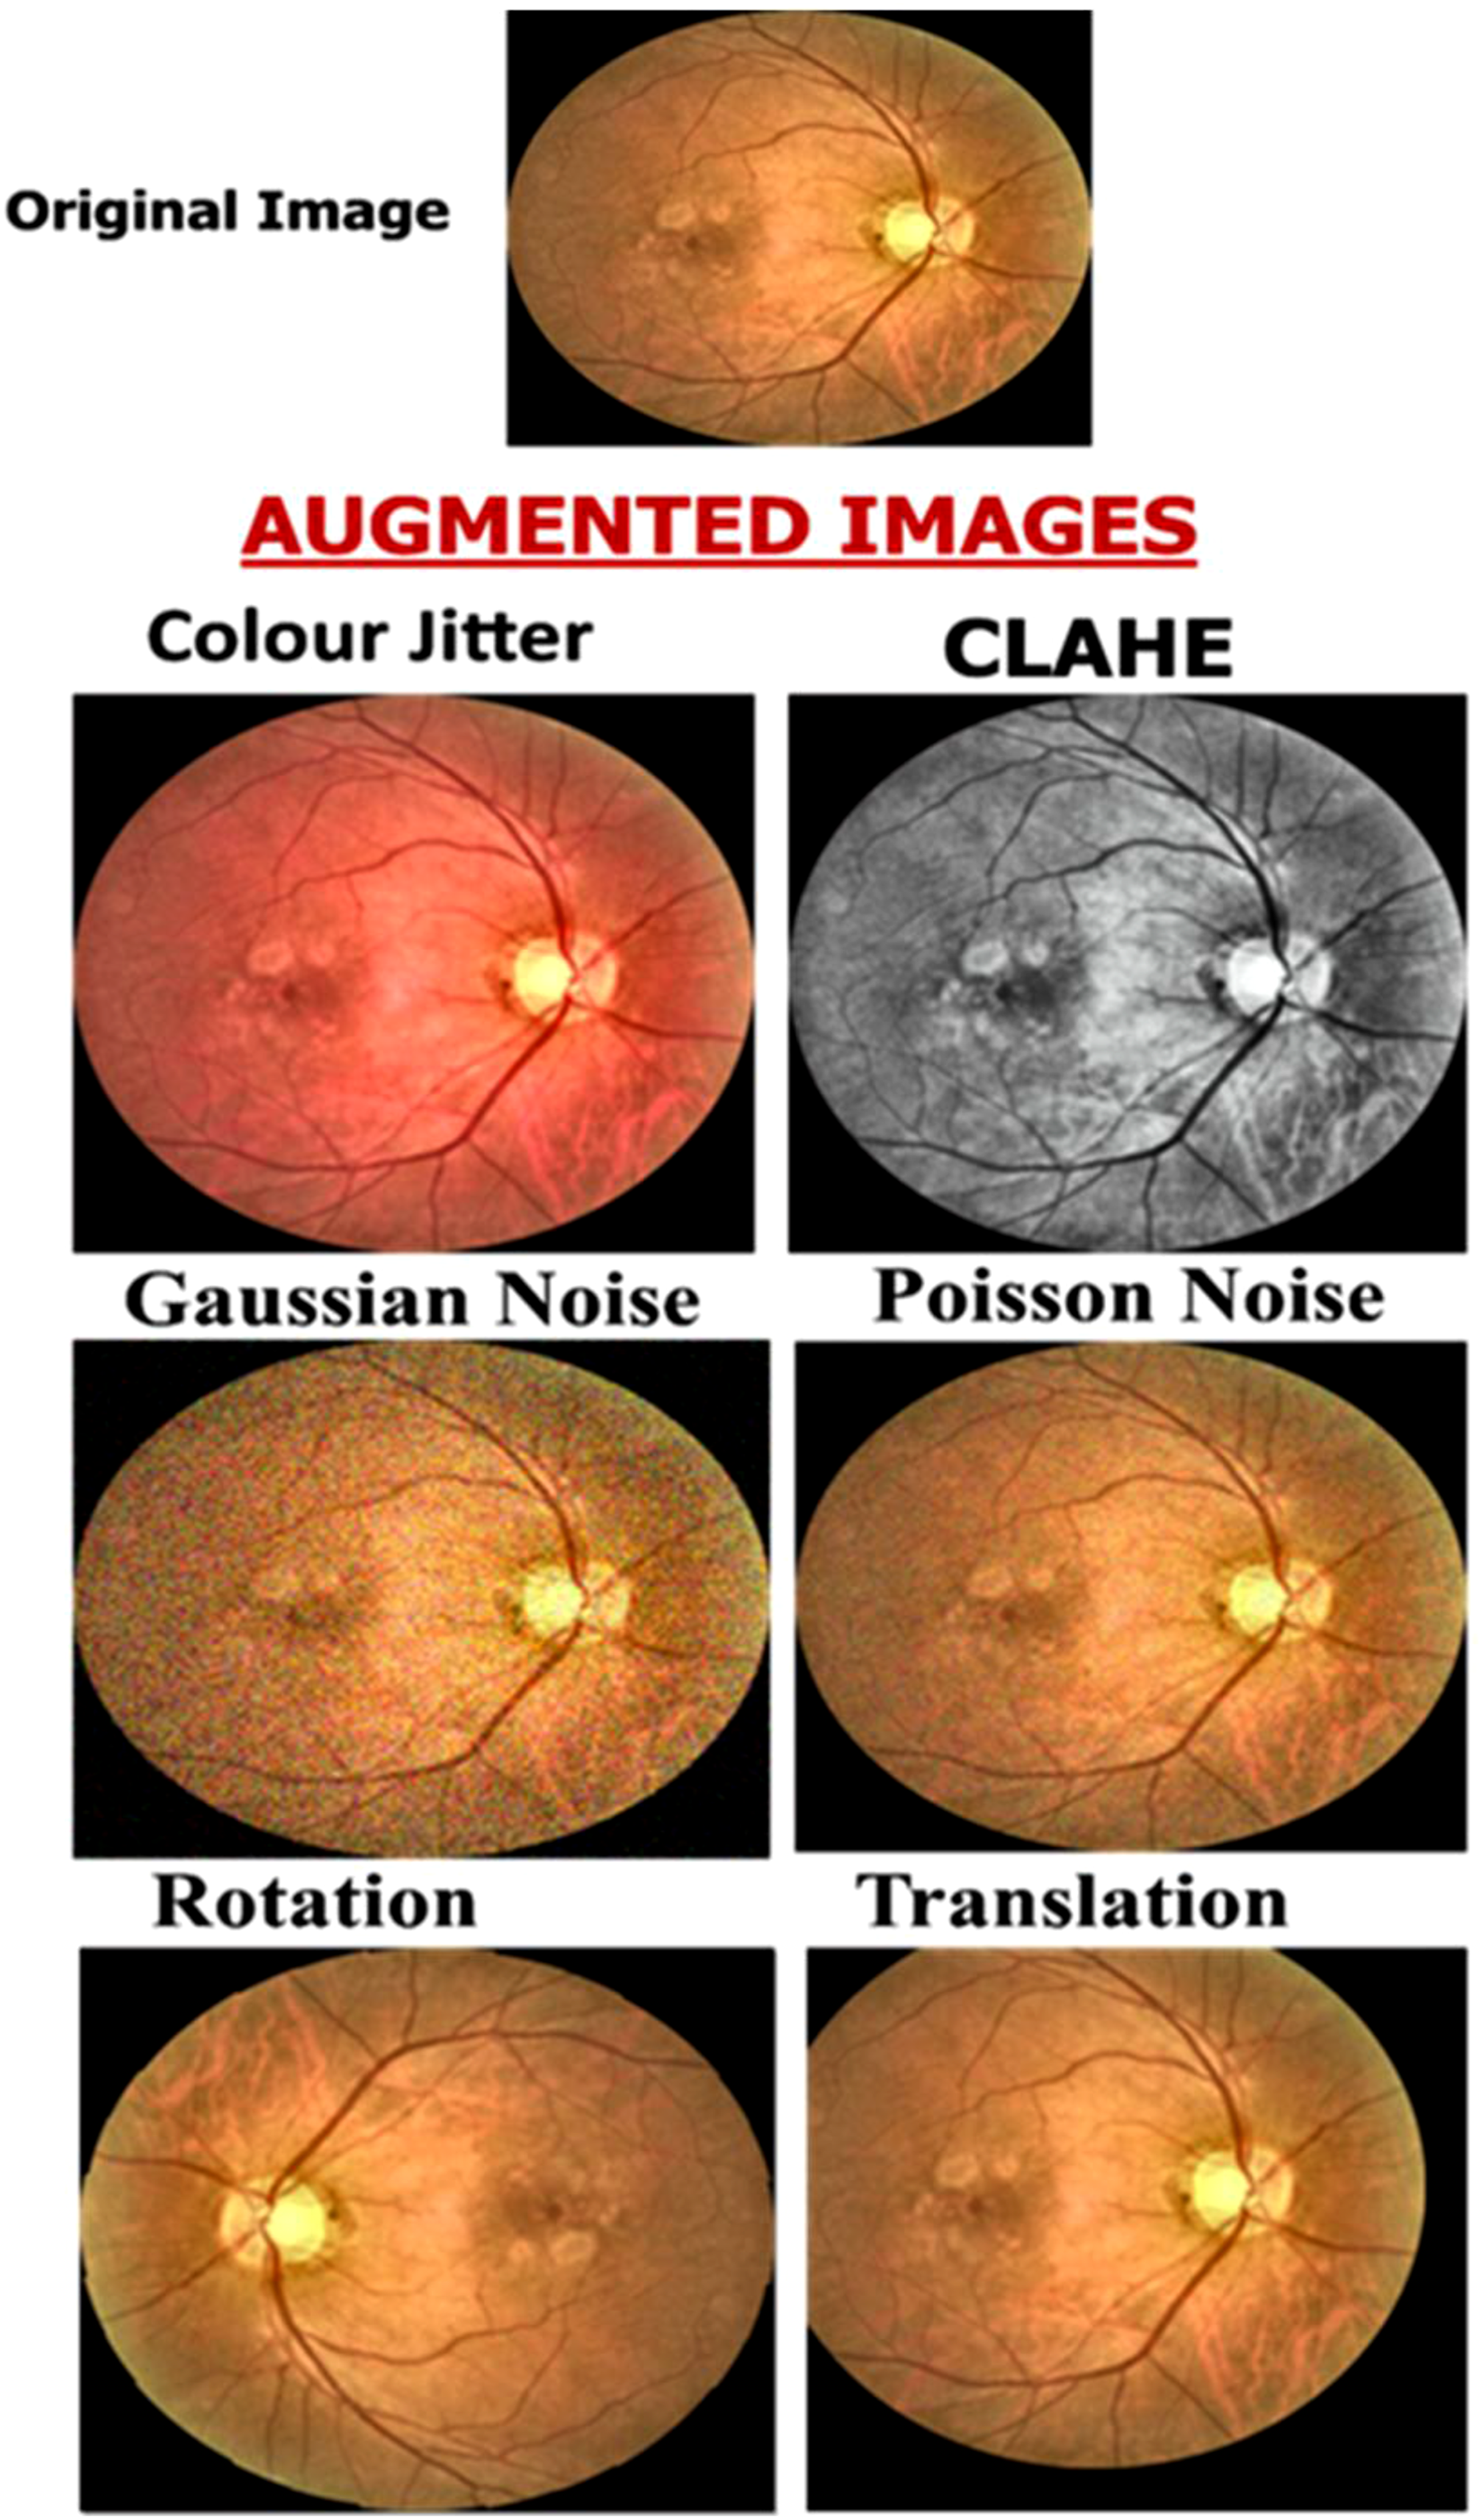
These specific six techniques were chosen because they represent three broad categories of image transformations that systematically simulate the primary sources of real-world clinical imaging variability. Photometric augmentations (colour jitter and CLAHE) simulate variations in camera illumination; geometric augmentations (random rotation and translation) replicate spatial misalignments; and noise-based augmentations (Gaussian and Poisson noise) simulate digital sensor artefacts.
Model architecture
The EfficientNet-B0 model served as the core network architecture. 21 EfficientNet uses compound scaling to optimise model depth, width, and input resolution, achieving high performance with reduced computational cost. 21 To leverage the benefits of transfer learning and accelerate convergence, the EfficientNet-B0 model was initialised using pre-trained ImageNet weights. The original final classification layer was replaced with a fully connected layer consisting of four output neurons representing the four target classes: normal, DR, AMD, and glaucoma. A Softmax activation function was applied to the output layer to produce class probabilities, and the cross-entropy loss function was used for model optimisation.
Training hyperparameters
Training was conducted using the Adam optimiser with an initial learning rate of 0.001. The learning rate was dynamically adjusted using a ReduceLROnPlateau scheduler that decreased the rate by a factor of 0.1 when validation performance stagnated for two consecutive epochs. A batch size of 32 was used for all runs, with training conducted for up to 50 epochs. Early stopping with a patience of five epochs prevented overfitting. Weight decay was set at 0.0001, and a dropout rate of 0.2 was applied in the final classifier layer to improve regularisation and generalisation.
Experimental phases
The experimental workflow consisted of four distinct phases (Figure 4). Overview of the four experimental phases.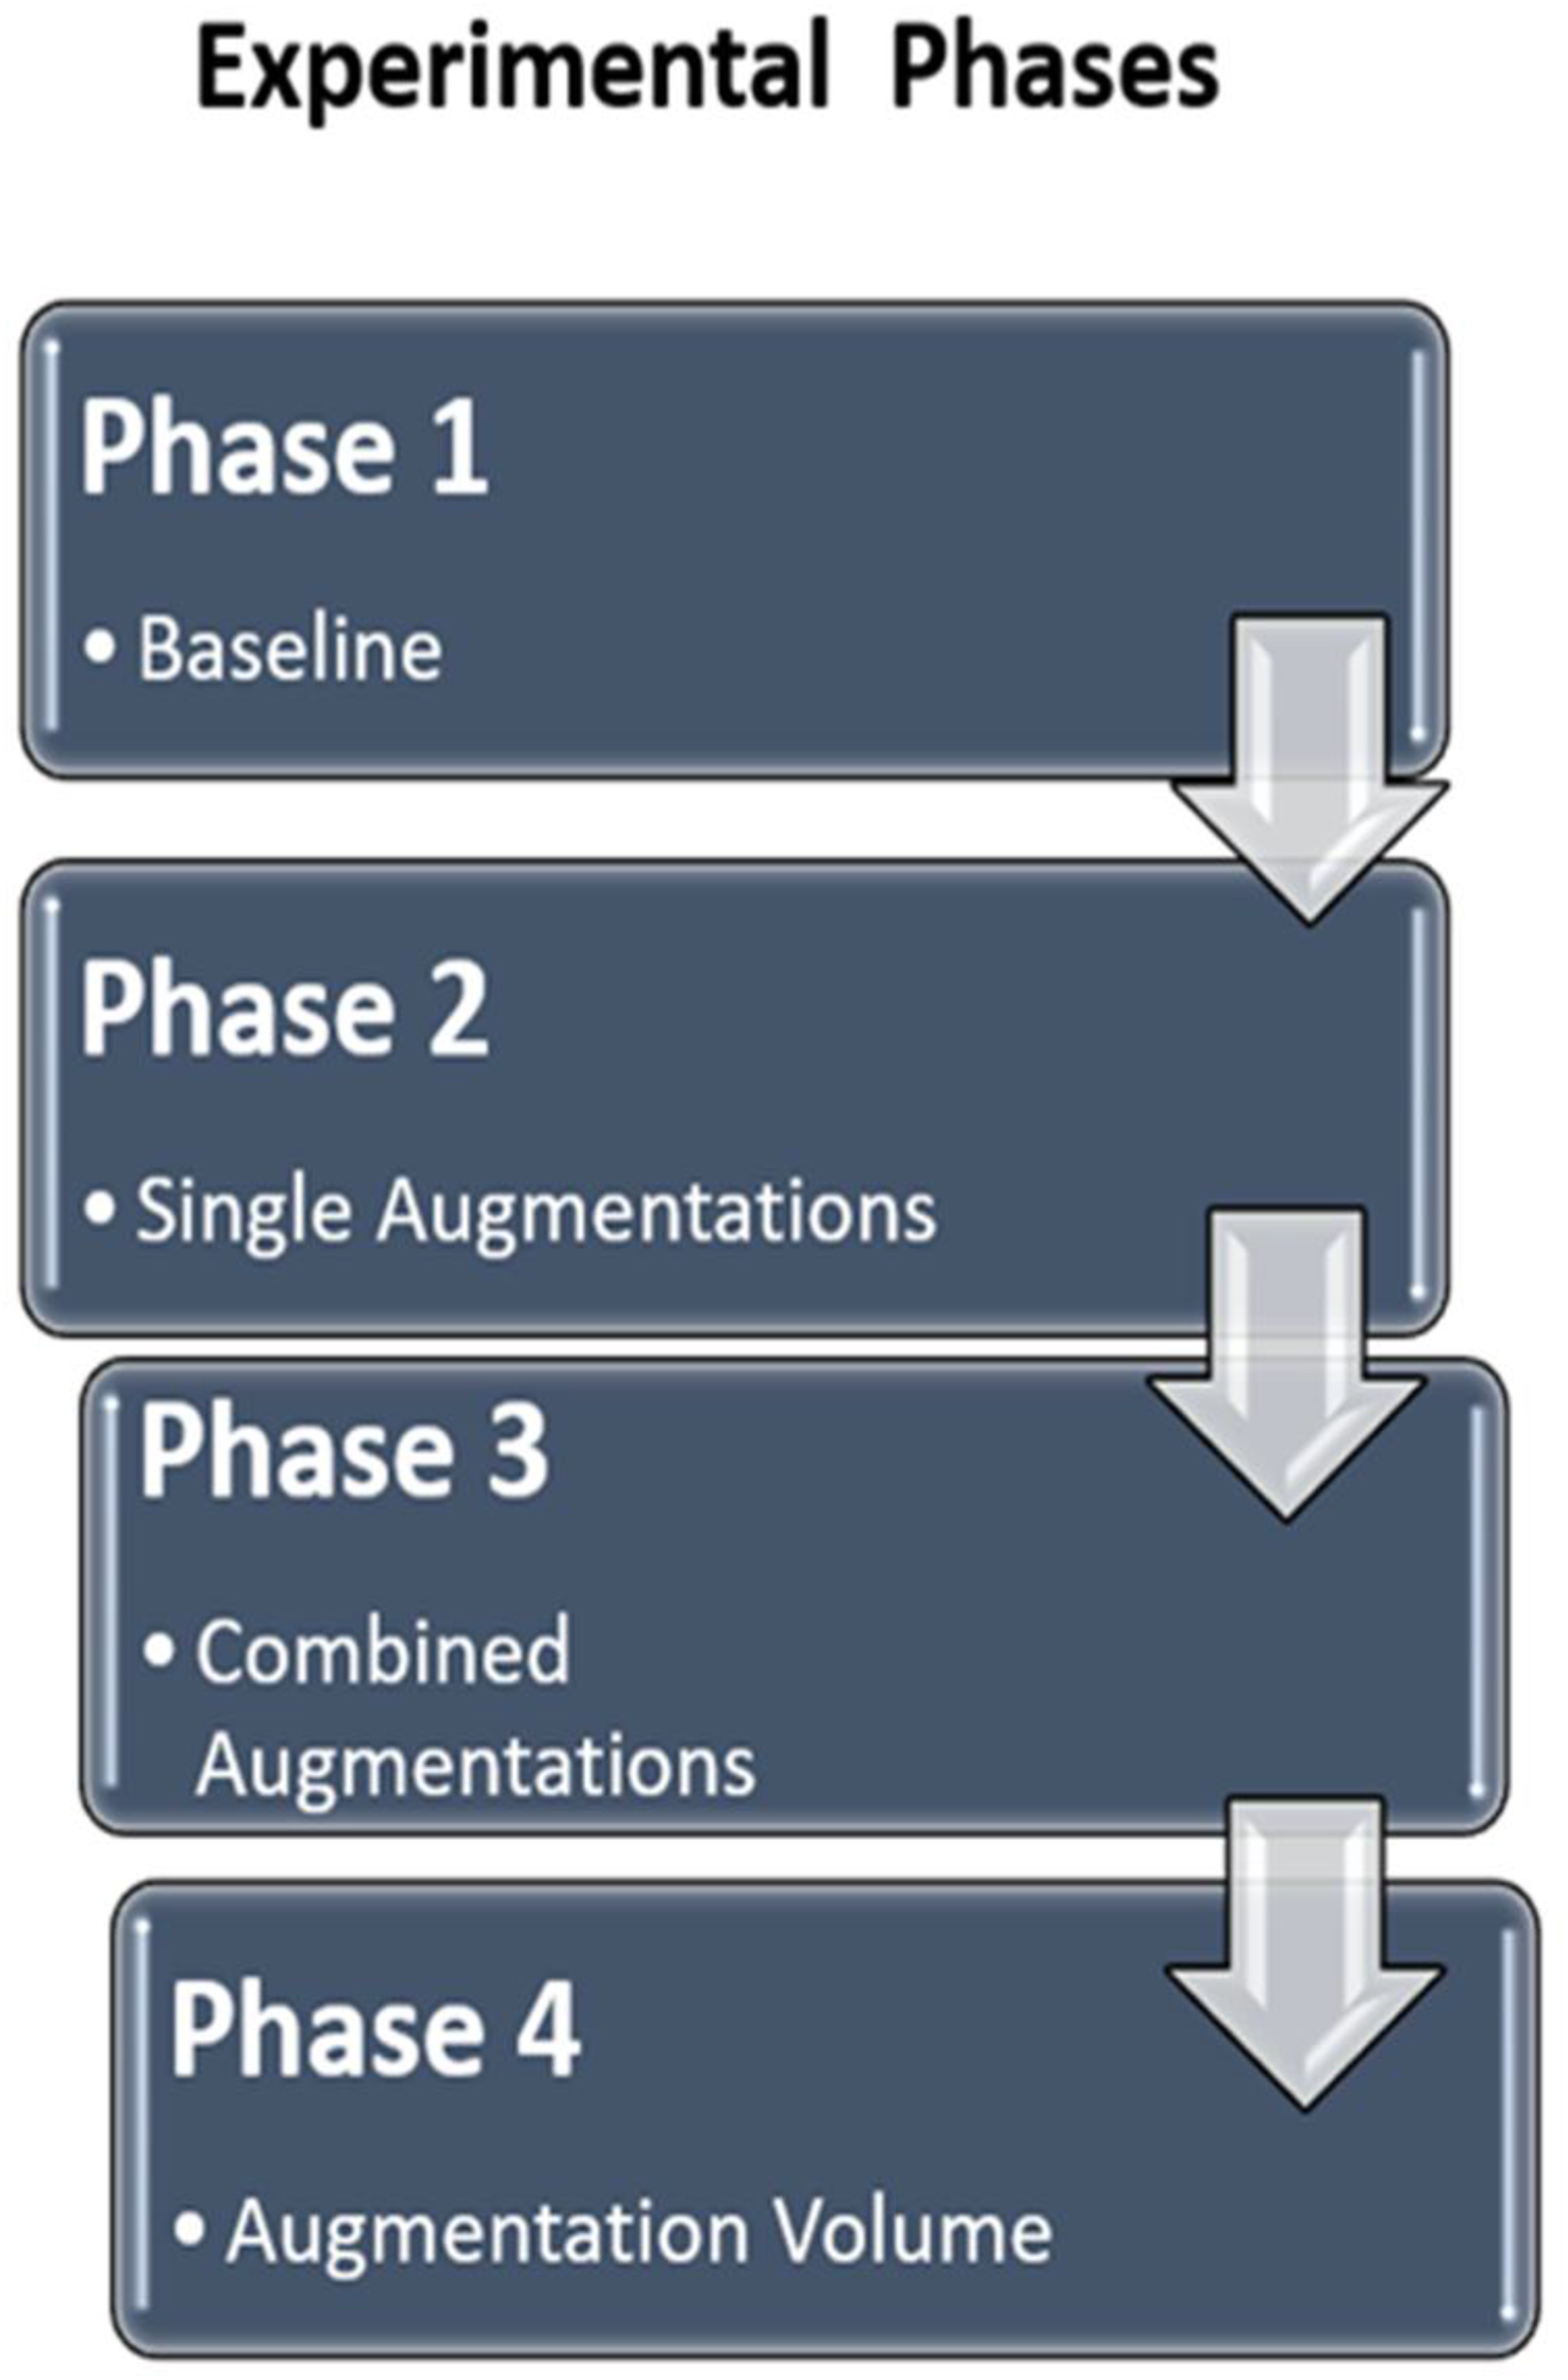
In Phase 1, a baseline model was trained using only pre-processed images without any augmentation to establish a reference performance level. Phase 2 involved training six separate models, each incorporating a single augmentation technique, to evaluate the isolated effect of each transformation. To measure the impact each augmentation provides over the baseline, the original training images were augmented, generating 500 augmented images per class (AMD, DR, glaucoma, and normal). For each specific model trained in this phase, the total number of training images was 2,960 (comprising the 960 original training images combined with 2,000 augmented images).
In standard complex DL pipelines, multiple augmentations are applied simultaneously, making it mathematically impossible to determine which specific augmentation drives performance gains or losses. By restricting training and testing to a single independent variable at a time, the ablation approach eliminates confounding interactive effects. Consequently, any observed variance in the model’s performance metrics is directly and causally attributable to the isolated augmentation technique being evaluated.
Phase 3 assessed the combined impact of augmentations by pairing complementary augmentations, such as geometric with photometric or noise-based methods. These combined augmentations were applied sequentially to ensure the maximum combinatorial effect was evaluated. Finally, Phase 4 examined how dataset size influenced model performance by training models on progressively larger datasets of 500, 1,000, and 1,500 images per class, simulating the effect of data availability. The Phase 4 models were trained independently using newly generated augmented images at each volume. Consequently, the 500-images-per-class estimates may differ slightly from the corresponding Phase 2 results.
Evaluation metrics and data analysis
Data analysis and model performance were evaluated using Python-based statistical and visualisation libraries, including Scikit-learn, NumPy, Pandas, Matplotlib, and Seaborn. For each experiment, accuracy, precision, recall, F1-score (macro-averaging to treat all four disease classes equally), and area under the receiver operating characteristic curve (ROC-AUC) were computed from the validation dataset to quantify model performance. The baseline model’s performance served as the reference point for evaluating the impact of each augmentation technique. The difference in validation accuracy between the augmented and baseline models was calculated to measure the net performance gain attributed to augmentation.
To visualize and interpret these effects, scatter plots of validation accuracy difference versus AUC were generated. This analysis provided a graphical summary of how each augmentation influenced both accuracy and diagnostic discrimination ability. Augmentations positioned in the upper-right quadrant of the plot represented techniques that improved both accuracy and AUC, indicating overall positive impact.
To evaluate metric stability and statistical significance without the computational burden of k-fold cross-validation, a non-parametric bootstrapping approach (1,000 iterations) was applied to the validation set predictions to derive 95% Confidence Intervals (CIs) and empirical p-values for the AUC comparisons (statistical significance compared to the baseline model defined as p < 0.05). This approach seamlessly accommodates multi-class macro-averaging without violating parametric assumptions. 22
Ethical considerations
The study protocol was reviewed and approved by the Institutional Review Board of the University of Cape Coast (UCCIRB/CHAS/2025/046).
Results
Performance of the baseline model
The baseline model, trained on the original fundus images without any data augmentation, achieved a validation accuracy of 85.83% and an AUC of 96.55%. The model performed very well on diabetic retinopathy (DR) and age-related macular degeneration (AMD) images, achieving precisions of 97% and 96%, respectively, and moderate precisions in the Glaucoma and the control groups (63% and 84% respectively).
Impact of individual augmentation techniques
Comparison of performance of deep learning models trained with individual augmentations.
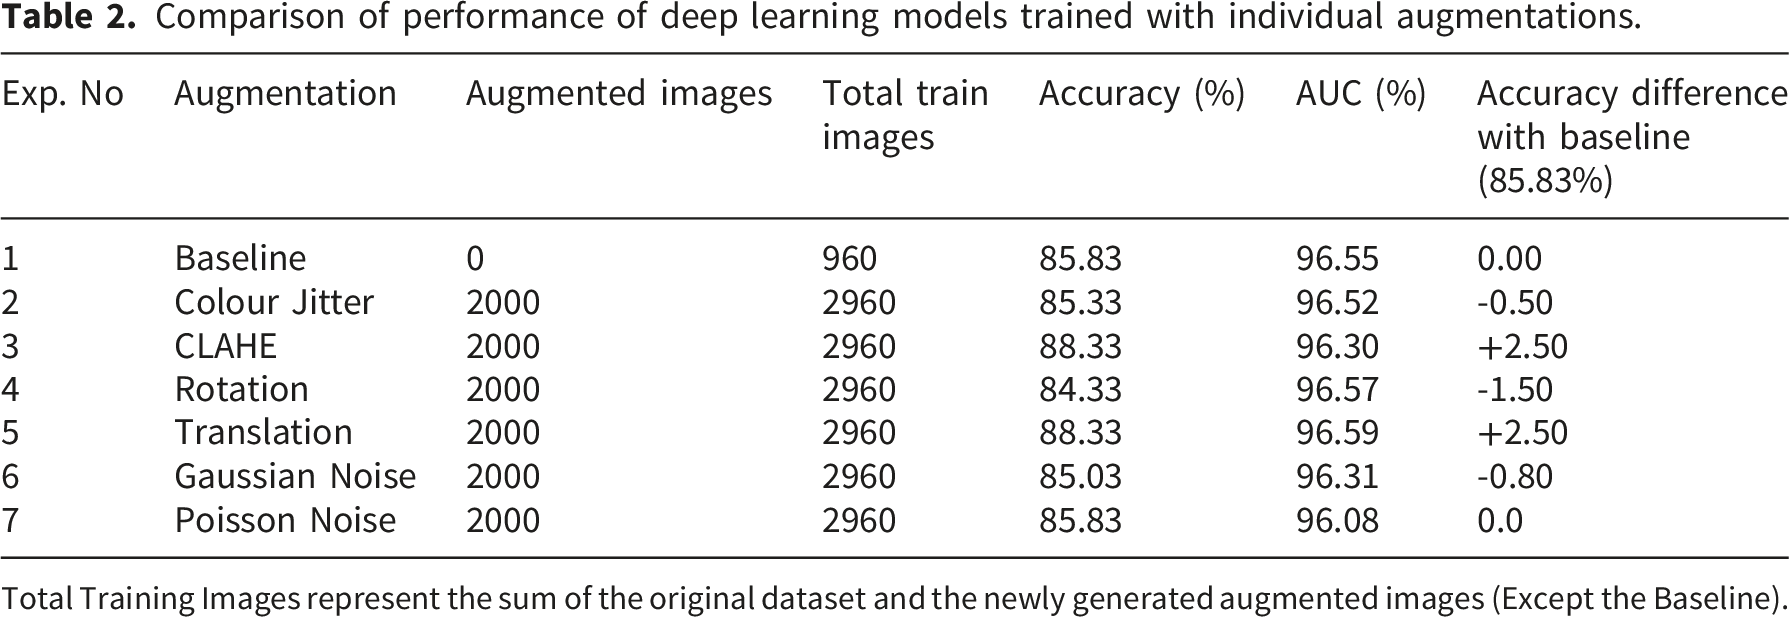
Total Training Images represent the sum of the original dataset and the newly generated augmented images (Except the Baseline).
While most techniques increased validation accuracy, CLAHE and translation were the most effective in improving the multi-disease classification of AMD, DR, and glaucoma. They achieved the highest individual validation accuracy of 88.33%, representing a +2.50% gain over the baseline. In contrast, some augmentations proved detrimental when used alone. Rotation and Gaussian noise decreased validation accuracy by 1.50% and 0.80%, respectively.
To visualise the trade-off between accuracy and discriminative power, the change in validation accuracy against the absolute AUC for each technique was plotted (Figure 5). Figure 5 reveals critical variations in data augmentation efficacy. Translation was the only single technique to simultaneously improve both metrics. It is situated in the optimal upper-right quadrant. However, CLAHE matched the accuracy gain of translation but resulted in a marginal loss of discriminative power compared to the baseline. Raw accuracy improvements do not uniformly translate to overall model robustness. Techniques such as rotation and Gaussian noise occupied the lower-left quadrant. This positioning indicates a detrimental effect on both metrics when applied in isolation. Scatter plot of validation‐accuracy difference (%) versus AUC (%) for each augmentation, relative to the baseline. Each point represents one augmentation experiment, coloured by augmentation type. The X-axis represents the change in validation accuracy versus baseline (0 % vertical line). The y-axis represents observed AUC (%) with a horizontal reference at baseline (96.55 %). Points in the top-right quadrant represent augmentations that improve both metrics simultaneously, whereas those elsewhere highlight trade-offs or negligible change.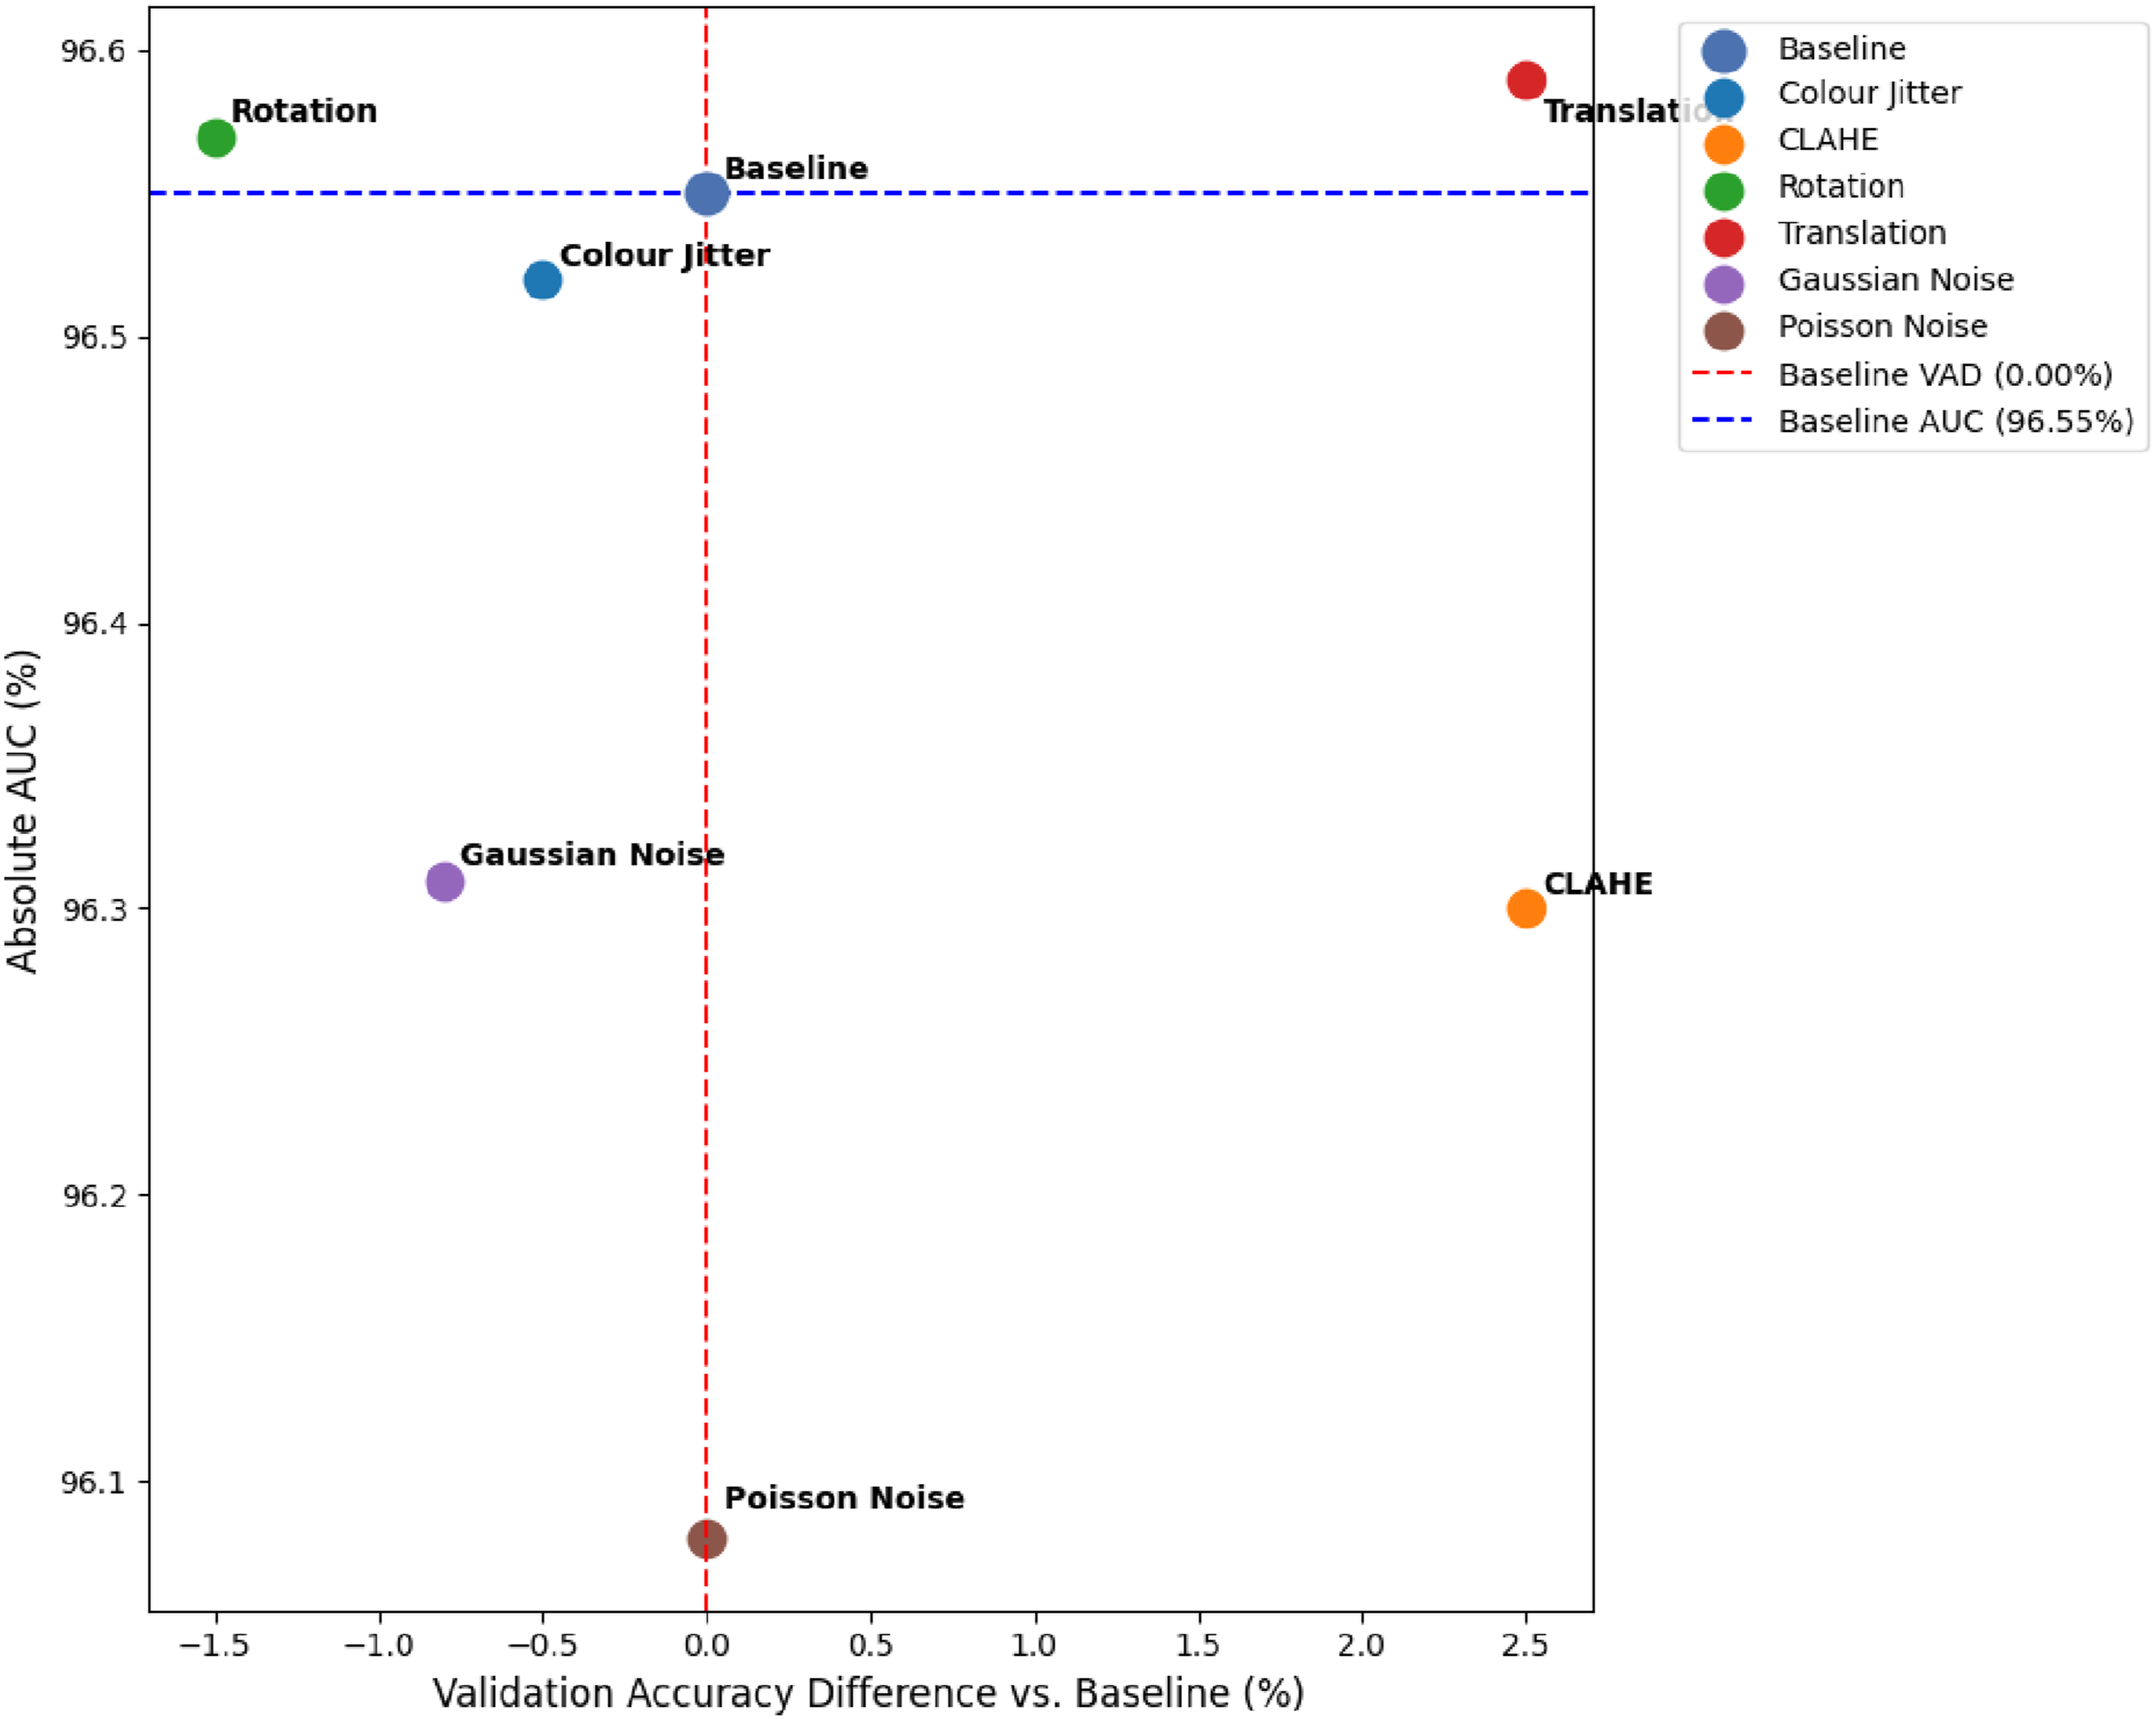
Disease-specific performance of single augmentations
Classification performance of the baseline and augmented models for AMD, DR, glaucoma, and normal classes.

Impact of combined augmentation strategies
Performance of combined augmentation techniques.

Figure 6 visualises the combinatorial effects of these augmentations. It clearly demonstrates the superiority of heterogeneous combinations. The comprehensive model (Photo + Geom + Noise) dominates the upper-right quadrant, achieving the maximum net gain in both accuracy and AUC. A key observation from this plot is the stark contrast between inter-family and intra-family combinations. Combining distinct augmentation families consistently yielded positive net gains. Intra-family combinations, such as rotation paired with translation, severely degraded performance. These models dropped into the lower-left quadrant below the baseline. Simulating a diverse variety of real-world variations is highly effective. Scatter plot of validation-accuracy difference (%) against AUC (%) for baseline and combined-augmentation experiments.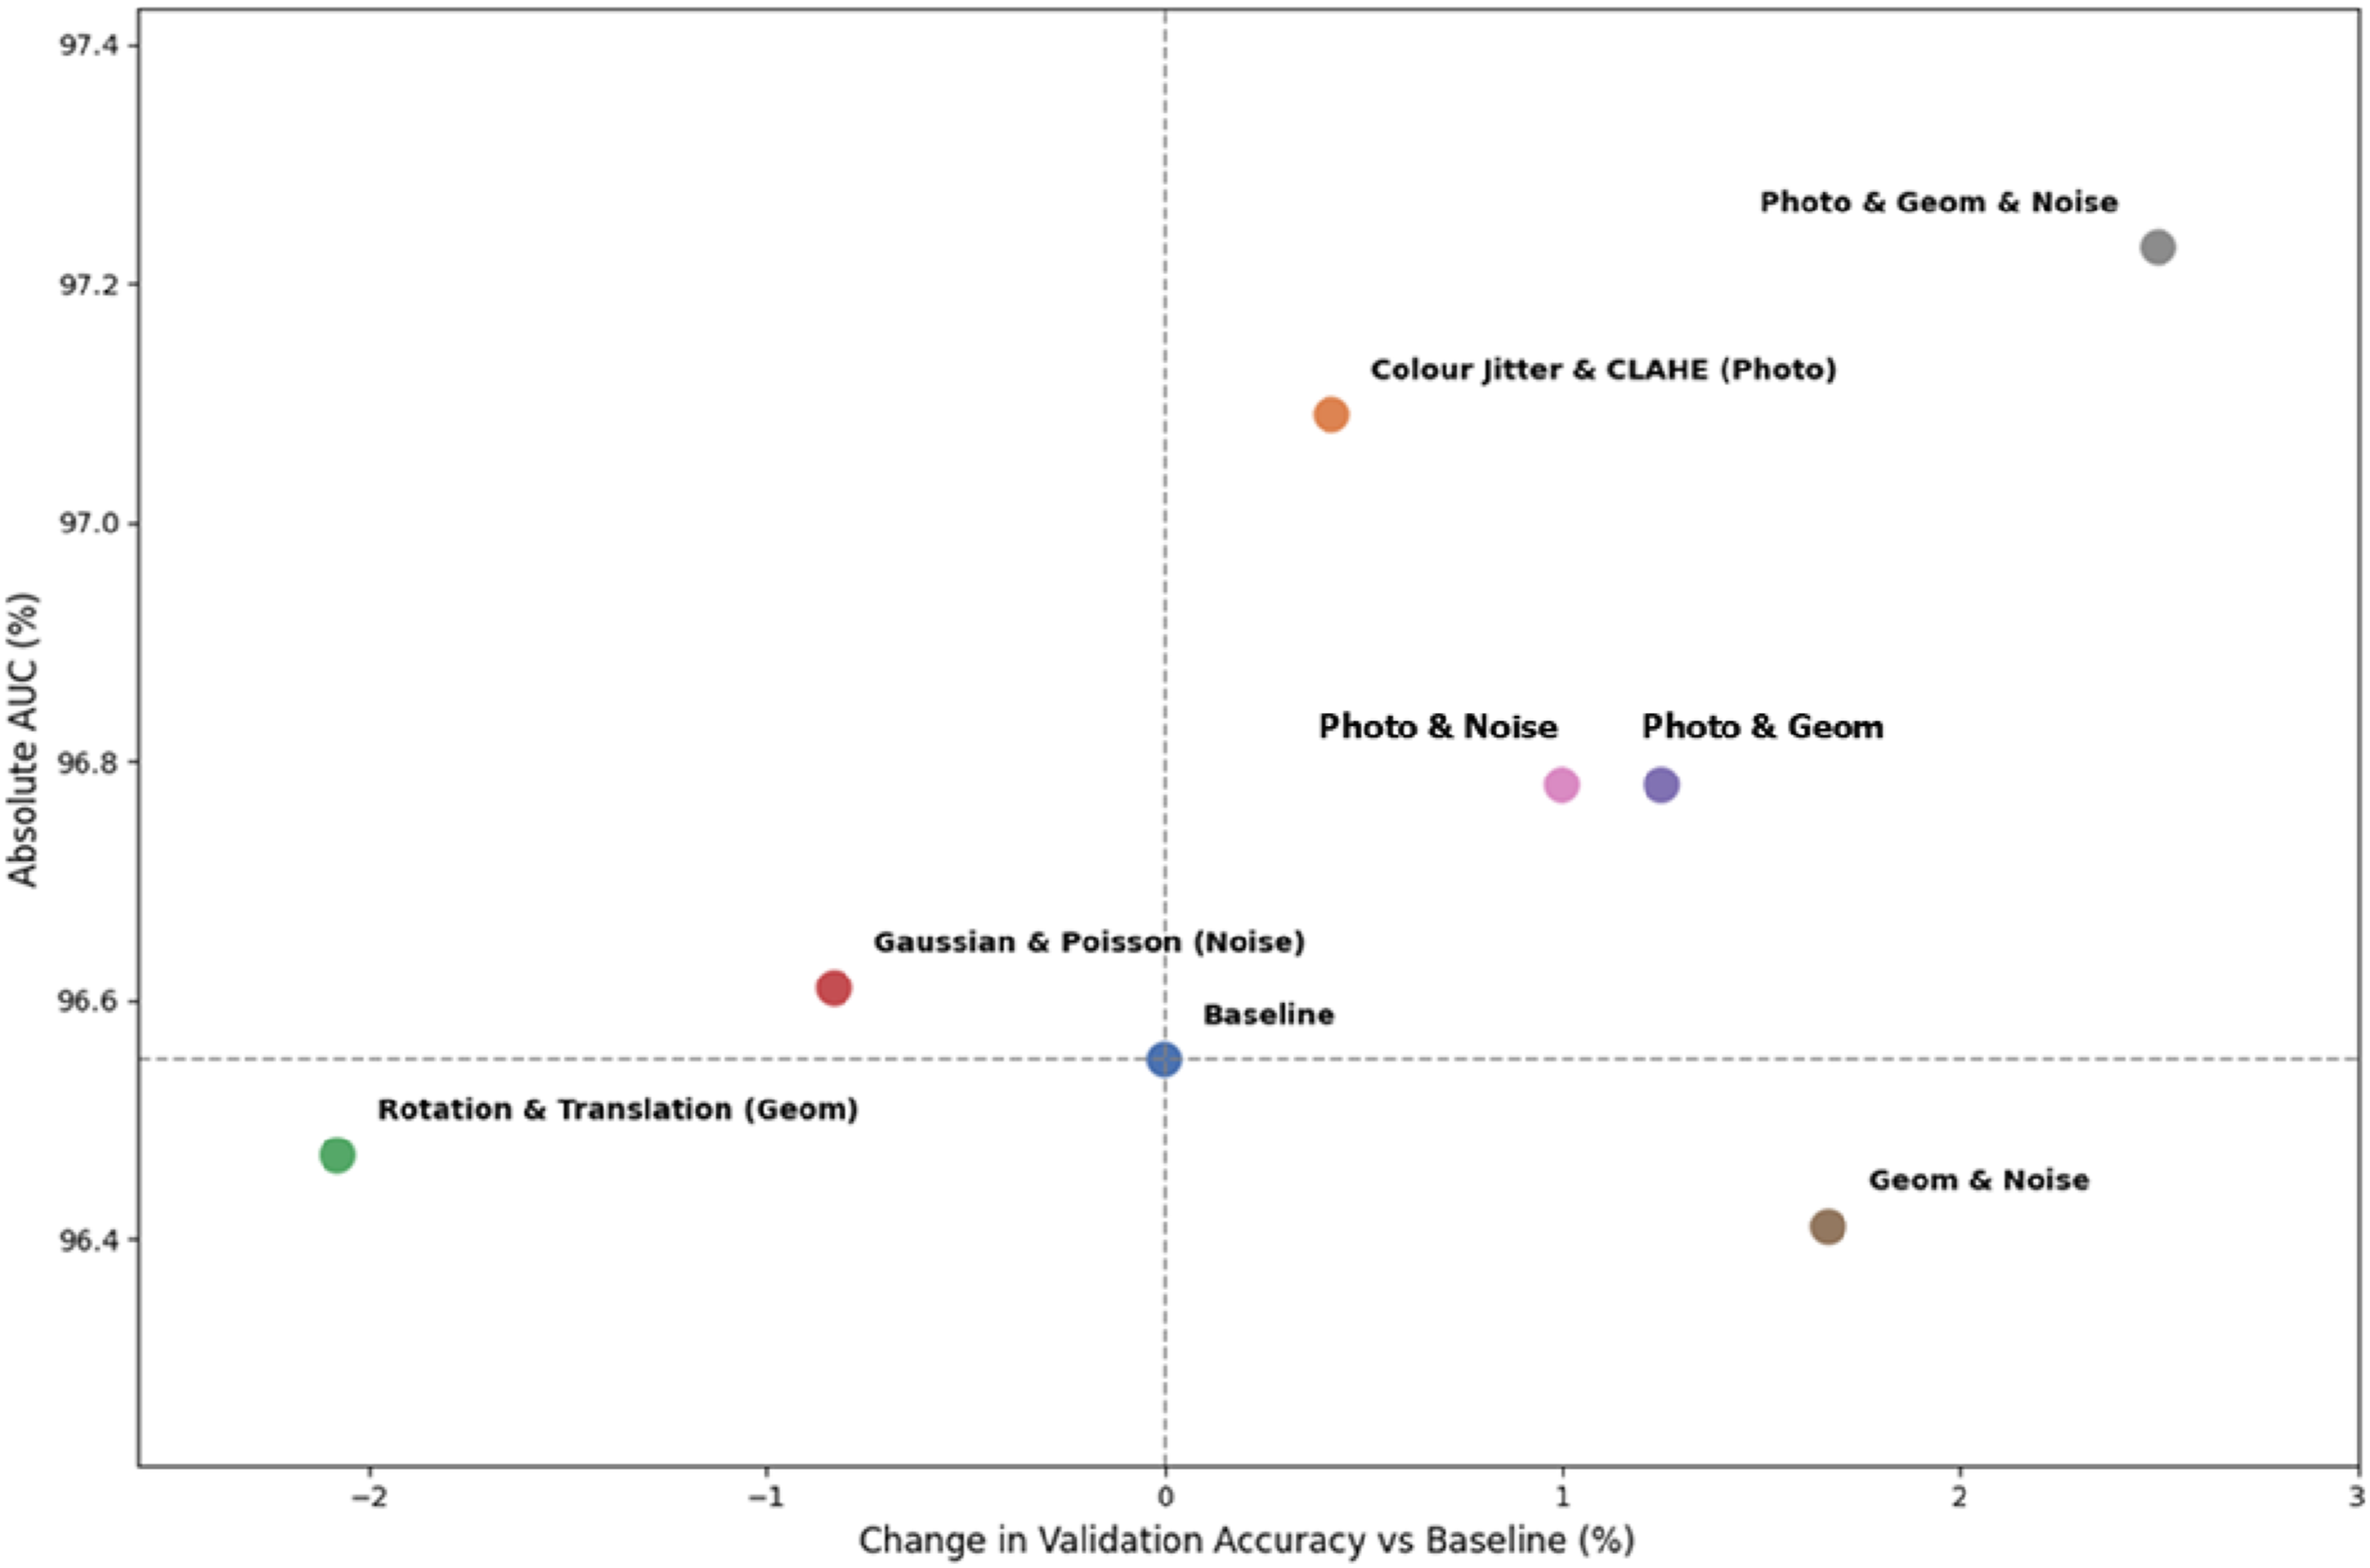
Bootstrapped metrics and statistical validation
Bootstrapped AUC, 95% confidence intervals, and empirical p-values for data augmentation strategies.

AUC = Area Under the Receiver Operating Characteristic Curve; CI = Confidence Interval; CLAHE = Contrast-Limited Adaptive Histogram Equalisation; Photo = Photometric; Geom = Geometric.
*Indicates statistical significance (p < .05) compared to the baseline model using a non-parametric bootstrap procedure with 1,000 iterations.
Disease-specific performance of combined augmentations
The comprehensive Photo & Geom & Noise combination strategy (which represents all six augmentations) improved classification performance across all four categories (Figure 7). AMD classification achieved a perfect F1-score (100%). DR classification improved to an F1-score of 98% (from 96% baseline). Glaucoma classification reached its highest F1-score of 74% (from 70% baseline). Finally, the normal class classification also peaked at its highest F1-score of 82% (from 78% baseline). Class-specific F1-scores for AMD, diabetic retinopathy, glaucoma, and normal fundus images across the evaluated augmentation strategies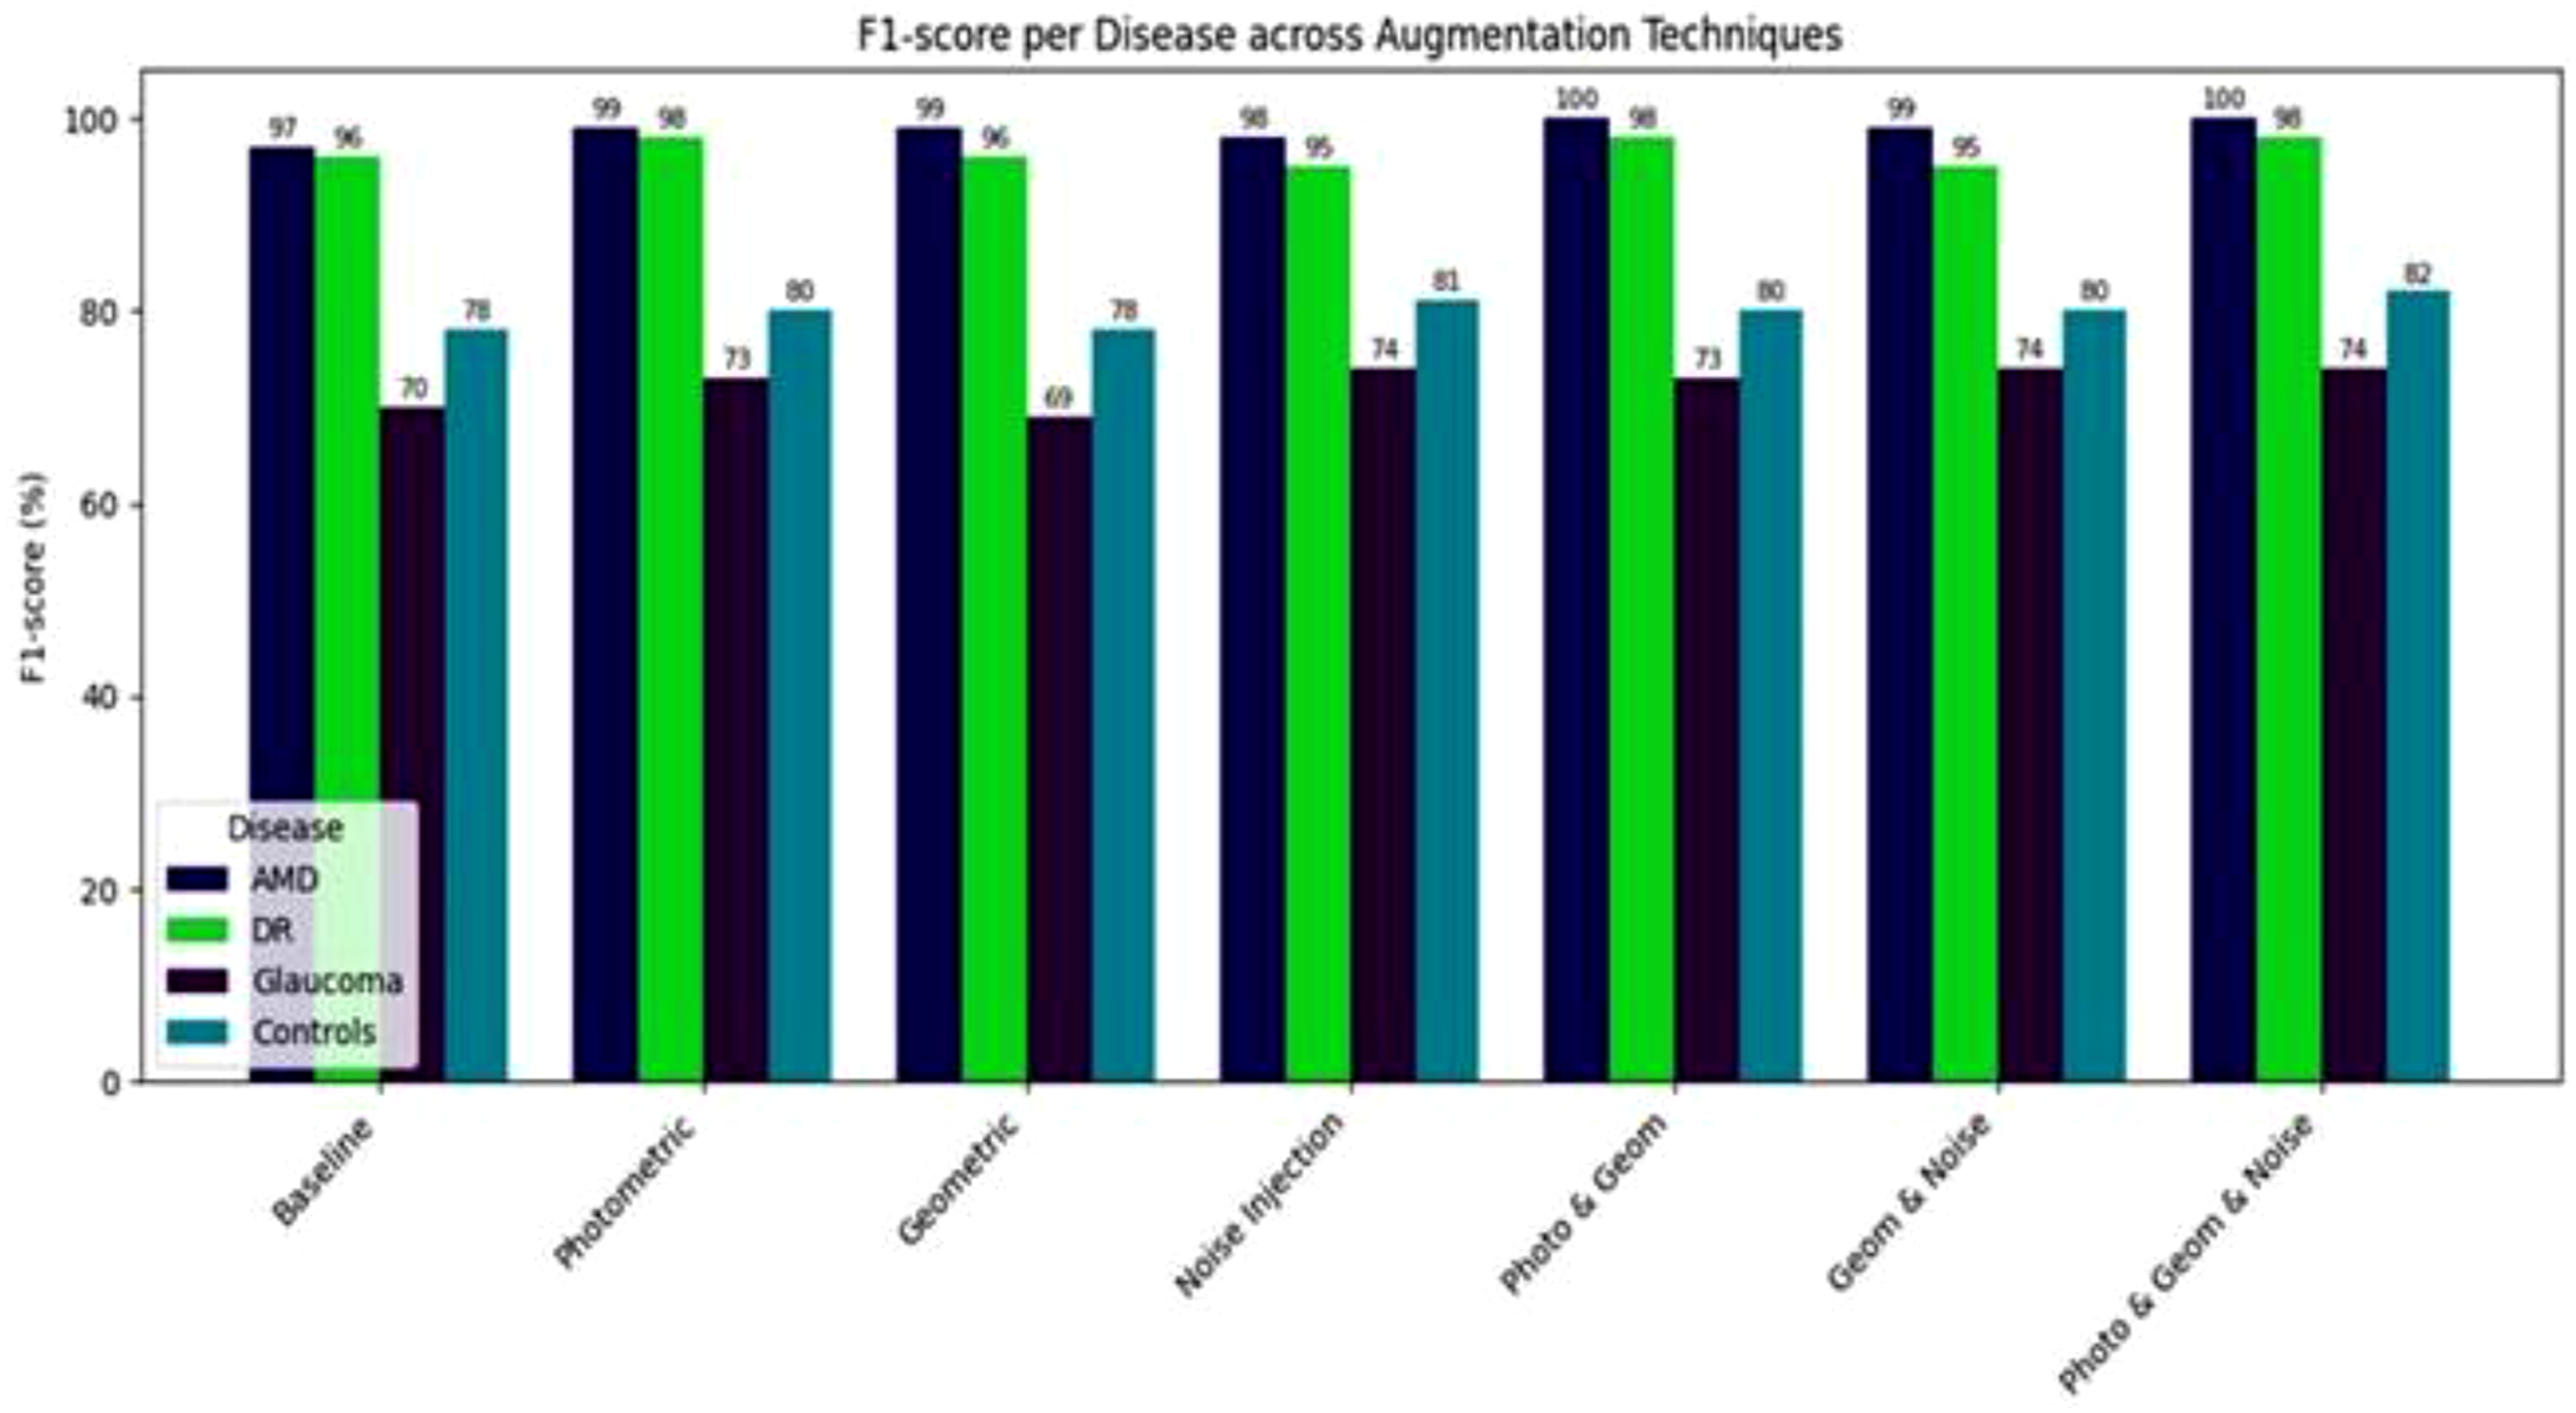
Impact of augmented data volume
Impact of augmented dataset size on model performance.
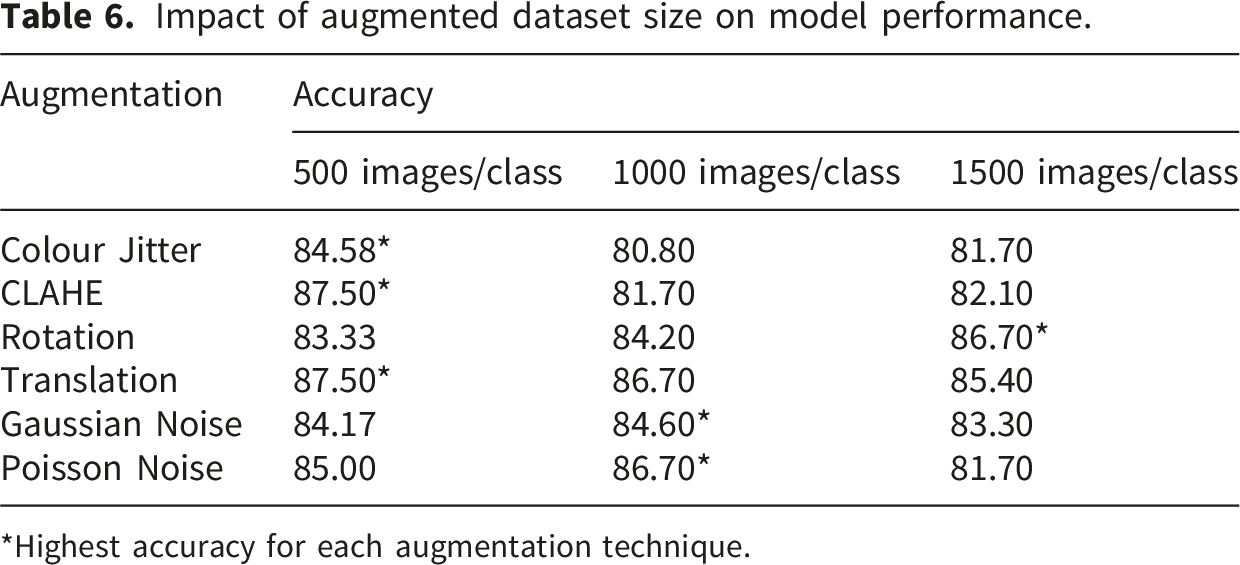
*Highest accuracy for each augmentation technique.
Discussion
The performance of deep learning models in computer-aided diagnostic applications is fundamentally dependent on the diversity and volume of training data, yet high-quality, expert-annotated retinal datasets remain a significant challenge. 14 The challenge is even greater in Africa, where there are no national repositories and only a few fragmented datasets. The only known repository, the Multimodal Database of Retina Images for Africa (MoDRIA), contains fundus images from nearly 2,000 participants in Uganda and Kenya, but it is dominated by normal fundus images and is not widely accessible for deep learning research. 23
While Africa faces a severe scarcity of large-scale annotated retinal datasets, the findings of this study directly address this challenge. By utilising optimised, disease-specific augmentation pipelines, researchers in low-resource settings can artificially expand limited local datasets, providing a cost-effective computational bridge to train robust diagnostic models where massive data collection is currently unfeasible. 23
This present study demonstrated that data augmentation techniques, when properly selected and combined, significantly enhance the classification of retinal diseases, though their effectiveness varies by disease and data volume. The baseline EfficientNet-B0 model achieved a strong AUC of 96.55% but the combination of data augmentation techniques raised it to 97.23% (Table 4).
Among the single augmentations, CLAHE and translation were the most effective at improving overall validation accuracy. The success of CLAHE is likely attributable to its ability to enhance local contrast and correct illumination variability, making subtle pathological features such as microaneurysms more distinguishable, as supported by previous work. 24 Translation also yielded consistent gains, particularly in glaucoma classification, by improving the model’s positional invariance. Researchers remain concerned that noise methods may introduce artefacts that compromise diagnostic reliability, particularly in sensitive domains such as retinal imaging. 25 Indiscriminate noise injection (Gaussian and Poisson) often led to performance reductions, suggesting that without careful tuning, noise may degrade signal quality rather than improve generalisation. 25
CLAHE has been widely reported to improve retinal image quality by correcting illumination variability. This facilitates the detection of lesions and vascular structures easily.24,26 A critical finding in this study was the divergence between accuracy and discriminative power; while translation simultaneously improved validation accuracy and AUC, CLAHE improved accuracy but resulted in a marginal reduction in AUC (Figure 5). This underscores that not all accuracy improvements translate into better overall model robustness. This highlights the necessity of evaluating the reliability of augmentation techniques with comprehensive metrics beyond simple accuracy, as the clinical reliability of a model depends on its discriminative power across all thresholds.
The consistent gains of translation for glaucoma classification are likely due to its ability to simulate variations in optic disc centering. Unlike the scattered focal lesions of diabetic retinopathy, glaucoma diagnosis relies heavily on evaluating the optic disc-to-cup ratio. Translational invariance helps the convolutional neural network focus on these localised structural geometries regardless of their positional variability within the fundus image.
Despite these improvements, glaucoma remained the most difficult class to classify. While augmentations improved recall for glaucoma to 83%, the overall F1-score (72%) lagged significantly behind the near-perfect performance for AMD and DR. This finding is consistent with results from Christopher and colleagues, who observed that the subtle structural changes of glaucomatous optic neuropathy are inherently more difficult to classify from 2D fundus photographs than the clear, lesion-based biomarkers of AMD and DR. 27 Unlike DR, where lesions such as haemorrhages and exudates provide clear visual markers, glaucoma often involves subtle structural changes such as optic disc cupping and neuroretinal rim thinning, which are less distinct than lesions in DR or AMD. 28 While Fu et al. 28 achieved higher glaucoma performance on the ORIGA dataset (AUC of 89.8%) by incorporating segmentation-guided features of the optic disc and the optic cup, this study deliberately omitted such pre-processing to maintain a controlled evaluation of augmentation techniques at the whole-image level.
When multiple augmentation families were combined, performance generally improved compared to using single techniques alone. The best outcome was observed when photometric, geometric, and noise transformations were applied together, yielding more stable accuracy and the highest AUC (97.23%). Combinations within a single family, such as using only geometric or only noise-based methods, tended to reduce effectiveness. This suggests that simulating a wide variety of real-world variations (e.g., changes in lighting, patient position, and sensor noise) is more effective than intensifying a single type of transformation. Previous studies have shown that heterogeneous augmentation techniques strengthen generalisation in retinal imaging tasks.29,30 Reviews of augmentation in medical imaging consistently report that multiple augmentations outperform single augmentations, both in terms of accuracy and generalisation. 14 This suggests that simulating a wide variety of real-world variations (e.g., changes in lighting, patient position, and sensor noise) is more effective than intensifying a single type of transformation.
Tailoring augmentations to specific retinal diseases clearly enhances diagnostic sensitivity. While our small validation set of 240 images lacked the statistical power to prove significance for isolated subclass gains, the clinical improvements remain evident. For example, targeting Diabetic Retinopathy with CLAHE noticeably reduced classification errors (Table 3). More importantly, mapping these disease-specific strengths may explain why our combined augmentation pipeline achieved a highly significant overall improvement (p = .005). These findings suggests that integrating disease-specific biomarkers into augmentation strategies is essential for maximising deep learning performance.
Comparatively, the model performance with augmentation in this study outperforms several studies on similar retinal diseases. Malik et al. 31 reported 93% sensitivity, used the Ocular Imaging and Health (OIH) dataset with advanced augmentation methods like CutMix for automated classification of diabetic retinopathy, and other retinal disorders, which the augmented EfficientNetB0 in this study surpasses by 6% for AMD and 3% for DR sensitivities. This demonstrates the value of combined traditional augmentations for enhanced automated diagnostic accuracy.
For EfficientNetB0 specifically in multi-class retinal classification, Srivastava et al. 32 used on the Eye Disease Image Dataset for fundus classification of AMD, DR, glaucoma, and others. They attained 86.37% validation accuracy. The validation accuracy of 89.58% and observed AUC of 97.23% in this study slightly outperforms theirs, particularly for AMD/DR (F1-scores 98 to 100%), while the glaucoma F1-score (74%) is lower, yet still competitive given the dataset’s diversity. These comparisons show that data augmentation techniques yield robust EfficientNetB0 performance on par with or exceeding recent benchmarks, especially in multi-disease scenarios with limited annotated data.
Previous studies have largely relied on applying generic data augmentation pipelines uniformly across all image classes.31,32 In contrast, our findings demonstrate that augmentation effectiveness is disease-dependent. Therefore, specific image augmentations must be paired with distinct retinal biomarkers to maximise diagnostic accuracy.
In Ghana, Duah et al. 33 evaluated deep learning models on OCT images for glaucoma, macular oedema, PVD, and controls and reported up to 96 % accuracy and an AUC of 0.975. Despite differences in modality and target diseases, the results in this exceeds their performance (99% precision and sensitivity) for AMD and DR.
There is a critical and non-linear relationship between augmented data volume and model generalisation. The baseline training dataset in this study consisted of 960 images (200 per disease class and 360 normal). When each class (AMD, DR, glaucoma, and normal) was augmented in sizes of 500, 1000, and 1500 images and evaluated, the accuracy did not increase proportionally but followed augmentation-specific patterns. For some augmentations, such as CLAHE and translation, the highest accuracy was achieved with smaller subsets, suggesting that beyond approximately 500 to 1000 samples, additional augmented images introduced redundancy without adding meaningful variation. This likely occurs because translation merely shifts features spatially, a variation partially mitigated by the inherent translational invariance of pooling layers in CNNs, while CLAHE enhances local contrast without altering the underlying structural geometry. In contrast, rotation appeared to benefit more from larger training sets because standard CNNs are not rotation-invariant; they require a significantly larger volume of diverse examples to learn that anatomical features, such as vessels or lesions, retain their diagnostic identity regardless of orientation. Similar observations have been reported in prior studies. Shorten and Khoshgoftaar showed that augmentation and dataset expansion provide the greatest gains in small datasets prone to overfitting, but their effect diminishes once models stabilise. 14 Likewise, Wang, Juroch, and Birch reported that deep learning models for photoreceptor metrics in retinitis pigmentosa improved rapidly with more training scans but plateaued beyond a certain size. 34
Based on the consistent performance trends observed across our volumetric experiments, we practically recommend that researchers building similar models in data-scarce environments begin with an optimal starting volume of 500 augmented images per class and a maximum threshold of 1,000 augmented images per class. Our empirical results indicate that generating synthetic data beyond this 1,000-image plateau introduces computational redundancy without providing proportional gains in diagnostic accuracy.
This implies that “more data” is not always better, and that augmentation pipelines should be optimised for both transformation type and data volume to prevent redundancy and maximise model performance. Thus, while the present study confirms the importance of traditional augmentations, it also highlights a gap between these methods and emerging approaches. Future research may benefit from incorporating GAN-based augmentation or adaptive augmentation pipelines that dynamically tune transformations based on dataset size and disease type.
This study has several strengths. The adoption of a systematic ablation framework successfully isolates the independent and combinatorial effects of specific data augmentations. This prevents confounding variables from obscuring the results. The rigorous statistical validation utilising a 1,000-iteration non-parametric bootstrap procedure ensures the stability of the reported metrics. The strict enforcement of class balance prevents the model from defaulting to majority-class predictions. Most importantly, mapping specific image transformations to distinct retinal biomarkers provides a highly targeted, evidence-based approach for optimising deep learning models.
Despite these strengths, some limitations must be acknowledged. A notable limitation of this study is the reliance on a single model architecture (EfficientNet-B0). While EfficientNet-B0 is highly suitable for data-constrained environments due to its parameter efficiency, the specific interaction between these augmentation techniques and model feature extraction might differ when utilising heavier architectures such as ResNet-50 or vision transformers. The persistently lower classification performance for glaucoma highlights a fundamental limitation of utilising 2D fundus images. Glaucomatous neuropathy is characterised by complex three-dimensional structural alterations, such as neuroretinal rim thinning and optic disc cupping. The reliance on 2D photography restricts the model’s ability to capture these depth-dependent topographical changes. Future frameworks should prioritise integrating 3D Optical Coherence Tomography (OCT) data to accurately classify such structural pathologies. While prioritising strict class balance necessitated this smaller cohort, the absence of external validation limits the immediate clinical generalisability of the model. However, evaluating algorithmic performance under such data-constrained conditions precisely reflects the challenges faced by developers in low-resource settings. The scope of this study was restricted to a classification task around the binary presence or absence of the three target retinal pathologies to cleanly evaluate data augmentation efficacy. The continuous clinical staging or severity of the detected pathologies falls outside the objectives of this study and would be considered in future studies on the impact of data augmentation on severity-grading of retinal pathologies. Another limitation is that aggregating images from diverse public repositories introduces inherent dataset-level bias regarding camera hardware and patient demographics. However, applying comprehensive data augmentation helps mitigate this domain shift by forcing the model to learn invariant structural features rather than dataset-specific artefacts.
Conclusion
Data augmentation enhances the performance of deep learning models for retinal disease classification, particularly when training data are limited. The findings confirm that augmentation plays a critical role in improving model robustness. Among the six augmentation techniques evaluated, CLAHE was most effective for diabetic retinopathy, Colour Jitter for AMD, and Translation for glaucoma. However, the best overall performance was achieved using combined augmentation strategies, which yielded superior accuracy, sensitivity, and AUC across all disease categories. The findings show that researchers and developers must not depend on generic, one-size-fits-all augmentation pipelines; rather, adopt disease-specific image data augmentations for maximising the diagnostic reliability of AI tools in data-constrained environments.
Footnotes
Ethical considerations
The study protocol was reviewed and approved by the Institutional Review Board of the University of Cape Coast (UCCIRB/CHAS/2025/046).
Author contributions
C.H.A., E.K.A., and P.O. conceptualized the study; C.H.A., P.O., and A.K.D. conceived the experiments; P.O., T.O.M., and E.B. carried out the experiments and analyzed the data. S.K. and C.H.A. provided resources for the study; E.K.A. and S.K. advised on the clinical aspects of the study. C.H.A. and P.O. wrote the original draft of the manuscript. All authors were involved in writing the final version of the manuscript and provided final approval for the submitted and published versions.
Funding
The authors received no financial support for the research, authorship, and/or publication of this article.
Declaration of conflicting interests
The authors declared no potential conflicts of interest with respect to the research, authorship, and/or publication of this article.
Data Availability Statement
The datasets associated with this study are available publicly in the data repositories described in the paper.
Guarantor
Paul Owusu, the corresponding author, accepts full responsibility for the work and/or the conduct of the study, had access to the data, and controlled the decision to publish.