
Abstract
Objective
Hospitals across the United States face growing operational and financial strain, resulting in closures that threaten healthcare access and system resilience. This study aimed to identify significant predictors of hospital total facility expenditures and to evaluate the performance of multiple imputation methods for incomplete data in the American Hospital Association (AHA) Annual Survey Database.
Methods
The de-identified 2022–2023 AHA survey data (n=12,359) comprising 34 financial, structural, and operational features was analyzed. Missing data were addressed using the Multivariate Imputation by Chained Equations (MICE) framework, comparing regression-based and machine learning–based algorithms. Random Forest (RF) imputation was selected for its superior accuracy based on fivefold cross-validation. Linear regression models were fitted on five RF-imputed datasets to identify key determinants of total facility expenditure (EXPTOT).
Results
RF-based imputation achieved the lowest error and highest consistency across variable types. Regression results identified full-time registered nurses (FTRNTF), facility size (GFEET), and property and equipment costs (PLNTA) as the strongest predictors of hospital expenditure (p<0.001). Hospitals with community designations, oncology or research services, and Joint Commission accreditation had significantly higher expenditures, whereas rural and community trauma centers reported lower costs. Geographic visualization revealed substantial disparities in hospital resources and expenditures, especially in rural areas.
Conclusion
Machine learning–based multiple imputation improves data completeness and modeling accuracy for hospital operations research. Findings highlight critical cost drivers and geographic inequities, informing data-driven policymaking and resource allocation in health system management.
Keywords
Introduction
Over the past two decades, hospitals in the United States have faced mounting financial and operational pressures that have contributed to widespread closures, with profound consequences for healthcare access in affected communities. 1 For example, over 146 hospitals in rural areas closed due to this period, often due to vulnerabilities in occupancy rates, fluctuations in operating costs, and the structural limitations of small facilities. 1 In urban areas, hospital closures were linked with hospital financial structure, such as the higher likelihood of for-profit hospitals to close, as well as policy considerations such as if the state did or did not participate in Medicaid expansion. 2 In 2022, the American Hospital Association (AHA) reported a loss of $8.4 billion due to rising inflation, reduced reimbursement, and increasing labor costs. 3 As recent constraints on federal sources of hospital funding continue, heightened attention has been placed on identifying indicators of hospital operational health and prediction thresholds to sound early warning of instability in providing care access. 4 Given the central role hospitals play in emergency response, population health, and disease control, systematic monitoring of operational functionality has become an urgent priority for policymakers, health systems, and researchers. 5
The AHA Annual Survey Database serves as one of the most comprehensive and authoritative sources of hospital data in the United States, and is extensively used by federal agencies, researchers, and policymakers. 6 As a trusted longitudinal resource, it provides detailed information across a wide range of domains, including hospital demographics, service lines, utilization, workforce composition, financial performance, information technology, and telehealth capabilities. 6 The database offers more than 1,300 standardized data elements for over 6,200 hospitals and 400 health systems nationwide, enabling robust analyses of hospital operations, trends, and system-level characteristics. 7 While other databases are available to purchase hospital-level data, such as SK&A Healthcare Databases and from the Internal Revenue Service, the AHA Annual Survey databases focuses on those hospitals which are interconnected or at the juncture of systems ranging from decentralized to centralized, affording an overview which acknowledges resource and information exchange across geographic areas by organizational structure rather than by individual provider or physician groups. 8 The database has been used to position the agenda of Centers for Medicare and Medicaid Services (CMS) surrounding care pricing transparency for patients prior to receiving care while reducing administrative burden in processing claims. 9
The increasing digitization of healthcare systems has generated large-scale administrative datasets, such as from the AHA, which support research, policy evaluation, and operational decision-making. However, the issue of data completeness aligns with broader data quality concerns in the hospital sector; for example, a recent report noted that about three-quarters of hospitals faced at least one challenge to public health reporting in 2022. 10 Despite its breadth and utility, the AHA survey often suffers from inaccuracies, reporting biases, and limited methodological transparency, which can undermine hospital strategic planning and governance policymaking.11,12
It is essential to consider the mechanisms of missingness as described in Rubin’s framework when addressing incomplete data: data may be missing completely at random (MCAR), where the probability of missingness is unrelated to observed or unobserved features; missing at random (MAR), where the probability of missingness depends on observed features but not on unobserved values; or missing not at random (MNAR), where missingness is systematically related to unobserved values themselves. 13 Multiple imputation (MI) offers a principled solution under the assumption of MCAR and MAR by generating several complete datasets in which missing values are replaced with plausible estimates derived from the observed data structure.11,13,14 MI has been widely used and appraised to impute missing values in healthcare studies with higher precision and less bias in statistical analysis compared with traditional imputation methods and complete case analysis.11,14–21 Recent studies have shown that machine learning–based approaches, such as random forest multiple imputation, outperformed traditional methods for electronic health records data by providing lower bias and more robust estimates across different missingness mechanisms. 22
In this analysis, our response variable, total expenditure, is fully observed, while many covariates have missing values. Accordingly, we assume that the missing covariates are MAR. This assumption is supported by the observation that the survey collects a large number of hospital characteristics related to staffing, size, operations, and organizational structure that are likely associated with reporting behaviors which may contribute to the pattern of missingness. Consequently, it is likely that the variables influencing missingness are captured by the observed data.
Missing data in healthcare datasets have traditionally been treated as a statistical problem addressed through imputation techniques. Methods such as Multivariate Imputation by Chained Equations (MICE) and machine learning-based approaches, including random forest imputation, have been widely adopted to recover incomplete observations and improve predictive modeling performance.22–25 However, most studies have applied these methods primarily as a preprocessing step to enable downstream analyses, with relatively limited attention to the structural causes or implications of missing information in hospital reporting systems.22,24,25 As healthcare systems increasingly rely on digital data, such as AHA, to support analytics and policy development, understanding reporting disparities becomes critical to decrease bias in the analysis.
The purpose of this study is to examine hospital reporting gaps within a national administrative dataset and to evaluate how incomplete reporting may influence health system analytics and policy-relevant interpretations. To achieve this objective, we develop an analytical framework that integrates three components: (1) characterization of missing data patterns across key hospital operational indicators, (2) recovery of incomplete observations using the best performed MICE imputation method after comparing a series of imputation methods, and (3) evaluation of how recovered data influence the analysis of hospital operational and financial indicators.
Using the 2022 and 2023 AHA Annual Survey Database, we analyze selected indicators of hospital operational functionality and examine variation across geographic location, hospital type, degree of system centralization, hospital size, and financial expenditures. In addition to assessing differences in these indicators, the study investigates patterns of data missingness and explores how incomplete reporting may affect statistical modeling and interpretation of hospital system characteristics.
Method
Features selected from AHA’s annual survey.

1Mean (Standard Deviation) for continuous features; Frequency (Relative Frequency) for binary and categorical features.
2The percentage of non-missing data points: completed data points/total sample size.
A descriptive analysis (statistical inferences: mean, standard deviation, frequency and relative frequency) was performed for the retrospective data collected from AHA between 2022 and 2023 using R programming language (version 4.2.0). 29 These analyses were conducted to characterize the distribution and patterns of missing values across hospital characteristics. Understanding these patterns provides insights into whether missing data may be associated with structural reporting differences across institutions. A geographic map of the United States was constructed using the ggmap package in R to examine spatial patterns in hospital expenditures and resource allocation across regions. 30
Compared imputation methods in MICE.
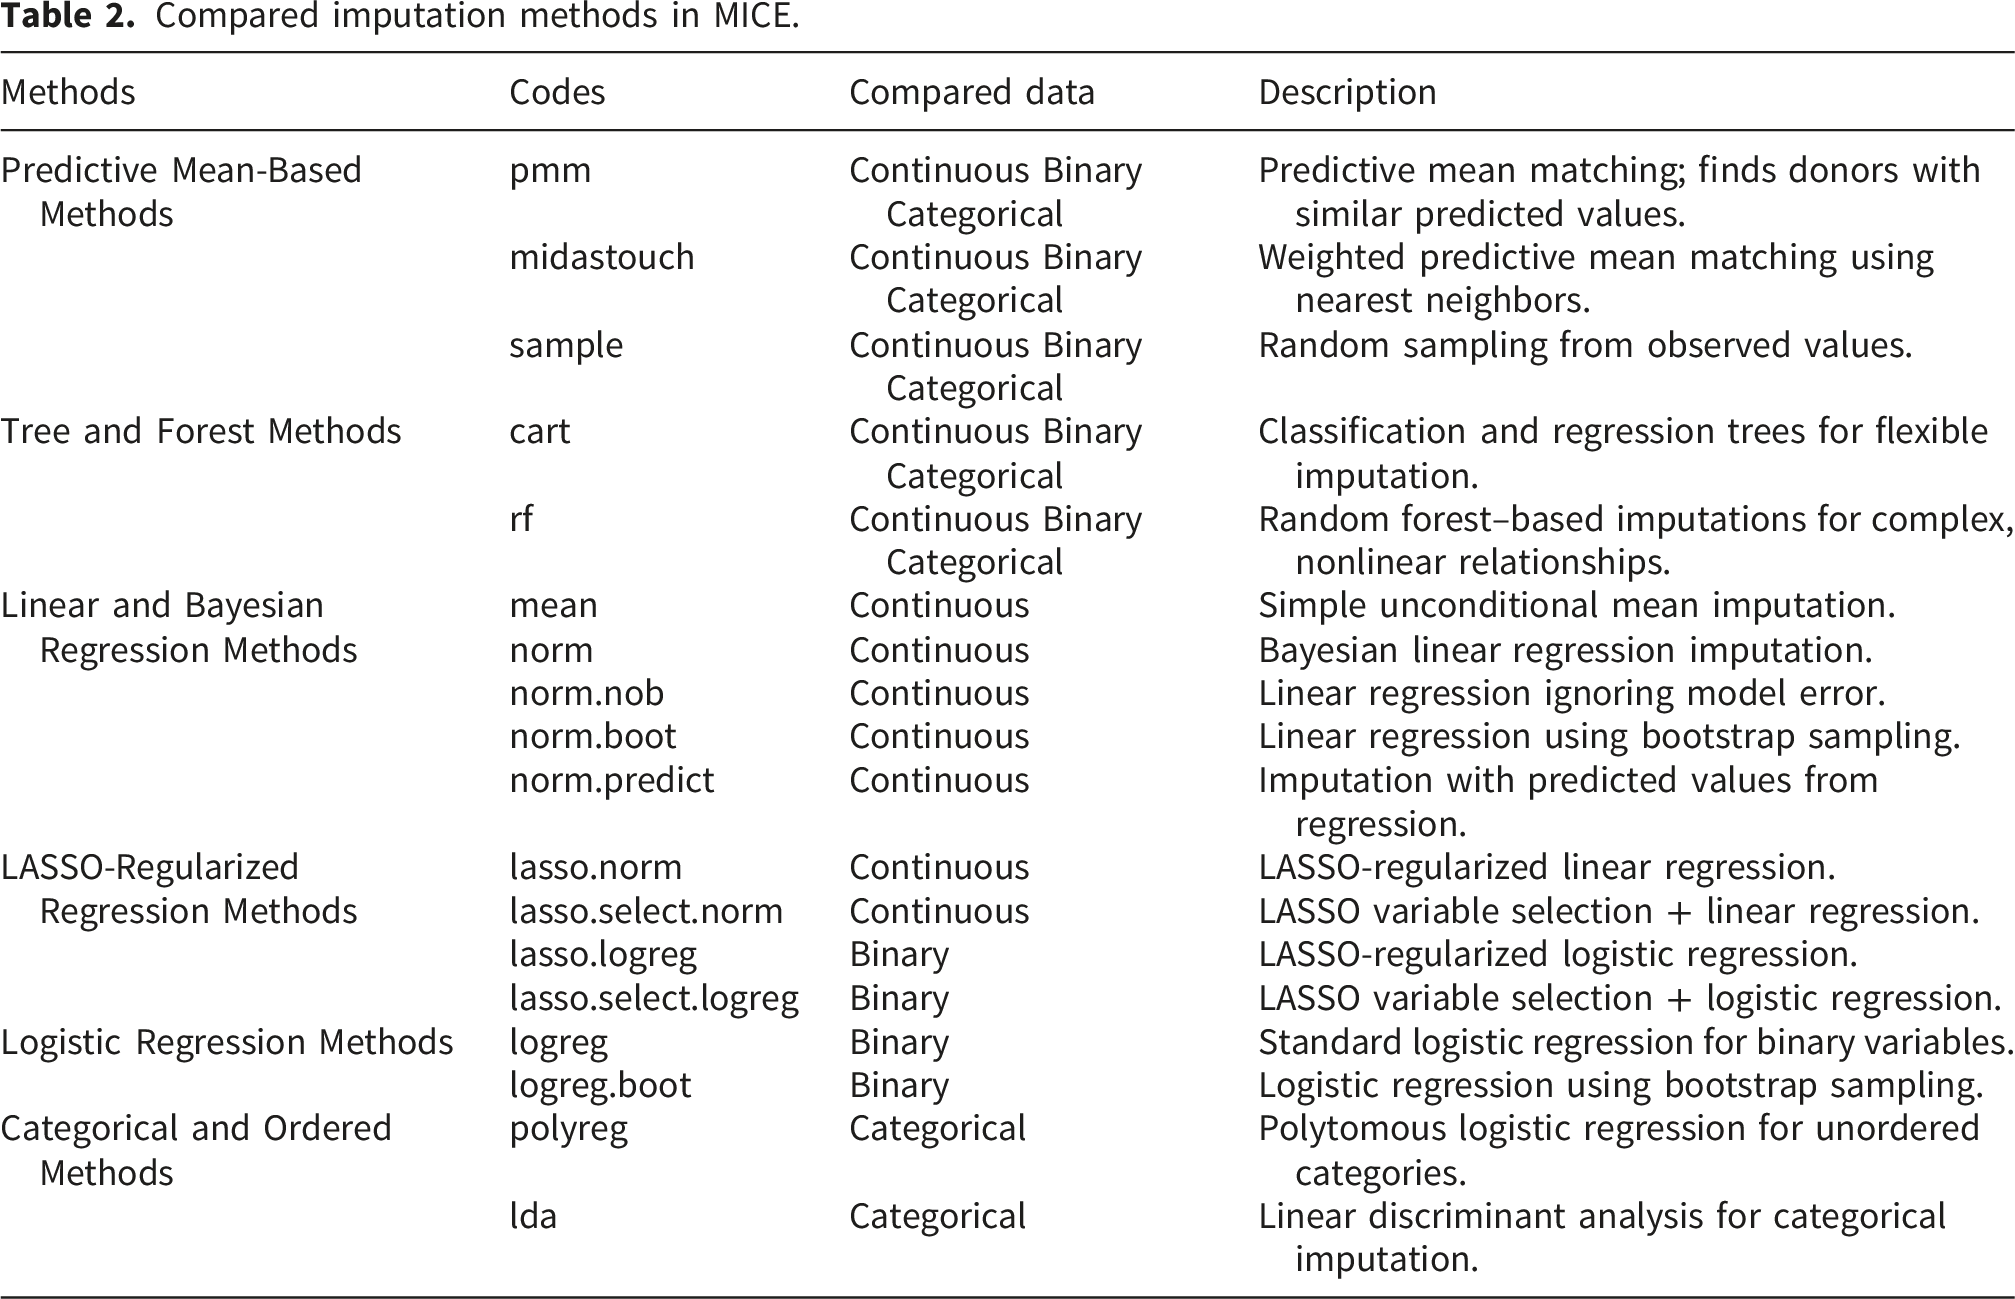
Multiple statistical techniques were applied to analyze the relationships among key features. Pearson correlation was used to assess the strength and direction of linear associations between continuous features, providing a measure of their co-movement. 31 For categorical data, Cramér’s V was calculated to evaluate the strength of association between categorical features. 32 Multiple linear regression was then conducted to examine the unique contributions of hospital characteristics to total facility expenditures while controlling other factors, thereby identifying the most significant cost drivers. 33 The regression model was used to examine how imputed data influences estimates of hospital expenditure drivers. Comparing model results before and after imputation provides insight into how reporting gaps may affect conclusions drawn from incomplete national hospital datasets. The significance level was 0.05 for all statistical analyses.
This study was reviewed and determined to be exempt by the Institutional Review Board (IRB) at Montana State University (Protocol No. 2024-1850-EXEMPT; approval date: July 3, 2025).
Results
As shown in Table 1, there are 23 features with at least 30% missing rate. Although the missing patterns varied across features, the presence of consistent red lines across the missing feature plot indicated that many features shared a similar pattern of missingness (Figure 1). This suggests that multiple hospital records were missing information across several features at the same time. Missingness was more often from smaller hospitals with less resources and expenses. The study was limited by a significant number of incomplete cases; only 1,182 out of 12,359 observations (9.56%) contained all the necessary information for a complete case analysis. Missing features distribution.
A correlation analysis was conducted using Pearson’s r for continuous features and Cramér’s V for categorical features (Figure 2). The results revealed strong to very strong linear correlations among several continuous predictors. For example, there was a correlation of r > 0.90 between HOSPBD and ADC, and r > 0.80 between FTRNTF and both PLNTA and GFEET, which suggested potential multicollinearity issues if all are included in a regression model (Figure 2). Similarly, strong associations among categorical features were observed, such as EMDEPHOS with COUTRHOS (V = 0.58) and HLTHSHOS (V = 0.56), HLTHSHOS with COUTRHOS (V = 0.57), and TRAUML90 with HLTRHOS (V = 0.61) (Figure 2). Pearson’s r and Cramér’s V Correlation Matrix.
Average performance of imputation methods across variables, with the top-performing method for each variable type shown in bold.

RF-based imputation was used to impute missing values for the hospital total facility expenses prediction model. Missing values were imputed using multiple imputation by chained equations with the mice package in R and random forest imputation (method = “rf”). Five imputed datasets were generated with 25 iterations per dataset. Random forest models were fitted using the package’s default hyperparameters (ntree = 10, mtry = √p). Convergence diagnostics demonstrated stable and flat trends for all features as iterations increased, indicating successful convergence with no evidence of drift or divergence (Figure 3). Convergence diagnostics for the imputed values with RF
The distribution of U.S. hospital total facility expenses (EXPTOT) from 2022 and 2023 was skewed due to the presence of extremely large expenditure values. Therefore, a logarithmic transformation was applied in all prediction models to reduce skewness, stabilize variance, and improve model performance. Other continuous features, such as HOSPBD, VEM, FTMDTF, FTRNTF, ADC, PLNTA, GFEET, CEAMT, VIDVZ, and PRPM, were also transformed with a logarithmic function to achieve the same benefits.
A generalized Variance Inflation Factor (GVIF) analysis was conducted on all five imputed datasets with RF-based method to assess and reduce multicollinearity in the linear regression models, specifically accounting for both continuous and categorical features. The adjusted GVIF (GVIF1/(2*Degree of Freedom)) was used to compare the GVIF between categorical and continuous features. The results consistently identified HOSPBD, VEM, ADC, and EMDEPHOS as collinear features (adjusted GVIF>3) across all models. Compared with static infrastructure measures such as bed capacity or facility size, ADC provides a more direct measure of healthcare service utilization and was therefore retained in the final models to reduce redundancy while preserving the most relevant variation. After removing HOSPBD, VEM, and EMDEPHOS, all other features’ adjusted GVIFs were less than 2.
On average, the linear regression after imputation performed well in terms of MSE (0.15), MAE (0.29) and R2 (92.35%), and residual diagnostics (Figure 4). Since the residual plots from each imputed dataset were similar to each other, only one representative 4-in-1 residual plot was illustrated in Figure 4. Although the normal Q-Q plot of the residuals indicated slightly heavy tails, with a large sample size (n = 12,359), the coefficient estimates are likely reliable, though confidence intervals may be slightly anti-conservative. Model performance and residual diagnosis.
Linear regression summary aggregated with Rubin’s rule.
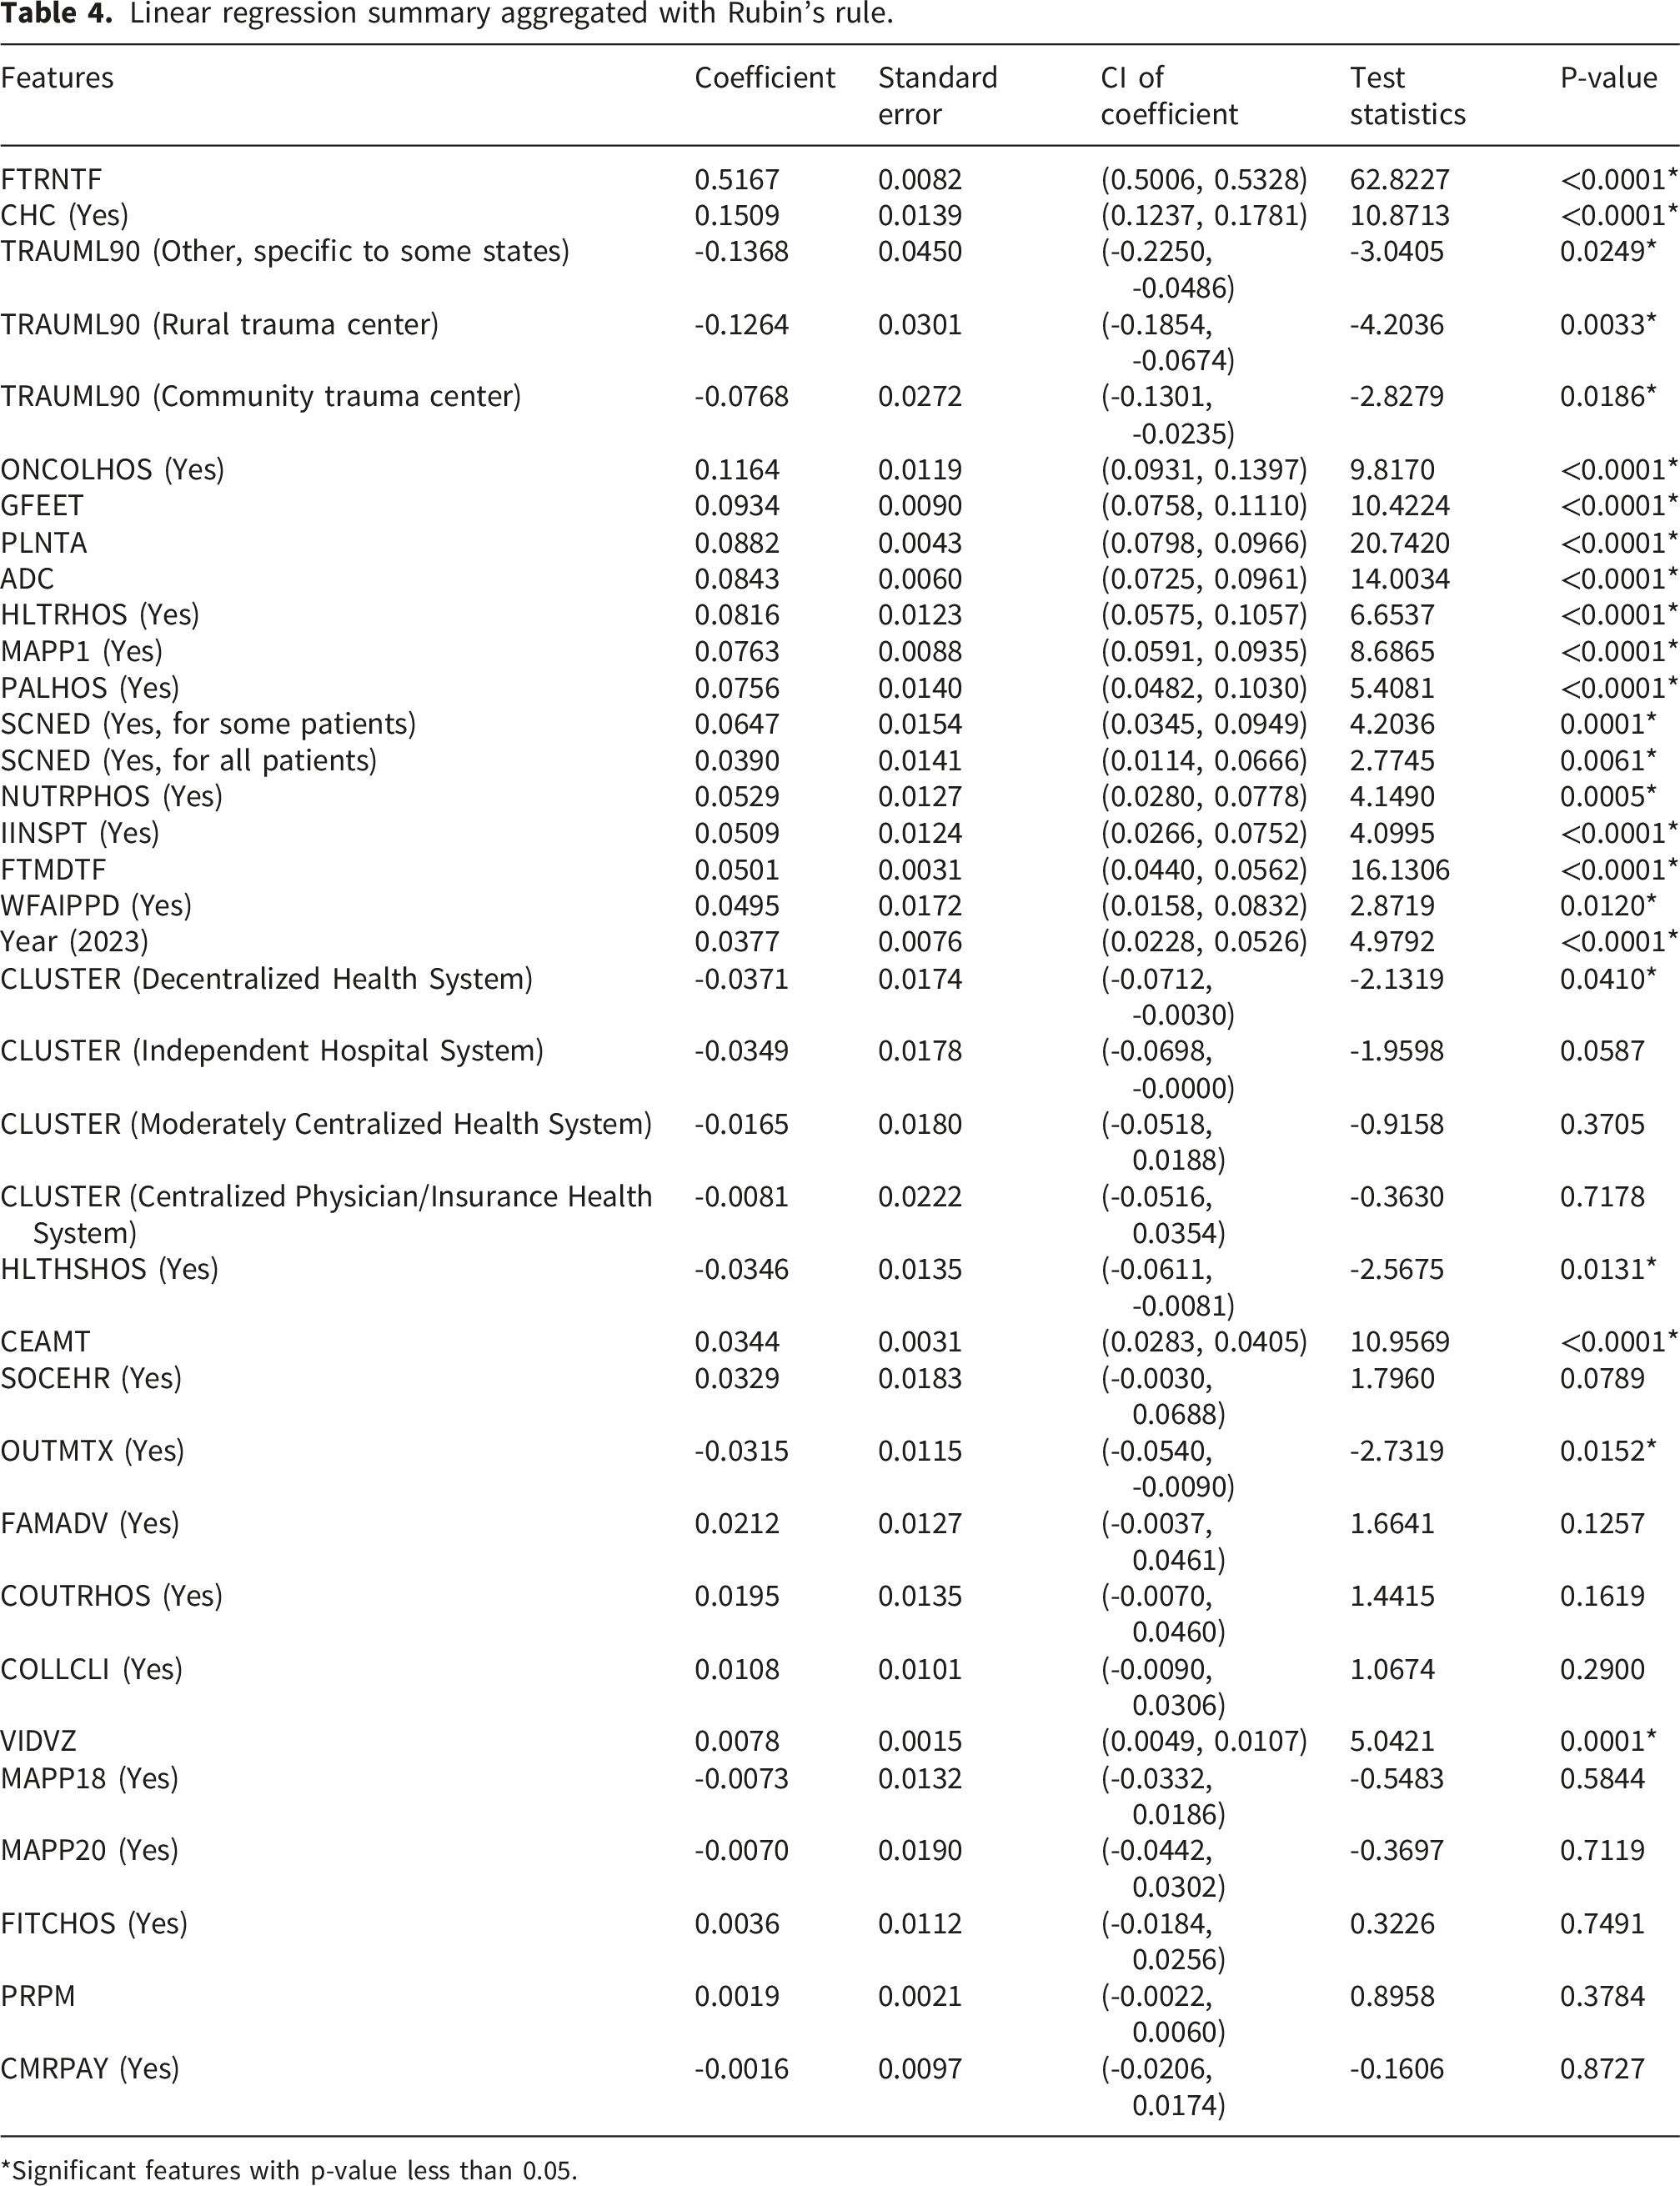
*Significant features with p-value less than 0.05.
In order to evaluate the importance of imputing missing data, we compared results from the RF-imputed datasets to a complete-case analysis which included only observations with fully observed variables. The estimated coefficients from both models are shown in Figure 5, illustrating how reliance on complete cases affects the fitted model. For visualization purposes, the data were standardized using complete case means and standard deviations to place coefficients on comparable scales and thus differ to those presented in Table 4. Figure 5 includes the relative differences in the estimated coefficients, calculated by Estimated coefficients and 95% confidence intervals from complete case (pink) and RF-imputed (cyan) datasets.
A sensitivity analysis was conducted using the delta method to assess potential bias from MNAR missingness mechanisms. Violations of the MAR assumption could occur if hospitals with unobserved characteristics were differentially likely to have missing covariate values.
For each continuous covariate with missingness (PLNTA, GFEET, CEAMT, VIDVZ, PRPM), systematic bias adjustments (delta parameters) were applied to each imputed dataset, ranging from
The tipping point analysis is shown in Figure 6. While coefficient estimates changed with respect to delta, the results were largely stable and only the coefficient corresponding to PRPM changed sign and significance as delta increased. When delta adjustments were applied to one covariate (e.g., GFEET), coefficients for unadjusted variables (e.g., PRPM) remained unchanged, confirming that MNAR adjustments operated independently across variables. Tipping point analysis for continuous covariates across a range of delta values. Red dashed line indicates MAR assumption (delta = 0). Blue and orange lines indicate significance and non-significance at p < 0.05, respectively.
Moran’s I statistics for spatial autocorrelation of complete case residuals, imputed residuals (five imputations), and EXPTOT across CBSAs using distance-based spatial weights.
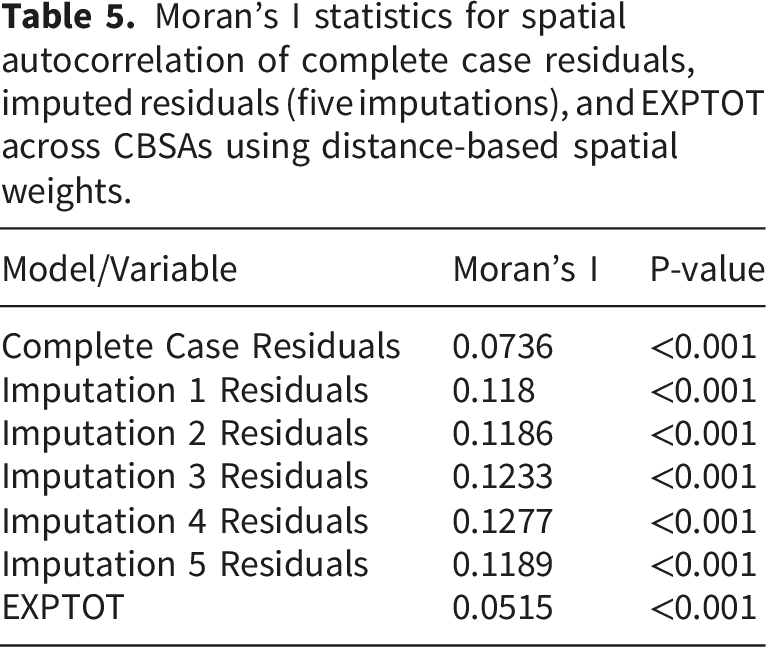
The outcome variable also demonstrated significant positive spatial autocorrelation (Moran’s I = 0.0515, p < 0.001), indicating that hospital expenditures cluster geographically, likely reflecting regional economic variation and healthcare market structure.
Rural hospitals showed higher missingness, likely due to less standardized data collection and limited administrative capacity. The imputation approach in this study borrowed information from geographically similar facilities, which may inadvertently amplify rural-specific missingness patterns. While sensitivity analyses suggested main findings were robust, rural facility estimates should be interpreted cautiously, as predicted metrics reflect both facility characteristics and shared structural factors affecting both missingness and expenditures. Future work with explicit rural-urban stratification could improve inference for this important subgroup.
Discussion
The research offers a foundation of discussion for hospital administrators and policymakers to develop strategic plans for resource allocation and cost containment during periods of economic headwinds and volatility in healthcare demands. This study examined hospital reporting gaps and operational indicators within the AHA Annual Survey dataset using an analytical framework that integrates three components: characterization of missing data patterns, machine learning–assisted multiple imputation, and evaluation of the influence of recovered data on hospital expenditure analysis. By combining these steps, the study moves beyond treating missing data solely as a technical challenge and instead situates data completeness as a key factor influencing health system analytics and policy-relevant interpretations.
This study characterized missingness across the 2022 and 2023 AHA Annual Survey datasets, addressed incomplete reporting using machine learning–based multiple imputation, and evaluated how recovered data influenced analyses of hospital operational and financial indicators.
Trauma center designation was negatively associated with expenditures relative to regional trauma centers, which may reflect differences in service complexity, patient volume, or resource allocation patterns across trauma center classifications. Cost is a common proxy given the volume of resource utilization in trauma centers particularly the complexity of injuries, surgical cases, and prolonged hospitalization. Rural regions experience long interfacility transit times and limited specialty providers or services which can delay treatment, therefore increasing costs as well as likelihood of poor outcomes especially if communication is disjointed between rural and trauma center care teams. 37 Similar findings have been described in the literature with research in orthopedic outcomes via machine-learning–based mortality prediction models surrounding resource utilization variables. 38 These findings support the interpretation that cost-related indicators in predictive models may capture underlying clinical complexity rather than purely financial characteristics of hospital care, reinforcing the clinical relevance of cost metrics in outcome prediction for trauma center cases, as an example. However, electronic health records may be incomplete or inconsistently structured across departments and facilities, such as specialties (orthopedics) and general care found in rural areas. Imputation techniques, such as random forest, have been deployed for heterogeneous, incomplete clinical datasets containing both continuous and categorical variables. 39 However, uncertainty remains when imputation is necessary with incomplete datasets, and thus limits generalizability outside typologies of healthcare systems or means of data management at the organizational level without external validation from more consistent sources. 39
Using the completed dataset, several hospital-level characteristics were identified as significant predictors of total facility expenditures. These findings suggested that hospital expenditures tend to scale with staffing capacity (FTRNTF), infrastructure footprint (GFEET & PLNTA), and the provision of specialized clinical and research services (CHC, ONCOLHOS & HLTRHOS). Conversely, hospitals designated as lower-level trauma centers were associated with comparatively lower facility expenditures relative to regional-level trauma centers.
Several of these indicators were highly correlated, particularly nursing staffing capacity (FTRNTF), averaged daily census inpatient days (ADC), hospital beds (HOSPBD), facility size (GFEET), and capital expenditures (PLNTA). The strong correlation among these variables suggests that hospital expenditures are closely tied to overall organizational scale and infrastructure intensity.
As the most significant indicator with largest influence on hospital facility expenses, FTRNTF was used as a representing indicator of hospital size and resources usage to be compared with total hospital facility expenses in Figure 7. The bivariate choropleth maps of selected top features, including FTRNTF, CHC, ONCOLHOS and HLTRHOS, associated with hospital total facility expenses were presented in Figure 7 to show how hospitals in each area performed across CBSAs in the U.S. High expenditure and high labor resource CBSAs clustered in major metropolitan regions, such as Northeast, Southeast and Pacific coastal states and regions while rural areas, such as Intermountain West and Midwest, often showed lower expenditures and fewer hospital-related resources (Figure 7). A nationwide disparity was observed in the availability of oncology and research services, with a notable absence of these services in rural areas (Figure 7). These disparities reflect what Probst and colleagues' term structural urbanism, which refers to systemic biases rooted in a market-based health care model that prioritizes population-dense areas and creates inefficiencies in delivering services to sparsely populated rural communities.
40
For example, a profoundly rural state, Montana, where over 34% of residents live in rural areas, reported only 7 CBSAs with community hospitals and oncology services (Figure 7). These services are highly concentrated on the west side of the state, with only 4 CBSAs offering research services (Figure 7). For rural residents, this geographic barrier can create significant costs, such as hundreds or even thousands of dollars due to long-distance traveling to seek care or meet regular clinical trial appointments, which in turn can compromise patient safety and limit access to care.
41
Top Significant Hospital Characteristics and Hospital Total Facility Expenses (EXPTOT) Distribution across U.S. (2022-2023).
The establishment of oncology services within hospitals has been shown to significantly improve patient care quality by increasing timely diagnosis, treatment planning, and access to radical or adjuvant therapies, while reducing emergency admissions and cases of unknown primary cancers. 42 These findings underscore the critical role oncology departments play in enhancing patient outcomes and ensuring comprehensive cancer care delivery. However, the parallel growth of advanced technologies and novel therapies has led to rising costs of cancer care, disproportionately burdening patients, and healthcare systems. 43 To address these inequities with a more cost-friendly strategy, health systems must either bring digital health strategies directly to rural patients through strategies such as tele-oncology, mobile clinics, and hub-and-spoke models, or provide the resources necessary to help patients reach specialized centers, including travel support and physician availability. 41 By enabling real-time communication between rural providers and specialized centers, these digital health interventions can improve access to care while mitigating infrastructure constraints faced by smaller hospitals.
These findings underscore geographic disparities in hospital resources and expenditures, suggesting that while expenditures tend to align with greater staffing, facility capacity, and capitalized costs, notable exceptions may point to differences in efficiency, resource allocation, or care delivery models across CBSAs (Figure 7). Understanding the drivers of hospital costs is especially important given the growing threat of closures in financially vulnerable hospitals. For instance, research shows that rural hospital closures not only reduce access to care but also lead to higher prices at nearby surviving hospitals, thereby affecting affordability. 44 Moreover, broader funding instability, such as disruptions to community health centers and hospital reimbursement streams, can exacerbate resource shortfalls and hasten institutional exit from the market. 44 Thus, linking cost‐drivers to closure risk provides actionable insight for policymakers and health system leaders seeking to safeguard access in underserved geographies.
Importantly, the analytical framework used in this study highlights the role of data completeness in supporting such system-level planning. Missing or incomplete reporting within national hospital datasets can obscure disparities in resource distribution and hinder the development of targeted policy interventions. Integrating machine learning assisted imputation into health system analytics can therefore serve as a complementary strategy for improving the usability of incomplete datasets while more comprehensive reporting infrastructures are developed.
It is important to distinguish between descriptive associations identified in this study and causal relationships. The regression analyses presented here identify statistical associations between hospital characteristics and facility expenditures but do not establish causal mechanisms underlying these relationships. Factors such as hospital staffing levels, facility size, and service offerings may co-evolve as part of broader organizational strategies rather than directly causing changes in expenditure levels. Future research using longitudinal designs, quasi-experimental methods, or causal inference frameworks may help clarify the mechanisms linking hospital resource allocation, service availability, and financial outcomes.
From a policy perspective, the findings highlight several opportunities for improving hospital data infrastructure and supporting evidence-based decision-making. First, national hospital reporting systems could benefit from automated data validation and complete monitoring tools integrated into digital reporting platforms.45,46 Such systems could flag incomplete submissions and provide real-time feedback to reporting institutions, thereby improving data reliability.45,46 Second, machine learning-assisted imputation frameworks similar to those used in this study may support interim analyses when incomplete reporting cannot be immediately resolved, enabling policymakers and health system leaders to generate more accurate situational awareness from available data. Third, integrating geospatial analytics with more complete datasets can support targeted investments in healthcare infrastructure, particularly in underserved rural regions where service gaps remain substantial.
Limitations and future work
This study has several limitations that should be acknowledged. First, the regression models were developed using a subset of features from the AHA survey, meaning that the results reflected only the features included and may not capture the full range of hospital characteristics available in the dataset. Second, the quality of the AHA survey data itself presents constraints, as issues of missingness and limited data accuracy could have influenced the reliability of the findings. Thirdly, many machine learning methods have been used with multiple imputations to address the missing, but only RF was used in this study. Finally, while multiple imputations were employed to address missing data and enhance the robustness of the analyses, this approach relies on assumptions that may reduce model accuracy, particularly when data are not missing at random and the AHA survey provides limited contextual information to fully characterize the mechanisms of missingness. Future studies could expand the analysis by incorporating a broader range of features from the AHA survey and other relevant data sources to provide a more comprehensive understanding of hospital facility expenditures. In addition, applying advanced statistical and machine learning methods may help capture nonlinear relationships that are not fully addressed by regression models. Causal analysis is needed to explore the nonlinear effects and discover causal relationships among hospital financial indicators.
While random forest imputation demonstrated strong cross-validation performance within this dataset, downstream regression estimates may vary across alternative imputation strategies. External validation using additional survey years and independent hospital datasets is necessary to assess the generalizability and stability of the identified expenditure predictors. Prior machine learning studies in heterogeneous healthcare datasets have similarly highlighted the importance of external validation when applying predictive frameworks across institutional settings and populations.
Although GVIF-based feature selection was used to reduce multicollinearity, correlated hospital characteristics may still influence coefficient stability. Future work should incorporate model-agnostic feature importance approaches, such as permutation-based importance measures or information-theoretic methods, to further validate predictor rankings and assess robustness across analytic frameworks. 47
Residual diagnostics revealed substantial departure from normality, with excess kurtosis values ranging from 4.78 to 5.24 across imputations (indicating heavy tails relative to a normal distribution), consistent with the presence of outliers. However, with n > 12,000 observations, the ordinary least squares estimator remains consistent and asymptotically normally distributed regardless of the normality assumption such that coefficient estimates and confidence intervals are reliable despite this departure. 48
The significant spatial autocorrelation in residuals indicates a violation of the standard regression independence assumption. Although coefficient estimates remain unbiased under spatial dependence, residual autocorrelation may lead to underestimated standard errors and overly narrow confidence intervals. Addressing this issue would require spatial regression models or spatially robust variance estimators that explicitly account for geographic correlation structures. However, implementing and validating such models was beyond the scope of the current analysis, which focused on covariate selection and imputation methodology. Future work should incorporate spatial regression approaches to provide more precise inference and better characterize how regional factors drive hospital expenditure variation.
Lastly, the MNAR sensitivity analysis was restricted to continuous variables with missingness (PLNTA, GFEET, CEAMT, VIDVZ, PRPM). While binary and categorical variables exhibited substantial missingness, formal MNAR sensitivity analysis for categorical data lacks a standardized approach analogous to the delta method for continuous variables. Extension of the MNAR framework to categorical covariates would require specification of missingness mechanisms that fundamentally alter classification probabilities, requiring a choice that is not grounded in a principled sensitivity parameter like delta for continuous data. Future work should employ pattern-mixture or related approaches specifically designed for categorical missingness mechanisms.
Conclusion
In conclusion, this study contributes to the literature by addressing the challenge of missingness in the AHA survey through the application of multiple imputation, thereby enabling more reliable analyses of hospital data. By identifying the key factors associated with total facility hospital facility expenditures, the findings highlight critical drivers of cost variation across healthcare systems. Moreover, the integration of imputed data with geospatial visualization provides a valuable framework for region-specific case studies and policy simulations, offering actionable insights to support decision making and resource allocation among healthcare administrators and policymakers.
Footnotes
Acknowledgements
AI tools were used to assist with proofreading and minor language editing of the manuscript.
Ethical considerations
2024-1850-EXEMPT.
Author contributions
Jiahui Ma: Conceptualization, Methodology, Software, Validation, Formal analysis, Investigation, Data curation, Writing – original draft, Writing – review & editing, Visualization, Supervision, Project administration, Validation.
Ian Laga: Conceptualization, Methodology, Software, Validation, Formal analysis, Investigation, Data curation, Writing – original draft, Writing – review & editing, Visualization, Supervision, Validation.
Elizabeth Johnson: Conceptualization, Methodology, Validation, Investigation, Data curation, Writing – original draft, Writing – review & editing, Supervision, Validation, Funding acquisition, Resources.
Funding
The authors disclosed receipt of the following financial support for the research, authorship, and/or publication of this article: Funding for this study made possible with Montana State University College of Nursing THRIVE intramural funding.
Declaration of conflicting interests
The authors declared no potential conflicts of interest with respect to the research, authorship, and/or publication of this article.
Data Availability Statement
The datasets analyzed during the current study are not publicly available because they were obtained under license from the American Hospital Association but may be available from the AHA upon reasonable request and purchase. h. Data Guarantor: Elizabeth Johnson.
Appendix
Hospital groups identification system specification.
Code
Label
Description
1
Centralized Health System
A delivery system in which the system centrally organizes individual hospital service delivery, physician arrangements, and insurance product development. The number of different products/services that are offered across the system is moderate.
2
Centralized Physician/Insurance Health System
A delivery system with highly centralized physician arrangements and insurance product development. Within this group, hospital services are relatively decentralized with individual hospitals having discretion over the array of services they offer. The number of different products/services that are offered across the system is moderate.
3
Moderately Centralized Health System
A delivery system that is distinguished by the presence of both centralized and decentralized activity for hospital services, physician arrangements, and insurance product development. For example, a system within this group may have centralized care of expensive, high technology services, such as open-heart surgery, but allows individual hospitals to provide an array of other health services based on local needs. The number of different products/services that are offered across the system is moderate.
4
Decentralized Health System
A delivery system with a high degree of decentralization of hospital services, physician arrangements, and insurance product development. Within this group, systems may lack an overarching structure for coordination. Service and product differentiation is high, which may explain why centralization is hard to achieve. In this group, the system may simply serve a role in sharing information and providing administrative support to highly developed local delivery systems centered around hospitals.
5
Independent Hospital System
A delivery system with limited differentiation; hospital services, physician arrangements, and insurance product development. These systems are largely horizontal affiliations of autonomous hospitals.