
Abstract
In the present paper we draw on the extensive data resources of the 'Overseas Chinese Affairs Council in Taiwan in an analysis of the overseas Chinese worldwide as of c. 2010. We raise and endeavor to answer four basic questions: (1) How many overseas Chinese are there currently in the world? (2) How are they distributed among the world's countries and regions? (3) What have been their patterns of population change in past decades? (4) What characteristics of the receiving countries are related to their numbers of overseas Chinese? We begin with a brief discussion of diasporas and present some recent data on the larger of the non-Chinese diasporas to enable us to better evaluate the significance and importance of the Chinese diaspora. We then review the major patterns of previous Chinese emigrations to provide an overall perspective for the presentation of our empirical data on overseas Chinese. This is followed by a discussion of our data and its sources. We then present and analyze our current data on overseas Chinese for the period c. 2010–2011 and answer our four questions.
Introduction
Overseas Chinese are spread over the globe, residing in almost every country in the world, albeit with a heavy concentration in Asia. A famous Chinese poem states that ‘wherever the ocean waves touch, there are overseas Chinese' (Mung, 1998; Poston and Yu, 1990; Zhou, 2009).
An overseas Chinese person is defined here as a Chinese person who resides outside the Chinese mainland, Hong Kong, Macau and Taiwan; we discuss this definition in more detail later. It excludes tourists, visitors and short-term residents. Around 2011, there were over 40.3 million Chinese residing in 148 countries of the world. To repeat, this figure represents the number of Chinese people not living in the People’s Republic of China, including Hong Kong, Macau, and Taiwan.
We use the term ‘overseas Chinese' in this article not because we believe that the label represents a foreign presence by virtue of race but principally because of the term’s continued and accepted use in the international arena (Fitzgerald, 1972; Mung, 1998; Poston et al., 1994; von Brevern, 1988; Wang, 1991) and because there is really no more convenient and shorter alternative phrase one can use to refer to Chinese living outside China.
In this paper we raise and answer four basic questions: (1) How many overseas Chinese are there currently in the world? (2) How are they distributed among the world's countries and regions? (3) What have been their patterns of population change in past decades? (4) What characteristics of the receiving countries are related to their numbers of overseas Chinese?
Prior to addressing these questions, we begin with a brief discussion of ‘diaspora,' another term used for persons living outside their home country. We present some recent data on the larger of the non-Chinese diasporas to enable us to better evaluate the significance and importance of the Chinese diaspora. We then discuss the major patterns of previous Chinese emigrations to provide an overall perspective for the later presentation of our empirical data on overseas Chinese. This is followed by a discussion of our data and its sources. We then present and analyze our data on overseas Chinese c. 2011 and address our four questions.
Diasporas
The Oxford English Dictionary (OED) (2nd ed.) notes that the term ‘diaspora' (from the Greek διασπορά, meaning a scattering or dispersion) refers to the ‘whole body of Jews living dispersed among the Gentiles after the Captivity … (or) to the body of Jewish Christians outside of Palestine' (Oxford English Dictionary, 2000, Volume IV: 613). Safran (1991) has written that the term ‘diaspora' may be traced to Hebrew and Yiddish (Hebrew, Galut ; Yiddish, Golus), and that it referred early on only to the historical exile and dispersion of Jews from Judea and later from Israel. These statements confirm Sheffer’s (2003) claim that until relatively recently most definitions of ‘diaspora' were in terms solely of the Jewish dispersion (see also Brubaker, 2005). The Merriam-Webster Online Dictionary has a similar definition, but also includes a second and broader definition, namely, ‘the movement, migration, or scattering of a people away from an established or ancestral homeland' (Merriam-Webster Online Dictionary, 2013).
Brubaker (2005) noted that in recent literature the term ‘diaspora' has been extended to refer to almost every nameable population that is dispersed in space. He conducted a search of books published on the topic of diasporas since 1900, and found ‘that nearly all (17 of 18) books published on diasporas between 1900 and 1910 addressed the Jewish case; as late as the 1960s, this remained true of 15 of 20 books sampled. In 2002, by contrast, the top 20 books sampled (of 253 published that year) addressed 8 different cases; only two of the twenty addressed the Jewish case' (Brubaker, 2005: 14). These observations and data suggest that currently, the term diaspora is used to refer to all dispersed populations, not just the Jewish population.
There is an extensive debate in the literature on what peoples should be included in a diaspora. Brubaker (2005) covers most of the issues, but see also Anderson (1998), Sartori (1970), and Sheffer (1986, 2003). Should Country X’s diaspora refer only to persons born in Country X but now living outside Country X? Or should it refer to persons born in Country X and living outside that country providing some economic, political and related support to Country X? Or should it refer more broadly to persons who claim identification via birth or ancestry with Country X? We use the third definition and refer to the diaspora of Country X as comprising persons living outside Country X who claim identification with Country X through birth or ancestry. Our definition does not require that the person be born in Country X, nor does it require that he/she have citizenship in Country X. We only require that the person be born in or claim ancestry from Country X.
The fifteen largest diasporas in the world, c. 2010.
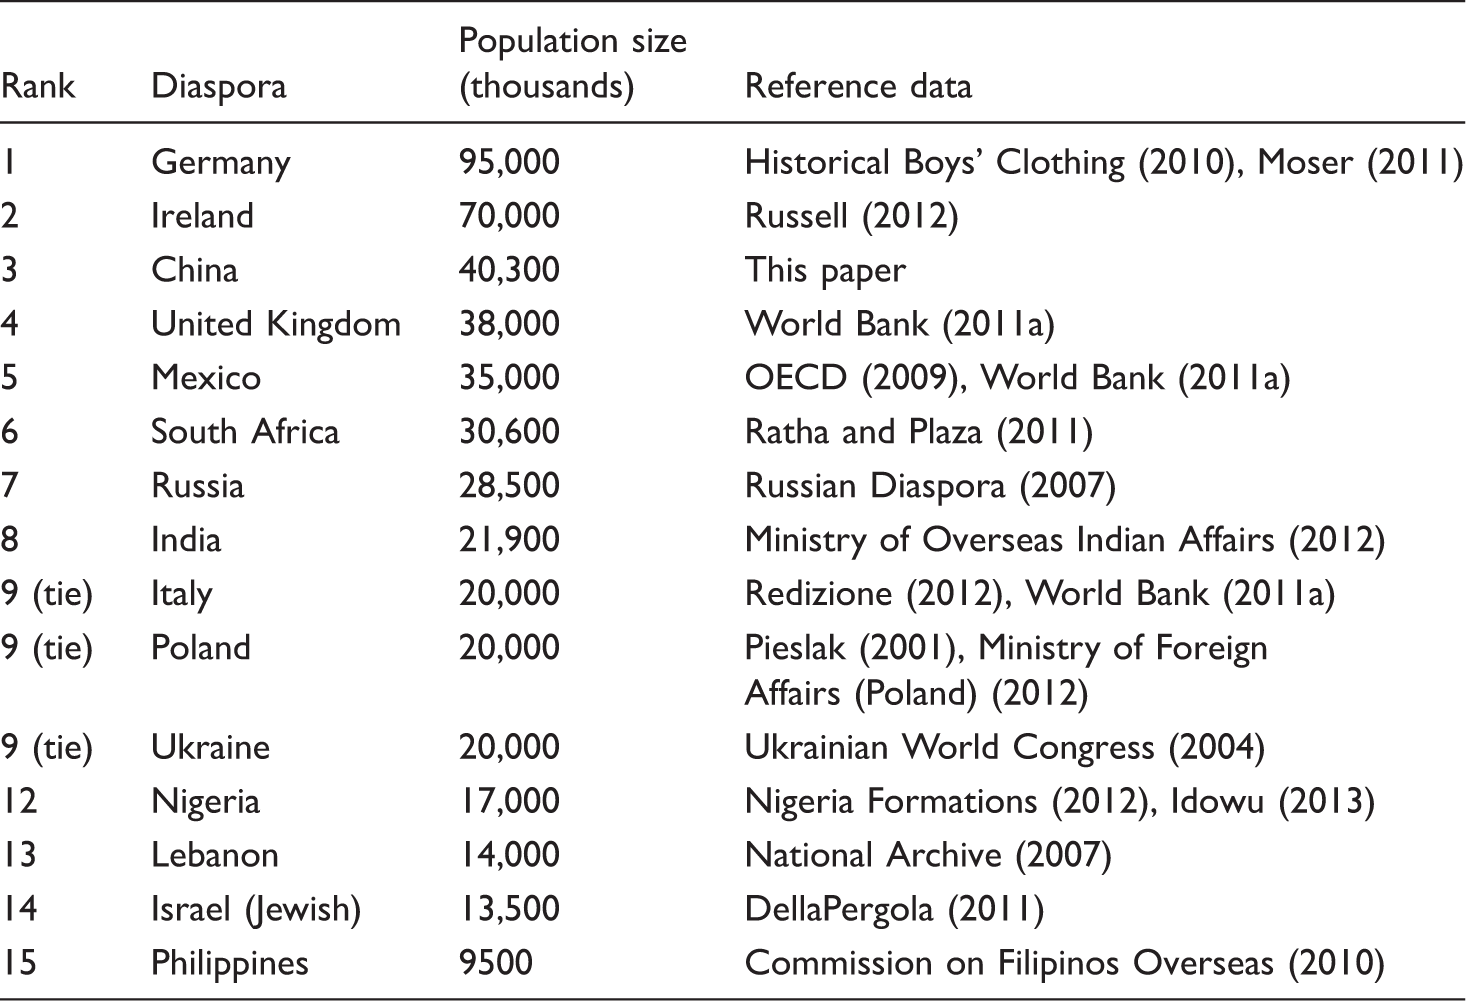
It is of particular interest to point out that with one of the smallest populations in the world, Ireland, has the second largest diaspora. The combined populations in 2012 of the country of Ireland at 4.6 million and Northern Ireland at 1.8 million equal just over 6.4 million Irish people living on the island of Ireland. Yet an estimated 70 million people identify as Irish via birth or ancestry.
More than half of the Irish diaspora and more than four-fifths of the German diaspora reside in the United States, a country comprised almost entirely of immigrants or descendants of immigrants. Less than two percent (1.7%) of the US population identified themselves in the 2010 census as American Indians or as Alaskan Natives (Norris et al., 2012), meaning that over 98 percent of Americans are immigrants or descendants of immigrants. This fact led to the phrase popularized by President John F. Kennedy in a posthumously published book in which he called the United States a ‘nation of immigrants' (Kennedy, 1964). Moreover, nearly all white Americans are descendants of Europeans, with very few Americans born in Europe. Furthermore, all but a very small percentage of white Americans identify a European country of ancestry, with Germany and Ireland being the two most often cited (Hout and Goldstein, 1994: 64).
Our brief analysis of diasporas indicates that only two diasporas (German and Irish) are appreciably larger than the Chinese diaspora. These two diasporas, though much larger than the Chinese diaspora, are of a much more recent historical vintage. That is, the German and Irish diasporas date from around the 18th century or perhaps slightly earlier. In contrast, the Chinese diaspora, as we note below, has a much longer history, dating back to the Qin Dynasty, more than 2000 years ago. Although not the largest of the contemporary diasporas worldwide, the Chinese diaspora is third among the top fifteen and is the largest diaspora from Asia.
Major patterns of prior emigration from China
We now discuss the major patterns of prior Chinese emigration. According to Wang (1991), there have been four principal patterns over the past two centuries. The first is the Huashang (Chinese trader) pattern; it is characterized by merchants and traders and eventually their families going abroad to establish businesses in the host countries. Typically comprising mainly males, after one or two generations many of these merchants ‘settle down and bring up local families' (Wang, 1991: 5). The more prosperous their businesses, the more likely they are to maintain ‘their Chinese characteristics, if not all their connections with China' (Wang, 1991: 5). Huashang migration has been the prominent model of Chinese emigration to many Asian countries, particularly to Southeast Asia before 1850 (Fitzgerald, 1965; Legge, 1886).
Lynn Pan’s (1990) Sons of the Yellow Emperor: A History of the Chinese Diaspora provides very interesting and fascinating stories, indeed mini-biographies, of the emigrations of numerous Chinese families, many of whom followed the Huashang pattern. For example, in 1841, a 24-year-old male from Tongan County in Fujian Province left China and migrated to the Philippines accompanied by his 6-year-old son, Giok Kuan Co. This was the second emigration for the father (known in the Philippines as Martin Co), who as a young boy had emigrated from Fujian to the Philippines with his father. After Martin had grown up and saved some money, he returned to his village in China, married, and had children. Giok Kuan Co, the above mentioned boy who accompanied Martin Co on the emigration in 1841, was his second son. In the Philippines, this son was later baptized by the Spaniards and named Jose, later becoming known as Jose Cojuangco. Jose started as a carpenter in Manila, established a large business specializing in sugar and rice, and also became a money lender. He accumulated a great deal of land and wealth in the Philippines province of Tarlac. He married, had children, and they married and had children, and this Chinese-Filipino family grew and prospered. The great-granddaughter of Jose Cojuangco (Giok Kuan Co) was María Corazon Sumulong ‘Cory' Cojuangco-Aquino, who was born in the Philippines in 1935 and died in 2009. She served as the eleventh President of the Philippines and was the first woman ever to hold that office. Often regarded as the ‘Mother of Philippine Democracy,' she was also the first female ever to serve as a president in all of Asia. Her ancestry may be traced to her great grandfather, who immigrated to the Philippines as a young boy in 1841 following the Huashang pattern of Chinese emigration.
The Huashang pattern has predominated throughout history. The first recorded Chinese emigration followed the Huashang pattern (Zhu, 1991), occurred during the Qin Dynasty (221–206 BC), and was to either Japan or the Philippines. Whereas the other three patterns we discuss in the following paragraphs occurred in particular time periods, the Huashang pattern has occurred throughout history and continues to this very day (Poston et al., 1994; Redding, 1990; Wang, 1991).
The second pattern of Chinese emigration Wang (1991) describes is the Huagong (Chinese coolie) pattern, which occurred from the 1840s through the 1920s, when Chinese migrated to North America and Australia. This migration involved ‘coolie trade' in low-level occupations concentrated in gold mining and railway building (Campbell, 1923; Kung, 1962; McKenzie, 1925; Mei, 1979; Stewart, 1951). Pan (1990: 61) has written that the Chinese coolie migrants ‘went to work in virgin territory across the world … [and] most lived by the sweat of their brow.' It was the coolie trade which ‘took the bulk of the Chinese to the New World, with shipload after shipload reaching Cuba, Peru and … British Guiana in the years between the 1840s and 1870s' (Pan, 1990: 67). In the late 1870s and 1880s, many Chinese went to Hawaii and to California. Pan (1990: 94) estimates that ‘by 1870, one out of every four workers in California was Chinese.'
Poston and Luo (2007: 328) have written about Huagong migration, noting that ‘during the rapid growth period of the frontier economy in the United States between 1850 and 1880, thousands of Chinese immigrated, mainly to the western United States, under the indenture system as miners, railroad workers, and agricultural laborers. They also came as cooks, laundrymen, and in other jobs that American workers did not want. Later, they were instrumental in building the western part of the trans-continental railroad.' Chinese emigrants who fit the Huagong pattern were usually men of peasant origin, and their migrations were often temporary because a ‘large proportion of the contract laborers returned to China after their contract came to an end' (Wang, 1991: 6).
The third of Wang’s patterns of Chinese emigration is the Huaqiao (Chinese sojourner) pattern, which mainly describes the emigration of well-educated professionals. This pattern was dominant for several decades after the fall of the Qing Dynasty in 1911 and was strongly tied to feelings of nationalism. Education was largely recognized as a deep commitment to promoting Chinese culture and national salvation among the overseas Chinese. Fitzgerald has written that the common belief then was that ‘without Chinese education, there can be no overseas Chinese' (Fitzgerald, 1972: 41). Beginning in the 1920s, many teachers went to the countries of Southeast Asia to instruct the children of Chinese immigrants (Pan, 1990: 206), and this trend continued until the 1950s (Poston and Luo, 2007).
The fourth pattern Wang describes is the Huayi (Chinese descent) pattern, which is a more recent phenomenon, prevalent since the 1950s. It involves persons of Chinese descent, Huayi, in one foreign country migrating to or remigrating to another foreign country. A good example would be the Chinese in Southeast Asia, many of whom have migrated to Western Europe in recent decades, ‘especially since the 1950s when some Southeast Asian nations made those of Chinese descent feel unwanted' (Wang, 1991: 9). The Chinese are disproportionately overrepresented in the commercial classes of nearly every Southeast Asian country, and in some of these countries they occupy major roles in the national economies (Pan, 1990: 226). Their economic successes are all the more remarkable when one remembers that ‘the Chinese in Southeast Asia have always been disliked for having profited from the indigenous reluctance to make money' (Pan, 1990: 226). Thus, when Thailand, and then the Philippines, followed by Indonesia and later Malaysia, began to explicitly lock the Chinese out of various sectors of their economies so as to promote the prosperity of the indigenous peoples, many Chinese simply left these countries and moved elsewhere.
Of the four major patterns, the Huashang is the most elementary and has been occurring for the longest period of time. Wang has speculated that with few exceptions, future Chinese migrations ‘will be based on the Huashang pattern and supplemented by the new Huayi pattern, with some features of the Huaqiao pattern surviving here and there' (Wang, 1991: 12). We turn now to a brief review of our earlier demographic analyses of the overseas Chinese.
Prior analyses
Our previous studies of the overseas Chinese (Huang et al., 1998; Poston, 2003; Poston et al., 1994; Poston and Yu, 1990; Yu and Poston, 1989) have examined their distribution in the 1980s and 1990s in all the countries of the world. In our prior research, as in the present study, we defined the overseas Chinese very broadly as all Chinese persons living outside the Chinese mainland and Taiwan, and after 1997–1999, outside Hong Kong and Macau. We have found in our current and earlier research that the definitions of overseas Chinese vary from country to country and from scholar to scholar. No definition is unfailingly clear and concise because the decision on whether or not a person or a group is overseas Chinese is often made by governments, both Chinese and foreign, by the larger societies alongside and within which the Chinese settlers live, or by individual scholars themselves (Poston et al., 1994; Williams, 1966). Thus, our definition here in this paper and in our earlier research includes all persons with any Chinese ancestors not living in the Chinese mainland, Hong Kong, Macau and Taiwan.
The overseas Chinese population of the world numbered between 26.8 and 27.5 million persons in the early 1980s, and 36.8 million in early 1990s. In 1983, the overseas Chinese population was about three times its number in 1948, and by 1990 it was four times its 1948 count. The 1948–1983 average annual growth rate exceeded 3 percent, and the average annual growth rate from 1983 to the early 1990s was 2.7 percent. From the early 1980s to the early 1990s, among the continents, Europe and the Americas had relatively high growth rates, Africa intermediate growth rates, and Asia and Oceania low growth rates. The individual countries also had different rates of overseas Chinese population change. Between 1955 and 1982, and between the early 1980s and the early 1990s, the Western European countries, the United States, Canada, Australia, New Zealand, and some of the Asian countries had higher than average annual growth rates.
Although overseas Chinese in the early 1980s lived in virtually all parts of the world, their distribution was uneven; from the early 1980s to the early 1990s, they comprised a small minority in most countries. More than 90 percent lived in Asia in the early 1980s, and almost 88 percent lived in Asia in the early 1990s. In both periods, over 80 percent of the overseas Chinese residing outside Asia lived in more developed countries. The data we report later in this paper will take us forward another 20 years to c. 2010. In the next section, we will discuss the data on overseas Chinese that we use in this paper.
Data
Distribution of the overseas Chinese in the world: c. 2001 and c. 2011.

Sources (as cited in the column headings and in col. D):
1Total population estimates for the countries (2011) are provided by the United Nations, Department of Economics and Social Affairs Population Division, ‘World Population Prospects: The 2010 Revision, Highlights and Advance Tables.' (Working Paper No. ESA/P/WP.220) and other sources (see #9, 12, 13 & 18), if there were no estimates reported by the ‘Overseas Chinese Economy Year Book Editorial Committee' ( Huaqiao Jingji Nianjian).
Countries with more than 5000 overseas Chinese are reported individually. Countries with less than 5000 overseas Chinese are grouped into the ‘Other' category.
‘Overseas Chinese Economy Year Book Editorial Committee', Taiwan ( Huaqiao Jingji Nianjian, 2011).
Data were provided to us directly by Jiang JiaHui, Chief Data Officer, ‘Overseas Chinese Affairs Council’, Taiwan.
The rates are exponential rates (see Discussion in the text).
Chosun (2013) (estimates of North Korea 2011 total population, 10 October 2009).
The 14 other Asian countries are: Pakistan, Sri Lanka, Kuwait, Oman, Jordan, Bangladesh, Lebanon, Sikkim, Iran, Afghanistan, Iraq, Syrian, Bahrain and Qatar.
Hong Kong and Macau became a part of China after 1997 and 1999, respectively. The number of overseas Chinese in these two areas as well as Ryukyu and Cyprus were not reported by the ‘Overseas Chinese Economy Year Book Editorial Committee’ or recorded by the ‘Overseas Chinese Affairs Council’ (c. 2000 and c. 2010).
Distribution of Population, Decadal Growth Rate, Sex-Ratio and Population Density, Provisional Population Totals: Sikkim (2011 total population; http://censusindia.gov.in/2011-prov-results/prov_data_products_sikkim.html).
The other American countries or territories are: Columbia, Honduras, Nicaragua, El Salvador, Bahamas, Haiti, Uruguay, Barbados, Bolivia, St Lucia, St Christopher and Nevis, St Vincent and the Grenadines, Grenada, St Martin Island, Martinique, Aruba, Dominica and Micronesia.
The number of overseas Chinese in the British Virgin Islands was not reported by the ‘Overseas Chinese Economy Year Book Editorial Committee’ or recorded by the ‘Overseas Chinese Affairs Council’ (c. 2000 and c. 2010).
Federated States of Micronesia 2010 Census Preliminary Population Counts (Pohnpei 2011 total population), Office of Statistics (2010).
The World Bank (2011b) (Saint Martin 2011 total population), Data Bank.
The 8 other European countries are: Czech Republic, Poland, Luxembourg, Iceland, Latvia, Macedonia, Lithuania, and Estonia.
The number of overseas Chinese in Malta was not reported by the ‘Overseas Chinese Economy Year Book Editorial Committee’ or recorded by the ‘Overseas Chinese Affairs Council’ (c. 2000 and c. 2010).
Australia includes Christmas Island, Cocos (Keeling) Island, and Norfolk Island.
The 12 other Oceania countries or territories are: Nauru, Vanuatu, Samoa, Solomon Islands, Tonga, Marshall Islands, Palau, Kiribati, Tuvalu, American Samoa, Guam and Saipan.
Population of the Commonwealth of the Northern Mariana Islands (CNMI) by Village (Saipan 2011 total population): 2010 with 2007 Election Districts. CNMI Department of Commerce (2010).
The 19 other African countries are Lesotho, Ghana, São Tomé and Príncipe, Egypt, Swaziland, Malawi, Uganda, Togo, Mozambique, Tanzania, Seychelles, Angola, Ivory Coast, Libya, Chad, Senegal, Burkina Faso, Namibia, and Gambia.
The number of overseas Chinese in Congo, Liberia, Sudan, Ethiopia, Zambia, Botswana, Morocco, Sierra Leone, Niger, Cameroon, and Zaire were not reported by the ‘Overseas Chinese Economy Year Book Editorial Committee’ or recorded by the ‘Overseas Chinese Affairs Council’ (c. 2000 and c. 2010).
In Table 2, we also report data for c. 2001, on the numbers of overseas Chinese in various countries. Virtually all the 2001 data were provided to us directly by Ms. Hui (see above). This was the case because between 2000 and 2002 the Overseas Chinese Economy Year Books only provided data on the overseas Chinese populations in thirteen countries, namely, Indonesia, Thailand, Malaysia, Singapore, Japan, United States, Canada, France, United Kingdom, the Netherlands, Australia, New Zealand, and South Africa. There were no Economy Year Books published between 2003 and 2006. The Statistical Yearbook of the Overseas Compatriot published in Taipei by the Overseas Community Affairs Council (2013) also provides limited data on the overseas Chinese.
As noted, most of the data in this paper were provided by the Overseas Chinese Affairs Council in Taiwan. These data are collected from official representatives at overseas Taiwanese offices, as well as trade offices (e. g. the ‘Taipei Economic and Cultural Offices' and ‘World Taiwanese Chambers of Commerce') located in about 74 countries. These offices perform a wide variety of services in over 263 areas in the world. Every year, they collect data on the numbers of Chinese residing in their respective countries and most other countries without representative offices.
To illustrate, let us consider the data-gathering operations in the office in India. In addition to gathering data on the Chinese in India, the representatives at the ‘Taipei Economic Center' in India are also responsible for collecting the overseas Chinese data for the countries of Bhutan, Sri Lanka, Maldives, Nepal and Bangladesh (Bureau of Consular Affairs, 2011).
The primary sources of data are usually the national censuses of the countries, and the secondary sources include several statistical and data publications from the United Nations and the US Central Intelligence Agency.
The population size and distribution of the overseas Chinese
In Table 2, we present the numbers of overseas Chinese for c. 2011 and c. 2001 for every country with at least 5000 overseas Chinese in 2011. Countries with fewer than 5000 overseas Chinese are grouped by continent into a residual category (‘others') and are identified by name in the notes for Table 2.
We show in Table 2 that there were over 40.3 million overseas Chinese in 148 countries around 2011, and over 35.8 million in 143 countries around 2001, representing an increase of almost 5 million in the 10 years between 2001 and 2011, or an annual rate of growth of around 1.2 percent. In our earlier research we estimated average annual growth rates of 2.7 percent for the 1990s and 2.5 percent for the 1980s (Poston et al., 1994; Poston and Yu, 1990). If the current annual growth rate of 1.2 percent for the overseas Chinese worldwide were to remain unchanged, the number of overseas Chinese would double to about 80 million in another 58 years.
Of the approximately 40.3 million overseas Chinese in 148 countries in 2011, about 29.6 million, or 73.3 percent, were in 35 Asian countries. The percentage of overseas Chinese residing in Asian countries was 74.9 in 2001 (see the top row of Table 2). In c. 2011, 18.6 percent of the overseas Chinese lived in 40 countries of the Americas, as compared to 17.1 percent in c. 2001. With respect to the European countries, they contained 5.0 percent in 2011 and 5.5 percent in 2001. In 2011, the countries of Oceania contained 2.4 percent of the overseas Chinese, versus 2.1 percent in 2001. African countries in 2011 had just 0.6 percent of the overseas Chinese, compared to 0.4 percent in 2001.
Almost two-thirds (65 percent) of the 40.3 million overseas Chinese resided in four countries in 2011 (see Figure 1): there were 8.0 million Chinese in Indonesia (19.9 percent of the total overseas Chinese population), 7.5 million (18.6 percent) in Thailand, 6.5 million (16.2 percent) in Malaysia, and 4.2 million (10.3 percent) in the United States. Three of the four countries with the largest numbers of overseas Chinese are in Asia. In addition to these three Asian countries, the 10 countries with the largest overseas Chinese populations include four more Asian countries, namely, Singapore, the Philippines, Myanmar and Vietnam, and three countries in the Americas, namely, the United States, Canada, and Peru. These 10 countries contained 86.3 percent of the total overseas Chinese population in 2011. The remaining 13.7 percent, a little more than 5.5 million Chinese, resided in 138 other countries.
Ten countries with the largest overseas Chinese population and percentage of world total of overseas Chinese, c. 2010.
Among these 138 remaining countries in 2011, sixteen each have at least 100,000 Chinese residents: 754,900 in Australia; 675,900 in Japan; 447,200 in Russia; 441,800 in France; 401,000 in the United Kingdom; 252,300 in Brazil; 201,700 in Italy; 176,500 in Laos; 149,000 in New Zealand; 147,000 in Cambodia; 136,000 in Panama; 130,000 in India; 110,000 in the United Arab Emirates; 140,600 in Spain; 111,500 in the Netherlands; and 110,200 in South Africa (see Table 2).
In only one country, Singapore, do the Chinese comprise the majority population; Figure 2 presents the percentage of the total population that is overseas Chinese for those 12 countries with the largest percentages. More than 53 percent of the Singapore population is Chinese, followed by the populations of Malaysia at 23 percent, Kenya and Brunei at 12 percent each, and Thailand at just under 12 percent. In the 136 host countries not shown in Figure 2, overseas Chinese represent less than 3.2 percent of their total populations.
Overseas Chinese as a percentage of a country's total population: 12 countries, c. 2010.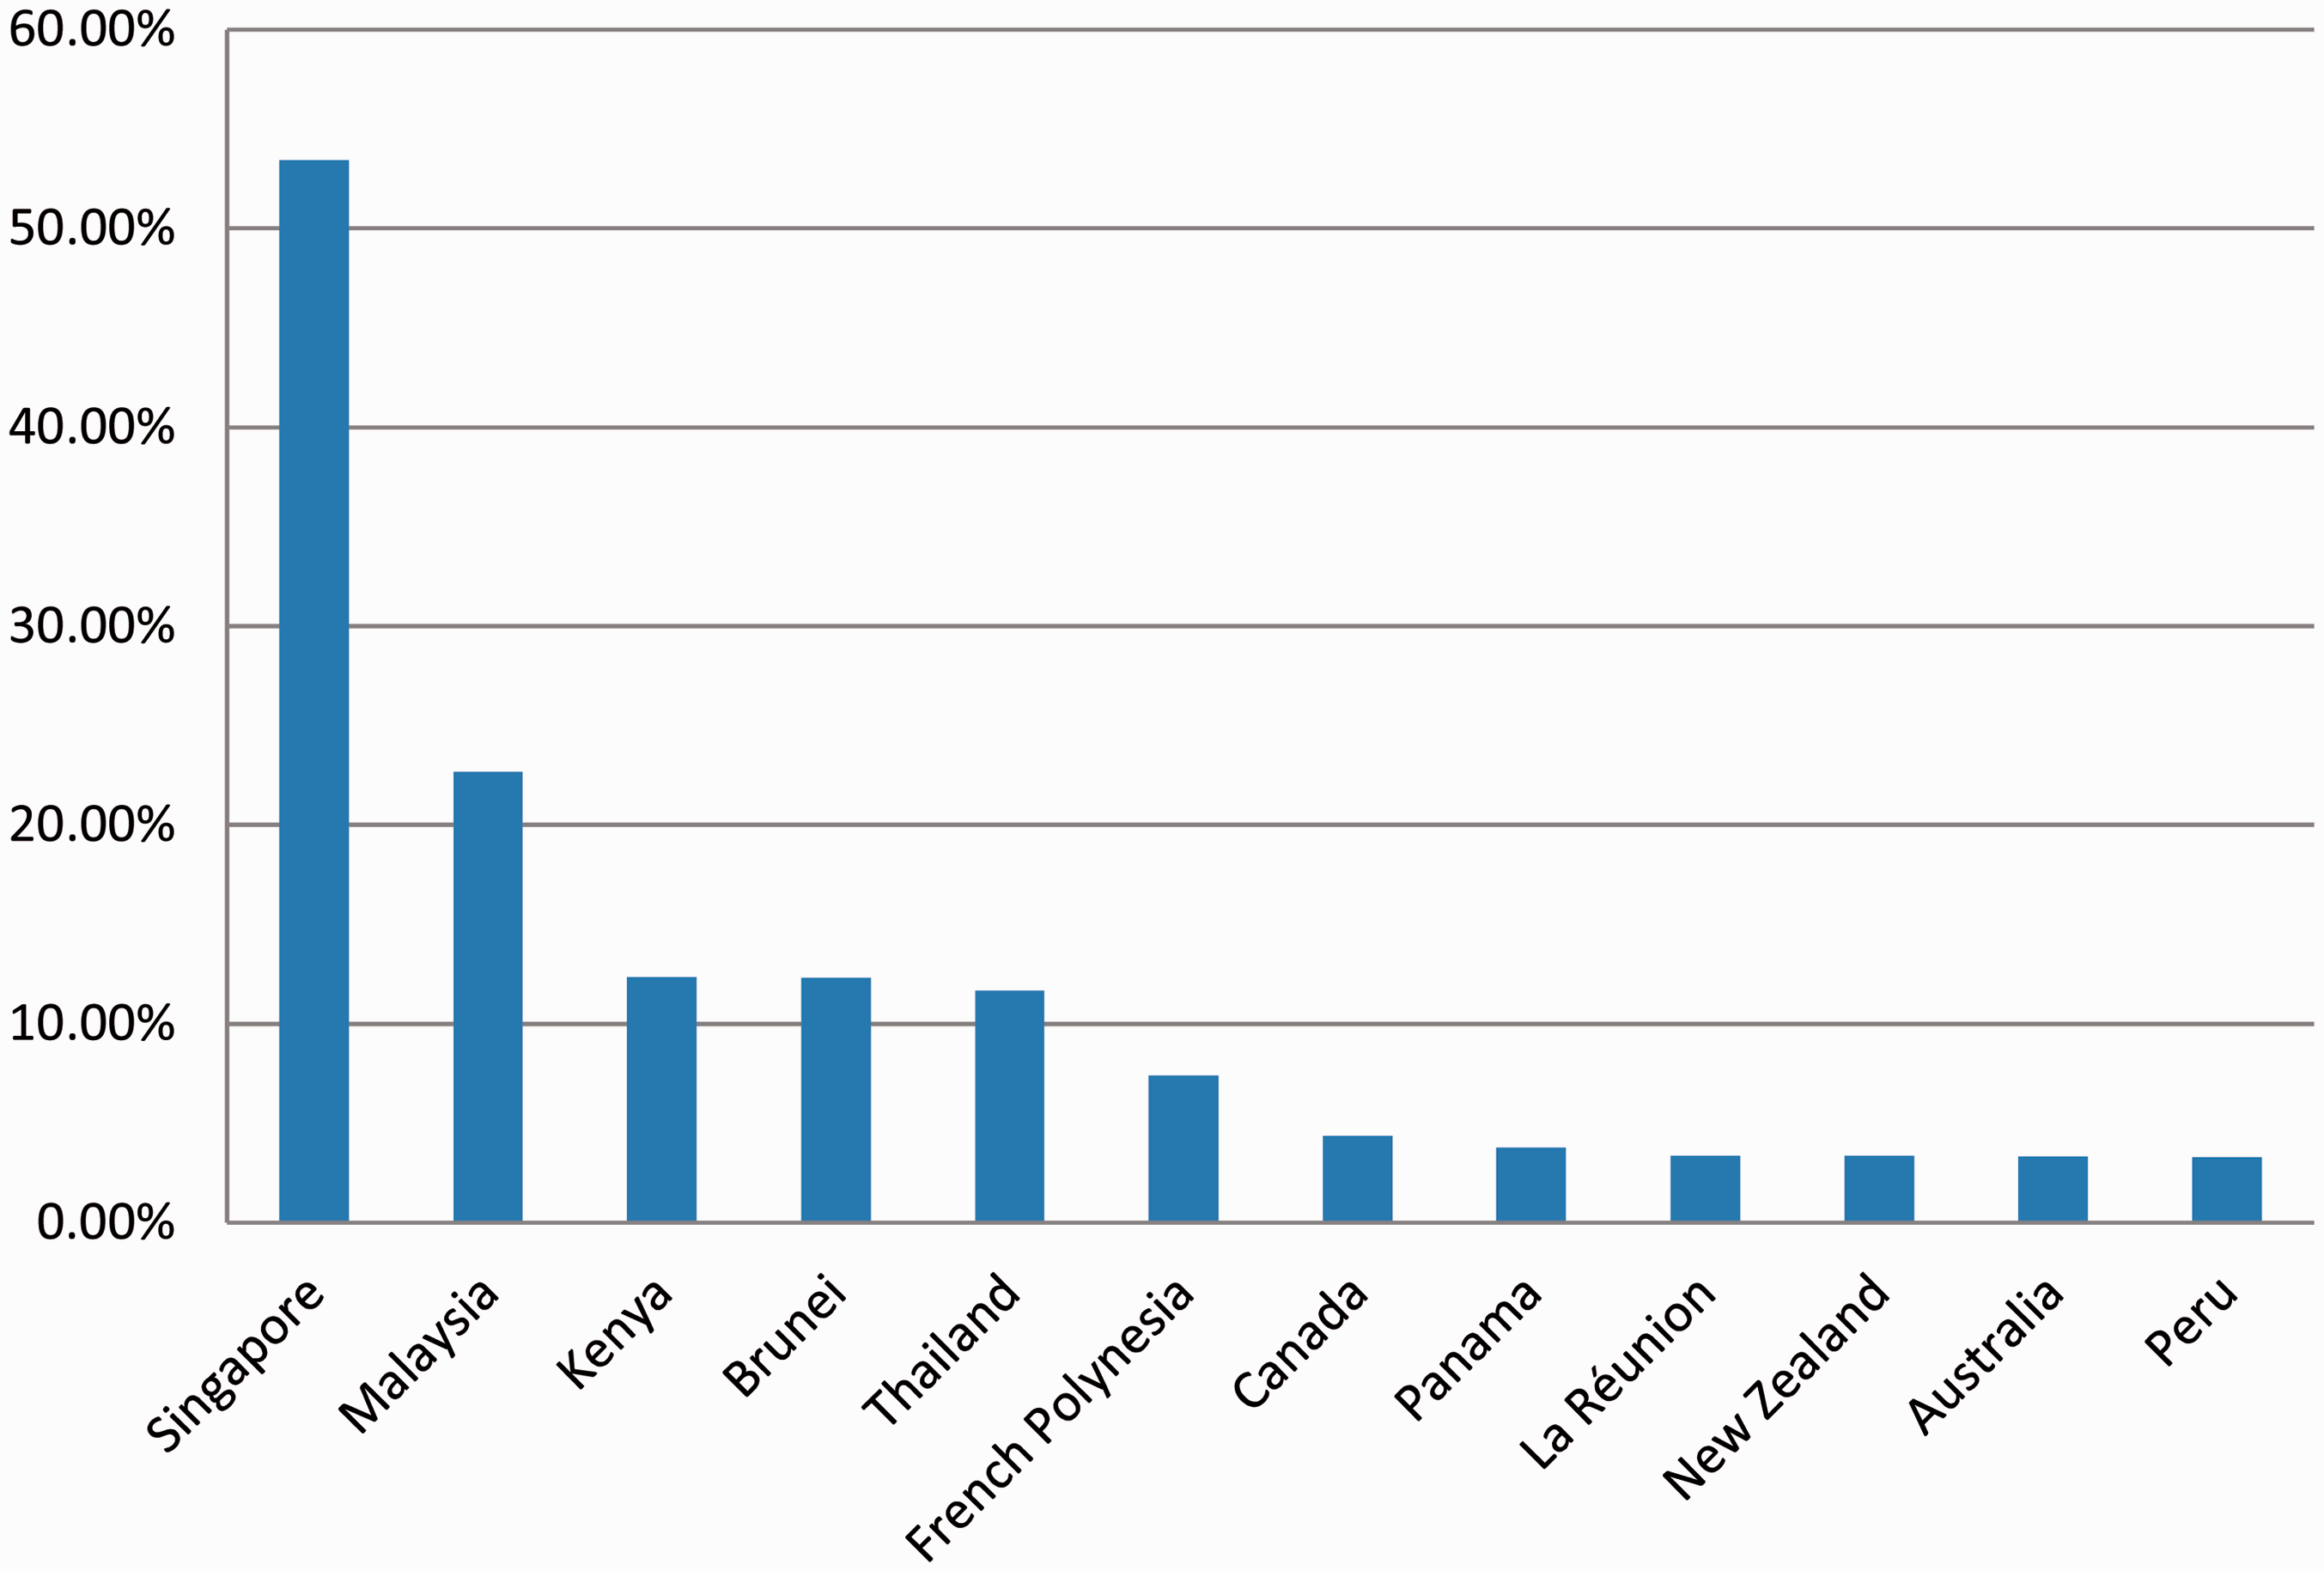
Changes between 2001 and 2011 in the sizes of overseas Chinese populations
Numbers of overseas Chinese (a) and their annual growth rates (b) in the world and by continent, for various time periods between 1948 and c. 2011.
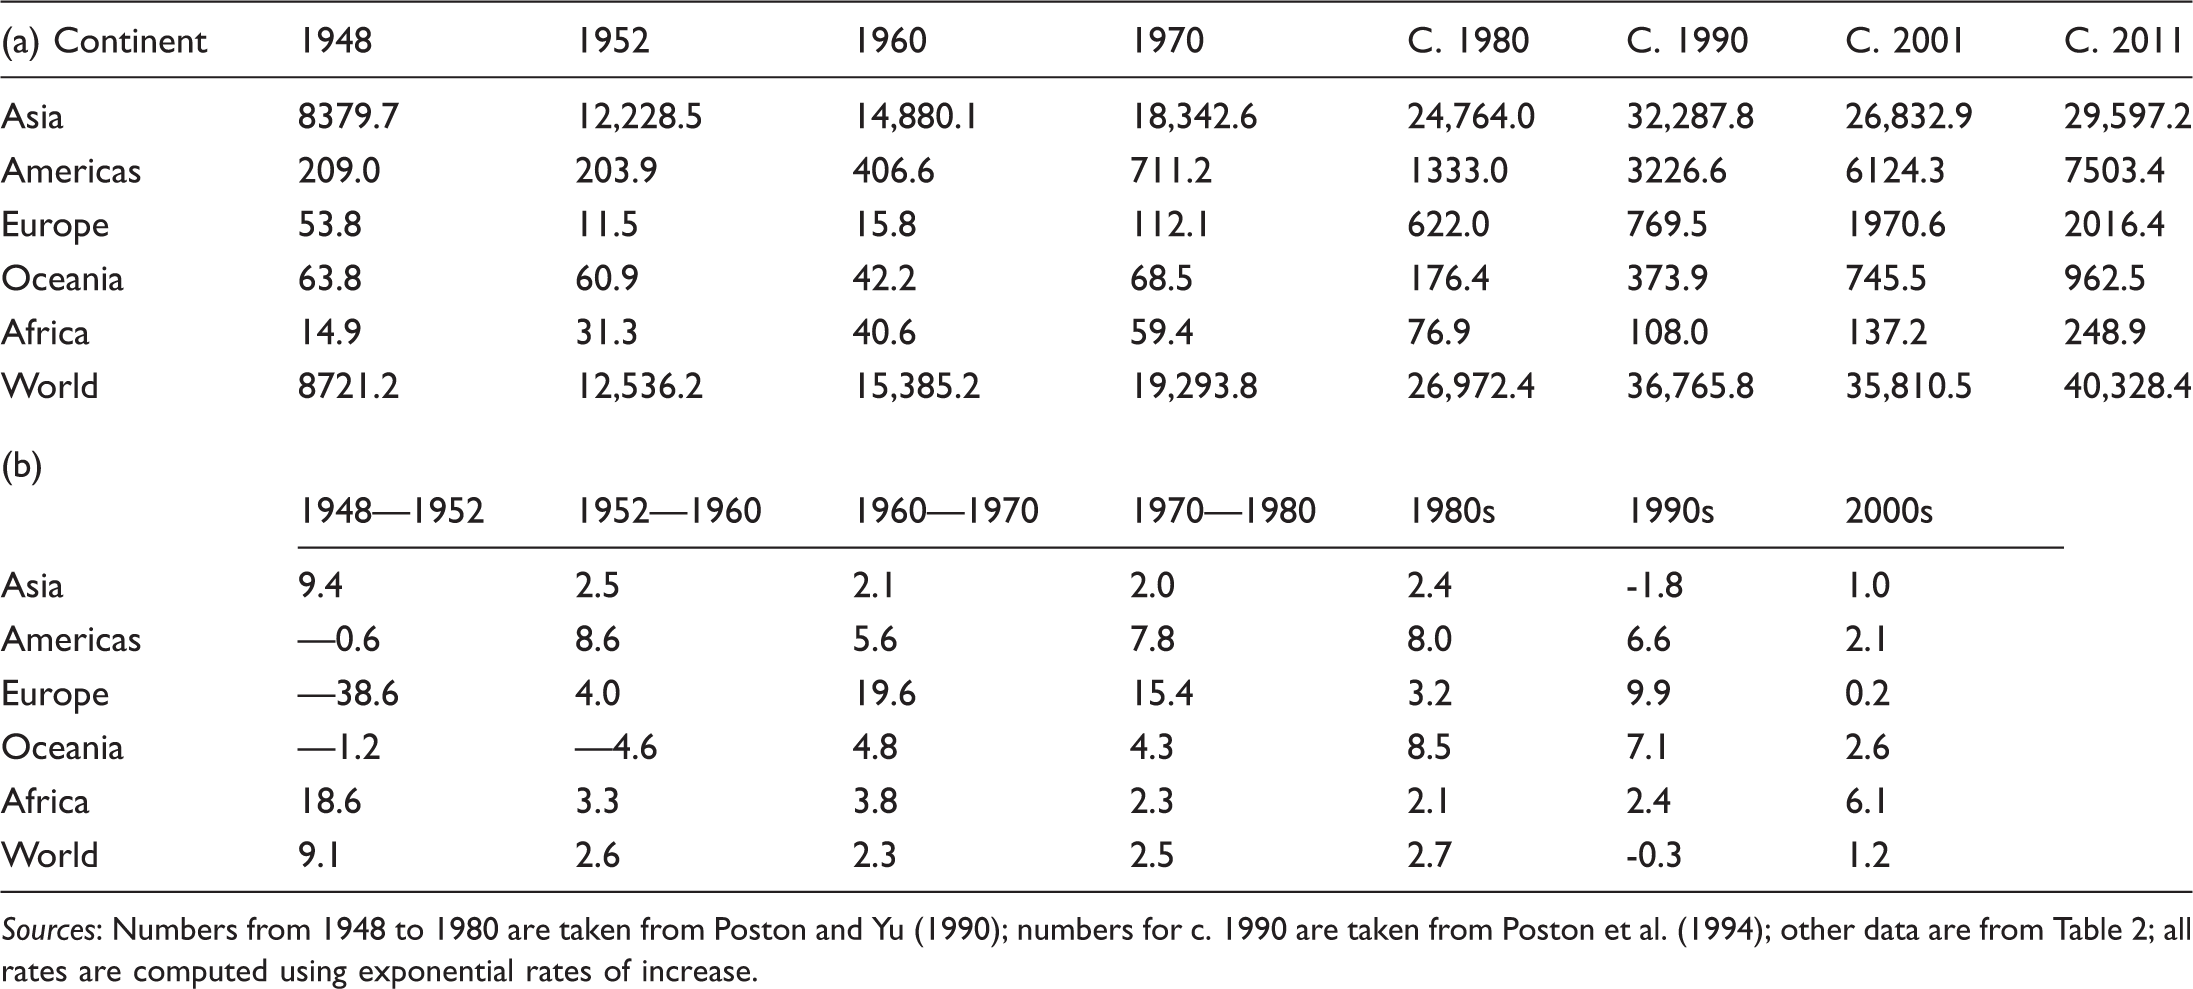
Sources: Numbers from 1948 to 1980 are taken from Poston and Yu (1990); numbers for c. 1990 are taken from Poston et al. (1994); other data are from Table 2; all rates are computed using exponential rates of increase.
We see that the size of the overseas Chinese population has increased from 8.7 million in 1948 to over 40.3 million in 2011. As always, the largest numbers of overseas Chinese are in Asia.
In the world as a whole, the highest rate of overall population growth of overseas Chinese occurred during the 1948–1952 period, which was right before and after the birth of the People's Republic of China. The size of the overseas Chinese population increased from 8.7 million in 1948 to 12.5 million in 1952, an annual rate of increase of 9.1 percent. A large portion of this increase was attributable to emigration from China right before and after October 1, 1949 when the People’s Republic of China was formally founded. The rate then dropped to 2.6 percent for the period 1952–1960, and was even lower for the next two time periods. In the next period, the decade of the 1980s, the rate increased to 2.7 percent. Some of this increase from 1948–1952 was also due to fertility, but the fertility of overseas Chinese people is low; the bulk of the increase was due to emigration from China.
The decade of the 1990s shows a decline of 0.3 percent in the size of the overseas Chinese population worldwide; the number of overseas Chinese dropped from almost 36.8 million in 1990 to 35.8 million in c. 2001. This was due almost entirely to a change in the definition of China that occurred in the late 1990s. That is, Chinese people living in Hong Kong and Macau prior to the late 1990s were considered overseas Chinese. In 1997 and 1999, respectively, Hong Kong and Macau were returned to China, and then officially became parts of China. Thus, persons residing in Hong Kong after 1997 and in Macau after 1999 were no longer defined as overseas Chinese. In 1990, the population of Hong Kong was 5.9 million and that of Macau was around 400,000. In the count of the overseas Chinese in 2001 these 6.3 million persons were no longer included, resulting in a negative rate of change for the 1990–2000 period; this effect of dropping Hong Kong and Macau residents from the count of overseas Chinese is seen more dramatically in the negative rate of change for the 1990s for Asia (−1.8 percent).
In the most recent period, from c. 2001 to c. 2011, the number of overseas Chinese has increased from 35.8 to 40.3 million, an annual rate of increase of 1.2 percent. We noted earlier that if this rate continues unchanged, the number of overseas Chinese will double to over 80 million in another 58 years. Some of this increase was due to natural change.
With regard to variation in the growth patterns of the overseas Chinese by continent, from the late 1940s to the early 1950s the Chinese population increased in Asia and Africa and declined somewhat in Europe, Oceania and the Americas. But since the 1960s, the numbers have increased on every continent in every period (except, as already mentioned, Asia in the 1990s, which was an artifact of the changing geography of the country of China). The European Chinese population had a negative rate of increase between the late 1940s and the early 1950s (−38.6 percent), but then a very rapid increase in the 1960s (19.6 percent) and 1970s (15.4 percent). In the 1980s, the European population of overseas Chinese experienced a moderate increase of 3.2 percent, and then a greater increase of 9.9 percent in the 1990s.
In the 2000s, the numbers of overseas Chinese have increased on all the world’s continents. By far the largest percentage increase was in Africa (6.1 percent). This was due mainly to the tremendous expansion by China in the past decade or so of its economic and political ties with African countries. China is now Africa’s largest trading partner, having edged out the United States in 2010. China’s trade with Africa reached $114 billion in 2010, up from $10 billion in 2000 and $1 billion in 1980. In 2012 it reached $200 billion. In 2010 Chinese firms accounted for 40 percent of all corporate contracts signed in African countries, compared to 2 percent for US firms (French, 2014; Wonacott, 2011). The Chinese in Africa these days ‘have rapidly penetrated every conceivable walk of life: Farmers, entrepreneurs building small and medium-sized factories, and practitioners of the full range of trades, doctors, teachers, smugglers, prostitutes' (French, 2014: 5).
In 2011 there were less than 250,000 overseas Chinese in Africa, the smallest number in all continents (Table 3). But if the annual population growth rate of Chinese in Africa of 6.1 percent remains unchanged, the numbers will double every 11 years, to 500,000 in 2022 and to 1,000,000 in 2033. The number of Chinese in Africa will never reach the level of Chinese in Asia, but it is in Africa where the greatest relative increases will likely occur over the next few decades.
Characteristics of the host countries
Finally, we consider whether there are any noticeable regularities with respect to the locations of the overseas Chinese. For instance, are more overseas Chinese found in richer or in poorer countries? Are more found in urban or in rural countries? Are Chinese more prevalent in large or in small countries? Also, does the number of overseas Chinese in a country decline with increasing distance from China?
Ecological theories of migration and settlement patterns (Hawley, 1950; Poston and Frisbie, 2005) suggest that there should be more overseas Chinese in richer countries, in urban countries, and in large countries (both in terms of population size and geographic area). Furthermore, the classic distance–decay theory of migration (Ravenstein, 1885; Zipf, 1946) would suggest that the farther a country is from China, the smaller the population of overseas Chinese should be in that country.
We measured the size of the overseas Chinese population using the absolute population figures in Table 2, column e. We opted to use the absolute population size of overseas Chinese, rather than their relative population size because a relative number tends to minimize the presence of overseas Chinese in countries with large overall populations and exaggerates their presence in small countries. For example, Indonesia is the country with the largest number of overseas Chinese, over 8 million, but the Chinese only comprise just over 3 percent of Indonesia’s overall population. Conversely, Brunei has only 51,000 overseas Chinese but they comprise over 12 percent of Brunei’s population. Indonesia’s overseas Chinese population has much greater worldwide and national demographic, economic and political impacts with regard to Chinese activities, and the in-migration of Chinese to Indonesia, than that of Brunei’s overseas Chinese population. Yet the relative size of the overseas Chinese population in Brunei is four times that in Indonesia.
Zero-order correlation coefficients between the number of overseas Chinese (logged) and six demographic and ecological characteristics of the host countries, c. 2011.
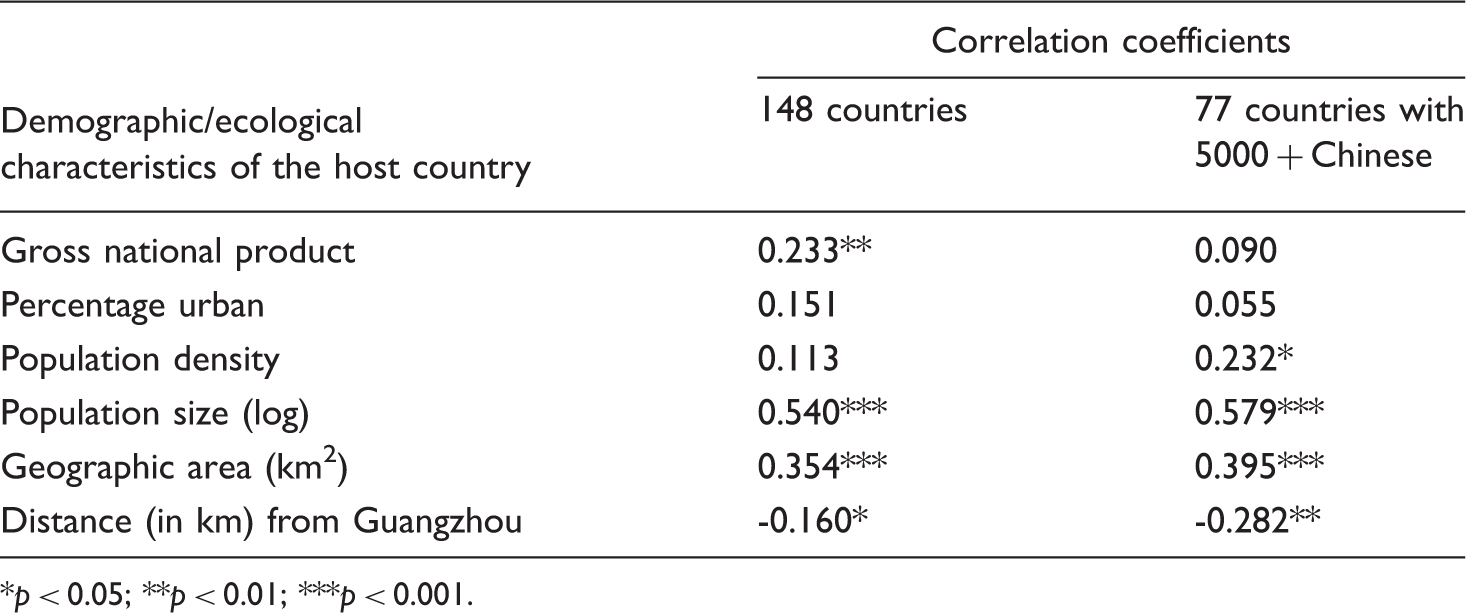
p < 0.05; **p < 0.01; ***p < 0.001.
The correlations in the first column of Table 4 refer to all 148 host countries; the correlations in the second column pertain to those 77 host countries with overseas Chinese populations of over 5000.
Among all 148 host countries, the correlations in Table 4 show a positive association between the logged values of the size of the overseas Chinese population and the logged values of the host country's total population and its geographic area; the larger the population and geographic area of a country, the larger the number of overseas Chinese in the country. And the farther the country is from Guangzhou, the smaller its number of overseas Chinese. We found no statistically significant correlation between the number of overseas Chinese and either percentage urban or population density.
Turning next to the relationships among those 77 receiving countries with at least 5000 overseas Chinese, we find the same results regarding the correlations between the number of overseas Chinese and the size of the host country (both population and geographic area) and the distance of the country from Guangzhou. However, there are two differences in the correlations for the 77 countries compared to those for all 148 countries. First, we find no significant association between the number of overseas Chinese and the country’s GNP, a different situation from the statistically significant positive correlation we found among all 148 countries. Overseas Chinese were found to be more numerous in the richer countries when we focused on all 148 countries. However, when we restrict the focus only to those 77 countries with at least 5000 overseas Chinese the relationship becomes insignificant; this is because most of the poorer countries, that is, those with lower values of GNP, with fewer overseas Chinese, are no longer included in the analysis.
Second, when focusing on the 77 countries with at least 5000 overseas Chinese, we find a significant correlation between the number of overseas Chinese and population density per square kilometer; r = 0.232. The more densely populated the country, the greater the number of overseas Chinese. However, this association is highly conditioned by the extreme outlier of Singapore, the country with the highest population density of all the countries. Indeed, Singapore’s density of 7539 persons per square kilometer is more than four times greater than that of the country with the second highest population density, Bahrain. Singapore also has the fifth largest number of overseas Chinese globally. When we remove Singapore from the analysis, the correlation coefficient between the number of overseas Chinese and population density declines to a level of insignificance; r = 0.027.
Conclusion
Chinese emigrants began to move to other Asian countries, particularly Southeast Asia, more than 2000 years ago. Large numbers of Chinese migrated from China to virtually every other country in the world during the 19th century and early 20th century. By around 2011, there were over 40.3 million overseas Chinese residing in 148 countries. Overseas Chinese are now minorities in all countries except Singapore, where they comprise just over half of the population. More than 73 percent of the overseas Chinese live in Asia, especially Southeast Asia, and over 80 percent of the Chinese who live outside Asia reside in more developed countries. There is no reason to believe that the distribution of overseas Chinese in the world as described in this paper will change dramatically in the near future. The percentage growth rate in Africa will likely continue to be high, with the other continents maintaining their lower, albeit positive, rates of change.
Today, the direction and magnitude of Chinese international migration are very much influenced by the migration policies of the sending and receiving countries. Australia, Canada, New Zealand, and the United States are the main host countries for Chinese immigrants. Immigration today, however, is strictly limited and enforced in most countries of the world.
The mortality rates of overseas Chinese have declined in recent decades in the developed and most of the developing countries. Chinese fertility in most countries is as low as, or lower than, the fertility rates of most other groups in the host countries. These low fertility and mortality rates, for the most part, suggest that unless stringent emigration laws are implemented in China, and, more importantly, unless restrictive immigration laws are imposed in the host countries, the growth patterns of the overseas Chinese will likely tend to be more affected by international emigration and immigration policies than by the demographic processes of fertility and mortality.
The overseas Chinese population in the world as of 2011 numbered over 40.3 million, a population size larger than the total populations of Poland (38.2 million) and Canada (34.9 million), and almost as large as the population of Argentina (40.8 million). The Chinese diaspora is the third largest in the world, behind those of Ireland and Germany. Thus, overseas Chinese have had, and continue to have, important and significant influences in many host countries and are certainly not an inconsequential population.
Funding
This research received no specific grant from any funding agency in the public, commercial, or not-for-profit sectors.