



Abstract
In this article we estimate the role of institutions in conjunction with physical capital stock, human capital stock, openness and liberalisation in economic growth of the four major economies of South Asia. We apply both time series and panel data analysis for estimation. The time series analysis shows that physical capital stock positively influences economic growth of the four major South Asian countries. The influence of the other factors varies across the countries in the long run. When we control for institutional quality, the speed of adjustment diminishes for every country. The panel data analysis shows that voice and accountability and regulation impart positive and significant influence while government effectiveness and rule of law imparts negative significant influence on PCGDP of the countries. The study shows the need for higher investment in human capital, physical capital. Additionally, the quality of institutions in South Asia needs attention, to sustain growth in future.
Introduction
A glance at the South Asian economies during recent times reveals that their overall macroeconomic performance has increased considerably compared to the pre-1980s period. The transformation of this region is now drawing international attention. South Asia’s growth is all the more impressive because the region suffers from many growth-retarding factors like poverty, corruption, conflicts, high fiscal deficits, political instability and weak governance. Mallik and Chowdhury (2001) have observed that the four South Asian countries – India, Pakistan, Sri Lanka and Bangladesh – share a very similar economic structure and until very recently have followed roughly similar economic policies, viz. a relatively large public sector, a nationalized financial sector and five-year plans, though with varying emphasis.
With a population of more than 1.2 billion, India is the world’s largest democracy. Over the past decade the country’s integration into the global economy has been accompanied by impressive growth. India has now emerged as a global player, being the world’s fourth largest economy in purchasing power parity terms (World Bank, 2016a).
Pakistan faces significant economic, governance and security challenges to achieve durable development outcomes. The persistence of conflict in border areas, and security challenges throughout the country are a reality that affects all aspects of life in Pakistan and impedes development. A range of governance and business environment indicators suggest that deep improvements in governance are needed to unleash Pakistan’s growth potential (World Bank, 2016b).
After Sri Lanka gained independence from Britain in 1948, political power alternated between the conservative United National Party (UNP) and the leftist Sri Lanka Freedom Party (SLFP). While the country made impressive gains in education, basic health care and other social needs, its economic development was stunted and its social fabric tested by a long civil war between the government and the ethnic Tamil rebels.
Bangladesh gained independence from Britain in 1947 as part of the newly formed state of Pakistan and successfully split from Pakistan in December 1971, after a nine-month war. The 1975 assassination of independence leader and prime minister Sheik Mujibur Rahman by soldiers precipitated 15 years of military rule and continues to polarize Bangladeshi politics. The last military ruler resigned in 1990 after weeks of prodemocracy demonstrations.
These economic and political realities, along with other social and cultural factors and similarities in education, health, etc., make South Asia a highly appropriate setting to study the determinants of economic growth.
Our study proceeds as follows. In the first section, we provide a brief review of literature on the subject. The following section discusses the model along with data and methodology. In the section after that we estimate the various factors, namely physical and human capital, OPENNESS, liberalization and various institutional measures pertinent to the economic growth of the four South Asian countries, using time-series econometrics. We report the results and provide economic explanations for the results of the econometric analysis. The final section draws conclusions and discusses policy implications.
The contribution of the article to the literature is threefold. First, it explores the state of governance and its various institutions in the South Asian economies. Secondly, there are very few existing studies on the determinants of economic growth for the South Asian region under the purview of New Growth Theory (NGT). The present study makes an attempt in this direction and finds evidence in favour of both economic policies and institutions. Physical capital stock positively influences economic growth in the major South Asian countries; however, a positive and significant influence of human capital stock is observed for India, Pakistan and Sri Lanka only. The influence of OPENNESS (measured as trade-GDP ratio) varies across the countries in the long run. A significant negative influence of liberalization is observed in the case of Pakistan only. The time-series study incorporating the institutional quality of the individual countries shows that political institution (measured by POLITY) has a significant negative influence on the per capita GDP (PCGDP) of Pakistan only. No significant influence of political institution on PCGDP for the other three countries is observed. The influence of executive constraints (measured by XCONST) is positive and significant for Pakistan, and insignificant for the other countries. When we control for institutional quality, the speed of adjustment diminishes for every country. Thirdly, the article addresses methodological concerns of endogeneity using the VAR approach in time-series econometrics.
Review of the literature
The rapid economic growth of the newly industrialized economies (NIEs) has raised concern about why others parts of the world are not catching up (Rodrik, 1999, 2003; World Bank, 1993). Poverty and inequality still prevails in the developing economies and the gap between the rich and the poor continues to widen despite policy reform and huge amounts of aid (Easterly, 2001). The argument has been made that even good policy prescriptions fail because of poor institutional conditions, such as insecure property rights, a weak rule of law (Knack and Keefer, 1995) and the difficulties encountered while reforming towards this direction (Rodrik, 1996). Institutions have been identified as a leading determinant of economic development (North, 1990; Rodrik et al., 2004). North (1990) argues that the institutions of a given society affect the path of economic development by structuring political, economic and social interactions among its members. As such, institutions can either promote economic development or impede it. Rodrik (1999) argues that domestic social conflicts are a key to understanding why growth rates lack persistence and why so many countries have experienced a growth collapse since the mid-1970s. He finds support for the hypothesis that countries with high inequality and weak institutional quality experienced the sharpest drops in growth after 1975. In NGT, the term A can represent institutions and other ‘non-technological’ factors. Many economists had recognized the importance of institutions earlier also (Abramovitz, 1952; Kaldor, 1971; Kuznets, 1973; Nelson and Winter, 1974; North, 1990). Barro (1991) included variables like political assassinations and revolutions in his growth regressions. Since then there have been quite a number of attempts to include these institutional variables in growth analysis, as well as other variables such as legal characters, quality of governance, ethnicity and bureaucracy. While many (Acemoglu et al., 2001, 2002; North, 1990; Rodrik et al., 2004) have emphasized the relevance of institutions, others express doubt. Glaeser et al. (2004) revisited the debate on whether political institutions cause growth or whether, alternatively, growth and human capital accumulation lead to institutional improvement. They concluded that human capital is a more basic source of growth than institutions, that poor countries get out of poverty through good policies and subsequently improve their political institutions. Eicher and Leukert (2009) confirmed in their work that the impact of institutions varies substantially across a sub-sample of countries; they are about three times more important in developing countries than in OECD countries. Mankiw et al. (1992: 6) have pointed out that ‘the term A (0) reflects not just technology but resource endowments, climate, institutions, and so on; it may therefore differ across countries’. Hence, improvements in institutions, through the term A, can lead to steady growth. So, by recognizing that the production function differs across countries, the role of institutions in the economic growth of developing nations can be analyzed.
Ahmed (2006) examines which factors have contributed to the growth story of this region, despite constraints, and concludes that South Asia’s development outcomes are the result of good policies. The ADB (1999) has identified sets of governance problems facing South Asian countries, viz., that the State tries to do too much with limited resources and capabilities, and regulatory ossification. It has also proposed that the priority actions for the region be: better matching of the role of the state to its capability, cutting red tape and encouraging administrative renewal.
Institutional changes, along with open regionalism, are essential for outward orientated development in South Asia (Khan and Khan, 2003). Devarajan and Nabi (2006) have studied the underlying reasons for high growth in this region from 2000 to 2005, and identified external financing, especially remittances, and institutions as significant determinants. They highlighted the high priority policy choices facing two or more South Asian countries: increasing productivity and attracting investment, improving the quality of labour; reducing inequality; and exploiting cross-border synergies. Wagle (2007) found that liberalization efforts and inequality grew in South Asia during 1980–2003, and prescribed that policymakers should introduce policies that incrementally advance economic openness. Basu and Maertans (2009), Ghani and Ahmed (2009), Ribound and Tan (2009), Sachs (2009) and Volcker (2009) have all conducted analytical studies of the growth story of the region. Basu and Maertans (2009) tried to analyze the patterns of growth in the manufacturing and services sectors and their impact on employment and job creation. Ghani and Ahmed (2009) in their study have pointed to five key drivers of growth for the region: market integration, infrastructure, institutions, inclusive growth and regional public goods. Ribound and Tan (2009) have advocated that South Asia should shift emphasis to higher levels of education, without neglecting the unfinished education agenda at primary level. Sachs (2009) has focused on the regional integration of South Asian economies, while Volcker (2009) has dealt with the issue of governance in sustaining equitable growth. Bhattacharjee and Haldar (2015a, 2015b) in their study under the purview of NGT have undertaken panel data analysis and observed the negative insignificant influence of political stability in the four major economies of South Asia. Cooray et al. (2013) show, by employing appropriate statistical tests, that despite apparent homogeneity in countries belonging to the same geographical area with similar technology and apparently similar macro stylized facts, there could be other sources of heterogeneity such as different national policies or political, legal and economic institutions that may change the focus. They argue that this makes time-series estimation techniques more suitable for growth driving variables. Dreze and Sen (2013) have remarked that in recent years there has been growing recognition in India of the need for wide-ranging reforms of a different kind – aimed at eradicating corruption, restoring accountability in the public sector, fostering social equity and improving the effectiveness of administrative, judicial and legislative processes. However, the regnant scholarly consensus linking good governance to economic development has undergone surprisingly little empirical scrutiny in the region. Our study makes an attempt at empirical estimation of the determinants of economic growth, with special emphasis on the impact of institutions in South Asia, using time-series econometrics.
The model
Following Rebelo (1991), with a standard endogenous growth approach, a given country’s production can be characterized by the augmented production function as:
where,
Yt = Aggregate income at time t
At = Total factor productivity at time t
Kt = Aggregate capital stock at time t
(HC)t = Human capital stock at time t
We assume openness to affect growth through total factor productivity (TFP). So, we have:
North (1991) describes how the institutional matrix consists of an interdependent web of institutions and consequent political and economic organizations that are characterized by massive increasing returns. As institutions have been identified as a leading determinant of economic development (North, 1990; Rodrik et al., 2004), we incorporate institutions in our model. In NGT, the term A can represent institutions and other ‘non-technological’ factors. Availability of quantitative data on quality of institutions across countries has broadened the scope for studying the role of the various indicators of governance on economic growth. All these factors are relevant in studying the economic growth of developing and transitional economies. Assuming institution to affect growth via TFP, we have:
Now substituting for A t , Kt and HC t in equation (1) we get:
where,
ln Yt = natural log of per capita GDP at time t
ln PCKt = natural log of physical capital stock at time t
Zt = institution measure at time t
ln OPENt = natural log of OPENNESS at time t
ln MYSt = natural log of mean years of schooling at time t
ut = error term that varies over time periods
To capture the influence of liberalization 1 on the economies, we have introduced a dummy variable Dopen = 1 after liberalization year and 0 otherwise for each country.
Following Haldar (2009), we write the open-ended model shown in equation (4) below:
The model (equation 3) used in time-series analysis is again used in a panel set up, so that the transformed model is:
where,
ln Yit = natural log of per capita GDP in country i at time t
ln PCKit = natural log of physical capital stock in country i at time t
Zit = Institution measure of country i at time t
ln OPENit = natural log of OPENNESS in country i at time t
ln MYS it = natural log of mean years of schooling in country i at time t
uit = error term that varies across countries and time periods
The data for the subjective measures of institution are available from 1996 to 2014. As the period for the panel study is in the post-liberalization era for all the countries, Dopen has been dropped from the model. We run a panel regression for the 19-year period for the four major South Asian countries, namely, India, Pakistan, Sri Lanka and Bangladesh. The panel data allows for differences in production function across countries in the form of unobservable ‘country-specific effects’. This approach helps in understanding that apart from differences in rates of savings and labour force growth, persistent differences in many other factors, such as technology and institutions, are assumed to be significant factors in explaining the economic growth of the countries.
Data and methodology
Economic growth is measured in terms of per capita real GDP for the four analyzed countries. The study period ranges from 1960 to 2014 for the time-series study. However, based on the political background of the countries there are variations in their respective study periods. Annual data on per capita GDP, physical capital stock and OPENNESS are from Penn World Tables for the period 1960 to 2011 for India and Sri Lanka and from 1972 to 2011 for Pakistan and Bangladesh. The data for the period 2012 to 2014 for all four countries have been extrapolated assuming exponential smoothing. We have used mean years of schooling (MYS) to proxy for human capital stock; MYS is the number of years of schooling received per person aged 15 and above. Barro and Lee data sets have been used, which provide five-yearly data on MYS; we have interpolated for the interim years and extrapolated for the period 2011 to 2014, assuming exponential smoothing.
We use Jaggers and Marshall’s (2000) Polity IV Project, which provides the longest time-series data on measures of institutions. The Polity IV data set can be considered more reliable as it is not based on surveys such as the rule of law and other alternative indicators of institutional development from the International Country Risk Guide (ICRG) and used by Acemoglu et al. (2001) and an aggregate survey-based index of government effectiveness collected by Kaufmann et al. (2003). The Polity IV data set is supposed to represent political constraints rather than institutional development. The Polity score is calculated by subtracting the AUTOC score from the DEMOC score, and the resulting unified polity scale ranges from –10 (strongly autocratic or hereditary monarchy) to +10 (strongly democratic). The data have been re-scaled (11+ POLITY score) so that all scores are positive, from 1 (strongly autocratic) to 21 (strongly democratic). The components of this index cover political participation and qualities of executive recruitment which are important for promotion of democracy and hence economic growth. Democracy is conceived as composed of three essential, interdependent elements. First is the presence of institutions and procedures through which citizens can effectively express their preferences. Second is the existence of institutionalized constraints on the exercise of powers by executives. Third is the guarantee of civil liberties to all citizens in their daily lives and in acts of political participation. The Democracy indicator is an additive 11-point scale (0–10). The Polity IV Project defines Autocracy in terms of the presence of a distinctive set of political characteristics that sharply suppress or restrict political participation, and measures it on an additive 11-point scale (0–10). The variable on constraints on the executives refers to the extent of institutionalized constraints in the decision-making power of chief executives, whether as individuals or a collective. This is similar to the ‘horizontal accountability’ found in the democracy literature but it assumes that dictators may also be bound by certain institutional constraints. The degree of checks and balances between the various parts of the government is coded on a 7-point scale which ranges from ‘unlimited executive authority’ (1) to ‘executive parity or subordination’ (7).
In small or finite sample data sizes, the Autoregressive Distributive Lag (ARDL) process is relatively more efficient. The main advantage of the ARDL is that it can be applied whether the regressor is I(0), I(1) or mutually cointegrated (Pesaran et al., 2001). The procedure will, however, crash in the presence of I(2) series as the computed F-statistics provided by Pesaran and Shin (2001) will not be valid because the bounds test is based on the assumption that the variables are I(0) or I(1). Therefore, the implementation of unit root tests in the ARDL procedure might still be necessary in order to ensure that none of the variables is integrated of order 2 or beyond. Other advantages include that the ARDL approach takes enough lags to capture the data-generating process in a general-to-specific modelling framework, and then a dynamic error correction model can be easily derived by this method. We apply the ARDL approach by modelling the long-run equation as a general vector autoregressive (VAR) model. The optimal lag length has been selected using the AIC criterion.
To check the robustness of the role of institution and also to study the impact of corruption on the four major economies of South Asia, we incorporate various other institutional measures provided by the Worldwide Governance indicators (Kaufmann et al., 2010) for the period 1996–2014. However, as the data on the governance indicators were bi-annual until 2002, we have interpolated for the interim years by assuming exponential smoothing. The Worldwide Governance indicators are aggregate indicators of six broad dimensions of governance, namely voice and accountability, political stability and absence of violence and terrorism, government effectiveness, regulatory quality, rule of law and control of corruption. The six aggregate indicators are based on 30 underlying data sources that report the perceptions of a large number of survey respondents and expert assessments worldwide. Voice and accountability reflects the extent to which a country’s citizens can participate in selecting their government, as well as freedom of expression, freedom of association and freedom of the media. Political stability and absence of violence and terrorism reflects the likelihood that the government will be destabilized or overthrown by unconstitutional or violent means, including politically motivated violence and terrorism. Government effectiveness reflects the quality of public services and civil services, and their degrees of independence from political pressures; it also reflects the quality of policy formulation and implementation and the credibility of the government’s commitment to such policies. Regulatory quality reflects the government’s ability to formulate and implement sound policies and regulations that permit private sector development. The rule of law reflects the extent to which agents have confidence in and abide by the rules of society, the likelihood of crime and violence and, in particular, the quality of contract enforcement, property rights, the police and the courts. The governance indicators take values from –2.5 (weak) to +2.5 (strong). The indicators have been transformed into values that range from 1 to 6. For the transformed governance indicators, low values indicate poor governance and high values indicate better governance. However, to transform the World Bank corruption indicator from an indicator of probity to an indicator of corruption, it was rescaled to increase with the level of corruption. The Transparency International Corruption Perception Index (CPI) defines corruption as the abuse of public office for private gains and is derived from various surveys that track the perceptions of both residents and expatriates.
However, as data for these institutional measures are available from 1996 to 2014, we undertake a panel data analysis for the countries. The various governance indicators are not production inputs, however they reflect those domestic and international factors that influence productivity but are not captured by physical or human capital. Thus, OPENNESS, and various governance indicators, are assumed to influence PCGDP via TFP. These are perception-based measures and are subjective in nature, but due to the availability of data on various institutional qualities we employ these measures.
Estimation
The South Asian countries happen to be developing countries, so we need to incorporate institutional factors to have a holistic study, because it is governance which plays a critical role in implementation of various schemes undertaken in these nations. Since the Polity IV Project provides the longest time-series data on measures of institutions, we incorporate the Polity score (POLITY) and the variable on constraints on the executives (XCONST) in addition to the standard explanatory variables. Table 1 in Appendix 2 gives the unit root test for all the variables for the countries. However, the time period varies across the countries. The time-series study of India and Sri Lanka covers the period 1960 to 2014; while taking into account the political background of Pakistan and Bangladesh, the period from 1972 to 2014 has been studied.
In the case of India and Bangladesh, we find the series for XCONST is I(0) at level while other variables are I(0) at their first differences. So, we resort to the ARDL method of estimation that can be applied whether the regressor is I(0), I(1) or mutually cointegrated (Pesaran et al., 2001).
With a five-year lagged value of XCONST for India, though none of the institutional measures are significant (Table 3 in Appendix 2), the magnitude of the coefficient of both forms of capital diminishes from the basic specification (reported in Table 2 in Appendix 2). Also no significant influence of liberalization is observed. However, the coefficient of OPENNESS turns significant. This attests to the view that the effectiveness of both capital and trade openness is very much responsive to the institutional quality of the country. In the short run, the error correction term is correctly signed and significant, and the negative and significant influence of political institution and executive constraints at various lags is observed. Table 4 in Appendix 2 reports the Error Correction Mechanism for each of the four countries. The descriptive statistics in Table 2 in Appendix 1 reveal that India scores 7 in almost all the period under study, which can be taken to imply that executive parity or subordination has prevailed in the country with associated red tapism. The speed of adjustment coefficient diminishes from the basic specification when we control for institutional quality. This justifies the lag associated with decision making and its impact in a democratic country with ‘executive parity or subordination’ (7).
With the third lag of executive constraints in the case of Sri Lanka, though no significant influence of institutional measures is obtained, the coefficient of physical capital turns significant. Also, though positive, no significant influence of liberalization is observed. The descriptive statistics in Table 2 in Appendix 1 reveal that executive parity or subordination has prevailed in the country with associated red tapism. Though no significant long-run influence of institutional measures is observed, in the short run change in political institution has significant positive influence while change in executive constraints significantly reduces GDP growth. Also, when we control for institutional quality, the speed of adjustment coefficient diminishes from the basic specification (reported in Table 2 in Appendix 2).
Institutional quality in Pakistan shows wide variation. Pakistan is not an electoral democracy. A civilian government and President were elected in 2008, ending years of military rule, but the military continues to exercise de facto control over much government policy. However, due to the long regime of military rule, the variable XCONST takes values close to 1, implying ‘unlimited executive authority’ of the decision-making power of chief executives in the country. This evades the slowness of bureaucracy and associated red-tapism. ECM is correctly signed and significant, implying convergence to long-run equilibrium when we control for institutional quality in Pakistan. The POLITY score shows positive influence in the short run. But the long-run impact is negatively significant. So, when we control for the institutional quality of the country with current year values of both measures, we see that though the coefficients of the two forms of capital retain their sign and significance, the magnitude of the positive influence of both forms of capital drops from the basic specification (Table 2 in Appendix 2). Additionally, the coefficient of Dopen turns negative and significant. This may be explained by the political uncertainty observed in the country. The influence of political instability observed in Pakistan is found to reduce PCGDP by 7%. The political instability of the country needs immediate attention if high growth rates are to be sustained in future.
The political institutional quality in Bangladesh shows maximum variation during the period of study, with near absolute autocracy observed in the years 1974–1990 and again in 2007 and 2008. The descriptive statistics for the institutional measures of Bangladesh are reported in Table 2 in Appendix 1. So, when we control for current year values of both the measures of institutional quality for Bangladesh, the F-statistic shows that a long-run relationship exists and the coefficients of physical capital and OPENNESS retain their sign and significance in the long run. However, the influence of human capital turns negative though insignificant, possibly due to the abysmal education statistics of the country. The influence of political institution is negative but insignificant, while XCONST reflecting the decision-making power of the executives is positive but insignificant in the long run. While in the short run the coefficient of two-year lagged values of change in POLITY give negative and significant influence on growth of PCGDP, the two-year lagged values of change in XCONST give positive and significant influence on growth of PCGDP of Bangladesh. The political turmoil observed in Bangladesh needs attention. Moreover, the ECM is correctly signed and significant, implying convergence to long-run equilibrium. However, it must be noted that the intercept term is significant, implying that there are other factors which are not captured in the model. Devarajan (2005) has given an explanation that goes beyond conventional macroeconomics. In Bangladesh, basic services such as education and healthcare have been delivered by the non-state sector NGOs and the private sector. These providers have been financed by the government or by donors, but they are not government officials. Essentially, there is a parallel economy of service delivery. The world famous micro-credit industry in Bangladesh has operated mostly outside the public sector.
Thus, political institution is found to have a negative significant influence in the long run only in the case of Pakistan, while for other countries the impact is insignificant. The influence of executive constraints is positive and significant for Pakistan, and insignificant for others. Even if we consider the lagged values of political institution, the coefficient does not show significance in the case of India or Sri Lanka. Since the VAR approach controls for endogeneity, we can confirm that human capital plays a positive and significant role in economic growth of India, Pakistan and Sri Lanka. As human capital retains its positive and significant influence in the case of India, Pakistan and Sri Lanka, this possibly explains the coexistence of high growth despite the weak institutions of the countries. Moreover, the coefficients of both forms of capital and institutional measure add up to greater than unity for India, Pakistan and Sri Lanka, confirming the existence of increasing returns. But it must be noted that when we control for institutional quality, the speed of adjustment (reported in Table 4 of Appendix 2) diminishes from the basic specification (reported in Table 2 of Appendix 2) for every country. So, the institutional aspect of the countries in South Asia needs attention to sustain growth in future.
It must be noted that there are various other aspects of institutional quality. But as data for various governance indicators (Kaufmann et al., 2010) are available for only a very short period, from 1996 to 2014, no time-series study is possible for such short span. So, we resort to panel data analysis for the four major South Asian economies for the period 1996–2014.
Estimation of standard explanatory variables along with institutional measures using static panel data model
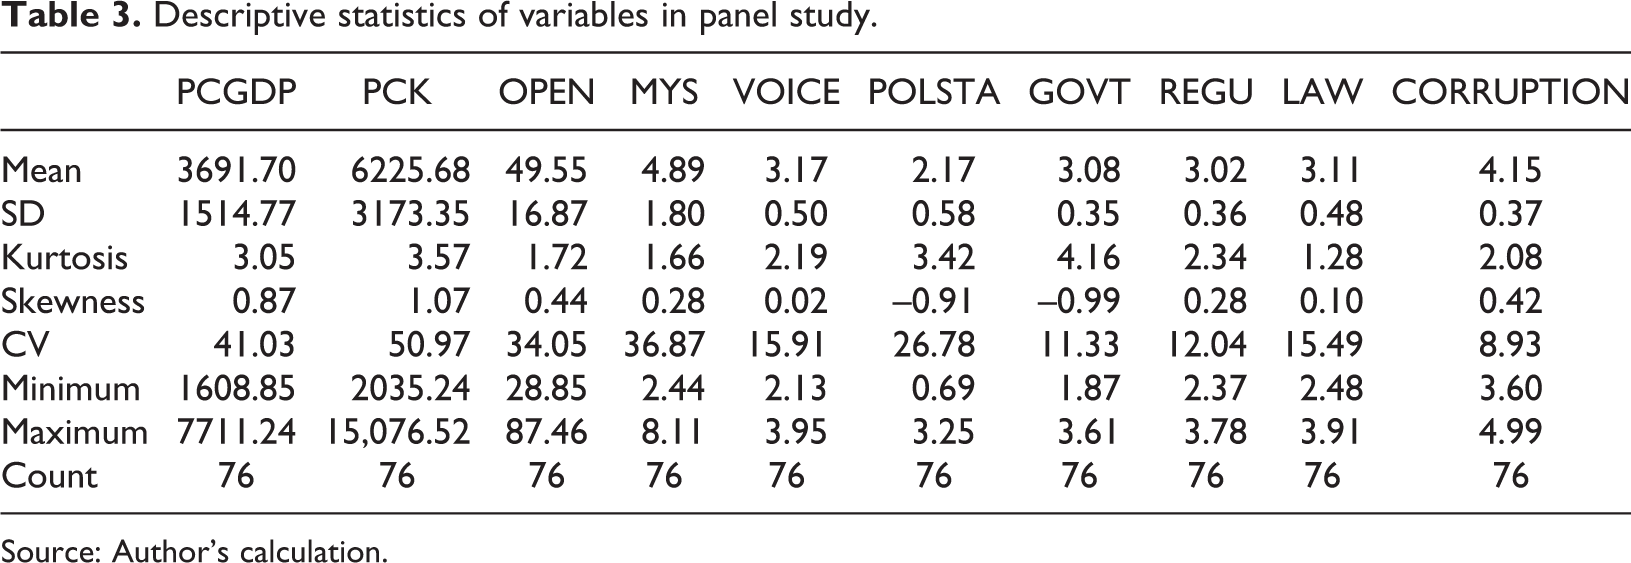
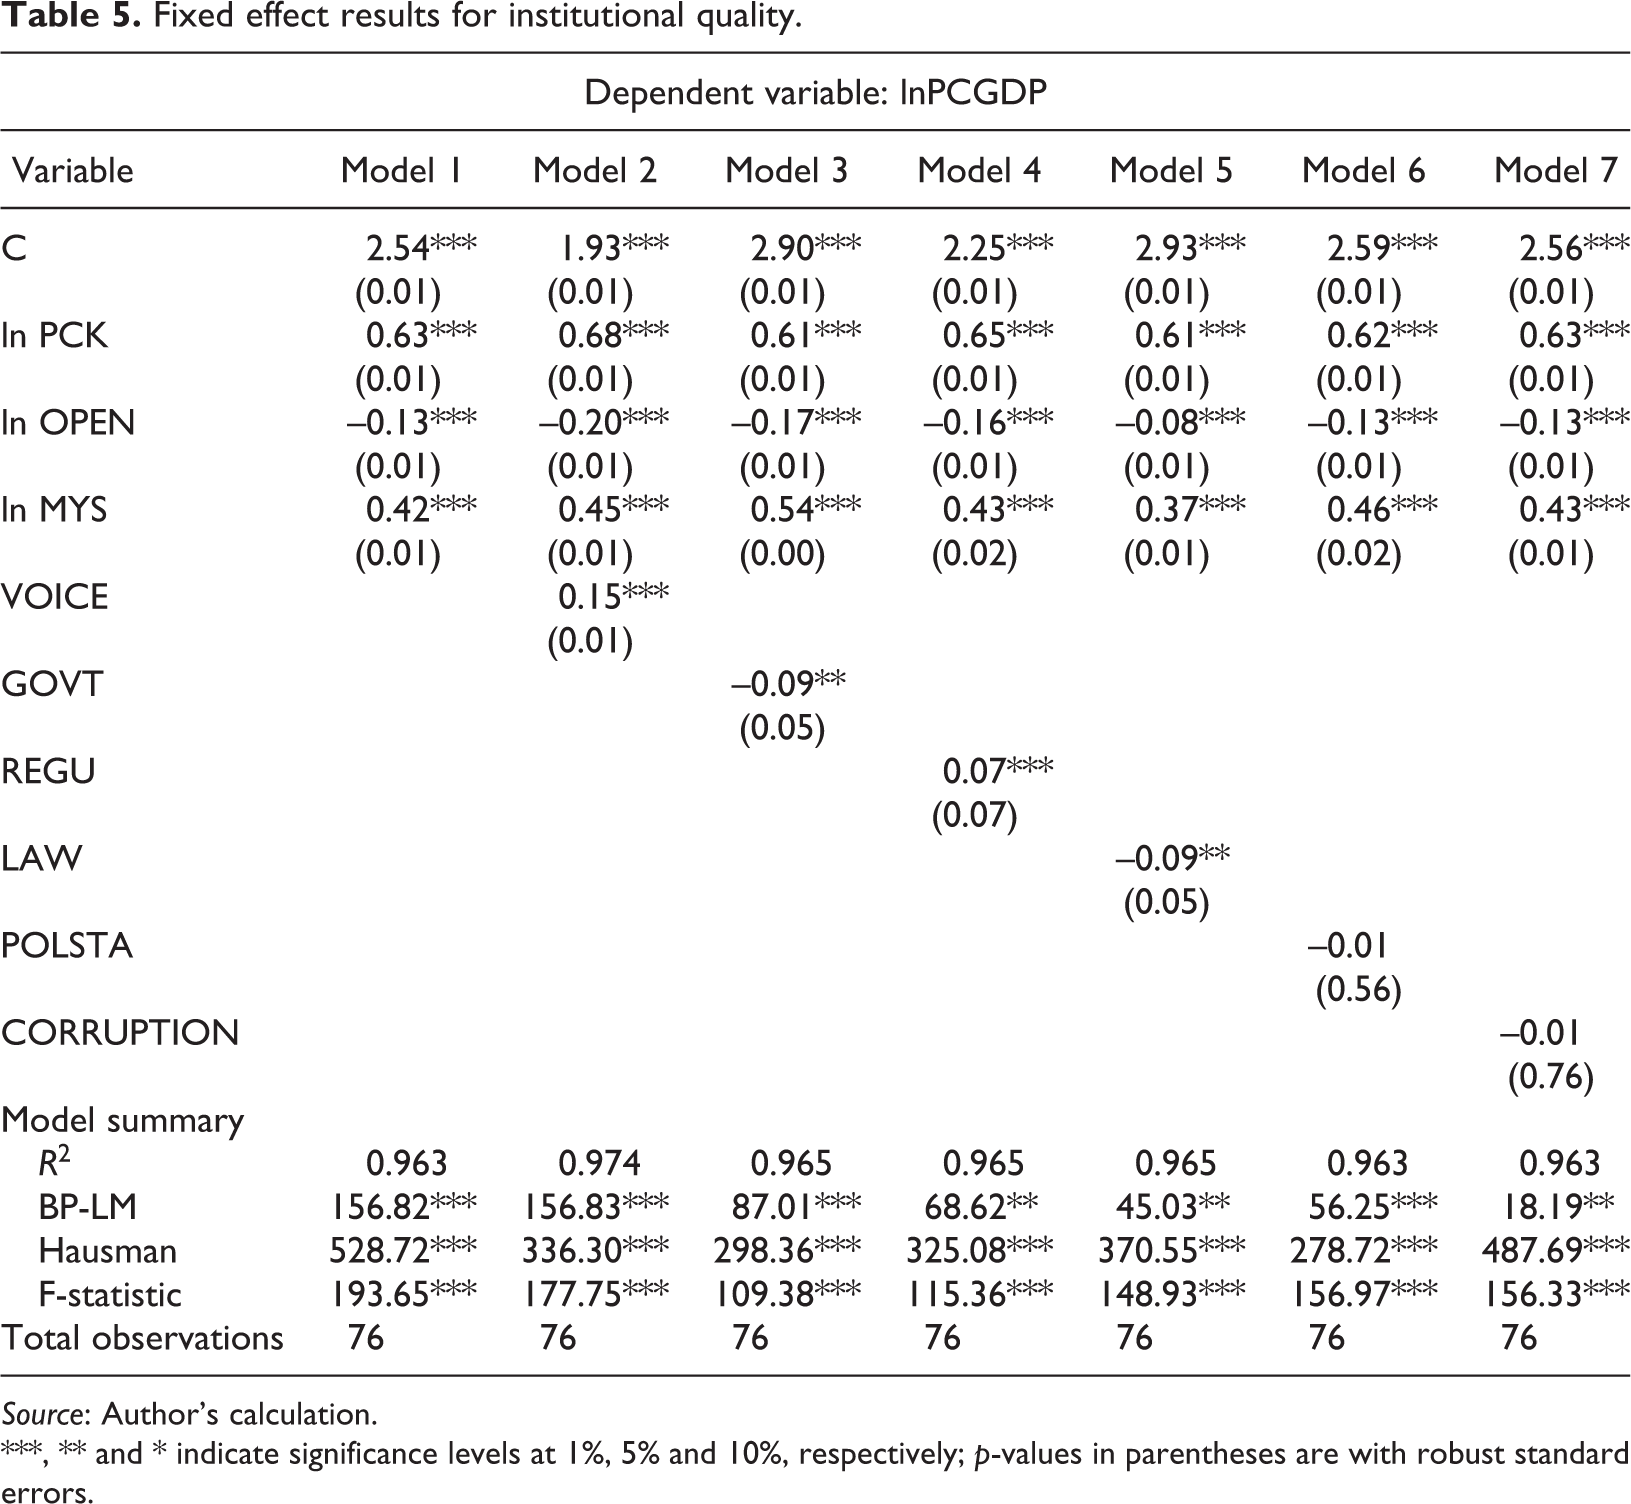
Table 3 (Appendix 1) gives the descriptive statistics of the variables under study. Based on the Hausman test statistic, we find the Fixed Effect model to be the most appropriate. If we allow for country-specific effects, the influence of both forms of capital is positive and significant, while the influence of OPENNESS is negative and significant in all specifications in Table 5 (Appendix 2). South Asia has witnessed a service-sector-led growth. Among many other factors, an English-speaking workforce, strong traditions of higher education, a computer-savvy skilled population and a modern telecommunications infrastructure have provided a strong basis for services exports from the region. However, in the Human Capital Report 2015 (World Economic Forum, 2015), Sri Lanka ranks 60th, Bangladesh ranks 99th, India ranks 100th, while Pakistan occupies the 113th place among the 124 countries ranked by the human capital index. So, the region needs to invest more in human capital formation to sustain future growth.
The influence of voice and accountability and regulation is positive and significant, while the institutional measures of government effectiveness and rule of law impart negative significant influence on the PCGDP of the countries. Both corruption and political stability have a negative but insignificant influence on the PCGDP of the four major South Asian economies. However, as noted in earlier works (Meon and Sekkat, 2005; Meon and Weill, 2010), the impact of corruption depends on the quality of institutions. Bhattacharjee and Haldar (2015b) have shown that, when interacted with the various institutional measures, corruption imparts a negative significant influence on the PCGDP of South Asia. Political stability in the region displays a maximum coefficient of variation, with maximum political instability observed in Pakistan during the period. However, the political stability observed in India and Sri Lanka during the period of study, with less volatility observed in Bangladesh, might have rendered a negative but insignificant influence in South Asia.
Concluding observations and policy implications
The influence of physical capital is positive and significant for all the countries in the time-series study. Human capital also has a significant positive influence in the case of all countries except Bangladesh. The influence of openness is positive and significant for Pakistan, Sri Lanka and India (though at the 10% level of significance). For Bangladesh, a negative significant influence is observed. The time-series study incorporating the institutional quality of the individual countries shows that political institution has a significant negative influence on the PCGDP of Pakistan only. No significant influence of political institution is observed in the case of the other three countries. However, in the case of Bangladesh encountering a similar situation, no significant influence is observed, possibly because the country had found ways of circumventing the government. The influence of executive constraints is positive and significant for Pakistan, and insignificant for the others. However, it must be noted that when we control for institutional quality, the speed of adjustment diminishes for each country.
When we conduct a panel study incorporating various other measures of institution, we find voice and accountability and regulatory quality to impart positive significant influence while government effectiveness and rule of law have negative significant influence. The impact of political stability and corruption is negative though insignificant. So, the institutional aspect of the countries in South Asia needs attention to sustain growth in future. The influence of both forms of capital is positive and significant. However, the influence of openness is negative and significant in all specifications during the period 1996–2014.
The study thus prescribes for higher investment in human capital and physical capital. But for the four major South Asian countries education expenditure is hovering around only 3% of GDP. Across the region, the main focus of policy reform should be to provide a prudent macroeconomic framework, by reforming the institutional framework and supporting integration within the global economy. The quality of human development and the investment climate need to be substantially improved, which will require deepening reforms and addressing the many governance and institutional challenges. Institutional reform deserves immediate attention if conventional policy prescriptions of fiscal adjustments and the like are to reap adequate results in the region, so that growth will not be penalized in future. While the institutional supremacy view tends to discard policies in favour of institutions, our empirical analysis reveals that both physical capital and human capital are more robust determinants for economic growth in South Asia. Institutional quality has not significantly influenced the economic growth of the countries, except for Pakistan, but the future may not be as rosy, as the speed of adjustment diminishes for every country when we control for institutional quality. However, government effectiveness and rule of law tend to retard the PCGDP of the countries. In conclusion, improvement in institutional quality deserves attention if the high growth rates are to be sustained in the future.
Footnotes
Declaration of Conflicting Interests
The author(s) declared no potential conflicts of interest with respect to the research, authorship, and/or publication of this article.
Funding
The author(s) received no financial support for the research, authorship, and/or publication of this article.
Note
Appendix 1
Descriptive statistics of variables in panel study.
| PCGDP | PCK | OPEN | MYS | VOICE | POLSTA | GOVT | REGU | LAW | CORRUPTION | |
|---|---|---|---|---|---|---|---|---|---|---|
| Mean | 3691.70 | 6225.68 | 49.55 | 4.89 | 3.17 | 2.17 | 3.08 | 3.02 | 3.11 | 4.15 |
| SD | 1514.77 | 3173.35 | 16.87 | 1.80 | 0.50 | 0.58 | 0.35 | 0.36 | 0.48 | 0.37 |
| Kurtosis | 3.05 | 3.57 | 1.72 | 1.66 | 2.19 | 3.42 | 4.16 | 2.34 | 1.28 | 2.08 |
| Skewness | 0.87 | 1.07 | 0.44 | 0.28 | 0.02 | –0.91 | –0.99 | 0.28 | 0.10 | 0.42 |
| CV | 41.03 | 50.97 | 34.05 | 36.87 | 15.91 | 26.78 | 11.33 | 12.04 | 15.49 | 8.93 |
| Minimum | 1608.85 | 2035.24 | 28.85 | 2.44 | 2.13 | 0.69 | 1.87 | 2.37 | 2.48 | 3.60 |
| Maximum | 7711.24 | 15,076.52 | 87.46 | 8.11 | 3.95 | 3.25 | 3.61 | 3.78 | 3.91 | 4.99 |
| Count | 76 | 76 | 76 | 76 | 76 | 76 | 76 | 76 | 76 | 76 |
Source: Author’s calculation.
Appendix 2
Fixed effect results for institutional quality.
| Dependent variable: lnPCGDP | |||||||
|---|---|---|---|---|---|---|---|
| Variable | Model 1 | Model 2 | Model 3 | Model 4 | Model 5 | Model 6 | Model 7 |
| C | 2.54*** (0.01) | 1.93*** (0.01) | 2.90*** (0.01) | 2.25*** (0.01) | 2.93*** (0.01) | 2.59*** (0.01) | 2.56*** (0.01) |
| ln PCK | 0.63*** (0.01) | 0.68*** (0.01) | 0.61*** (0.01) | 0.65*** (0.01) | 0.61*** (0.01) | 0.62*** (0.01) | 0.63*** (0.01) |
| ln OPEN | –0.13*** (0.01) | –0.20*** (0.01) | –0.17*** (0.01) | –0.16*** (0.01) | –0.08*** (0.01) | –0.13*** (0.01) | –0.13*** (0.01) |
| ln MYS | 0.42*** (0.01) | 0.45*** (0.01) | 0.54*** (0.00) | 0.43*** (0.02) | 0.37*** (0.01) | 0.46*** (0.02) | 0.43*** (0.01) |
| VOICE | 0.15*** (0.01) | ||||||
| GOVT | –0.09** (0.05) | ||||||
| REGU | 0.07*** (0.07) | ||||||
| LAW | –0.09** (0.05) | ||||||
| POLSTA | –0.01 (0.56) | ||||||
| CORRUPTION | –0.01 (0.76) | ||||||
| Model summary | |||||||
| R2 | 0.963 | 0.974 | 0.965 | 0.965 | 0.965 | 0.963 | 0.963 |
| BP-LM | 156.82*** | 156.83*** | 87.01*** | 68.62** | 45.03** | 56.25*** | 18.19** |
| Hausman | 528.72*** | 336.30*** | 298.36*** | 325.08*** | 370.55*** | 278.72*** | 487.69*** |
| F-statistic | 193.65*** | 177.75*** | 109.38*** | 115.36*** | 148.93*** | 156.97*** | 156.33*** |
| Total observations | 76 | 76 | 76 | 76 | 76 | 76 | 76 |
Source: Author’s calculation.
***, ** and * indicate significance levels at 1%, 5% and 10%, respectively; p-values in parentheses are with robust standard errors.