
Abstract
This study aims to determine the characteristics of party systems within the context of electoral systems, forms of government, and continents. There is no study in the literature that quantitatively reveals the relationship between the party system and forms of government. Furthermore, this study differs from other studies in that it deals with the relationship between the electoral system and the party system on a global scale. In the study, the effective number of parties (ENEP and ENPP) was calculated for the last three legislative elections of the countries governed by presidential, president–parliamentary, premier–presidential and parliamentary forms of government, using the Laakso–Taagepera Index. The dataset was then analyzed with ANOVA and post-hoc tests. The study revealed that party systems do not differ significantly from forms of government, that is, forms of government do not determine party systems. Similarly, party systems do not significantly differ in terms of the continents, that is, there are no continental party system characteristics of the forms of government. Also, the study confirmed that it is the electoral system that determines the party systems.
Keywords
Introduction
The first major theoretical work on the classification of party systems is generally attributed to Duverger (1964), who divided parties into single-party, two-party, and multi-party categories, taking into account the rate of votes. Following Duverger, a number of authors, such as Blondel (1968; Dahl, 1966: 332; Golosov, 2010b; Sartori, 1976; Siaroff, 2000; Ware, 1996), developed categories based on the number of parties. Rokkan (1970) shifted the basis of the party system from the percentage of votes to the number of seats. This means that the electoral system becomes very important in the emergence of the party system.
The argument that plurality electoral systems generate two-party systems and proportional electoral systems multi-party systems is old (e.g. Riker, 1986: 22–23). Duverger (1964: 206–255) provided two explanations for why two-party systems should emerge in units with plurality elections. The mechanical effect refers to the rules that apply when shares of votes are transferred to shares of seats. In a plurality system, only the candidate receiving the largest share of the votes receives a seat in parliament, which means that smaller parties have no real chance of gaining representation. The psychological effect, again, refers to the fact that as voters are aware of how the electoral system operates, they refrain from voting for candidates for smaller parties and instead concentrate their votes on the two largest parties.
The relationship between electoral system characteristics and party system fragmentation has been assessed in numerous studies (e.g. Anckar, 2002; Croissant and Völkel, 2012; Ferland, 2014; Laakso and Taagepera, 1981). Space does not allow a thorough exposition of findings from these studies; suffice it here to say that in general, the claim that plurality electoral systems have fewer parties than proportional systems wins support. However, this is far from a rule without exceptions, as demonstrated notably by countries like India, Canada, and, nowadays, Britain.
The researchers examining the party system with regard to the effective number of parties (ENP) have provided clearer data in order to understand the party systems and party system changes of the countries. To reach this aim, Kesselman (1966), Rae and Taylor (1970), Wildgen (1971), Laakso and Taagepera (1979), Molinar (1991), Dunleavy and Boucek (2003), and Golosov (2010a) formulated ENP as a party system fragmentation index. The Laakso–Taagapera Index (L-T Index) has become the most widely used index over time. This study is based on this index that counts the political parties in a country according to their relative strength instead of their actual numbers.
The use of the L-T Index in the literature show a great variety when used to determine the party system competitiveness (Brambor et al., 2007; Chhibber and Nooruddin, 2004; Kuenzi and Lambright, 2005; Laakso and Taagepera, 1979; Lijphart, 1994; Mozaffar and Scarrit, 2005; Neto and Cox, 1997; Paskhina and Telin, 2017; Schleiter and Voznoya, 2014; Taagepera and Shugart, 1989) comparison of party systems (Lijphart et al., 1999). The index has also been employed in the following contexts: changes in a party system (Quinn, 2013); the effects of electoral misconduct on a party system (Donno and Roussias, 2012); the relationship between a party system and an electoral system (Croissant and Völkel, 2012; Ferland, 2014; Laakso and Taagepera, 1981); the relationship between ENP in the previous election and the subsequent emergence of new parties (Kselman et al., 2016); coalitions in elections (Cox and Schoppa, 2002); presidential elections (ENPRES) (Hicken and Stoll, 2017; Ordeshook and Shvetsova, 1994); and the effect of presidential elections on legislative elections, and thus on the electoral system in certain countries (Ferrara, 2011). As in this study, L-T Index has regularly been employed for conducting comparative analyses of party systems. As we can see from the above, this index has come to the fore as a measure that is used across a wide array of situations.
ENP and also L-T Index have been criticized in several ways. Sartori (1994: 35) criticizes Taagepera and Shugart's ENP measure for ignoring the impact of small parties on the formation of governments; for him, some small parties such as the Free Democrats in Germany may be “politically pivotal”, meaning that some small parties may have power beyond their votes and seats. Golosov (2010a) states that the L-T Index yields unrealistic results, in particular, when the largest parties exceed 50%. For Blau (2008: 170), this potentially results in an underestimation concerning the degree of variability in party systems. Taagepera (1999) accepts this insufficiency and suggests a supplementary index, especially in those cases where a party exceeds 50% and therefore dominates a large number of smaller parties. As squaring each vote or share of seat results in small parties being ineffective compared with larger parties, the index is naturally more sensitive to larger parties. A number of authors (Dunleavy and Boucek, 2003; Golosov, 2010a; Kline, 2009; Molinar, 1991; Taagepera, 1999) tried to modify ENP formula or proposed new measures in time and ENP has more or less become a standard measure of party system fragmentation in the literature.
This study aims to examine the characteristics of party systems within the context of electoral systems, forms of government and continents. The party system was accepted as the dependent variable and the others as independent variables. Although a considerable number of studies have been conducted on the formation of party systems (e.g. Golosov, 2010b; Sartori, 1976; Siaroff, 2000) and the classification of the forms of government (e.g. Elgie, 1998; Metin and Ünal, 2022; Shugart and Carey, 1992; Verney, 1959), the relationship between these two variables has not yet been studied. There are no studies that calculate party systems via ENP and analyse their relationship with the electoral system and its continental distribution on a global scale. Accordingly, this study aims to fill these gaps in the literature.
Null and research hypotheses
The effective number of electoral parties (ENEP) is determined according to the vote shares of the parties competing in an election, and the effective number of parliamentary parties (ENPP) is determined according to the legislative seats that the parties win. The number of parties represented in the parliament cannot naturally be more than the number of parties competing the elections, and the electoral systems fail to provide absolute fair representation for all parties. For all these reasons, our first null (zero-test) and research (alternative) hypotheses are as follows:
There is no significant difference between ENPP and ENEP.
There is significant difference between ENPP and ENEP.
The study also examines the relationship between party system and form of government. The seminal study on this subject in the literature is the one by Shugart and Carey (1992: 206–258). They claim that party system fragmentation should be lower in presidential systems than in parliamentary ones. The authors use Laakso and Taagepera's (1979) “effective number of parties” as an indicator of party system fragmentation and find that party system fragmentation is low particularly in presidential systems with concurrent presidential and parliamentary elections, where proportional elections are used in order to elect the parliament (Shugart and Carey, 1992: 220).
In this study, we acted on the most common forms of government in the world, namely presidential, president–parliamentary, premier–presidential and parliamentary. The first two forms of government are generally preferred to speed up the executive and decision-making process in decolonized countries. For these forms of government, the number of political posts was either reduced or their power was weakened. We expect lower ENP in these forms of government. For the parliamentary form, on the other hand, we expect a higher ENP because the parliament is more active; we also expect the number of parties to be high, as the parliamentary system broadly allows political representation of social cleavages. Among these forms, the president–parliamentary system is generally adapted by those countries in which authoritarian regimes or hegemonic parties are dominant. Of the 28 president–parliamentary countries present worldwide, 16 are located in Africa, seven in Asia, four in Europe and one in Americas. As is commonly known, election boycotts are frequently encountered in Africa. The authoritarian tendencies and the greater number of military coups in Africa are likely to reduce both ENP and ENEP–ENPP in president–parliamentary forms. We also predict ENPP to be lower in president–parliamentary and higher in parliamentary forms. Considering all these factors, our null and research hypotheses as follows:
There is no significant difference among the four different forms of government in terms of ENP.
There is a significant difference among the four different forms of government in terms of ENP.
As noted above, any study on the requisites of party system fragmentation must also take into account electoral system characteristics. Although both majoritarian and proportional systems can be split up into many subcategories, too fine-graded categorizations should be avoided owing to the limited number of cases in many of these categories. We have therefore opted to make use of three electoral system categories: majoritarian systems, proportional systems, and mixed systems.
There is no significant difference among the three different electoral systems in terms of ENP.
There is significant difference among the three different electoral systems in terms of ENP.
Another intriguing question is whether there is a continental party characteristic of the forms of government. Countries on one continent tend to be more similar to one another economically, sociologically, and historically than they are to countries on other continents. These commonalities—such as parliamentary monarchies in Europe, Cold War-Era military coups in Latin America, similar periods and coups in Africa in the post-colonial period, similar political systems in those countries that gained their independence from the USSR—cause political cultures to resemble one another. We have stated that we expect lower ENP for the presidential and president–parliamentary forms. Considering the fact that 17 out 45 countries in Africa are presidential, 16 are president–parliamentary, seven are premier–presidential, and five are parliamentary and also considering the weakness of electoral democracy in Africa, and the multitude of political systems in which the president is more active, we expect the lowest ENPP to be in this continent. As for Europe, the continent hosts 18 parliamentary, 18 premier–presidential, four president–parliamentary, and two presidential countries. Considering the existence of a large number of parliamentary and premier–presidential forms in which parliaments are more active, we expect the highest ENP in Europe. We hypothesize that party systems do not have continental characteristics, since electoral systems also affect the party system in the Americas, Africa and Europe, where partial forms of government characteristics are observed.
There is no significant difference among the five different continents in terms of ENP.
There is significant difference among the five different continents in terms of ENP.
Methods
Data collection method
We examined 159 countries, including 43 presidential, 21 president–parliamentary, 38 premier–presidential, and 57 parliamentary forms (Metin and Ünal, 2022). Following Shugart and Carey (1992), we divided semi-presidentialism into the categories of premier–presidential and president–parliamentary and accepted them as main forms.
As single election result cannot provide statistical reliability, we took the last three election results for each country into account. We calculated the effective number of parties for each election in two ways: ENEP (Eff Nv) and ENPP (Eff Ns). We employed the following formula from Laakso and Taagepera (1979), in the calculation:


By processing the data, we considered the following principles:
▪ The calculations were based on legislative elections. ▪ In the case of a bicameral parliament, only lower house results were taken into account. ▪ In the case of a two-round election, only the vote rates in the first round were taken into account. ▪ In those countries where the elections are held at the constituency and proportional level, only the latter was taken into account. ▪ In the case of electoral alliances, if the voting rate of individual parties is unclear, the total vote of the alliance was accepted as a single party. ▪ Against all, or NOTA (None of the Above) options in the ballot paper were also accepted as a single party. ▪ Vacant seats and those seats that do not correspond to a certain percentage of votes or that are specially reserved—such as for presidential appointees, and reserved seats for minorities, indigenous populations, ex-presidents and presidents’ running mates—were not included in the calculation. ▪ In those countries that changed their forms of government, the form at the time of the election was taken into account.
We had some difficulties in collecting the study data for several reasons. First, elections were not held regularly or were postponed or canceled, which prevented us from obtaining data for seats and votes, especially among countries in Africa and Asia. The missing data totals are as follows: 37 in Africa, three in the Americas, 14 in Asia, three in Europe, and nine in Oceania. Second, in Africa, opposition parties sometimes boycotted the elections, which results in a lack of data. Third, owing to electoral alliances, we could not detect individual party votes in certain elections. Finally, countries with high independent votes, such as Belarus, and those countries without political parties, such as Palau and Tuvalu, were not included in the calculations because this makes the party system impossible to identify.
Data analysis method
In the study, we employed one-way analysis of variance (ANOVA), one of the parametric hypothesis tests, in order to understand whether the party systems differ according to the forms of government in the relevant country. ANOVA is a statistical tool used to determine differences between experimental group means. It is used in research with more than two experimental groups for one dependent variable and one or more independent (categorical) variables, which is a continuous parametric numerical outcome measure. In ANOVA terminology, independent variables are called “factors” and groups within each factor are called “levels” (Sawyer, 2009). The following hypotheses are tested in the ANOVA analysis:
(null hypothesis): The means of all the groups are equal.
Not all the means are equal.
Does not say how or which ones differ.
Can follow up with “multiple comparisons”.
In the ANOVA analysis, a test statistic is calculated over the sample related to the hypothesis being tested. Then, this value is compared with the distribution of test statistics under the null hypothesis and converted into a p-value. This p-value is a measure of the probability that the test statistic value is under the null hypothesis.
p-Value ≤ α ⇒ Reject H0 at level α (α can be 1, 5 or 10%); p-Value > α ⇒ Do not reject H0 at level α.
The first step of the ANOVA analysis is to give descriptive statistics. In the second stage of the ANOVA test, the homogeneity test of the intergroup variance is performed. The homogeneity condition of the variances of the observed values in the ANOVA analysis must be met. Failure to meet this requirement will result in incorrect results and interpretations.
As a result of the test, it is decided which of the intergroup difference tests will be performed, depending on whether the significance value is greater than 0.05 or less. If this value is less than 0.05, ANOVA test results can be interpreted with appropriate post-hoc tests. As a result of the ANOVA analysis, post-hoc tests are carried out in order to determine where the significant differences between the group averages originate. These tests differ according to whether the variances between groups are homogeneous or not.
Statistical comparison of multiple algorithms on multiple datasets is performed with the Friedman (ANOVA) test (Demšar, 2008). When the Friedman test rejects the null hypothesis that there is no difference between algorithms, post-hoc analysis is performed to evaluate which differences are significant (Benavoli et al., 2016).
We also employed Tukey HSD and Games-Howell tests, two types of the post-hoc tests, to test the differences between the groups. Tukey HSD test is a test in which comparisons between variables are made after data is collected. Tukey test aims to test whether the relationship between two data sets is statistically significant. In other words, the Tukey test is a way of testing an experimental hypothesis (Nanda et al., 2021). As for the GamesHowell test, it is a non-parametric approach used to compare group combinations. It also gives the most reliable results when the variances are not homogeneous (Dunnet, 1980; Games and Howell, 1976; Keselman and Rogan, 1978; Osborne, 2008).
Findings
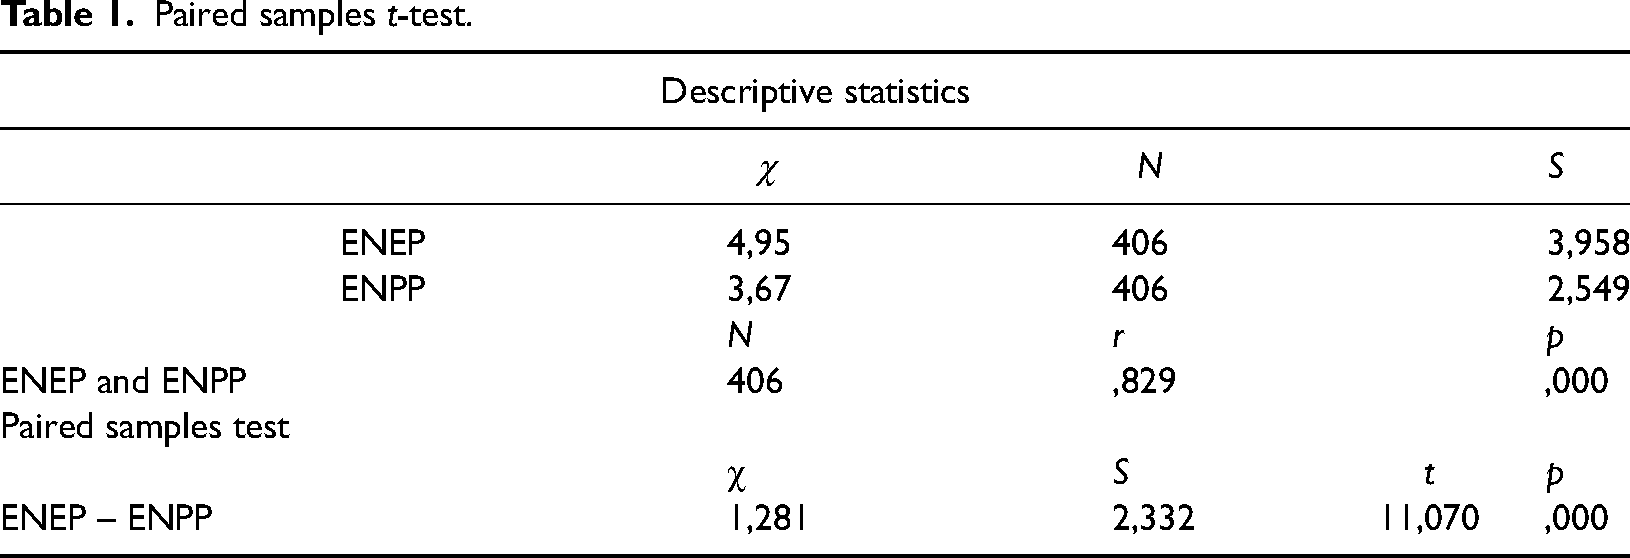
The results in Table 1 showed that H10 was rejected. That is, there is a significant difference between ENEP and ENPP, as expected. Considering the descriptive statistics in Table 1, ENPP with an average of 3.67 is lower than ENEP with an average of 4.95. The standard deviation (S) of ENPP is also lower than that of ENEP. A low SD indicates that the deviation from the mean is low, that is, the ENPP data are spread over a narrower range. The second part of Table 1 shows the correlation between ENEP and ENPP. The Pearson correlation coefficient is ,829. This indicates that the relationship between the two variables is significant, positive and high.
Paired samples t-test.
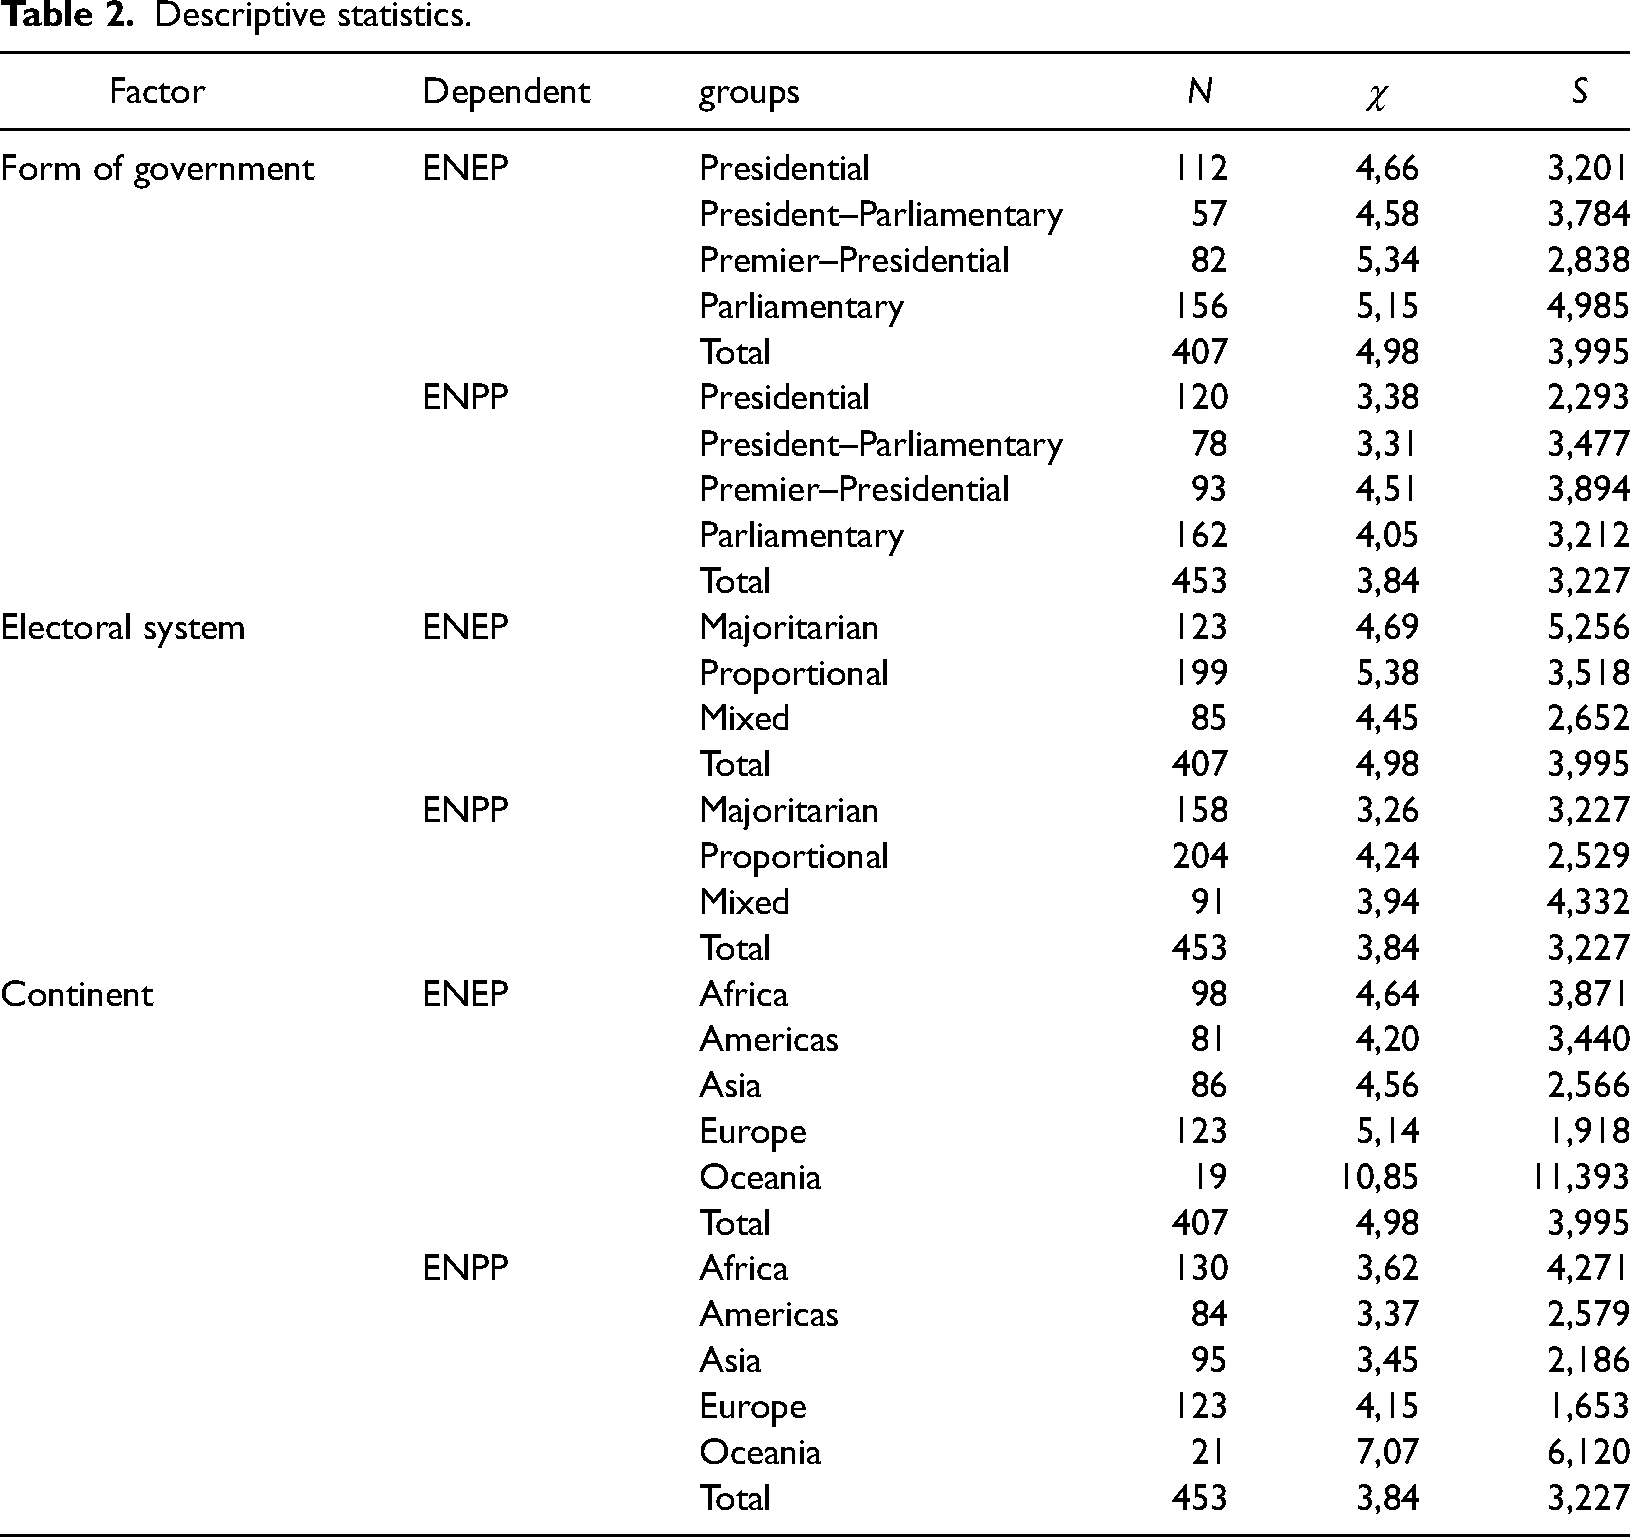
Afterwards, the results of the ANOVA test were interpreted in the study. Before the interpretation of the ANOVA test, descriptive statistics and homogeneity test results are included. Sample number (N) and mean and standard deviation of descriptive statistics are given in Table 2. A high standard deviation indicates that the deviation from the mean is high, so there are data that are considerably lower or higher than the sample mean in the dataset. The results of ANOVA analysis and post-hoc tests are interpreted according to the means.
Descriptive statistics.
In Table 3, the test results of homogeneity of variances are given. As a result of the tests performed, it was seen that the intergroup variance was homogeneous in the government and electoral systems (for this reason, the Tukey test was used as the multiple comparison test), while it was not homogeneous in the continental factor (for this reason, the Games–Howell test was used as the multiple comparison test).
Homogeneity of variances.
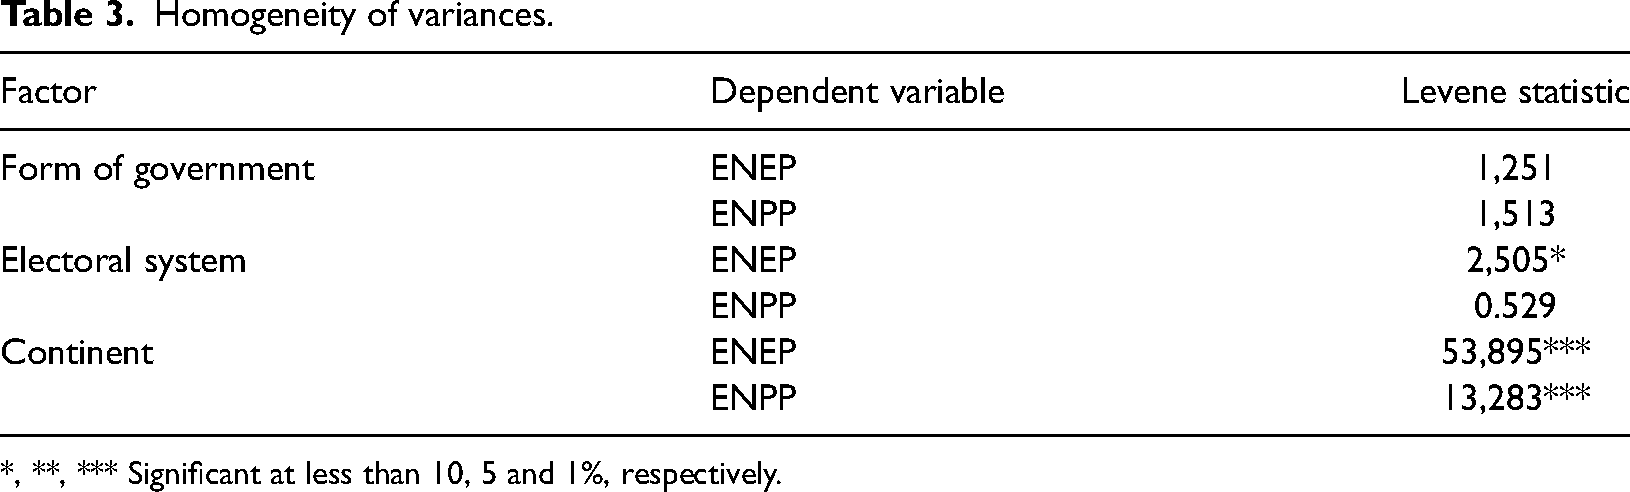
*, **, *** Significant at less than 10, 5 and 1%, respectively.
Tukey HSD and Games–Howell tests were carried out in order to determine which forms of government caused significant differences as a result of the ANOVA analysis. The reason for using the Tukey test is that the variances between groups are homogeneous and this test is more sensitive to alpha error (Abdi and Williams, 2010; Rusticus and Lovato, 2014). The Tukey test keeps the level of Type I error (i.e. finding a difference when it is absent) equal to the chosen alpha level (for example, α = 0.05 or α = 0.01). The Tukey test also allows the calculation of confidence intervals for differences between means (Abdi and Williams, 2010). As stated in the data analysis method part, the Games-Howell test, a nonparametric approach used to compare group combinations, gives the most reliable results when the variances are not homogeneous. Although its formulation is quite similar to the Tukey test, the Games–Howell test does not take into account homogeneity of variances and sample sizes. According to the results of the Tukey and Games–Howell tests in Table 4, forms of government with significant differences in terms of ENPP are between presidential and premier–presidential, and between president–parliamentary and premier–presidential; electoral systems with significant differences are majoritarian and proportional, and the continent significant difference is Oceania
ANOVA results.
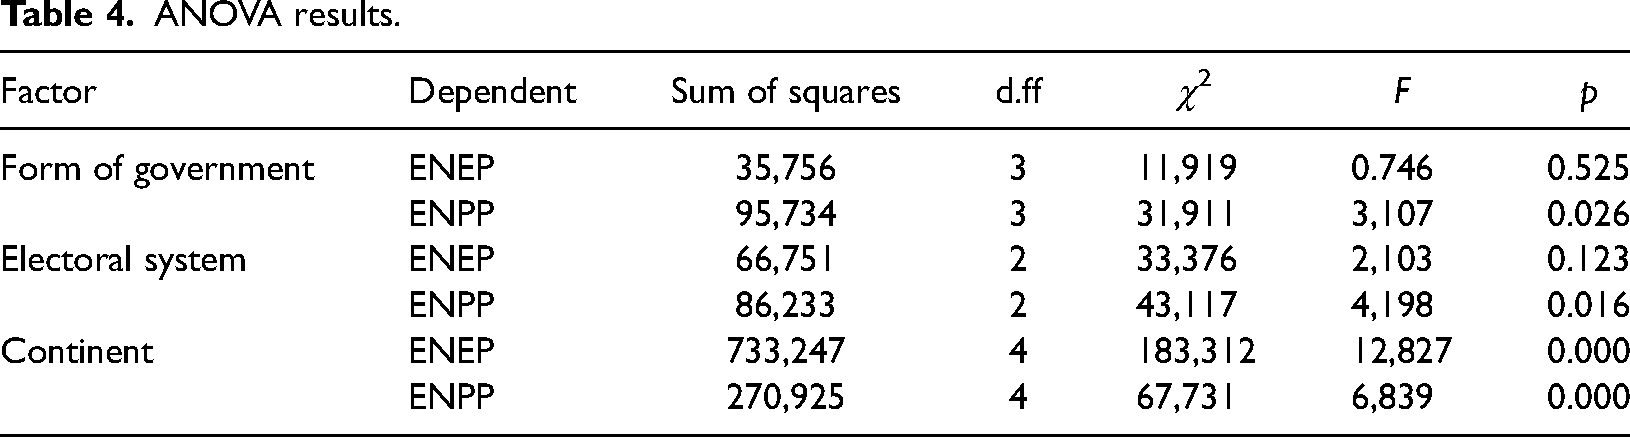
According to the results given in Table 3, ENPP differs statistically significantly according to the forms of government, electoral systems and continents. However, although ENEP does not differ significantly according to the forms of government and electoral systems, there is a significant difference between the averages according to the continents (F, 0.746; p, 0.525). So, the first H0 hypothesis of the study is rejected and the H1 alternative hypothesis is accepted.
Also in the study, a dependent (paired) samples t-test was used between ENEP and ENPP and significant results were obtained. This test compares the mean of two paired (or related) groups of cases studied at two different points in time, or the mean of a single group. If the same group is retested to the same extent, the t-test is called as a repeated measures t-test (Ross and Willson, 2017).
Evaluatian of findings
The aim of this study was to examine the characteristics of party systems according to the forms of government, electoral systems and continents. The first null hypothesis (H10) of this study, which examines the party system over the effective number of parties, was that there is no significant difference between ENPP and ENEP. This hypothesis has been rejected, so the differences between the variables has been detected, as expected. According to Table 1, the ENPP average is 3.67 and the ENEP average is 4.95. ENEP differs significantly from ENPP (significance, 000). These results on a global scale show that absolute fair representation is not aimed at in any form of government or electoral system, on any continent. On the other hand, the ENEP/ENPP ratio of 1.28 indicates that the reasonable balance between governmental stability and fair representation is maintained.
That the H20 null hypothesis regarding the relationship between the party system and the form of government has been rejected means that there is significant difference among the four different forms of government in terms of ENP for ENPP. This can be easily seen from the descriptive statistics data (see Table 1). Also, the post-hoc test showed that there was no significant difference between forms of government in terms of ENEP (see Table 5). This means that the party system is not determined by forms of government. In other words, it is not possible to find party system characteristics in forms of government. The following two conditions must be met for a characteristic to be determined: first, values of each form of government diverge significantly from one another; second, values of countries that adopt a particular form of government have little or no overlap with those that adopt another form of government. On the basis of these conditions, Table 2 shows that “countries with the same form of government do not have similar party systems”. For four forms of government, the mean of ENEP varies between 4.66 and 5.33, while the mean of ENPP varies between 3.31 and 4.50. The median ENEP for these four forms ranges between 3.20 and 4.43 for ENEP and between 2.25 and 3.58 for ENPP. Considering the closeness of the values, as well as the intertwining of the maximum and minimum values of each form of government, no characteristics could be determined.
Multiple comparisons (post-hoc tests).
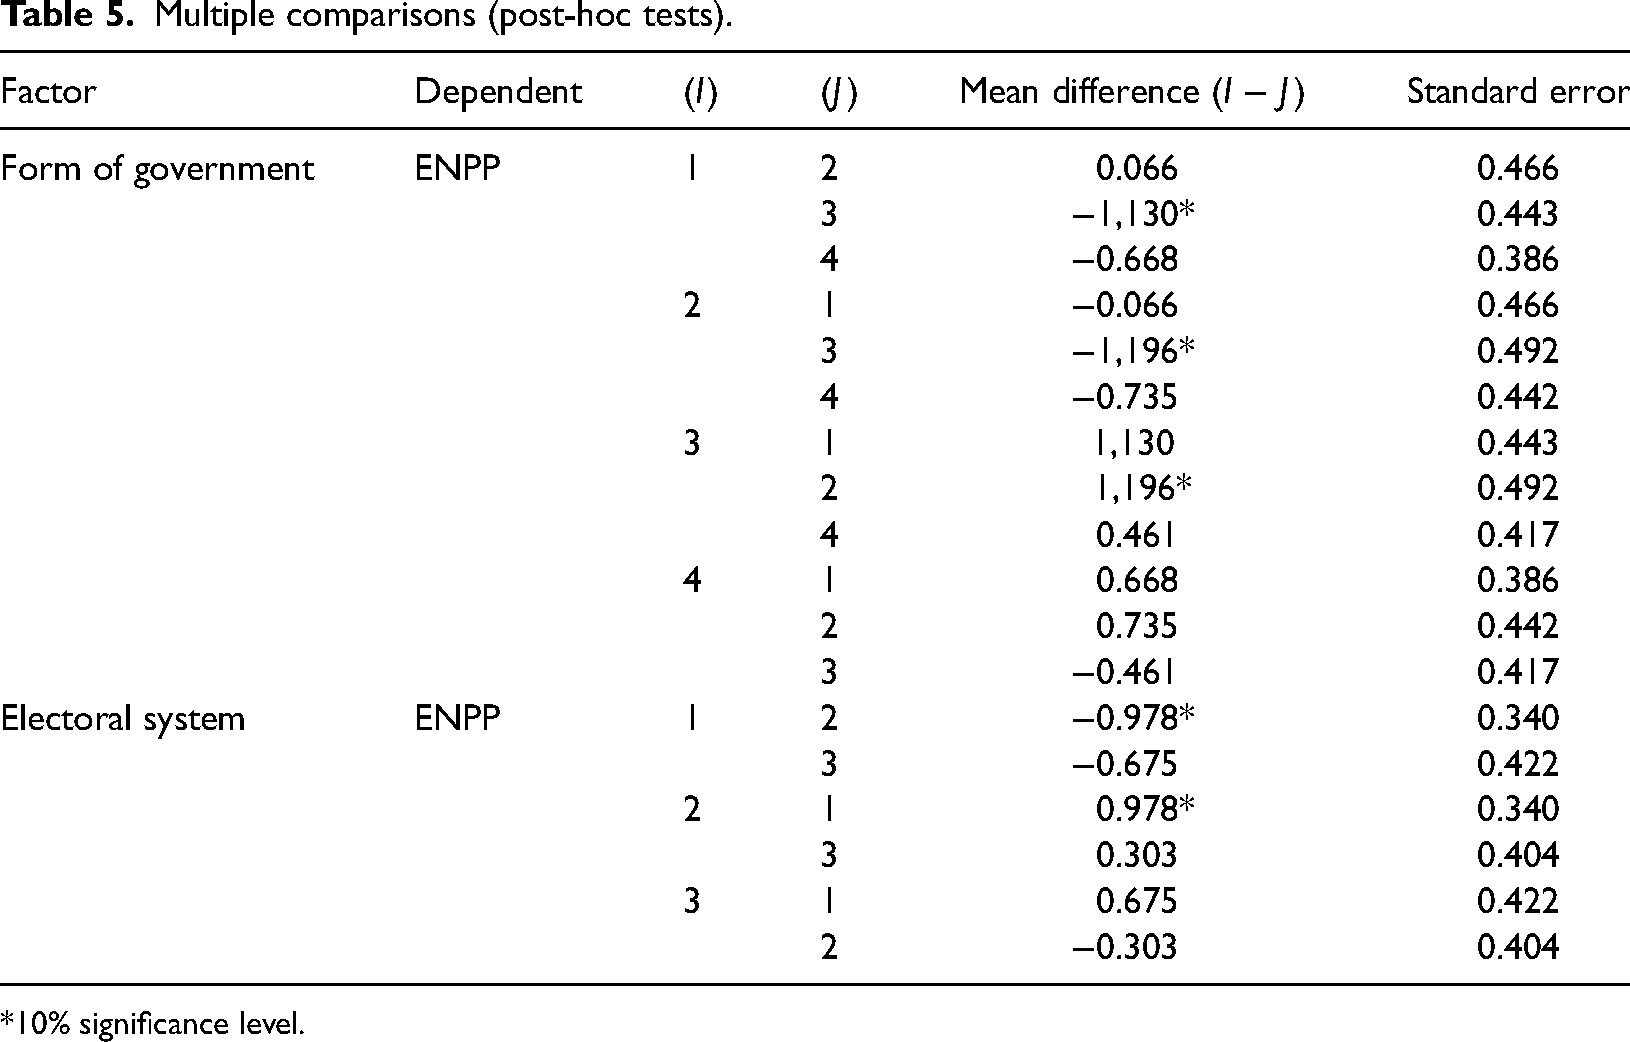
*10% significance level.
Despite the aforementioned analysis, the findings enable us to assess the relationship between the form of government and the party system, albeit partially. The mean ENEP and ENPP for the presidential and president–parliamentary forms are lower than for the premier–presidential and parliamentary forms. In other words, the mean is low in those forms in which the president is more active, and the mean is high in those forms in which the prime minister is more active. We had predicted the mean to be lower for the president–parliamentary form and highest for the parliamentary form. According to Table 2, the first part of our prediction came true. However, the highest mean appeared in the premier–presidential form, contrary to our expectations. We do not know whether the reason for this is electoral systems or social cleavages, but the results show that the form with the highest party fragmentation is the premier–presidential and, according to the post-hoc test, it differs significantly from the president–parliamentary and presidential forms in terms of ENPP.
While there is no significant difference among forms of government on the basis of ENEP, the significant results on the basis of ENPP suggest that the electoral systems may cause separation rather than the voting behavior of the voters. In this case we need to look at electoral systems implemented in forms of government (Table 6).
The relation between forms of government and electoral systems.
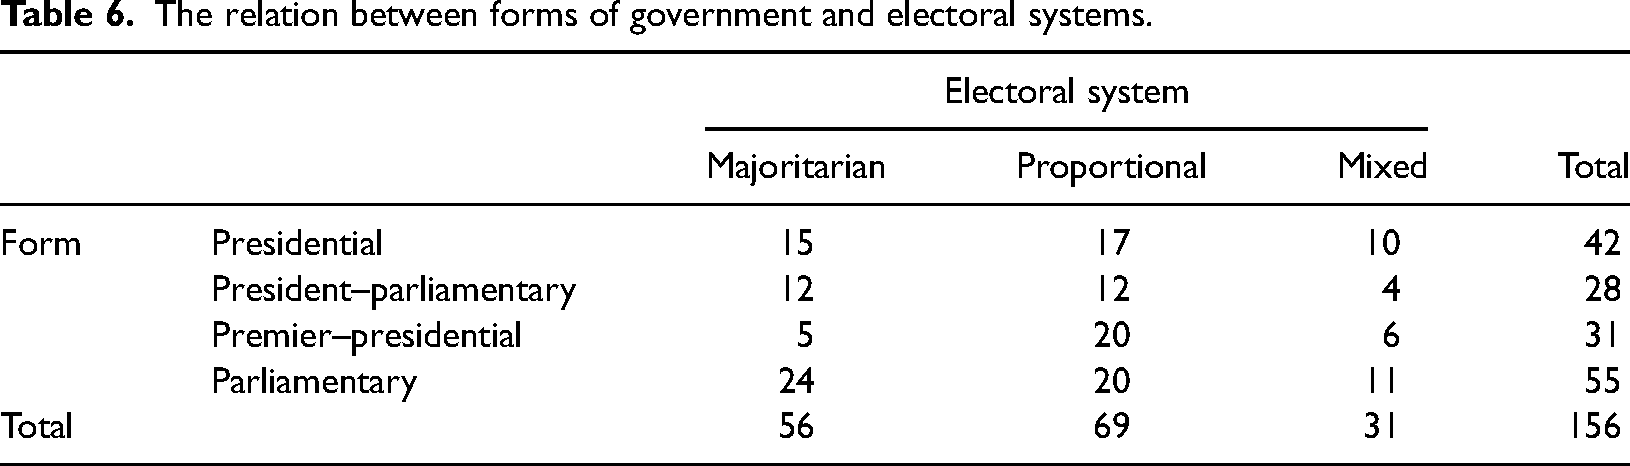
Considering the fact that the majoritarian system causes low ENPP and the proportional system causes high ENPP (see Table 1), when we look at the electoral system applied in forms of government, while the majoritarian and proportional distributions are very close to each other in presidential, president–parliamentary and parliamentary forms, the proportional system is clearly dominant in the premier–presidential form, which increases the ENPP average.
The fact that party fragmentation is low in president–parliamentary and presidential forms can be interpreted as these systems being less encouraging in terms of political participation and party organization.
The H40 hypothesis has been rejected and the relationship between the party system and continent is statistically confirmed. Therefore there is significant difference among the five different continents in terms of ENP, for both ENEP and ENPP. According to post-hoc analyses, the only meaningful result on the basis of ENEP and ENPP is the situation of Oceania compared with other continents. Only nine of the 14 countries in Oceania (eight parliamentary and one presidential) were included in this study. The scarcity of data, the immaturity of the party system and therefore the excess of independent votes, the missing data and the high standard deviation caused Oceania to differ from other continents. For this reason, when we exclude Oceania, there is no meaningful result on the basis of ENEP or ENPP among the continents. While formulating the hypothesis, we stated that we expect the highest ENP in Europe owing to the high number of premier–presidential and parliamentary forms (36 out 42), and the lowest ENP in Africa owing to the high number of presidential and president–parliamentary forms (33 out 45). Although Table 1 confirms our expectations for Europe, the continent with the highest average on ENEP and ENPP is the Americas. It is quite surprising that in the Americas, where the number of parliamentary and premier–presidential forms is relatively high (13 out 30), the ENP is lower than in Africa, whose electoral system is mostly majoritarian. At that rate, the median becomes an important indicator for evaluating the African party system. In Africa, the median is 2.25 based on ENPP, the lowest rate in the entire dataset. In this case, it is the highly uneven distribution of the data, that is, the high S, which puts it behind the Americas in terms of mean (Table 7).
The relation between continents and electoral system.
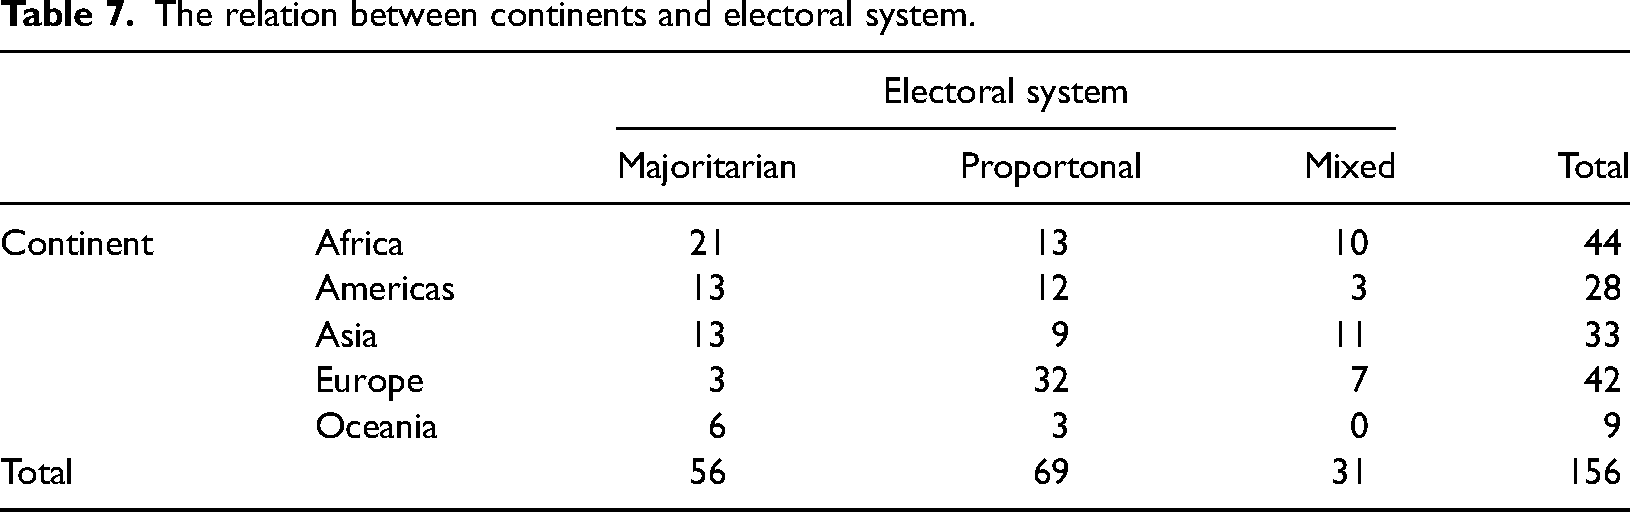
It can be said that the overwhelming preference for the proportional system in Europe has increased the ENP of the continent. Europe has the highest level of ENPP in regard to both its mean and median. Europe also comes to the fore with its relatively regular distribution and low standard deviation (S) in regard to ENEP and ENPP. As Oceania has a small number of countries, its values fluctuate considerably and its S, in regard to both ENEP and ENPP, is quite high. In particular, the huge difference between mean and median concerning ENEP indicates a large number of small parties in Oceania.
As for the relationship between the party system and the electoral system, H30 is rejected and it is concluded that there is a significant difference among the three different electoral systems in terms of ENP for ENPP. While the differentiation of the majoritarian system at the ENEP level according to the proportional system and the mixed system is not significant, it is significant at the ENPP level compared with the proportional system (significance 012; see Table 5). Interestingly, the mean of ENEP was lowest in the mixed system, not in the majoritarian system, contrary to our expectations. However, the ENPP mean, as expected, was lowest in the majoritarian system and highest in the proportional (see Table 2). This shows that the party system is determined by the electoral system rather than the voting behavior of the voters. In other words, whether the electoral system provides fair representation does not definitely/necessarily guide the voting behavior.
Discussion and conclusion
The purpose of this study was to determine the party system characteristics within the context of electoral systems, forms of government, and continents. Using the Laakso–Taagepera Index, we calculated ENEP and ENPP results of the last three lparliamentary elections of the countries governed by presidential, president–parliamentary, premier–presidential and parliamentary forms of govenment, and then analyzed them with ANOVA and post-hoc tests.
It was seen that the party system did not have a meaningful competition with the form of government and continent. However, it was mentioned above that the electoral system is an important factor in small divergences that allow interpretation. It has been revealed that the electoral system significantly determines the party system. This finding is well in line with previous research in the field.
The main point of interest of the study concerned the relationship between the party system and the form of government. The findings revealed that no party system characteristic is specific to any form of government; that is, it is not possible to consider the form of government as an independent variable and the party system as a dependent variable. Thus, the main hypothesis of the study is rejected. This finding constitutes an important contribution to the research on regime forms. During recent decades, authors have discussed positive and negative consequences of presidentialism in particular. The present contribution clearly lays out that variations in regime forms do not affect party system fragmentation.
We have underlined that there was no study in the literature that quantitatively reveals the relationship between party systems and forms of government. While not addressing this relationship directly, Mainwaring (1993) and Linz (1994) tried to link presidentialism with stable democracy, not party systems. Linz claimed that presidentialism was inimical for democratic stability while Mainwaring argued that it was the combination of presidentialism and multipartism that was inimical. The findings of this study are not similar to those of Mainwaring and Linz. Since there is no significant relationship between regime form and party system fragmentation according to the ANOVA and post-hoc tests, our study indicates that the form of government is not connected to party system fragmentation.
During the collection of the data, we learned more about political culture factors affecting the emergence, shaping, and change of party systems. As we see, many factors affect, either directly or indirectly, the party system, such as the desire of leaders to hold on to power, voters’ willingness to participate in politics, the availability of procedural democracy tools, the effectiveness of the electoral security institutions, the recognition of political rights, and the participation of the free or state-controlled press in this process. However, it was not possible to digitize and include these factors in the numerical results of this study. Therefore, we state that although political culture has a direct impact on electoral system, none of the numerical results in this study can be interpreted as determining a level of development of political culture. The same numerical results do not correspond to the same level of political culture, and it is for this reason that we refrained from making assertive interpretations on the aforementioned continental results.
We experienced some difficulties in obtaining the study data, such as those arising from the ambiguity of the party votes, electoral protests and the excessive number of independent votes. Although these shortcomings are likely to change the study findings somewhat, we think that it does not affect the veracity of the results.
This study is based on data from the past three elections in 159 countries. Further studies may only focus on those countries that have changed their form of government, and so may reveal whether this change also results in them changing their party system. This study dealt with the party system through investigating data on legislative elections. A further study to be conducted on presidential elections may yield significant results regarding the comparison of the party system in presidential, president–parliamentary, and premier–presidential forms of government.
Footnotes
Data availability
The dataset was generated by the authors.
Declaration of conflicting interests
The author(s) declared no potential conflicts of interest with respect to the research, authorship, and/or publication of this article.
Ethics
This manuscript has not been published or presented elsewhere in part or in entirety and is not under consideration by another journal. We have read and understood your journal's policies, and we believe that neither the manuscript nor the study violates any of these.
Funding
The author(s) received no financial support for the research, authorship, and/or publication of this article.