
Abstract
Background:
Systemic barriers contribute to challenges in implementing sustainable improvements in early care and education (ECE) health promotion practices, including fragmented state systems, limited organizational capacity, and a lack of accessible, high-quality professional development. Guided by the Reach, Effectiveness, Adoption, Implementation, and Maintenance (RE-AIM) framework, this study evaluated the Better Together approach—a multi-level quasi-experimental program aimed at enhancing health promotion practices in ECE programs.
Methods:
Better Together, developed by Nemours Children’s Health and University of North Carolina Chapel Hill Community Health & Wellness Resource Team, used organizational- and systems-level approaches to improve ECE health promotion practices. Learning collaboratives (organizational level) addressing ECE health practices were delivered by trained consultants. State partners coordinated efforts to impact state systems change using the CDC’s Spectrum of Opportunities 2.0 Framework (systems-level). Surveys and program data were collected to assess reach, effectiveness, adoption, and implementation. Descriptive statistics were used to evaluate RE-AIM outcomes.
Results:
Four states implemented Better Together learning collaboratives, reaching 1,078 staff from 533 ECE programs. Across states, ECE program completion of initiative components ranged from 58.0 to 94.7% (adoption). Consultants implemented planned sessions (n = 26; implementation). On average, ECE programs experienced a 15.1% increase in health-promoting practices (range 11.8–17.5%; effectiveness). Partner groups generated 10 state system-level action plans to promote ECE health practices in perpetuity (maintenance).
Conclusions:
The RE-AIM evaluation of the Better Together program showed positive results. It reached a significant number of ECE programs, leading to increased health-promoting practices, policies, and environments, as well as initiated state-level ECE systems change to sustain support.
Keywords
Introduction
Overweight and obesity among young children is a persistent public health challenge requiring multifaceted solutions. According to the Centers for Disease Control and Prevention (CDC), 1 in 5 U.S. children and adolescents has obesity. 1 Some groups are affected more than others, with adolescents, Hispanic and non-Hispanic Black children, and children in families with low income experiencing a greater prevalence of obesity. 1 Many preschoolers do not have access to nutrient-dense foods and opportunities to engage in recommended amounts of physical activity. Children living in under-resourced communities are at greater risk for unhealthy weight and developing chronic conditions, such as cardiovascular disease and diabetes.2–5
Nutrition and physical activity habits take root early in life, before children reach elementary school. 6 In the United States, nearly 12.6 million children not yet in kindergarten are cared for in early care and education (ECE) programs [i.e., child care, Head Start, pre-kindergarten, family child care homes (FCCHs)] every week. 7 On average, young children spend >30 hours per week in ECE, and children in full-day care consume half to two-thirds of their daily nutrient and energy needs in these programs. 8 Early childhood is an optimal opportunity to promote health and reduce health disparities. 9 High-quality ECE programs significantly impact children’s health, development, and learning into kindergarten and beyond but are not widely available or affordable for all families. 10 The ECE sector suffers from limited supply, overwhelming demand, varying quality, and workforce shortage.11–14 Black and Latine families, young parents, rural communities, and families with lower incomes bear a disproportionate burden in accessing and paying for quality ECE compared to other population groups.15–17 Given these challenges, health promotion efforts must include multiple reinforcing strategies that prioritize underserved communities.
To embed nutrition and physical activity standards in ECE, Nemours Children’s Health (Nemours Children’s) and the Community Health & Wellness Resource Team at the University of North Carolina (UNC) at Chapel Hill, partnered to design and implement the Better Together (BT) program from 2019 to 2022 in Arizona, Arkansas, Indiana, and Mississippi. BT was a quasi-experimental multi-level intervention that used reinforcing components to foster change in ECE programs (organizational level) and the systems that underpin them. Change strategies included: partnership development, program self-assessment, learning sessions to increase ECE staff capacity, action planning with state partners and ECE programs, technical assistance (TA), and re-assessment. This article evaluates BT implementation and outcomes using the Reach, Effectiveness, Adoption, Implementation, and Maintenance (RE-AIM) framework. RE-AIM was selected as an evidence-based tool that is compatible with socio-ecological thinking, systems-based approaches, and public health interventions. 18
Materials and Methods
For participating state leads and ECE programs, BT provided financial resources, content-specific curriculum, classroom resources, in-depth training, and TA. Nemours Children’s provided expertise in implementing ECE learning collaboratives and advising on ECE state systems change, while UNC offered expertise in ECE organizational interventions, specifically Go NAPSACC (Nutrition and Physical Activity Self-Assessment for Child Care), an online, evidence-based, health promotion platform. Figure 1 demonstrates the BT conceptual framework.

Better Together conceptual framework.
Sample
Purposive sampling identified 13 priority states with high rates of obesity and child poverty. This sample was narrowed to six states without current ECE interventions like learning collaboratives or similar quality improvement efforts. Nemours Children’s and UNC (study team) invited organizations from the six states to receive an orientation detailing BT goals and expectations and submit a proposal. Through a competitive application process, four states (AR, AZ, IN, MS) were selected based on demonstrated need, capacity, and infrastructure to implement all project components. Each lead convened a statewide partner group and recruited TA consultants and ECE programs. Leads proposed communities for learning collaboratives, and once communities were selected, ECE programs were recruited from low-income neighborhoods, defined as locations with Child and Adult Care Food Program (CACFP) tier 1 classification. 19 Recruitment efforts focused on center- and home-based programs in communities with higher levels of adult and child obesity. Programs represented a mix of urban, suburban, and rural settings. A total of 533 programs enrolled (AZ:150, AR:136, IN:97, MS:150) and formed leadership teams, typically directors, teachers, and nutrition staff for centers, and owners for home-based programs.
Organizational Level
BT used a learning collaborative approach (Fig. 2), engaging ECE programs in learning sessions and action planning tasks, to drive organizational change and improvements. 20 The study team trained 29 state-based TA consultants through five train-the-trainer (TtT) sessions, consisting of multiple meetings per TtT session, to deliver four content-specific learning sessions to 25 cohorts of ECE programs in 2021 and 2022. The first session provided a project overview, reviewed nutrition and physical activity evidence-based practices, explored training strategies, and provided opportunities to practice delivery. The four remaining TtT sessions prepared TA consultants to deliver learning sessions on: (1) Infant and Child Physical Activity, (2) Child Nutrition, (3) Breastfeeding and Infant Feeding, and (4) Screen Time. TA consultants were trained on qualitative and quantitative evaluation tools, such as feedback surveys and Go NAPSACC self-assessments. Additional study components (e.g., family cafés) and evaluation tools (e.g., Environment and Policy Evaluation and Observation Self-Report Instrument) were completed by subsets of participants but are not reported.21–22
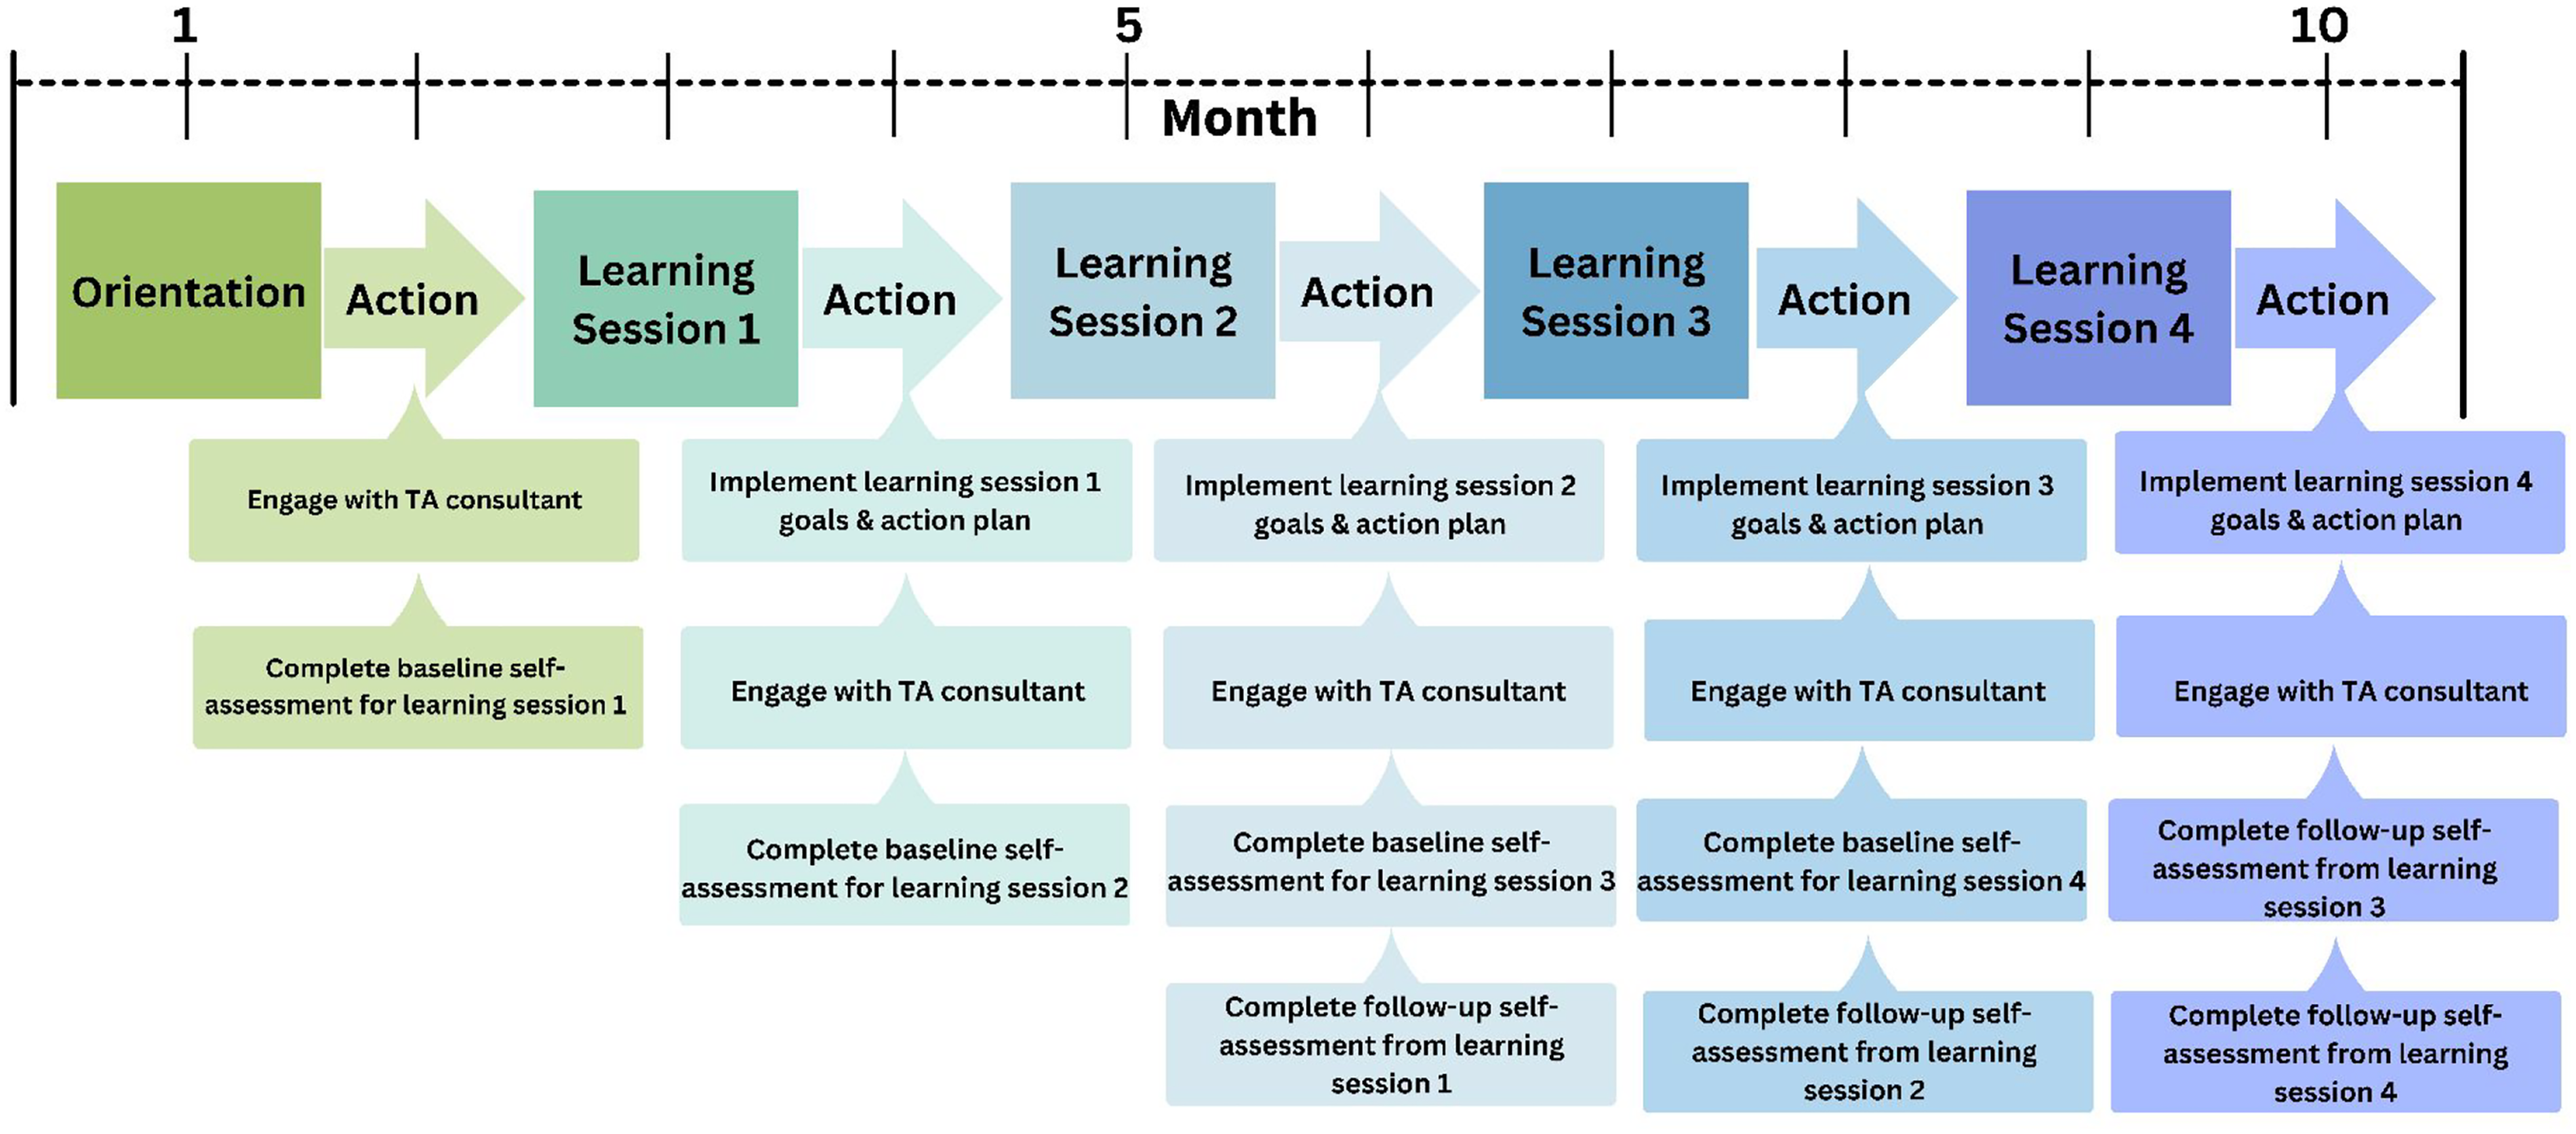
Organization-level approach.
For ECE staff, each learning session consisted of approximately 5 hours of content, delivered by TA consultants in live virtual sessions on a bi-monthly basis. Learning sessions included a review of evidence-based practices, implementation strategies, pre-recorded trainings, and group discussions. Learning sessions were followed by an action period where ECE leadership teams received individualized support from a TA consultant to review progress and challenges. Participants shared learnings with their staff and worked collaboratively to complete self-assessments, select evidence-based goals, create action plans, and access educational resources using Go NAPSACC tools.
BT provided incentives to ECE programs that met completion criteria, defined as having valid (<10% missing data) pre- and post-self-assessments submitted within 30 days of the final learning session. ECE programs meeting these criteria received $700 and materials related to session themes (e.g., pretend fruits and vegetables, playground balls, bean bags, child-sized pitchers and tongs, and books) to support classroom application. Some states also offered professional development (PD) credits.
The study team provided TA throughout the duration of BT, including monthly meetings with state leads, recruitment and implementation strategy support, and Go NAPSACC assistance. The four state leads met quarterly with the study team for further networking and learning.
Systems-Level Efforts
Systems-level strategies were facilitated concurrently to strengthen state structures to promote and sustain health promotion in ECE settings beyond the study period (Fig. 3). The study team hosted kickoff events in each state to initiate systems-level efforts, provided an overview of the project and timeline, identified state-level partners to collaborate on efforts, and brainstormed ECE systems-level change goals. State leads organized partner groups and hosted regular convenings. The partner groups developed and advanced two or three state-level ECE systems-change goals over the last two-and-a-half years of the project.
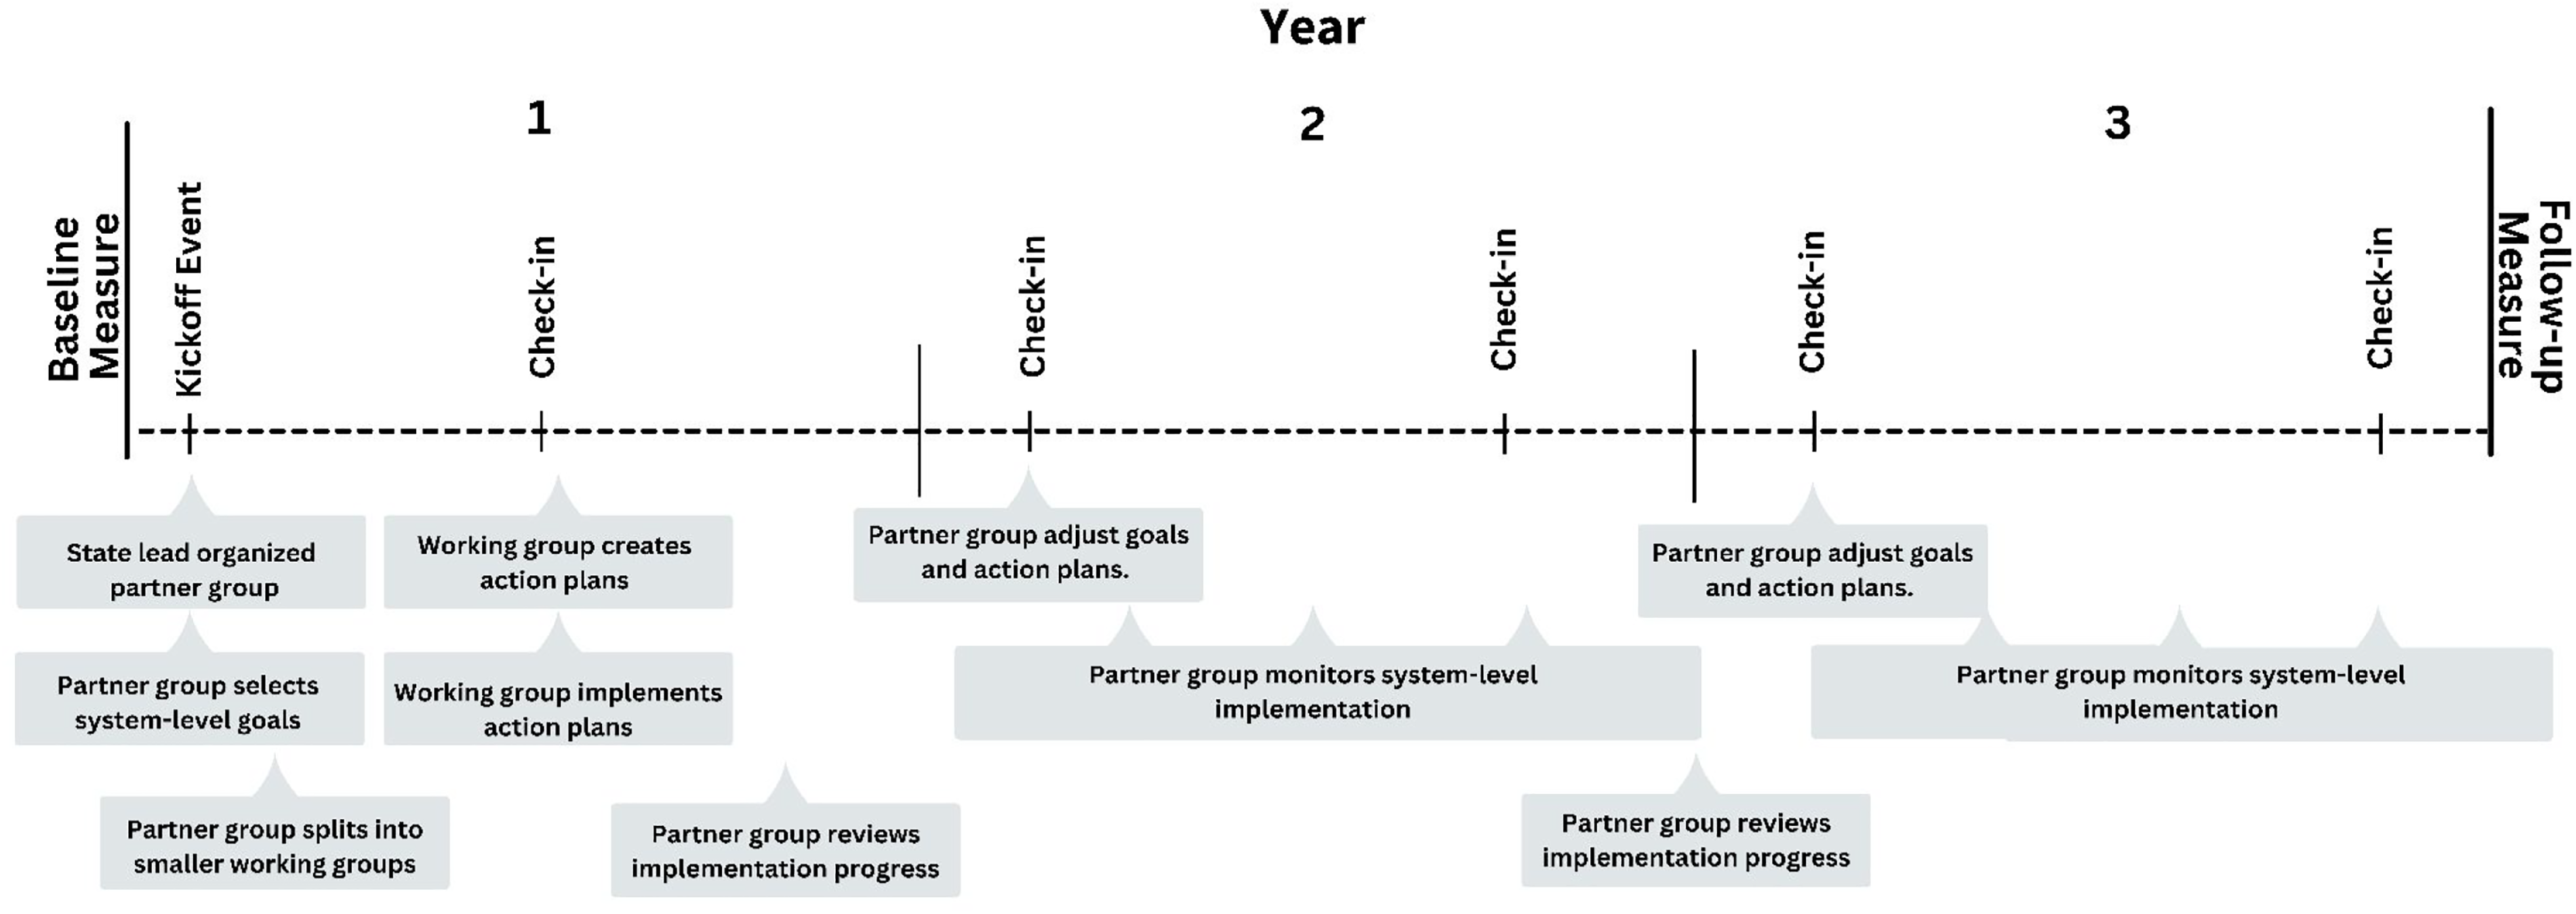
Systems-level approach.
To guide systems-level efforts, state leads utilized the CDC’s Spectrum of Opportunities for Obesity Prevention in ECE (Spectrum) framework, which outlines nine areas for improving ECE policies and practices: (1) licensing and administrative regulations, (2) CACFP, (3) Quality Rating & Improvement Systems (QRIS), (4) ECE funding streams, (5) pre-service and PD systems, (6) statewide TA networks, (7) statewide recognition and intervention programs, (8) statewide access initiatives, and (9) early learning standards. 23 CDC’s Quick Start Action Guide was used to create action plans to achieve system-level implementation goals. 24 Partner groups had the option to integrate Go NAPSACC into system-level goals (e.g., utilize sustainable funding to purchase a Go NAPSACC license, revise QRIS standards to include Go NAPSACC self-assessments as approved tools). Partner groups monitored progress, provided quarterly updates, and adjusted goals annually.
Partner groups developed plans to expand online Go NAPSACC use beyond learning collaborative participants, aiming to recruit an additional 150 ECE programs (referred to as non-learning collaborative ECE programs) per state in Years 2 and 3, for an overall goal of 600 ECE programs. Recruitment approaches varied: Arkansas and Mississippi funded TA consultants to promote Go NAPSACC usage and provide support to programs, Indiana offered a financial incentive to register, and Arizona created a process to connect programs with TA consultants.
Outcomes and Measures
This study used the RE-AIM framework to evaluate the combined effects of BT components across multiple evaluative dimensions. Table 1 outlines each RE-AIM dimension, level (system, organizational, or individual), definition, and measure. Organizational-level measures of reach, adoption, and implementation consisted of attendance and implementation records maintained by the study team and TA consultants. Effectiveness and maintenance were assessed using Go NAPSACC self-assessment scores across the four learning sessions. State leads submitted monthly reports and quarterly action plan updates detailing recruitment and implementation progress. These reports were used to assess systems-level reach, adoption, implementation, and effectiveness. To assess post-study maintenance, state leads participated in monthly check-ins and quarterly state networking meetings with the study team for 2 years through services provided by their sustained Go NAPSACC license.
RE-AIM Dimension, Implementation Level, Definitions, and Measures
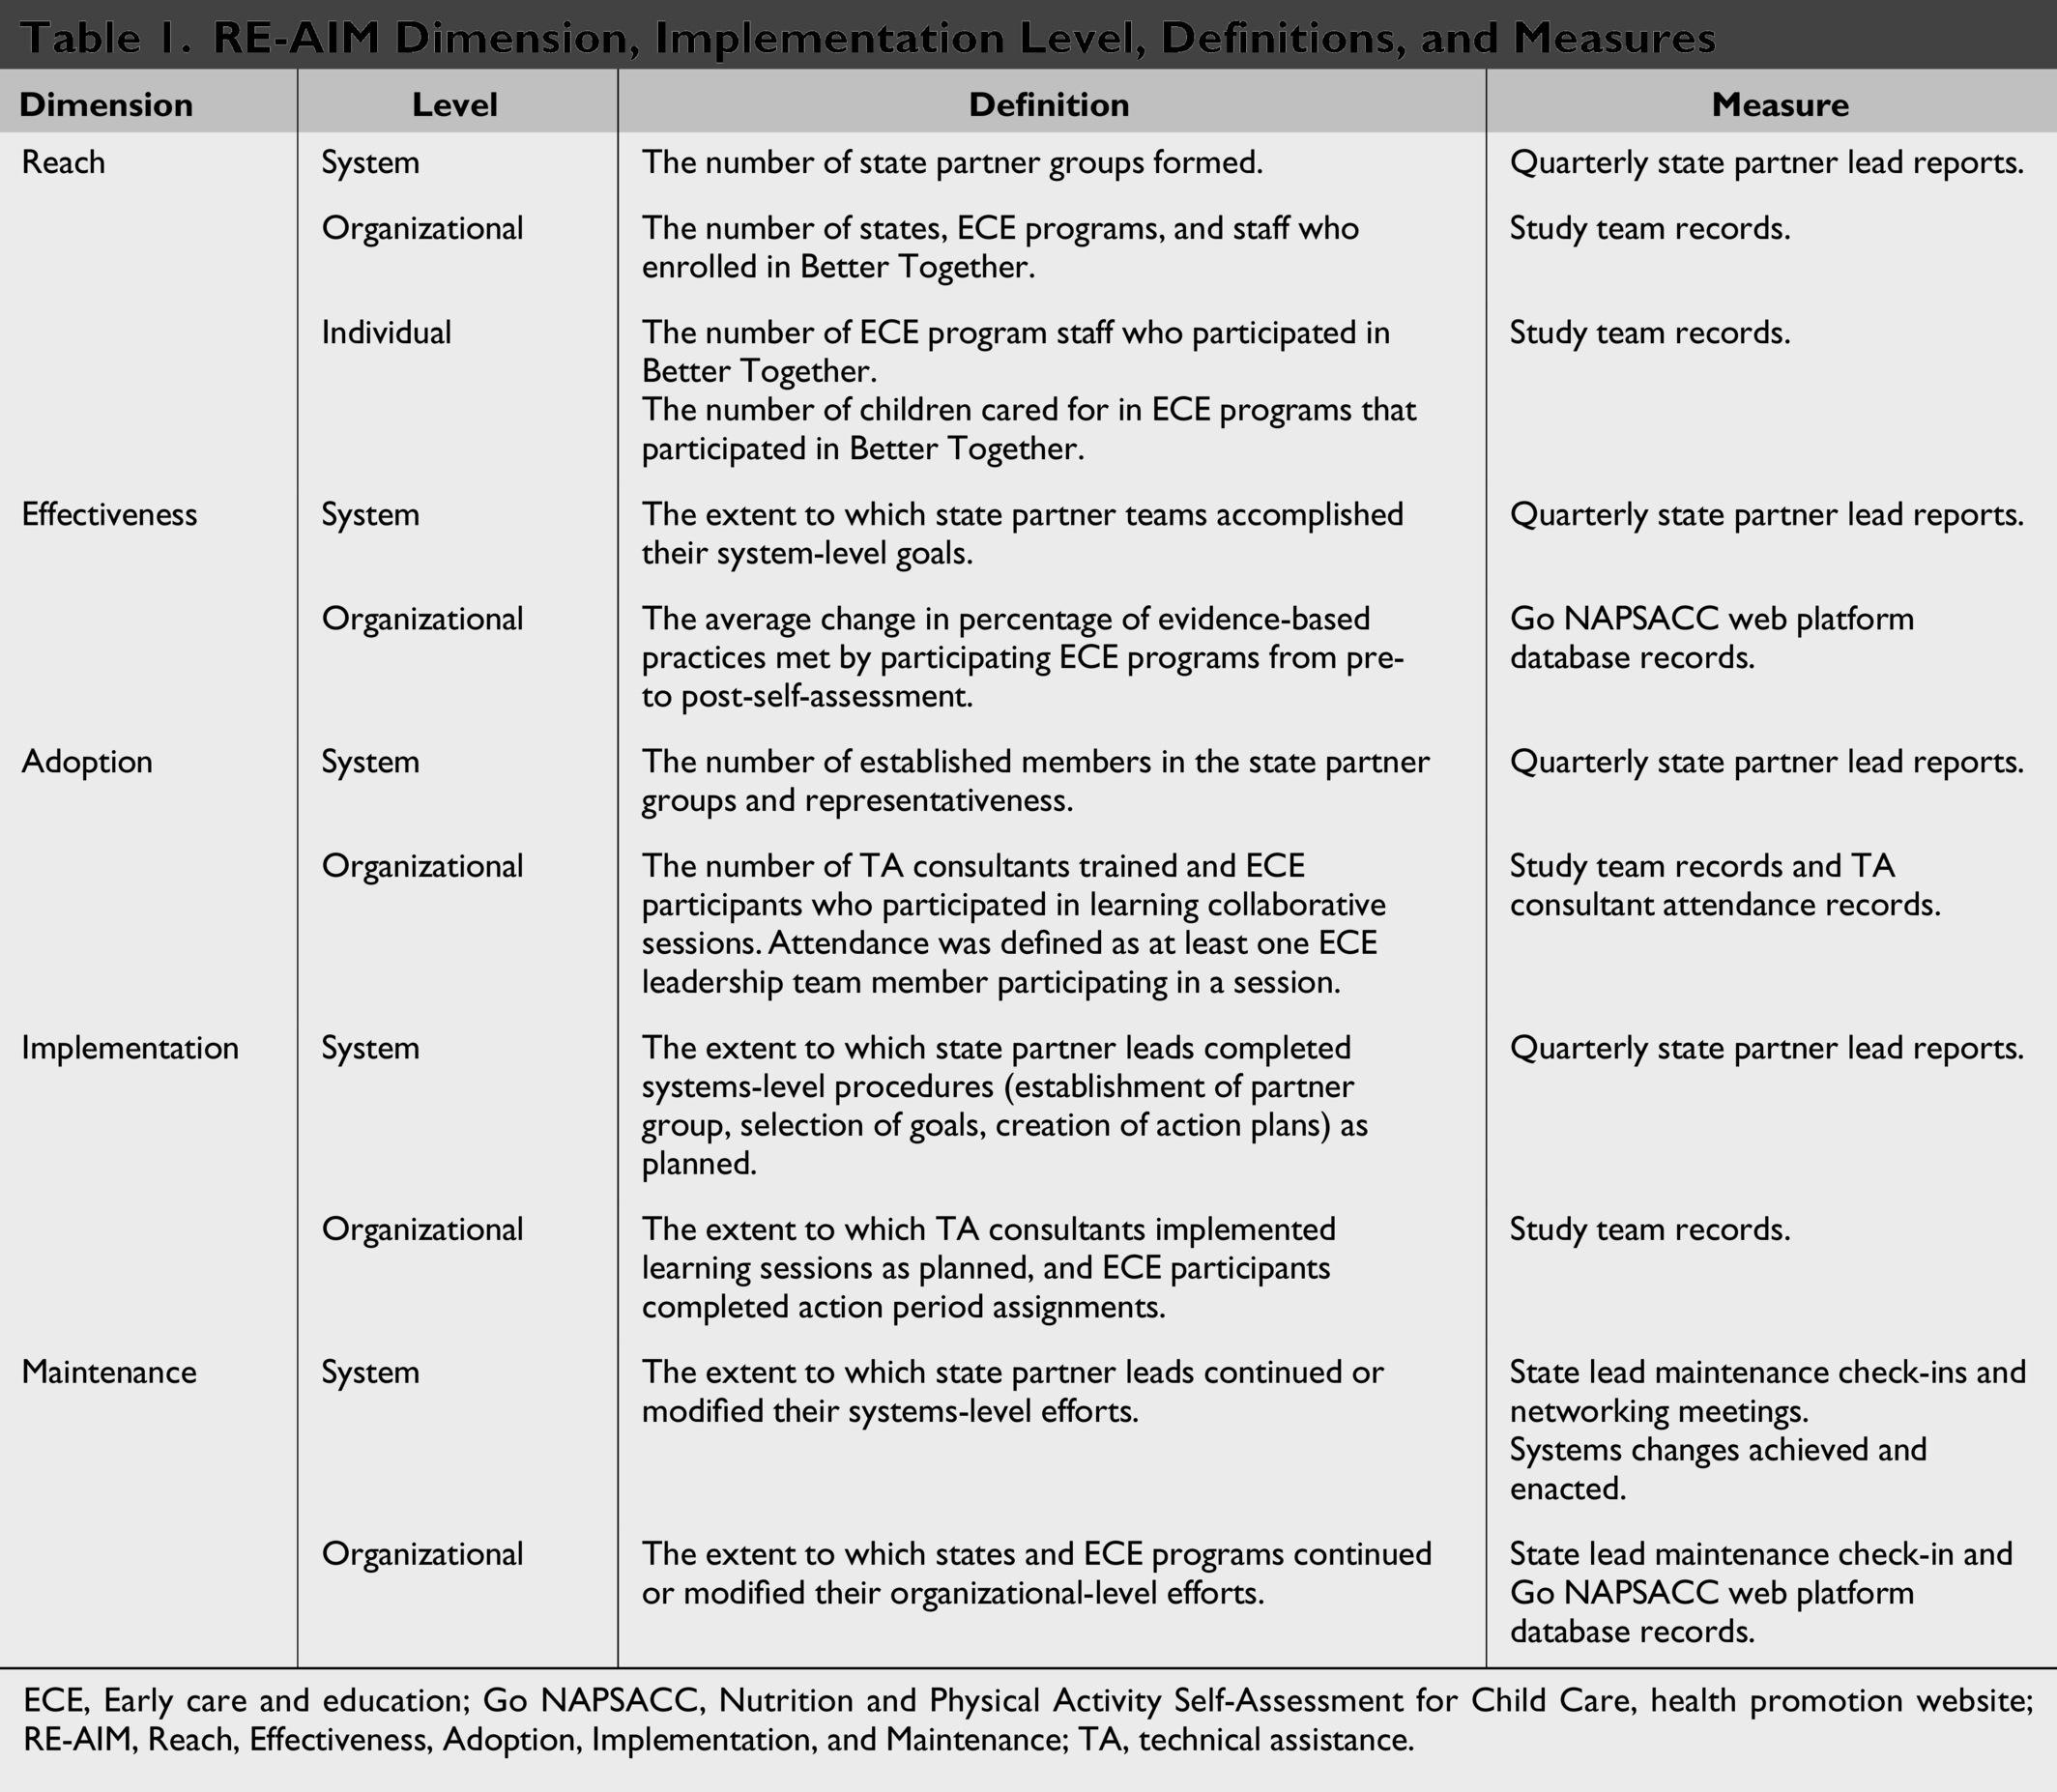
ECE, Early care and education; Go NAPSACC, Nutrition and Physical Activity Self-Assessment for Child Care, health promotion website; RE-AIM, Reach, Effectiveness, Adoption, Implementation, and Maintenance; TA, technical assistance.
Results
Reach
A total of 533 ECE programs and 1,046 ECE staff enrolled in learning collaboratives. Arizona and Mississippi each recruited 150 programs. Arkansas recruited 136, and Indiana recruited 97. Most programs were center-based (n = 245, 60.9%), located in metro areas (n = 274, 68.2%), and federal nutrition reimbursement program [Child and Adult Care Food Program (CACFP)] participants (n = 288, 72%), while 14% were Head Start programs (n = 59). Nearly all served children ages 25–60 months (n = 410, 97.4%), while 328 served children ages zero to 24 months (77.9%). ECE program characteristics are provided in Table 2. While a formal comparison to statewide licensing data was not conducted, the enrolled programs represent a diverse range of ECE settings. Go NAPSACC engaged 689 non-learning collaborative programs (30% FCCHs) through the online tools. The study team provided proactive and reactive TA to four statewide coalitions, four Go NAPSACC state planning teams, 29 learning collaborative consultants, and 159 Go NAPSACC consultants.
Learning Collaborative ECE Participant Characteristics
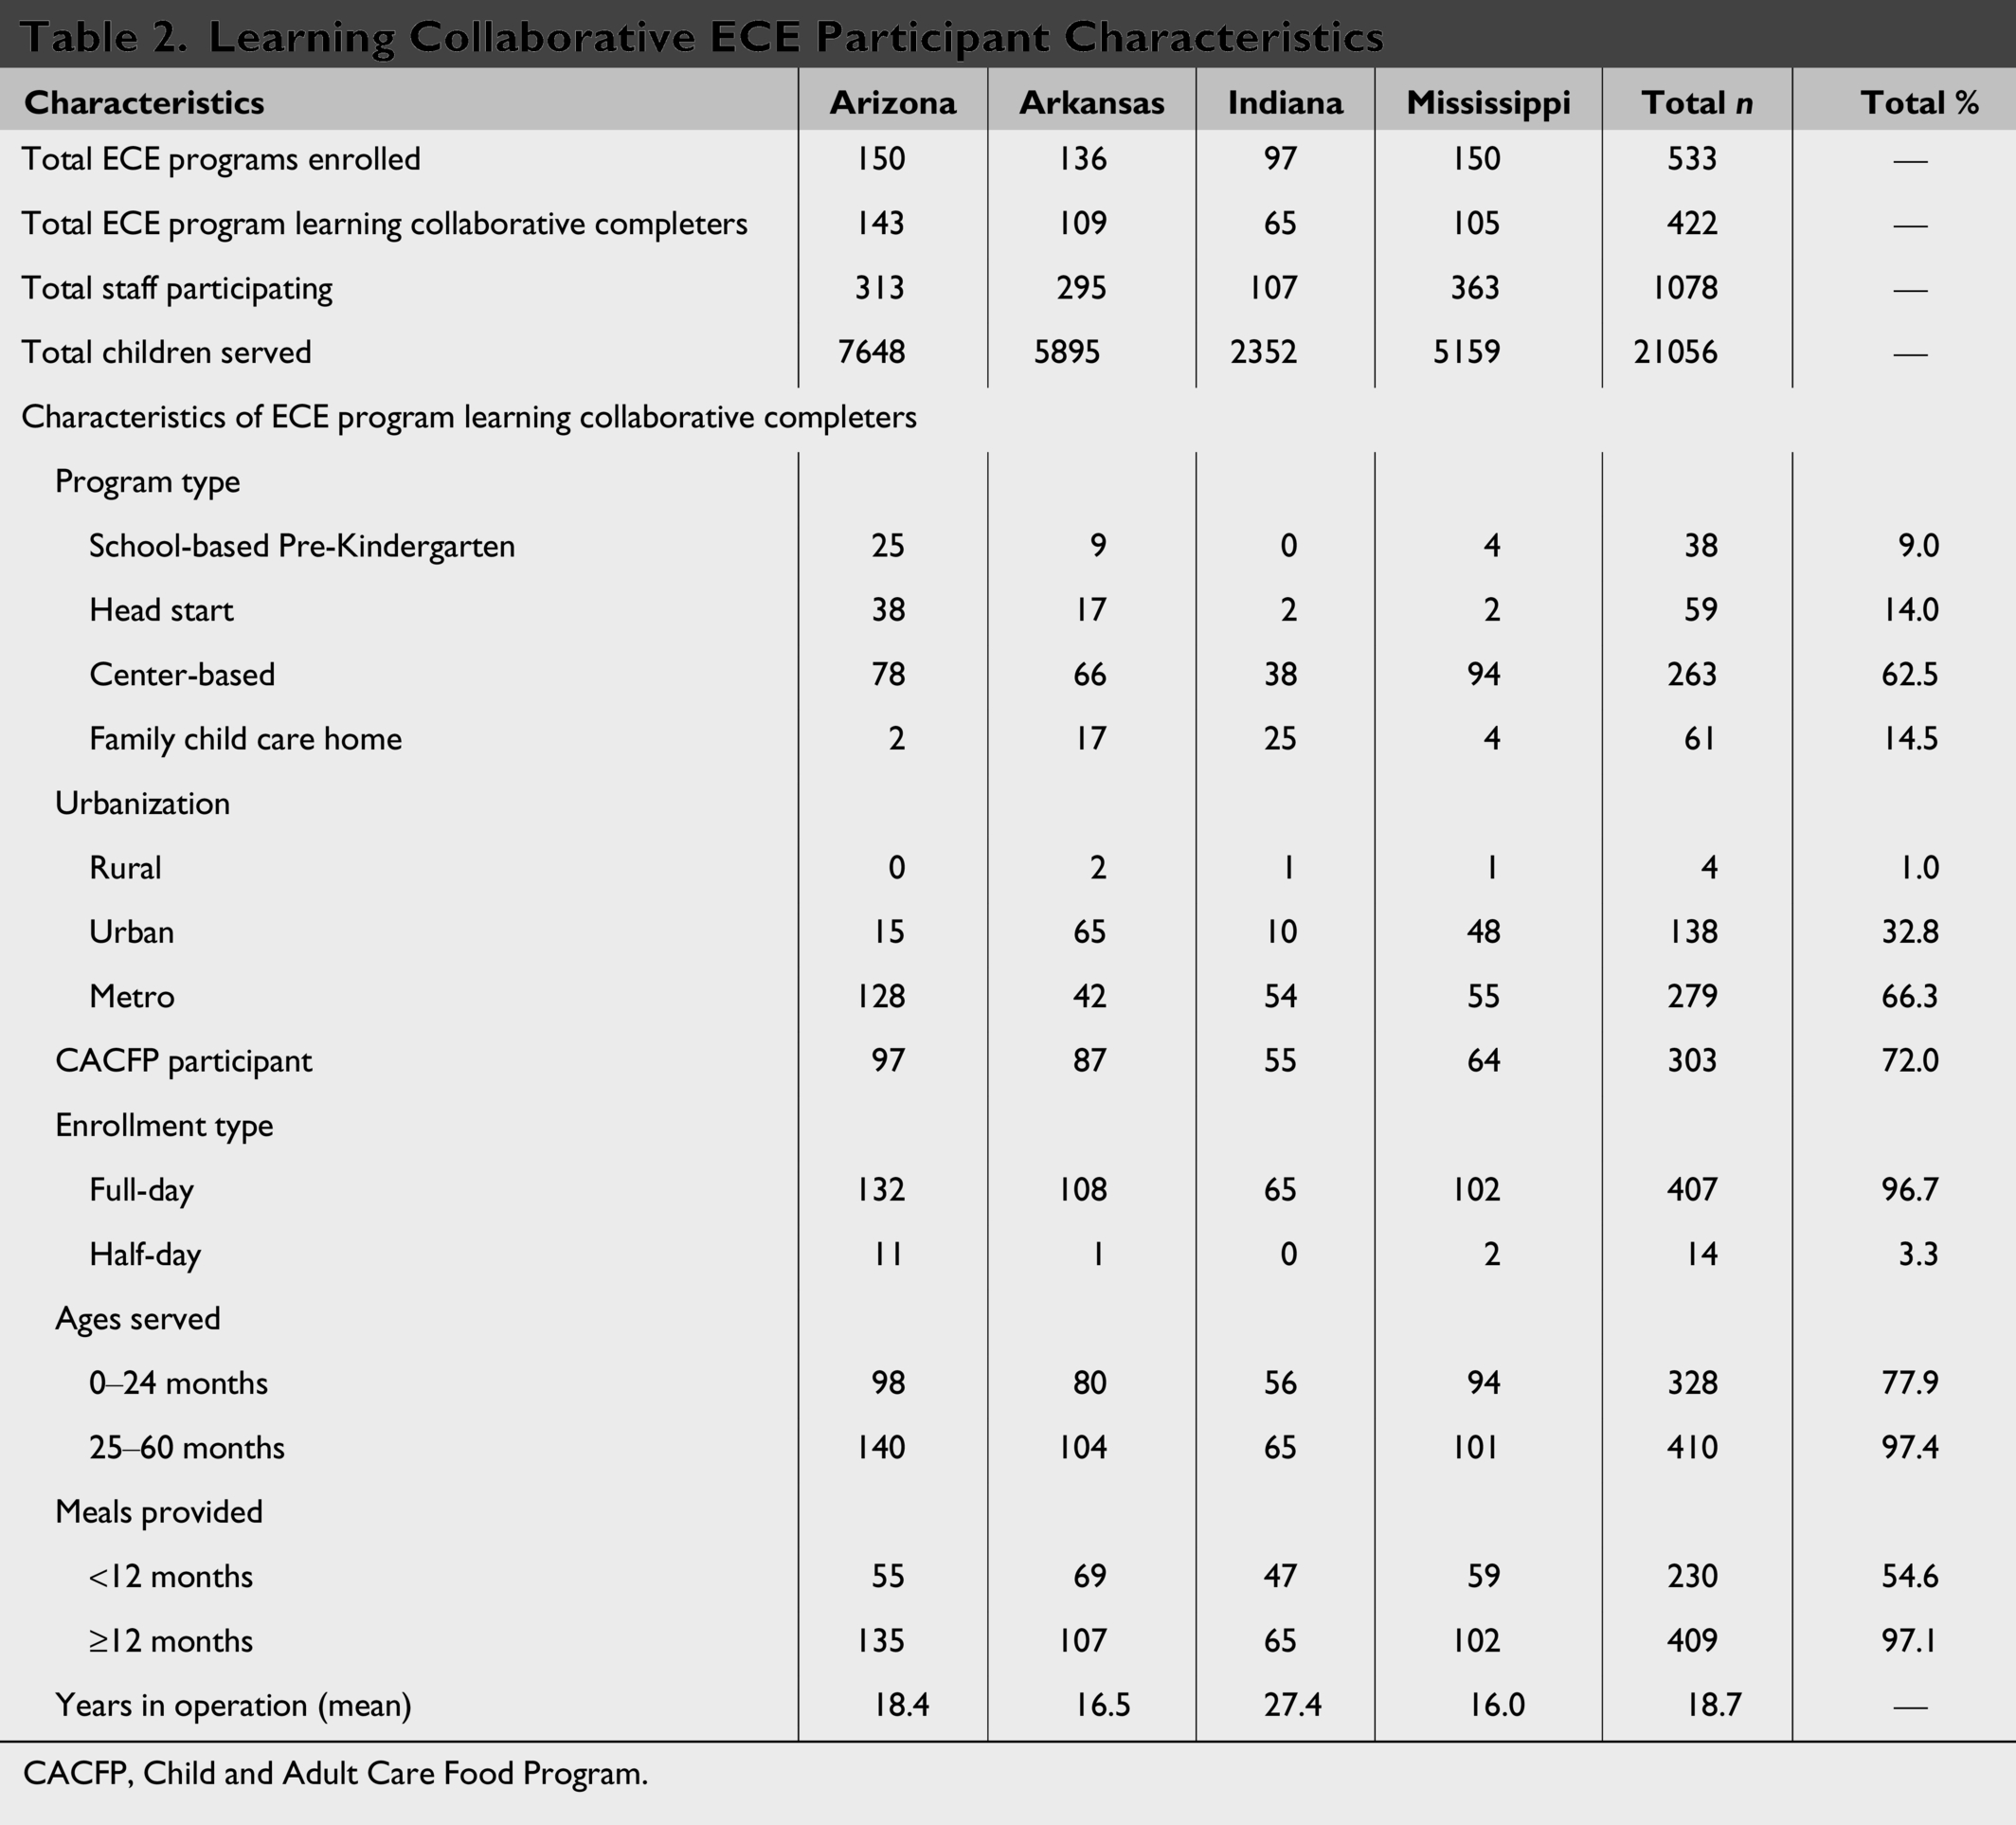
CACFP, Child and Adult Care Food Program.
Effectiveness
To assess the effectiveness of the learning collaboratives, ECE programs completed a Go NAPSACC self-assessment before each learning session and after completion of all five learning sessions. Table 3 shows the percent of change in evidence-based practices met from pre- to post-assessments for each completed module, which align with the learning sessions. On average, self-assessment scores increased by 15.1% from pre- to post-assessment. The Physical Activity module saw the greatest average increase of 18.9% (42.4% to 61.3%). The Breastfeeding and Infant Feeding module had the second-highest increase (17.5%). The Child Nutrition and Screen Time modules saw improvements, but at lower rates (Child Nutrition 11.8%, Screen Time 12.1%).
Learning Collaborative Program Evidence-Based Practice Change
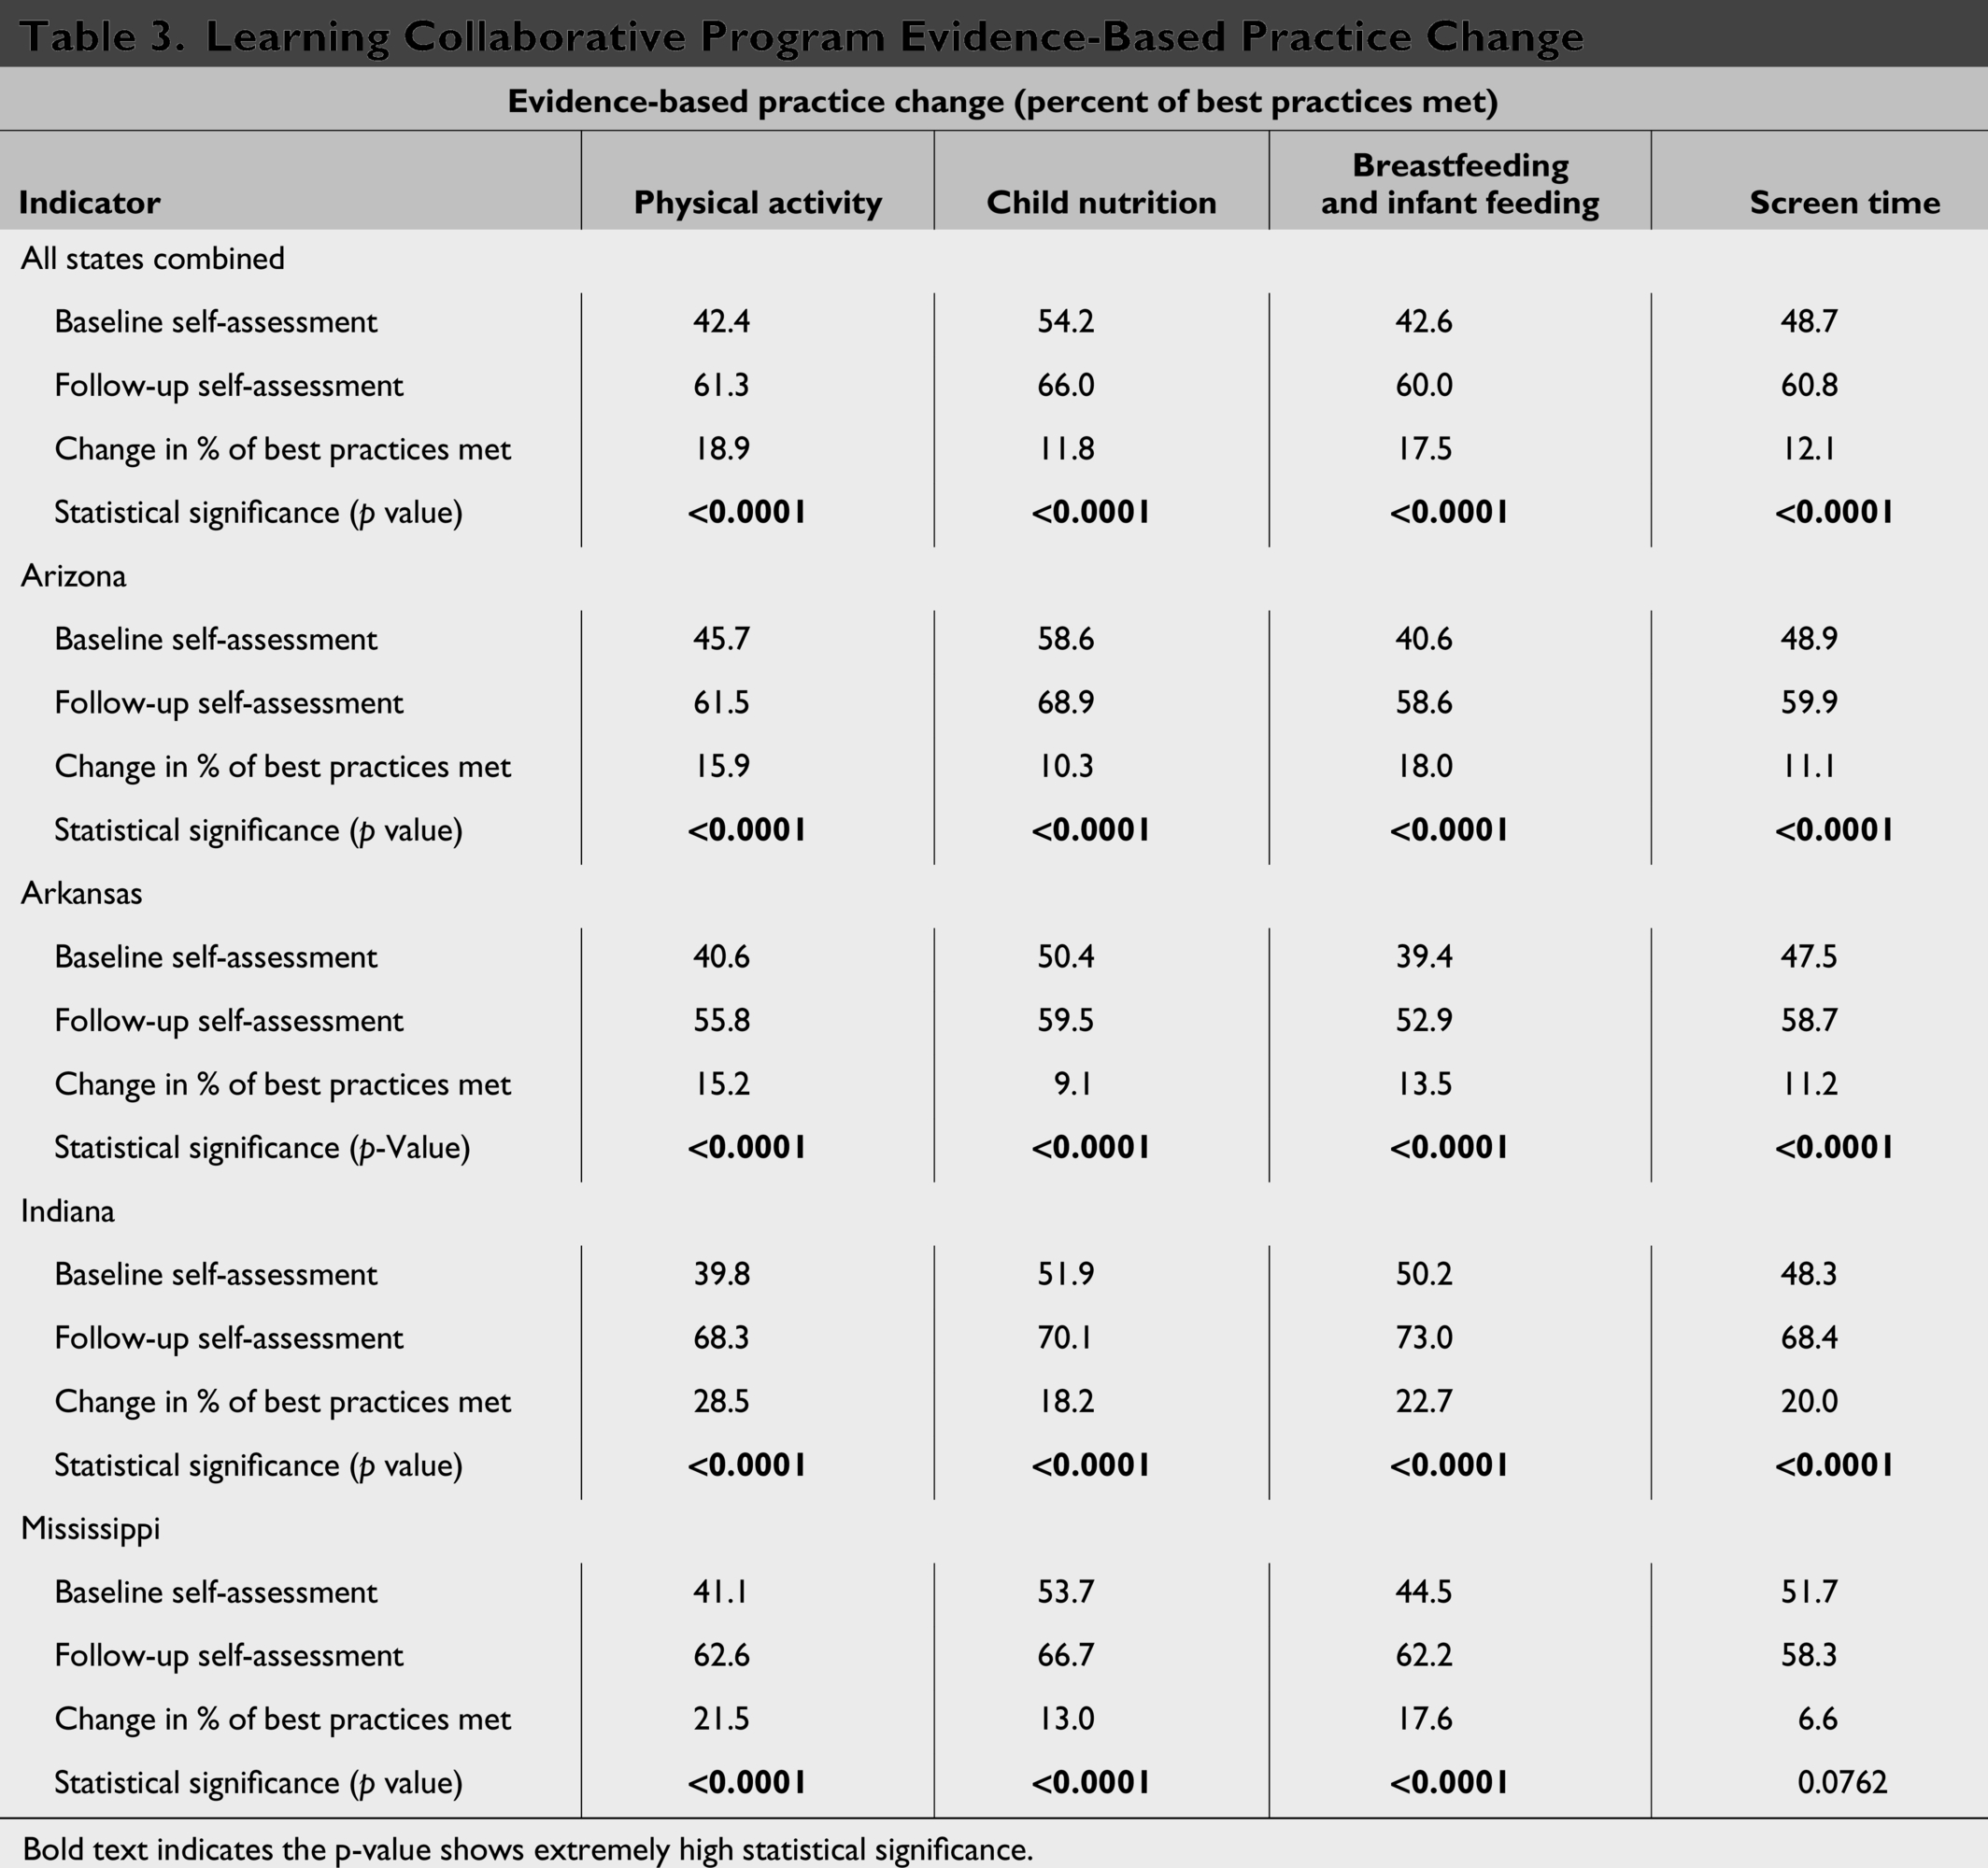
Bold text indicates the p-value shows extremely high statistical significance.
The post-assessment completion rate was much lower among non-learning collaborative programs (13%, 110 post-assessments, n = 96) compared to participating programs (88%, 1,456 post-assessments, n = 370). The non-learning collaborative programs that did complete post-self-assessments showed improvements across BT modules, ranging from 7.3% (Child Nutrition) to 31% (Screen Time).
Adoption
Adoption is defined as the proportion and representativeness of settings that adopt a given program. 18 For BT, adoption included four states, each with a partner group of 15–20 participants from early childhood and health agencies or organizations. The study team trained 29 TA consultants who delivered 100 learning sessions. In total, 421 ECE programs and 1,078 staff participated in learning sessions, with high attendance (87%) and completion (79%) rates. ECE programs adopting the learning collaboratives included a mix of organizational types and sizes across urban and rural areas and were similar to all enrolled programs in size (full-day: 96.7% vs. 96.5%), type (center-based: 62.5% vs. 60.9%; head start: 14.0% vs. 14.7%; FCCH: 14.5% vs. 14.9%; school-based: 9.0% vs. 9.5%), and rurality (rural: 1.0% vs. 0.7%), indicating broadly representative adoption.
Implementation
Each state implemented three or four learning collaborative cohorts annually, totaling 25 cohorts with each averaging 17 ECE programs in a shared geographic area. The study team attended select learning sessions led by the TA consultants to ensure fidelity. On average, 98% (n = 412) of the 421 ECE programs completed the assigned Go NAPSACC pre-assessment for each learning session. Of those who completed the pre-assessments, 90% (n = 379) selected goals and created action plans, and 88% (n = 370) completed post-assessments across four Go NAPSACC modules. All four state partner groups developed a state action plan with systems-level goals.
Among non-learning collaborative programs, 96 programs completed both a pre- and post-self-assessment within the same module. Across all Go NAPSACC modules, 843 pre-self-assessments and 110 post-self-assessments were completed, reflecting 13% average completion rate of both pre-and post-self-assessment within this group.
Maintenance
To address sustainability, the study team and state partners aimed to implement improvements in ECE state systems to provide continued support to sustain ECE program organizational changes achieved during the study. The four states worked to implement a total of 10 system-level action plans across six Spectrum areas to promote healthy ECE practices beyond BT. State efforts focused on: TA Networks (n = 4), Licensing Regulations (n = 1), CACFP (n = 1), QRIS (n = 1), PD (n = 1), and Recognition Programs (n = 2). All states met their goal to integrate nutrition and physical activity into Statewide TA networks and laid the groundwork for future system changes, as expected given the time and infrastructure required for such efforts. Each state continued working with Go NAPSACC through funding from the U.S. Department of Health and Human Services or the U.S. Department of Agriculture. Three states embedded ECE health promotion PD into programming offered regularly by existing training and TA organizations and maintained these opportunities after BT. These PD opportunities were approved for training hours through state registries.
Discussion
High Completion Rate of Learning Collaborative Post-Assessments
Health behavior interventions frequently encounter challenges with participant engagement.25–26 In BT learning collaboratives, an average of 88% (n = 370) of ECE programs completed post-assessments. The comprehensive quality improvement process provided by learning collaboratives resulted in a high rate of post-assessment completion. Dedicated TA consultants provided support and accountability for completion and facilitated beneficial peer networking opportunities. One Indiana participant stated, “You’re linked up with a group of other providers who each have their own vault of knowledge and experience. […] By the end of it, it felt like we were all just a group of friends.” Monetary incentives and classroom resources significantly boosted post-assessment completion rates.
Compared to learning collaborative programs, non-learning collaborative programs had a low post-assessment completion rate (13.0%). Within this group, most programs completing pre- and post-self-assessments were in Arkansas (n = 18) and Mississippi (n = 71), where project funds supported TA consultants to provide individualized Go NAPSACC assistance.
Inclusive Approach across Diverse States
BT provided customized TA to state partners, flexible training delivery methods, and revised training materials for use with various ECE program types beyond BT. Overall, BT reached 1,079 ECE programs serving over 53,000 children across four states. Based on 2022 child care supply data, BT learning collaboratives reached 11.35% of licensed ECE programs and 3.31% children under five in Arizona; 12.21% and 5.50% in Arkansas; 8.70% and 2.01% in Indiana; and 17.03% and 7.18% in Mississippi.27–28 Over 1,800 hours of individualized TA were provided to ECE programs. These positive outcomes were driven by strong collaboration, organization, and communication between the study team, state leads, and TA consultants. One Arkansas trainer shared, “With no prior training experience, I wouldn’t be as equipped as I am now if I didn’t have the opportunity to interact with others doing this same work.”
COVID-19 Implications and Impacts
The COVID-19 pandemic prompted substantial implementation adaptations to BT, which was originally designed as a 3-year, in-person intervention. Soon after the 2019 launch, the COVID-19 pandemic forced a rapid transition from in-person to virtual delivery and evaluation, potentially impacting organizational-level reach, adoption, and implementation. TA consultant training and learning session content were modified for virtual delivery, which delayed the launch of the organization-level activities.
The primary challenge in implementing BT was the ongoing impact of COVID-19 on the ECE workforce, including staff shortages and financial constraints. In response, the study team offered make-up and recorded sessions. Attrition was higher than in previous ECE collaborative studies (n = 111, 20%), largely due to workforce shortages and virtual delivery challenges. 29 However, virtual adaptations also yielded unexpected benefits: increased flexibility, reduced costs, and expanded programs and staff participation in remote or geographically diverse areas.
Tracking BT Impact
Future research should track state progress to reach systems-level goals and ECE program engagement in Go NAPSACC to assess if health promotion practices are sustained and if additional programs registered in Go NAPSACC since study completion. Because state-system change requires significant time and effort to build partnerships and infrastructure, a study examining the impact of ongoing engagement and coordination of state partner groups on ECE systems could provide valuable insights for future state-level health promotion.
Adoption in Other States
BT engaged cross-sector coalitions to embed activities into state systems. Although BT included multiple components, states could adapt the model to match available resources and infrastructure. Thirty-seven states have existing child care coalitions that can identify areas for system-level improvement using the Spectrum. 30
Integrating learning collaboratives into existing TA networks and PD systems offers a cost-efficient approach that leverages established partnerships to deliver training. States investing in Go NAPSACC should collaborate with TA networks to strengthen quality improvement processes and increase best practice adoption.
States may integrate these activities into ECE funding proposals and work plans, including chronic disease prevention funding, Child Care and Development Block Grant, CACFP, or Head Start opportunities. States could provide non-monetary incentives (e.g., PD hours, coaching from existing TA staff) rather than resource kits or stipends, while maintaining key intervention elements (e.g., structured learning, peer networking, action planning, and self-assessment).
Conclusions
The RE-AIM evaluation of BT showed positive outcomes at both organizational and state levels despite pandemic-related challenges. COVID-19 caused closures, reduced enrollment, and staffing shortages, yet the study team and state partners successfully adapted to meet program needs. Findings indicate virtual learning collaboratives are effective for engaging ECE programs in quality improvement. A 15.1% average increase in self-assessment scores reflects measurable gains in environmental quality, practices, and policies supporting child development.
BT strengthened state systems to ensure ECE programs have ongoing access to health promotion resources and TA after BT ended. All participating states integrated sustainability plans into systems and funding streams, addressing six Spectrum areas. These efforts lay the groundwork for future investments in ECE health and wellness initiatives.
Impact Statement
BT aimed to embed nutrition and physical activity standards in ECE in Arizona, Arkansas, Indiana, and Mississippi from 2019 to 2022. BT used a quasi-experimental multi-level intervention that fostered change within ECE facilities and state systems. This article evaluates BT using the Reach, Effectiveness, Adoption, Implementation, and Maintenance framework.
Authors’ Contributions
Conceptualization: C.B.H., R.P., F.T.S., and D.Y. Data curation: D.Y., E.A.W., and D.H. Formal analysis: E.A.W. and D.H. Funding acquisition: A.G.R., R.P. Investigation: C.B.H., R.P., F.T.S., D.Y., and E.A.W. Methodology: A.G.R., R.P., and D.Y. Project administration: C.B.H., D.Y., A.S., and E.A. Supervision: A.G.R., R.P., and F.T.S. Visualization: C.B.H., F.T.S., and D.Y. Writing—original draft: C.B.H., R.P., F.T.S., and D.Y. Writing—review and editing: C.B.H., R.P., F.T.S., D.Y., E.A.W., A.S., and A.G.R.
Footnotes
Acknowledgments
The investigators and study team would like to acknowledge and thank the state-level partners, technical assistance consultants, and ECE programs participating in this project, and the dedicated study team who implemented these protocols.
Author Disclosure Statement
The authors certify that they have NO affiliations with or involvement in any organization or entity with any financial interest or non-financial interest in the subject matter or materials discussed in this article.
Funding Information
This project was funded by The