
Abstract
We establish that the actions of influential opinion leaders in the digital currency markets and potential investors following their lead drive abnormal cryptocurrency returns. We develop a psychological and behavioral factor, named the herd behavior index, that detects the herd instinct of the investors in cryptocurrency markets and captures anomalies in cryptocurrency returns. Our finding shows that the herd behavior index can explain the variation in cryptocurrency returns. Moreover, there exists a time-series relationship between abnormal returns and the investors’ herd instinct, and the herd behavior index consistently forecasts future digital currency returns. Finally, we find notable gains even after considering transaction costs by implementing a long/short trading strategy based on the herd behavior index.
Introduction
Cryptocurrencies typically lack a cash flow basis for their valuation, relying solely on capital gains for investment returns. This underscores the importance of noise trading in cryptocurrencies (Cheung et al., 2015; Fry and Chea, 2016). As noise traders influence prices, sentiment becomes a noisy signal linked to volatility (Brown, 1999). Urquhart (2016) demonstrates that investors often react to Bitcoin’s previous day volatility and trading volume, adjusting their actions accordingly. Since trading activity often stems from noise or Bitcoin hype rather than fundamental analysis, it becomes intertwined with investment sentiments, reflecting the mood of the Bitcoin market driven by herd instinct. The absence of concrete financial fundamentals in valuation, coupled with active investor engagement on social media, positions crypto assets as prime candidates for sentiment analysis and behavioral factor identification (Corbert et al., 2019).
Considerable attention has been dedicated to constructing both theoretical and empirical models to better understand cryptocurrencies. However, there is an ongoing debate concerning their role—whether cryptocurrencies should be viewed as speculative investment assets that are not subject to traditional valuation methodologies or as virtual digital currencies based on blockchain technology. Yermack (2015) concludes that Bitcoin resembles a speculative investment rather than a currency. In contrast, von Luckner et al. (2021) show that Bitcoin is used as a medium of exchange, though its transaction motive is negligible compared with its asset motive. Bolt and Van Oordt (2020) demonstrate that the price of a cryptocurrency can be explained by both speculative investment motives and classical currency functions. Their model consists of two building blocks: one representing speculative motives and another based on two-sided market theory, where consumers and merchants employ virtual currency as a payment mechanism. Consequently, the equilibrium price of a cryptocurrency is determined by both speculative and transactional components.
We investigate whether investor sentiment expressed on the Reddit forum r/Bitcoin serves as a behavioral factor capturing herd instincts among individual cryptocurrency investors. We also develop a Herd Behavior Index (HI) derived from natural language processing (NLP) of Reddit posts, quantifying collective buy and sell tendencies. Our analysis examines whether HI predicts cryptocurrency portfolio returns—both in-sample and out-of-sample—and whether this herding behavior produces short-term market anomalies.
Our study contributes to the literature on cryptocurrency returns by examining the time-varying relationship between these returns and investors’ herd instincts. Our findings reveal the significant impact of herd behavior, as seen in Reddit discussions, on the digital currency market. Strong positive herd instincts often precede increased transaction volumes and price upticks, while strong negative herd instincts tend to occur before volumes and prices drop. This insight can help traders understand digital currency anomalies and implement the effective long and short equity trading strategies. Additionally, it can assist policymakers in taking preemptive actions to prevent market panic, mitigate systemic risks, and avoid the spread of panic to other markets. It also highlights the importance of regulatory oversight and due diligence to control market volatility.
Literature review
The empirical literature on herd instincts or herd behavior has identified what factors lead large groups of people to follow the actions of others or perceived market professionals. Christie and Huang (1995) suggest that the cross-sectional standard deviation of stock returns (CSSD) can be used to detect herding behavior. If herding exists, stock returns tend to cluster around the market consensus, as investors lacking analytical skill follow the information flow. In contrast, rational asset pricing models predict increasing dispersion, as individual stock returns diverge from the market return depending on their sensitivities. Following Christie and Huang (1995), many studies (e.g., Chang et al., 2000; Chen, 2013; Chiang and Zheng, 2010; Hwang and Salmon, 2004) modify the CSSD method to detect herding across different markets. Schmeling (2009) uses consumer confidence as a proxy for investor sentiment and finds that sentiment predicts expected returns across industrialized countries, with different cultural tendencies for herding.
Researchers have also examined speculative motives to explain price variation through investor attention proxies derived from online data sources such as the Google Search Volume Index (GSVI), Wikipedia visits, newspapers, and social media (Li et al., 2021, 2022; Liu & Tsyvinsky, 2021; Shen et al., 2019, 2022). Using both econometric and machine learning models (Chen et al., 2021; Liu & Tsyvinsky, 2020), previous studies predict cryptocurrency returns with characteristic variables and sentiment proxies. These studies show that fundamental proxies—such as computing power, network size, and blockchain technology—are insufficient to capture variations in cryptocurrency returns, while investor sentiment proxies have strong explanatory power. For instance, Liu and Tsyvinsky (2020) document a time-series momentum effect that investor attention can explain. Although prior research has established the predictive power of sentiment, it has not examined whether investor attention drives herd-like trading behavior leading to market anomalies. This study fills that gap.
In behavioral finance, speculative sentiment is often cited as a driver of price deviations from fundamental values (Baker and Wurgler, 2007; De Long et al., 1990; Shefrin, 2008). Two broad approaches exist for studying sentiment. The first uses survey-based indicators such as the bearish sentiment index, the American Association of Individual Investors (AAII) Sentiment Survey, Wall Street strategist outlooks, and the Investor Intelligence survey (Brown, 1999; Fisher and Statman, 2002; Solt and Statman, 1988). The second approach relies on text-based sentiment analysis using natural language processing (NLP) and word dictionaries to detect tone in disclosures, media, and online communications (García, 2013; Jiang et al., 2019; Loughran and McDonald, 2011; Tetlock, 2007). These methods have shown that sentiment influences prices, returns, and volatility (Kearney and Liu, 2014).
Reddit has emerged as a powerful medium for capturing real-time investor sentiment. Burnie and Yilmaz (2019) show that Reddit discussions significantly influence investor behavior. The “GameStop (GME) short squeeze” episode in January 2021, which saw GameStop’s price rise by 1,500% within two weeks (Anand and Pathak, 2022), exemplifies how coordinated actions on Reddit (e.g., r/wallstreetbets) can drive substantial market movements. Given its large and active user base, Reddit’s r/Bitcoin community provides an ideal setting to study herd instincts in cryptocurrency markets. Posts and responses from users (“redditors”) who closely follow cryptocurrency news and prices create an information environment particularly suited to measuring collective investor sentiment (Burnie and Yilmaz, 2019).
Hypothesis development
Herd instinct refers to investors’ tendency to imitate others’ actions, leading to correlated trading and a lack of independent decision-making. In the context of cryptocurrencies—where valuation fundamentals are limited and social media amplifies sentiment—this behavior is especially pronounced. According to Fisher and Statman (2002), individual investors’ sentiment and media tone often diverge from professional analysts’ views, suggesting that platforms like Reddit reveal retail investors’ genuine psychology.
This study tests whether sentiment expressed in the Bitcoin subreddit (r/Bitcoin) can be used as a psychological and behavioral factor to detect herd behavior among individual cryptocurrency investors. Using NLP-based machine learning, we extract qualitative information from Reddit posts and compute normalized herd behavior scores ranging from
Given that herd behavior is typically short-lived, we analyze how cryptocurrency returns respond abnormally within days following a collective buy or sell signal from the HI. Our findings reveal that a positive HI is followed by significant next-day increases in cryptocurrency returns, while a negative HI precedes declines. To explore this lead–lag relationship, we employ Impulse Response Functions (IRF) using the local projection method of Jordà (2005) and wavelet analysis (Rua and Nunes, 2009), which jointly capture time and frequency dynamics. Both analyses show that positive (negative) sentiment on r/Bitcoin leads to corresponding rises (drops) in trading volume and returns over short horizons.
Prior studies offer mixed views on cryptocurrency predictability. Schilling and Uhlig (2019) argue that cryptocurrency prices follow a martingale process, implying unpredictability. However, others find that investment attention (e.g., Google Search Volume Index) and momentum (Cong et al., 2021; Liu and Tsyvinski, 2021; Sockin and Xiong, 2023) can predict prices. Building on this literature, we construct a predictive model using principal component factors derived from lagged cryptocurrency prices, GSVI, and HI. Our results show that incorporating HI substantially improves forecast accuracy for future returns. Using the out-of-sample test of Welch and Goyal (2008), we confirm that our model outperforms the historical mean benchmark. Furthermore, a simple long–short trading strategy based on HI generates notable cumulative profits over 310 trading days (March 27, 2021–January 30, 2022), even after accounting for a 1% transaction cost.
Taken together, we hypothesize that sentiment expressed on r/Bitcoin captures the collective mood of cryptocurrency investors and drives herd-like trading behavior. Using NLP-based sentiment analysis, we construct a Herd Behavior Index (HI) ranging from Hypothesis 1: The Herd Behavior Index (HI) significantly predicts future cryptocurrency returns. Hypothesis 2: Positive (negative) herding sentiment leads to higher (lower) subsequent returns within short time horizons. Hypothesis 3: Incorporating HI into a predictive factor model improves the out-of-sample forecast accuracy of cryptocurrency returns.
To test these hypotheses, we analyze the short-term lead–lag relationship between HI and cryptocurrency returns using impulse response functions (IRFs; Jordà, 2005) and wavelet analysis (Rua and Nunes, 2009), which jointly capture time–frequency dynamics. Furthermore, we validate the predictive power of HI in both in-sample and out-of-sample frameworks and evaluate a trading strategy based on HI signals.
Our findings contributes to the literature on cryptocurrency returns by indicating that the HI effectively captures investors’ congregate behavior and explains abnormal cryptocurrency returns. The results provide insights for traders seeking to exploit market anomalies, for policymakers aiming to mitigate systemic risks, and for regulators concerned with market stability. The remainder of this paper proceeds as follows. Section “Research Data and Variables” describes the data and sentiment extraction from Reddit posts. Section “Empirical Results” presents the in-sample analysis. Section “Out-of-Sample Analysis” reports forecasting and trading performance, and Section “Conclusion” concludes.
Research data and variables
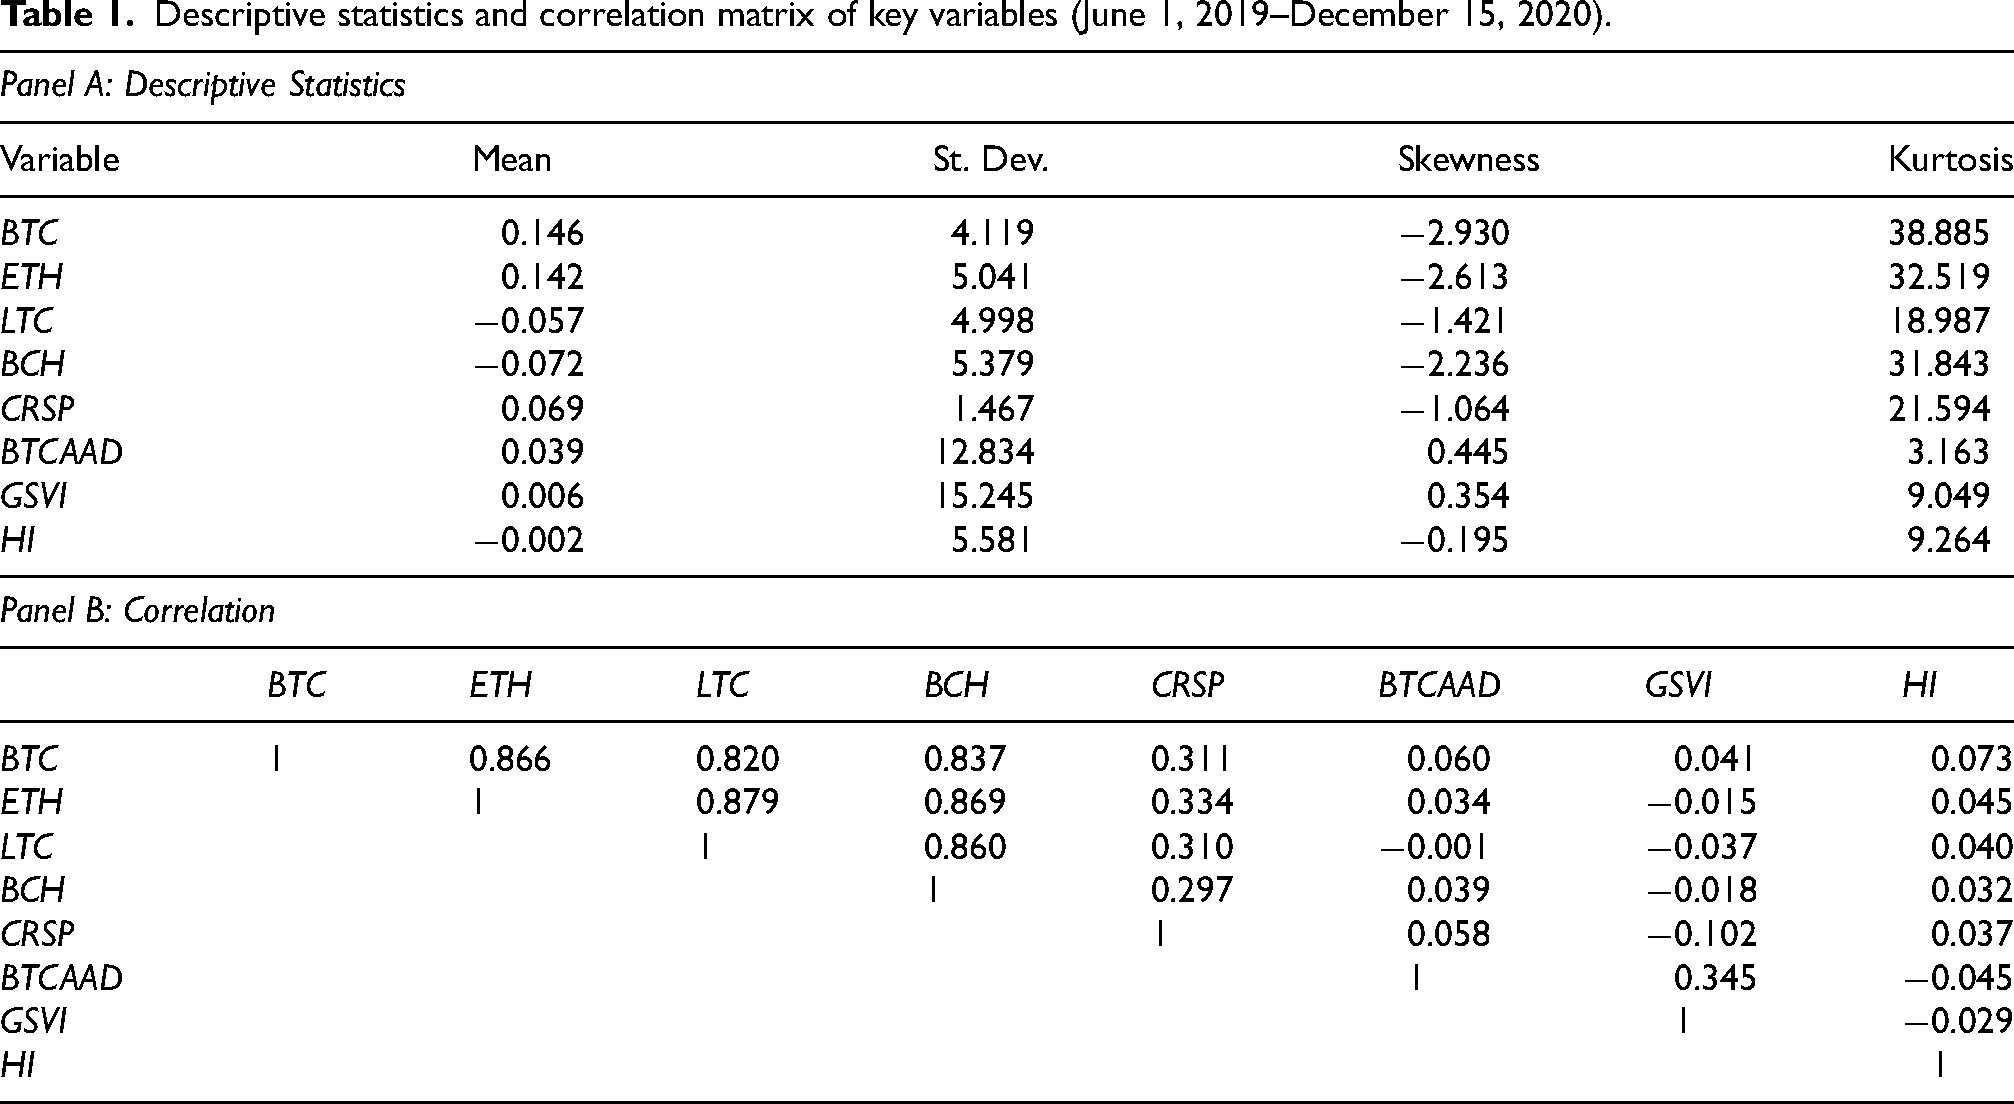
The cryptocurrency price data for this research are daily level data obtained from TradingView 1 as suggested by Gerritsen et al. (2022) and Zeitun et al. (2023). We create our research dataset by selecting the top four cryptocurrencies based on historical market capitalization. Bitcoin (BTC), Ethereum (ETH), Litecoin (LTC), and Bitcoin cash (BCH) are chosen based on the value of transactions—the price times its transaction volume on average. Unit prices are measured in US dollars, and the return is measured by the first difference of the log. Specifically, the daily return is calculated by the log of the price at 11:59:59 UTC yesterday and that of the price at 11:59:59 UTC today. Table 1 presents the descriptive statistics for the daily price and return values of cryptocurrencies, as well as the correlations between these variables. The data covers the timeframe from June 1, 2019 to December 15, 2020. 2
Descriptive statistics and correlation matrix of key variables (June 1, 2019–December 15, 2020).
In order to measure the demand for Bitcoin as a means of payment or transfer of funds, we utilize the metric of active addresses of Bitcoin (BTCAAD) to proxy the network effect of cryptocurrency adoption (Cong et al., 2021; Liu and Tsyvinski, 2021; Pagnotta and Buraschi, 2018). This metric is defined as the summation count of unique addresses that have been active during the network interval, whether as recipients or originators of a ledger change. 3
Furthermore, we incorporate the CRSP U.S. Total Market index as an explanatory variable for cryptocurrencies, given that comparisons between the cryptocurrency market and the stock market are commonly explored in the existing literature (Ciaian et al., 2016; Halaburda et al., 2022; Liu and Tsyvinski, 2021). To address the issue of missing data on holidays and weekends, we replace the gaps with the preceding available values. This ensures that the CRSP index is presented at a daily frequency and allows for consistent analysis alongside the cryptocurrency data.
We incorporate GSVI (Google Search Volume Index) into our analysis, drawing from prior research. For example, Nepp and Karpeko (2024) show that when there’s a notable surge in Bitcoin-related Google searches, indicating increased interest or hype around Bitcoin, it tends to drive up the price of Bitcoin. This effect corresponds to the description of the ‘collective hysteria’ that spread in the online community and was triggered by the increasing volatility of the Bitcoin market. Kristoufek (2013) highlights a stronger correlation between Google search volume and cryptocurrency returns, while Bleher and Dimpfl (2019) establish a connection with volatility. Liu and Tsyvinski (2021), along with Liu et al. (2021), demonstrate that individual coin Google searches serve as an alternative gauge for investor attention. This measure directly reflects investor interest in individual coins and bypasses the potentially unreliable volume data in the cryptocurrency market. 4
Additionally, to examine how movements in the entire crypto market affect crypto portfolio returns, we employ Principal Component Analysis (PCA) to extract a proxy for the cryptocurrency market. As documented by Baek et al. (2015), the first factor extracted using PCA on stock returns typically captures the common variation among stocks in the market, reflecting shared movements or patterns across the entire market portfolio. This factor is commonly referred to as the “market factor” or “systematic risk factor.” Similarly, Aslandis et al. (2022) utilize PCA to assess cryptocurrency market linkages and find that the first component sufficiently represents the dynamics of the entire cryptocurrency market. Shah et al. (2021) demonstrate that the first component derived from PCA is adequate for constructing the cryptocurrency index. Additionally, Liu et al. (2021) highlight its predictive power in forecasting cryptocurrency returns.
In addition, we incorporate Reddit posts from the Bitcoin forum, r/Bitcoin, as a means of proxy for investor attention and herd behavior (Long et al., 2023). Through observing the abnormal movements of equity and digital currency prices in the context of the GME short squeeze event, 5 it has been demonstrated that textual information found in Reddit communities can be informative in explaining such price movements. With a subscriber base of 1.5 million as of June 2020, r/Bitcoin provides a platform for the expression of investor sentiment and opinion, leading to potential herd behavior among its members. Therefore, we examine the content of Reddit posts to construct models of cryptocurrency returns, as the collective actions of individuals within the cryptocurrency investment space can be influenced by the information conveyed in such posts.
To create comprehensive and large-scale research data, we implemented machine learning textual analysis techniques and amassed a corpus of 58,232 Reddit posts spanning a duration of 564 days, commencing on June 1st, 2019, and concluding on December 15th, 2020. At a daily frequency, our dataset is representative of the cryptocurrency community’s collective sentiments and actions, encompassing an average of 103.25 posts per day. Each post consists of several essential components, including the title, content, karma score, number of comments, and time, which contribute to the overall informative value of the dataset.
To utilize Reddit posts as an explanatory variable, we transform the text into numerical measures. First, we collect the titles of the posts instead of their contents, as many posts lacked valid text.
6
Second, the utilization of the Natural Language Processing (NLP) machine learning methodology is applied for the purpose of text analysis in each individual post. Through this approach, the goal is to extract the sentiment scores that correspond to herd behavior, with values that are within the range of
Examples of reddit post titles and corresponding herd behavior index (HI) scores.
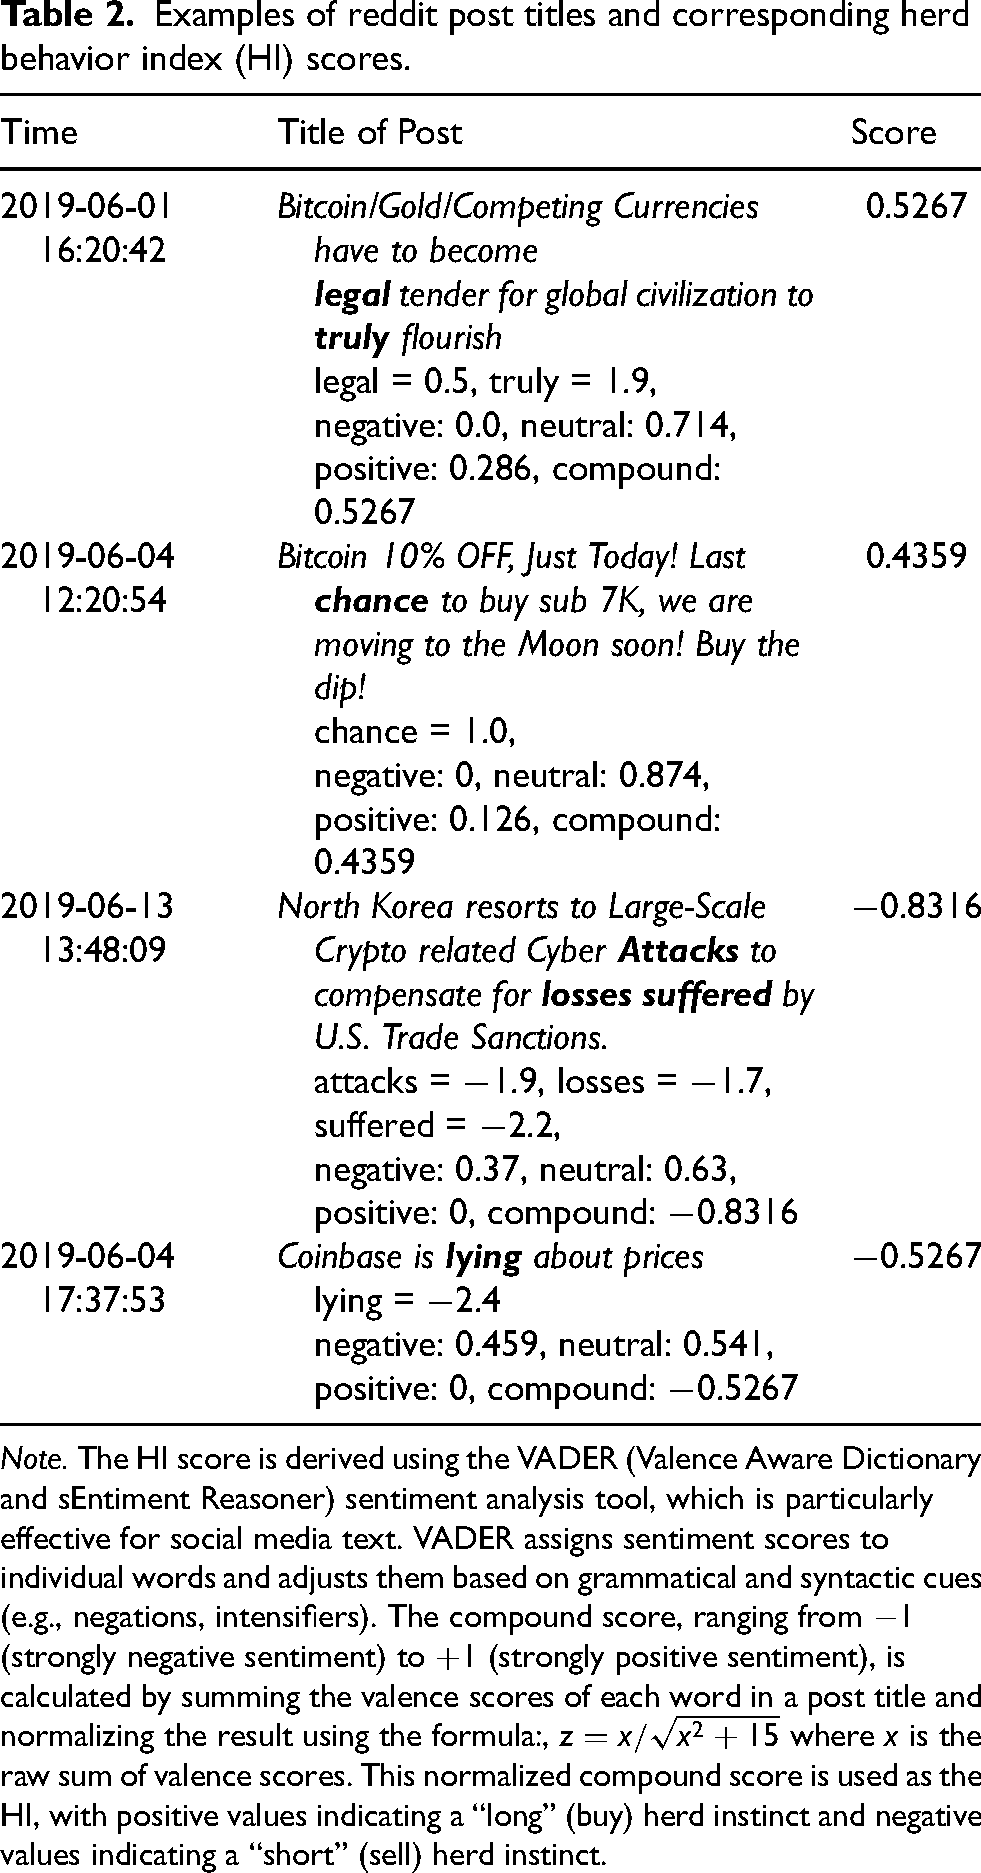
Note. The HI score is derived using the VADER (Valence Aware Dictionary and sEntiment Reasoner) sentiment analysis tool, which is particularly effective for social media text. VADER assigns sentiment scores to individual words and adjusts them based on grammatical and syntactic cues (e.g., negations, intensifiers). The compound score, ranging from
Figure 1 illustrates the distribution of the Herd Behavior Index (HI) derived from Reddit posts. The histogram reveals a clear bimodal pattern, indicating two dominant sentiment clusters among investors: one with strong positive (buying) sentiment and another with strong negative (selling) sentiment. This separation supports the hypothesis that investor sentiment in cryptocurrency markets is polarized, reinforcing the presence of herd behavior. The absence of a central peak around zero further suggests that neutral sentiment is relatively rare, highlighting the emotionally charged nature of crypto discussions on social media.
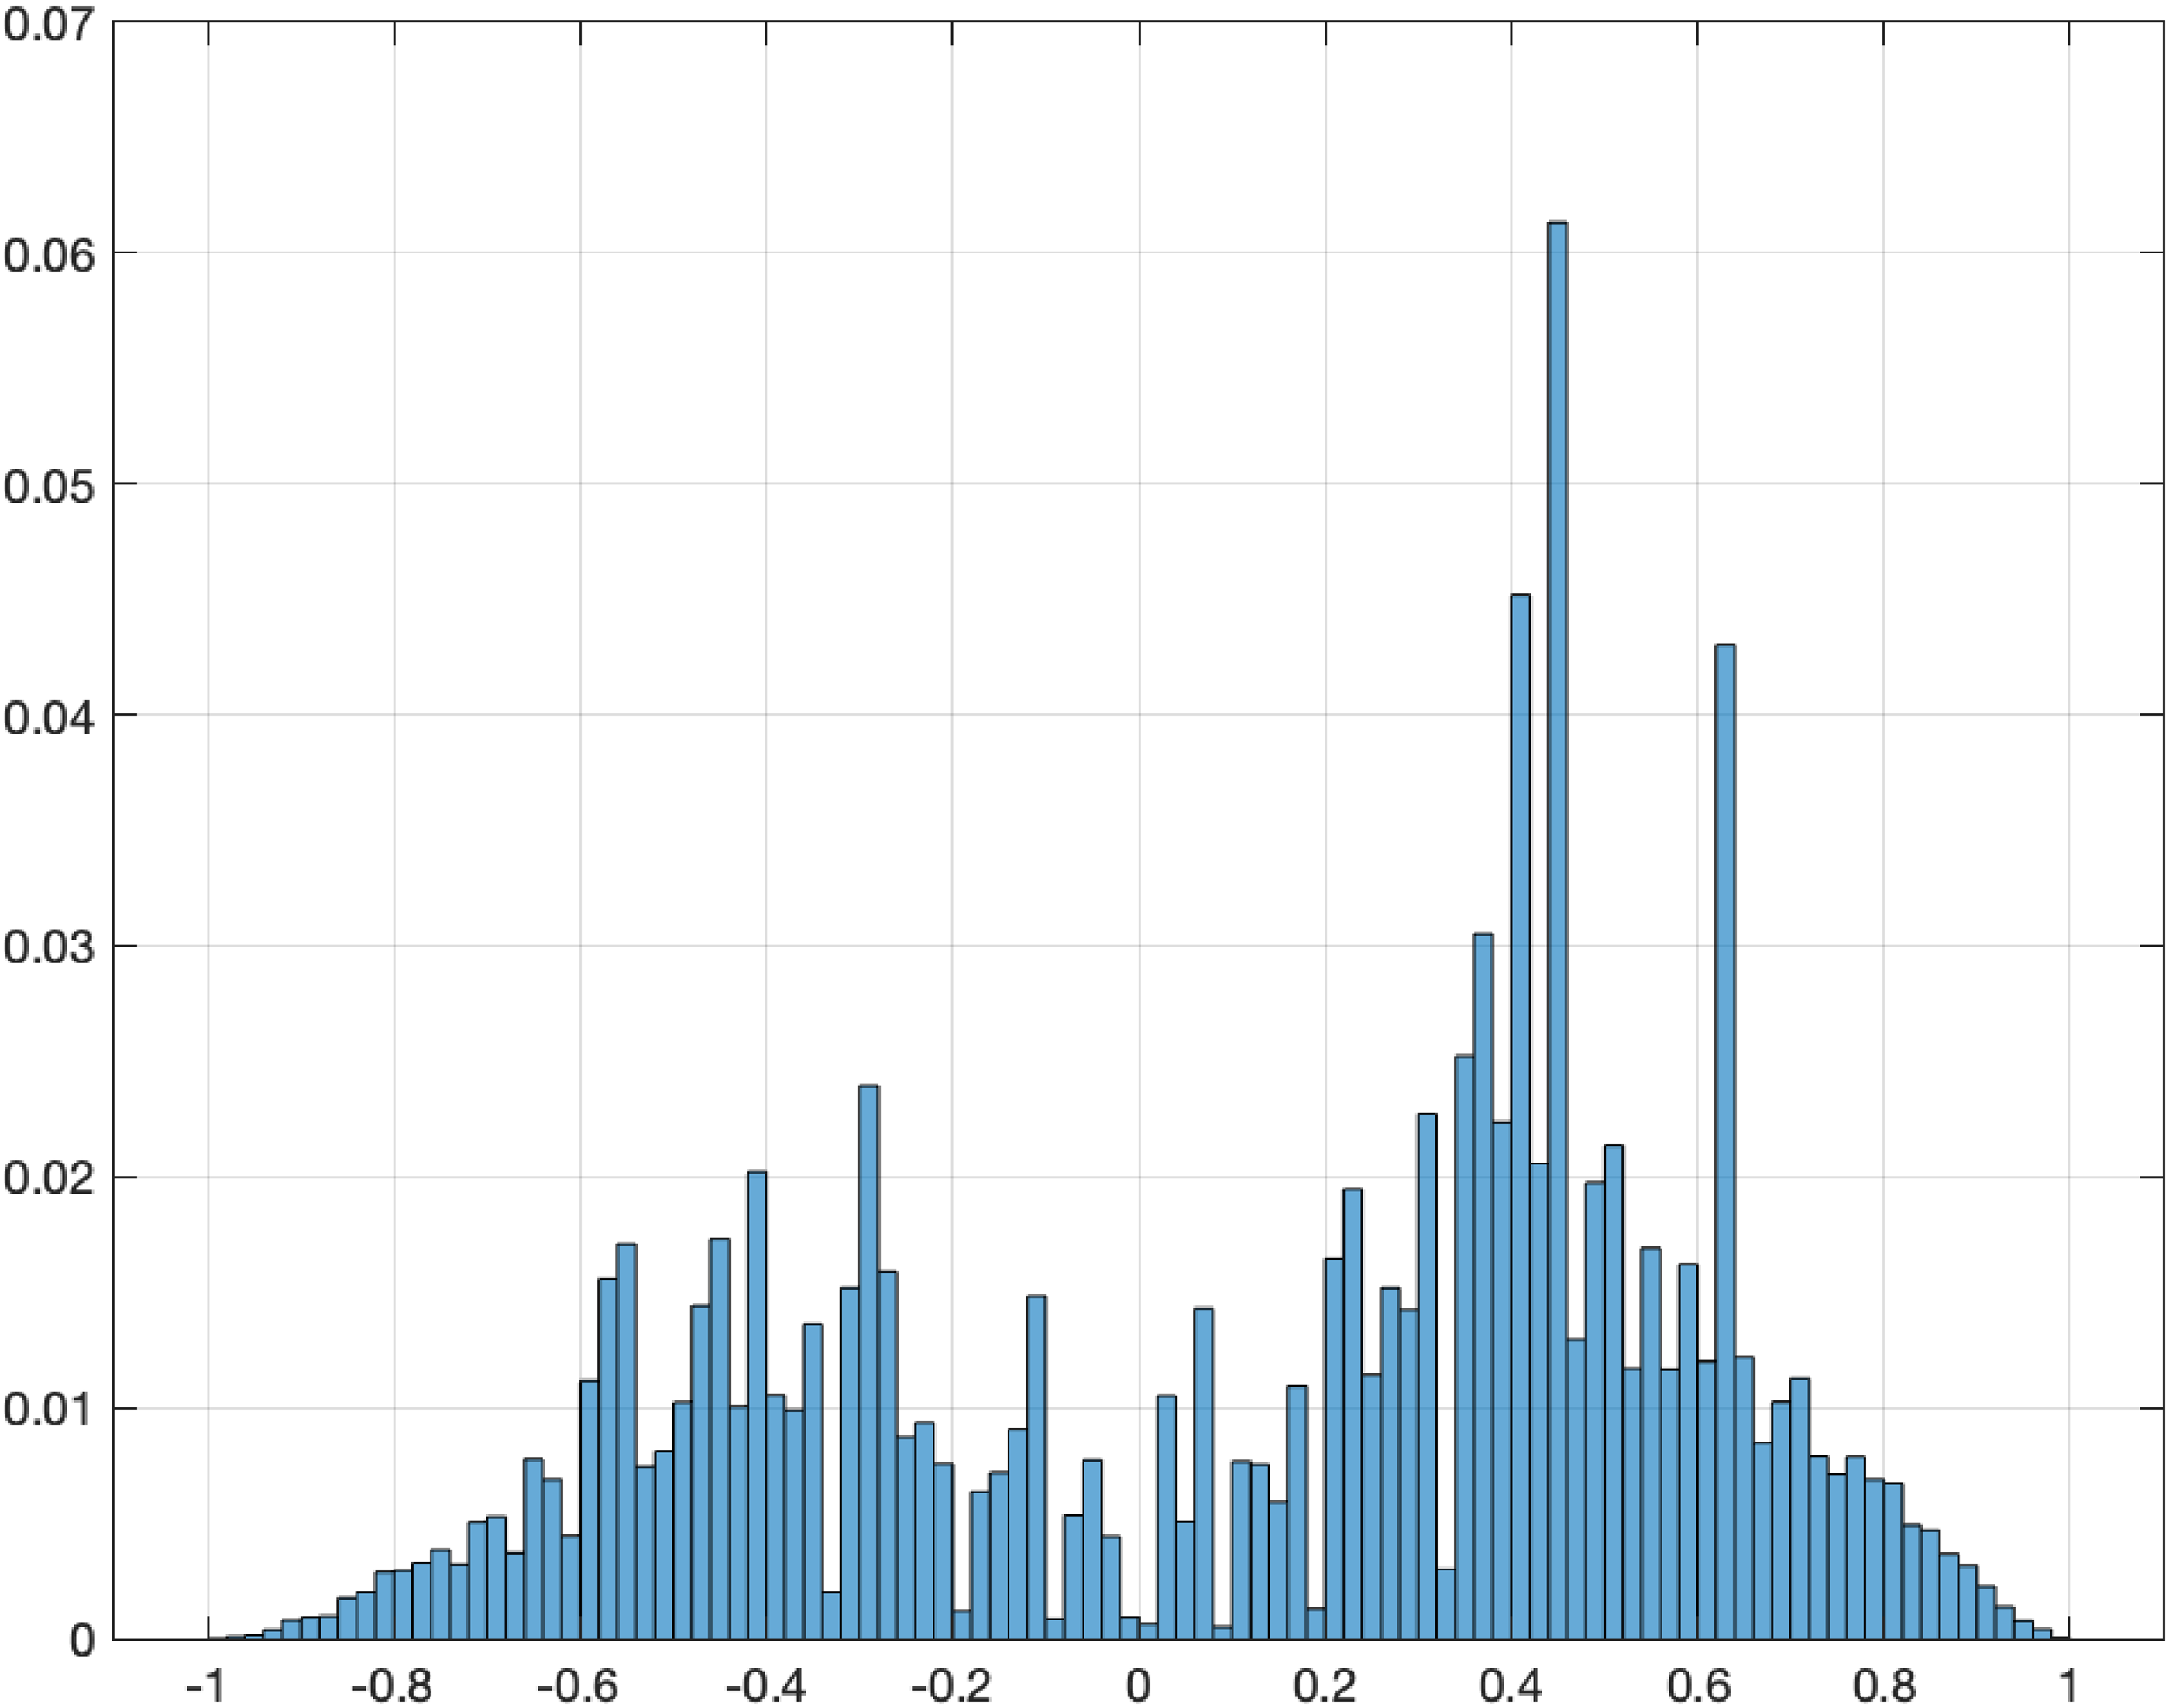
Distribution of herd behavior indicators. This figure reports the histogram of the herd behavior index (i.e., HI), for the sentiment strength from the Bitcoin community (r/Bitcoin). The score ranges from
Table 3 exhibits the mean and median values of HI. It shows that in the sample period, the cryptocurrency market has garnered more optimistic views on the digital currency markets than negative views. Specifically, there are 17,316 (63.9% of Total observations) positive perspectives on the market compared to 9,783 (36.1% of total observations) negative projections. The test statistic for the mean difference between positive HI and negative HI is 4.39, which rejects the null hypothesis of mean equivalence. Similarly, the Wilcoxon signed ranked test is 27.39, which rejects the null hypothesis of median equivalence between two perspectives at a significance level of 1%. Therefore, we find that the quantitative score is helpful to classify two distinct perspectives on digital currency investments.
Distribution of positive and negative herd behavior index (HI) scores.
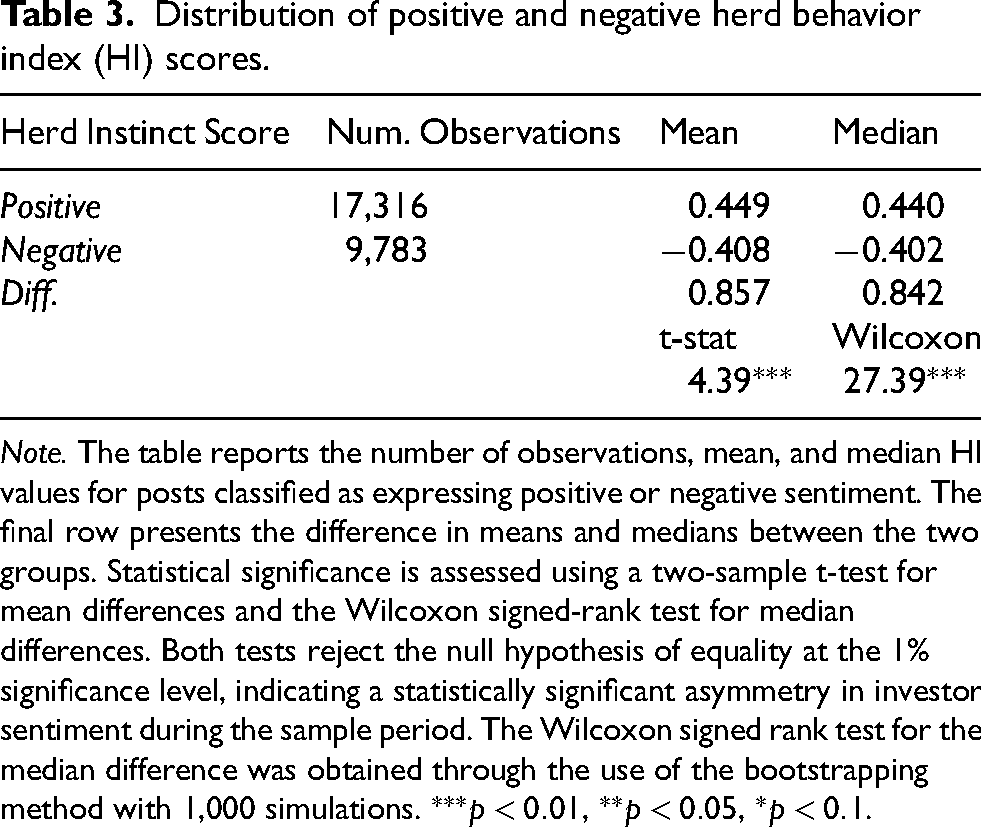
Note. The table reports the number of observations, mean, and median HI values for posts classified as expressing positive or negative sentiment. The final row presents the difference in means and medians between the two groups. Statistical significance is assessed using a two-sample t-test for mean differences and the Wilcoxon signed-rank test for median differences. Both tests reject the null hypothesis of equality at the 1% significance level, indicating a statistically significant asymmetry in investor sentiment during the sample period. The Wilcoxon signed rank test for the median difference was obtained through the use of the bootstrapping method with 1,000 simulations.
Does HI detect herd behavior?
We wonder whether the developed HI in this paper can truly reflect herd behavior. How is the textual analysis HI related to herd behaviors? To answer these questions, we run auxiliary tests using herd behavior detection models following Christie and Huang (1995), Chang et al. (2000), Bouri et al. (2019), Li et al. (2022), and Wanidwaranan and Padungsaksawasdi (2022) to examine whether HI can reflect herd behavior using the cross-sectional standard deviation (CSSD). The detection model for our empirical test is specified in the following form:
As shown in Table A1, the results reject the null hypothesis for both the equal-weighted portfolio and the transaction-value-weighted portfolio. As suggested by Christie and Huang (1995) and Chang et al. (2000), a negative value of the coefficient
Empirical results
Regressions of currency portfolio returns
Previously, research has aimed to construct predictive models for a digital asset return by incorporating other digital currencies’ asset returns, notwithstanding multicollinearity issues between a certain cryptocurrency price and another cryptocurrency price. However, as demonstrated in Table 1, the returns of cryptocurrencies are highly positively correlated with each other. The presence of a strong correlation between independent variables can potentially compromise the statistical significance of explanatory variables by introducing numerical instability of the prediction model. To cope with the issue of multicollinearity, we utilize principal components analysis (PCA) to reduce the dimensionality of the data into a lower space. This allows us to extract a parsimonious and significant latent factor that captures the common variance among cryptocurrency returns.
Table 4 displays the first and second principal components extracted from four digital currencies. Interestingly, the first component values for each variable range from 0.49 to 0.51 and share the same positive signal. Since it indicates that all digital currency prices are positively influenced by the first factor, we view it as the cryptocurrency market risk factor (CRMK, hereafter) following Loretan (1997). In the third column of Table 4, BTC and ETH have positive loading values, while LTC and BCH show negative loading values. BTC and ETH are quoted with a large unit price per token cryptocurrency assets. In contrast, LTC and BCH are quoted a small unit price per token. Thus, we name the second principal factor a size factor. Although both factors are meaningful, the first factor accounts for approximately 89% of the total variance, whereas the second factor marginally contributes to explaining variance (i.e. 5%). Therefore, to design our empirical model parsimoniously, we decide to use the currency market risk factor.
Principal component loadings for four major cryptocurrencies.
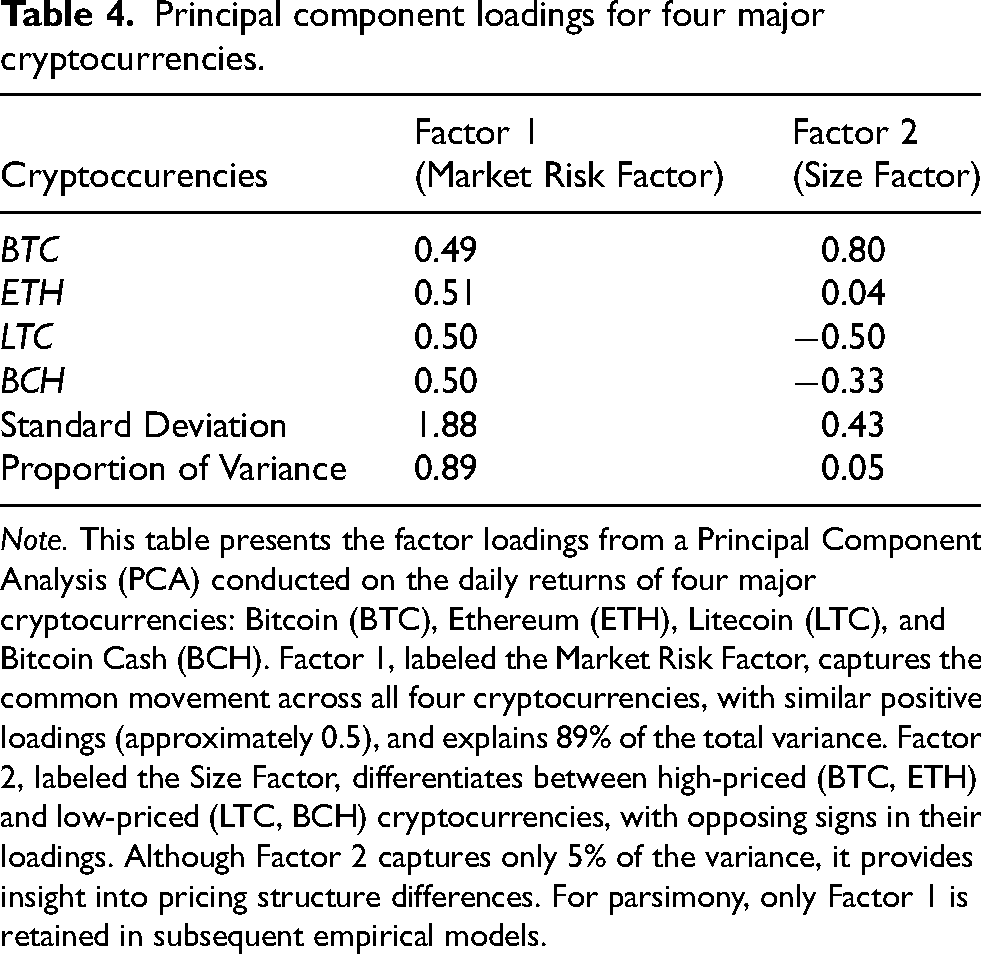
Note. This table presents the factor loadings from a Principal Component Analysis (PCA) conducted on the daily returns of four major cryptocurrencies: Bitcoin (BTC), Ethereum (ETH), Litecoin (LTC), and Bitcoin Cash (BCH). Factor 1, labeled the Market Risk Factor, captures the common movement across all four cryptocurrencies, with similar positive loadings (approximately 0.5), and explains 89% of the total variance. Factor 2, labeled the Size Factor, differentiates between high-priced (BTC, ETH) and low-priced (LTC, BCH) cryptocurrencies, with opposing signs in their loadings. Although Factor 2 captures only 5% of the variance, it provides insight into pricing structure differences. For parsimony, only Factor 1 is retained in subsequent empirical models.
To investigate the predictability of the explanatory variables for cryptocurrency returns, we employ two portfolios with the four cryptocurrencies (BTC, ETH, LTC, and BCH) as dependent variables: the Equally-Weighted Portfolio (EWP) with an equal weight of 1/4 assigned to each cryptocurrency on a daily basis, and the Transaction-Value-Weighted Portfolio (TVWP), which constructed based on each daily fraction of the respective daily cryptocurrency transaction value over total daily transaction value.
Crypto assets are speculative in nature, as investors typically cannot ascertain their fundamental values. Consequently, active investment strategies that rely on selecting assets based on their fundamentals may not be necessary. To evaluate the performance of cryptocurrency investors, we hypothesize that they adopt a passive investment approach by constructing portfolios, such as the Equal Weighted portfolio and the Transaction Volume Weighted portfolio.
The Equally Weighted Portfolio assigns equal weights to each asset in the portfolio, irrespective of their transaction value or trading volume. This approach offers a straightforward and transparent method for constructing a crypto asset portfolio, not fully reflecting the market’s dynamics and trading activity.
On the other hand, the Transaction Volume Weighted Portfolio assigns weights to assets based on their trading volumes, meaning assets with higher trading volumes receive greater weight in the portfolio. This approach captures the market’s trading activity more accurately but may introduce complexity and be less easily interpretable than the equally weighted approach.
In short, by examining both EWP and TVWP as dependent variables, we investigate how herd behavior influences the fluctuation of crypto investors’ portfolio values through two common methodologies. This allows us to evaluate whether herd behavior affects cryptocurrency performance, regardless of whether investors opt for equally weighted or volume weighted approaches.
Table 5 exhibits the regression of cryptocurrency portfolio returns on the currency market risk factor (CRMK), network factor (BTCAAD), investors’ attention (GSVI), and stock market index return (CRSP). The results of the regression of equal-weighted portfolio returns and transaction value-weighted returns on those research variables are summarized in Panel A and Panel B. The regression results suggest that neither network factor nor stock market performance significantly influences cryptocurrency returns. Rather, we find that the currency market risk factor, investors’ attention, and herd behavior indicator affect associations with cryptocurrency portfolio returns. Panel A reveals that equal-weighted portfolio returns are strongly influenced by market-wide movements (CRMK), but more importantly, the Herd Behavior Index (HI) emerges as a significant behavioral predictor. A 1% increase in HI corresponds to a 2.3% rise in portfolio returns, underscoring the impact of investor sentiment on market performance. The portfolio return rises around 1.3% for a 1% increase in the investors’ attention to the cryptocurrency market. Similarly, when looking at model (3) in panel B, the transaction value-weighted portfolio returns are affected by the market risk factor (40.75), herd behavior indicator (1.23), and investment sentiment (0.44). Interestingly, in both panels, the HI slopes are more than 2.2 standard errors from 0, which indicates that the herd behavior indicator clearly contributes to capturing shared variation in EWP and TVWP returns. 9 As Halaburda et al. (2022) documented, the extreme volatility and price increases of cryptocurrencies suggest a potential bubble, with the current prices not reflecting the underlying fundamentals of blockchain technology, permissionless access, and decentralized database management. Various sequential studies have explored the demand for cryptocurrencies as a means of explaining their price (Ante et al., 2021; Benetton and Compiani, 2020). They document that increases in demand for cryptocurrencies can be caused by an expanding user base, speculative expectations of future price appreciation, changing preferences among consumers, increases in income of potential investors, or fluctuations in related currencies and asset prices. Our study hypothesizes that the shock in the demand is due to the speculative expectations of lemming investors who are easily swayed by the irrationality of market price and prone to rely on the information on web investment forum. Thus, we view HI as a proxy for measuring the degree of the herd on an investment decision based on Reddit posts and for effectively capturing shocks in the demand of cryptocurrency investors.
Regressions of equal-weighted and transaction value-weighted portfolio on research variables.
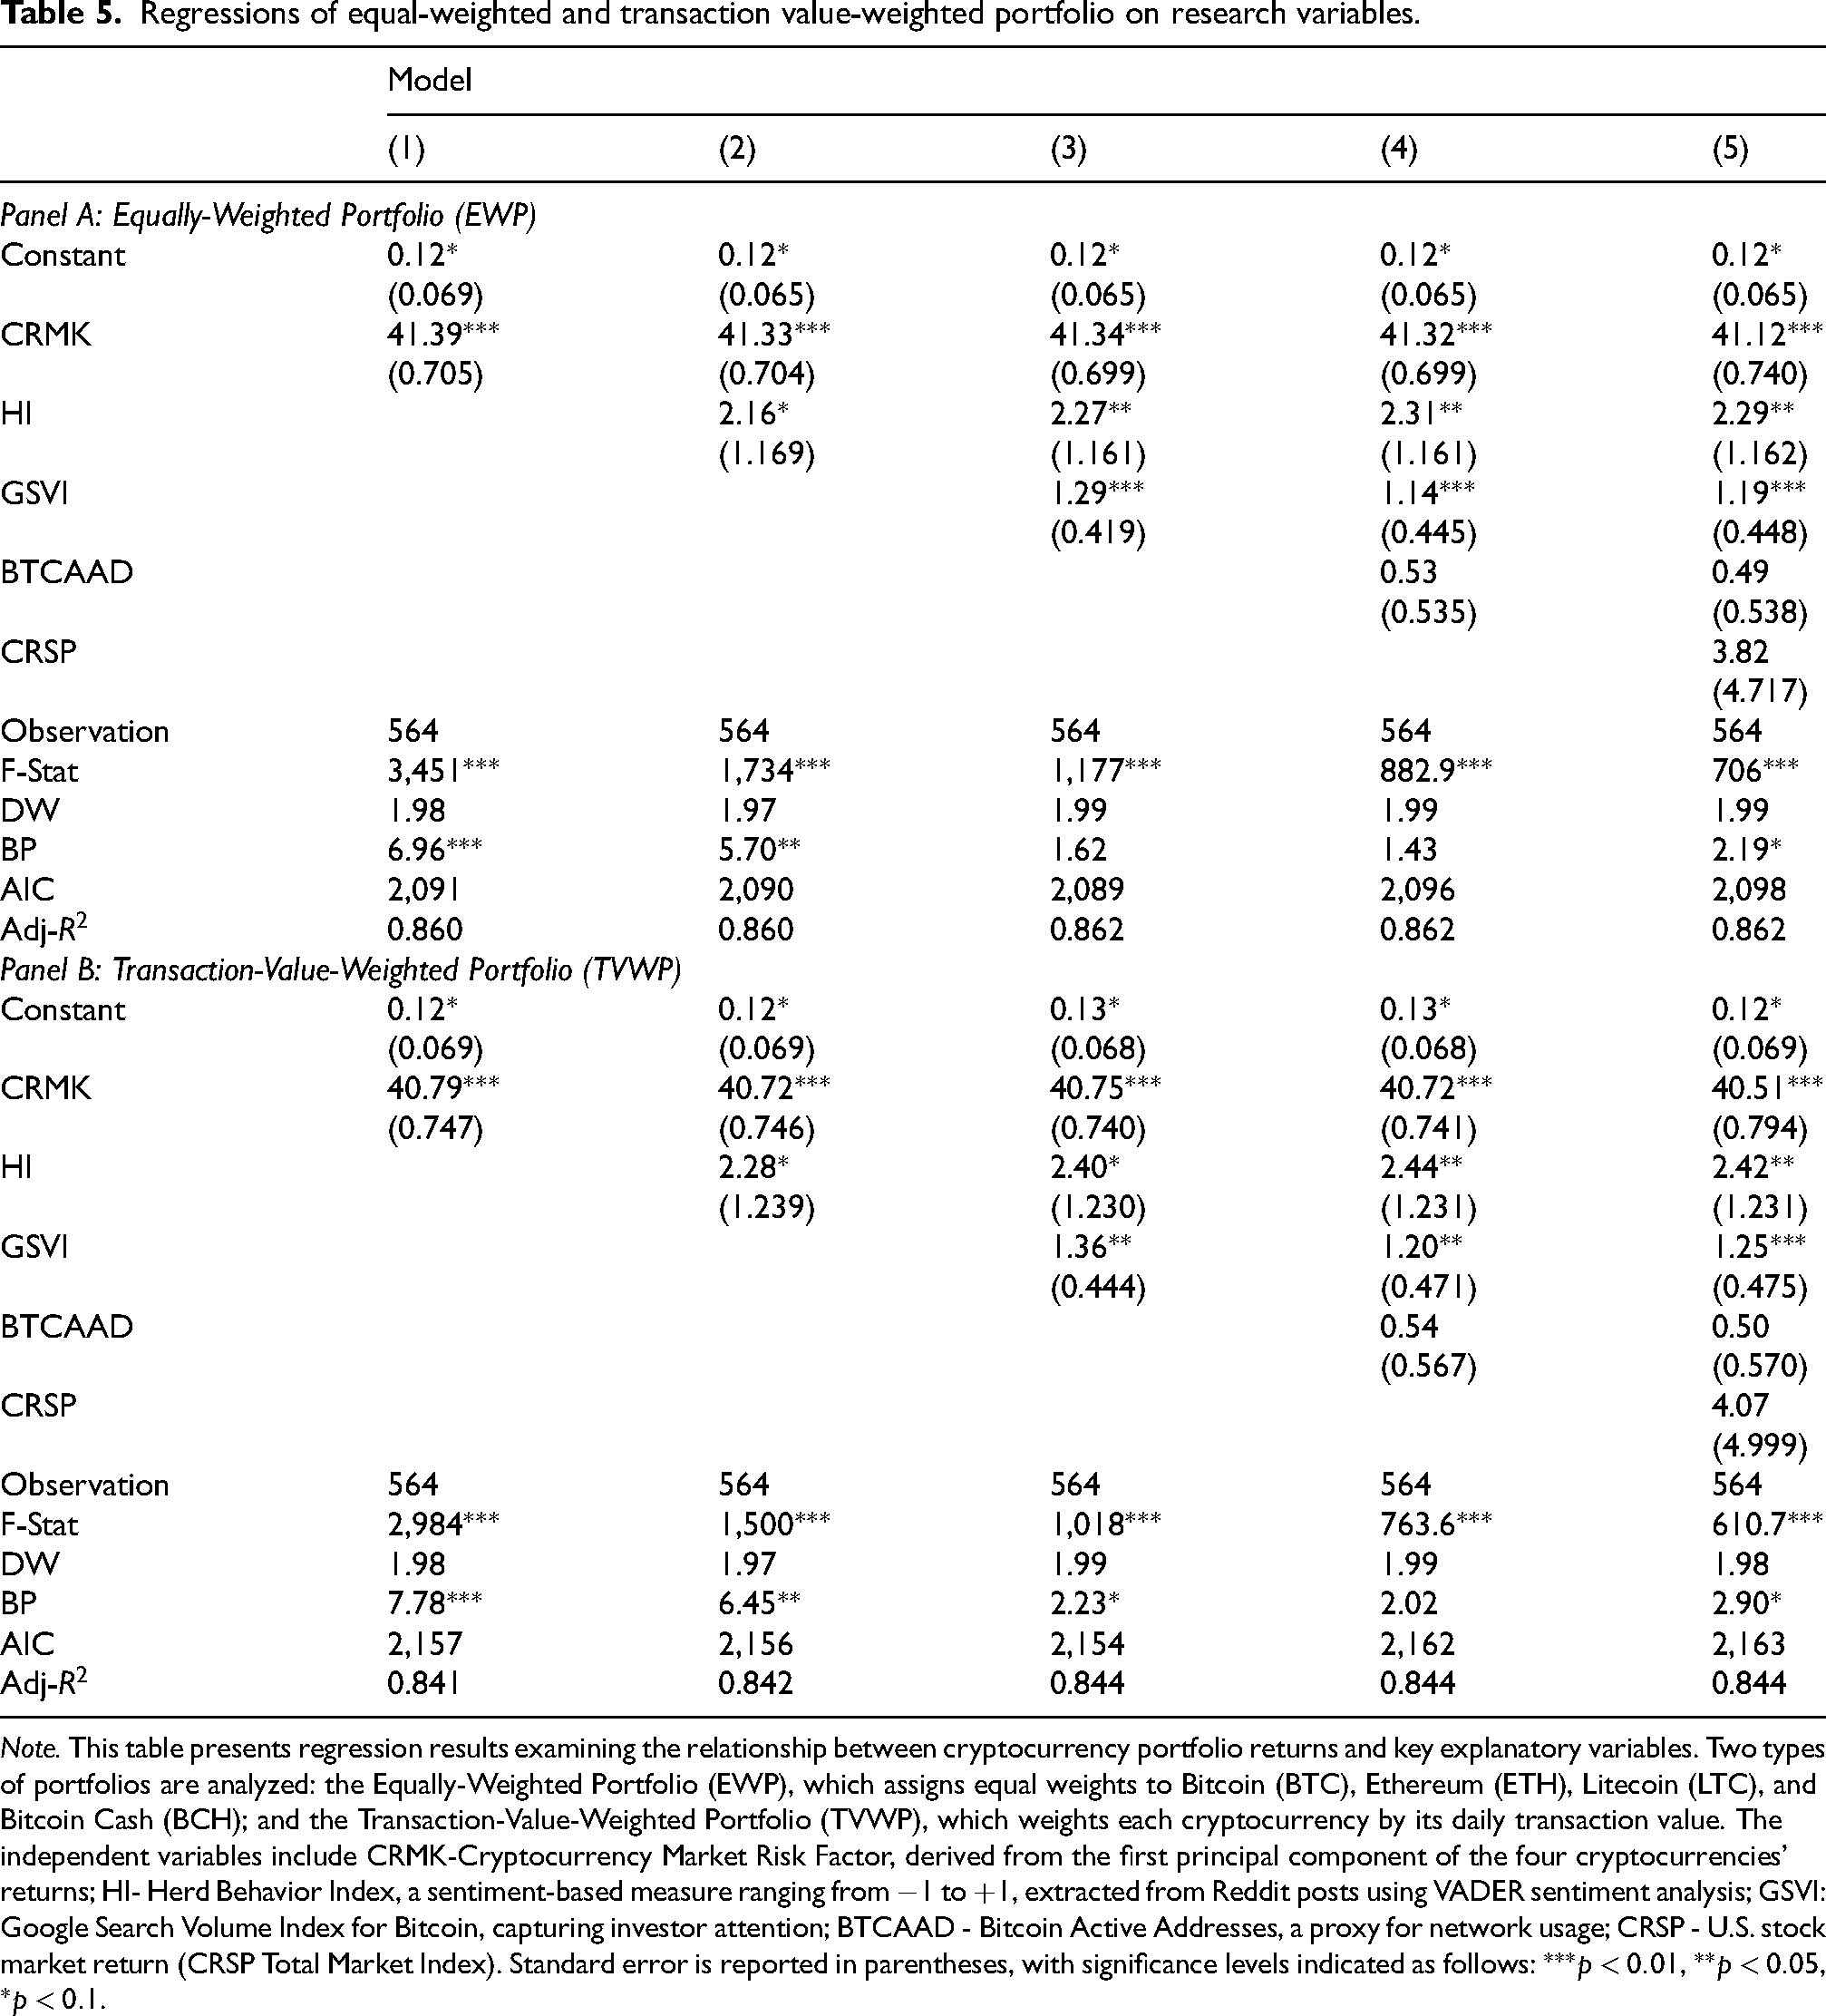
Note. This table presents regression results examining the relationship between cryptocurrency portfolio returns and key explanatory variables. Two types of portfolios are analyzed: the Equally-Weighted Portfolio (EWP), which assigns equal weights to Bitcoin (BTC), Ethereum (ETH), Litecoin (LTC), and Bitcoin Cash (BCH); and the Transaction-Value-Weighted Portfolio (TVWP), which weights each cryptocurrency by its daily transaction value. The independent variables include CRMK-Cryptocurrency Market Risk Factor, derived from the first principal component of the four cryptocurrencies’ returns; HI- Herd Behavior Index, a sentiment-based measure ranging from
Meanwhile, although the analysis demonstrates strong correlations and predictive links between Reddit sentiment and cryptocurrency returns, we further investigate the role of the Herd Behavior Index (HI) to determine whether sentiment influences market outcomes or merely reacts to them. In highly volatile markets like crypto, price fluctuations can quickly influence online discourse, making it challenging to establish the direction of causality. Given this, HI may reflect contemporaneous market commentary rather than act as a genuine leading indicator of returns. To assess the validity of HI, we explore the possibility of reverse causality. Implementing formal Granger causality tests, examining the robustness of lag structures, or applying instrumental variable techniques—such as leveraging exogenous shocks to social media activity—could help clarify whether sentiment holds independent predictive power beyond simply mirroring price movements.
To assess the predictive relationship between the Health Index (HI) and the variables EWP and TVWP, we conducted Granger causality tests using a Vector Autoregression (VAR) model with a lag length of four. Although the Bayesian Information Criterion (BIC) suggests a shorter lag length of 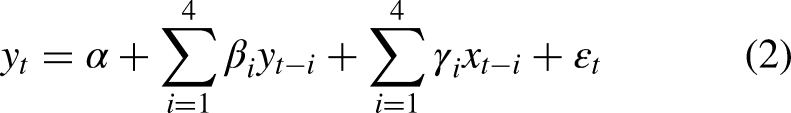
The restricted model under the null hypothesis 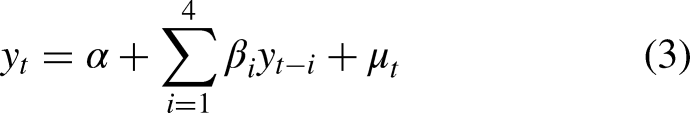
To examine the direction of influence, we test for the Granger causality based on the following null and alternative hypotheses. The null hypothesis that HI does not Granger-cause EWP or TVWP,
Grager causality test.
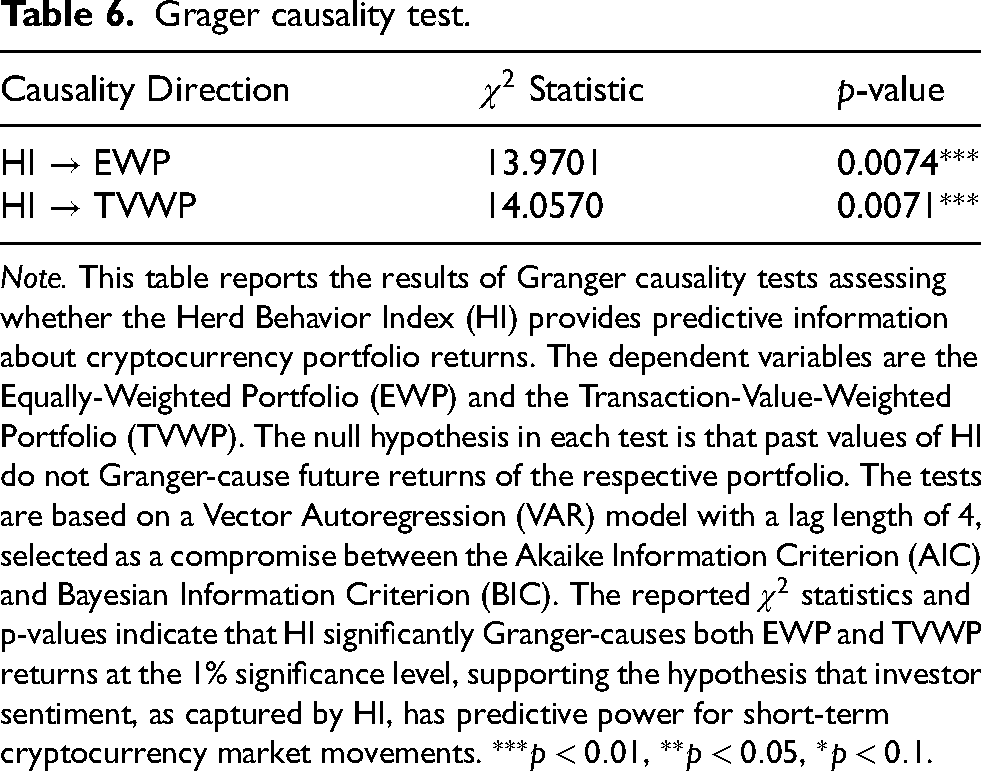
Note. This table reports the results of Granger causality tests assessing whether the Herd Behavior Index (HI) provides predictive information about cryptocurrency portfolio returns. The dependent variables are the Equally-Weighted Portfolio (EWP) and the Transaction-Value-Weighted Portfolio (TVWP). The null hypothesis in each test is that past values of HI do not Granger-cause future returns of the respective portfolio. The tests are based on a Vector Autoregression (VAR) model with a lag length of 4, selected as a compromise between the Akaike Information Criterion (AIC) and Bayesian Information Criterion (BIC). The reported
The results of the Granger causality tests indicate that the Health Index (HI) significantly Granger-causes both EWP and TVWP. Specifically, the
These findings lead to a rejection of the null hypothesis that HI does not Granger-cause EWP or TVWP. This provides strong evidence that past values of HI contain meaningful information that enhances the prediction of both EWP and TVWP.
Variable selection and model validity
When examining the AIC, DW, and Breusch-Pagan (BP) statistics for heteroscedasticity, autocorrelation, and redundant variables in Table 5, we find that the DW values for all five models for EWP and TVWP are close to 2, indicating no autocorrelation in the residuals. Except for models (4) for both EWP and TVWP, all Breusch-Pagan test results are statistically significant at the 5 percent level, indicating the presence of homoscedasticity. Additionally, for both EWP and TVWP, model (3) has the lowest AIC value. Therefore, considering the diagnostic statistics, we recommend model (3) due to its superior goodness of fit.
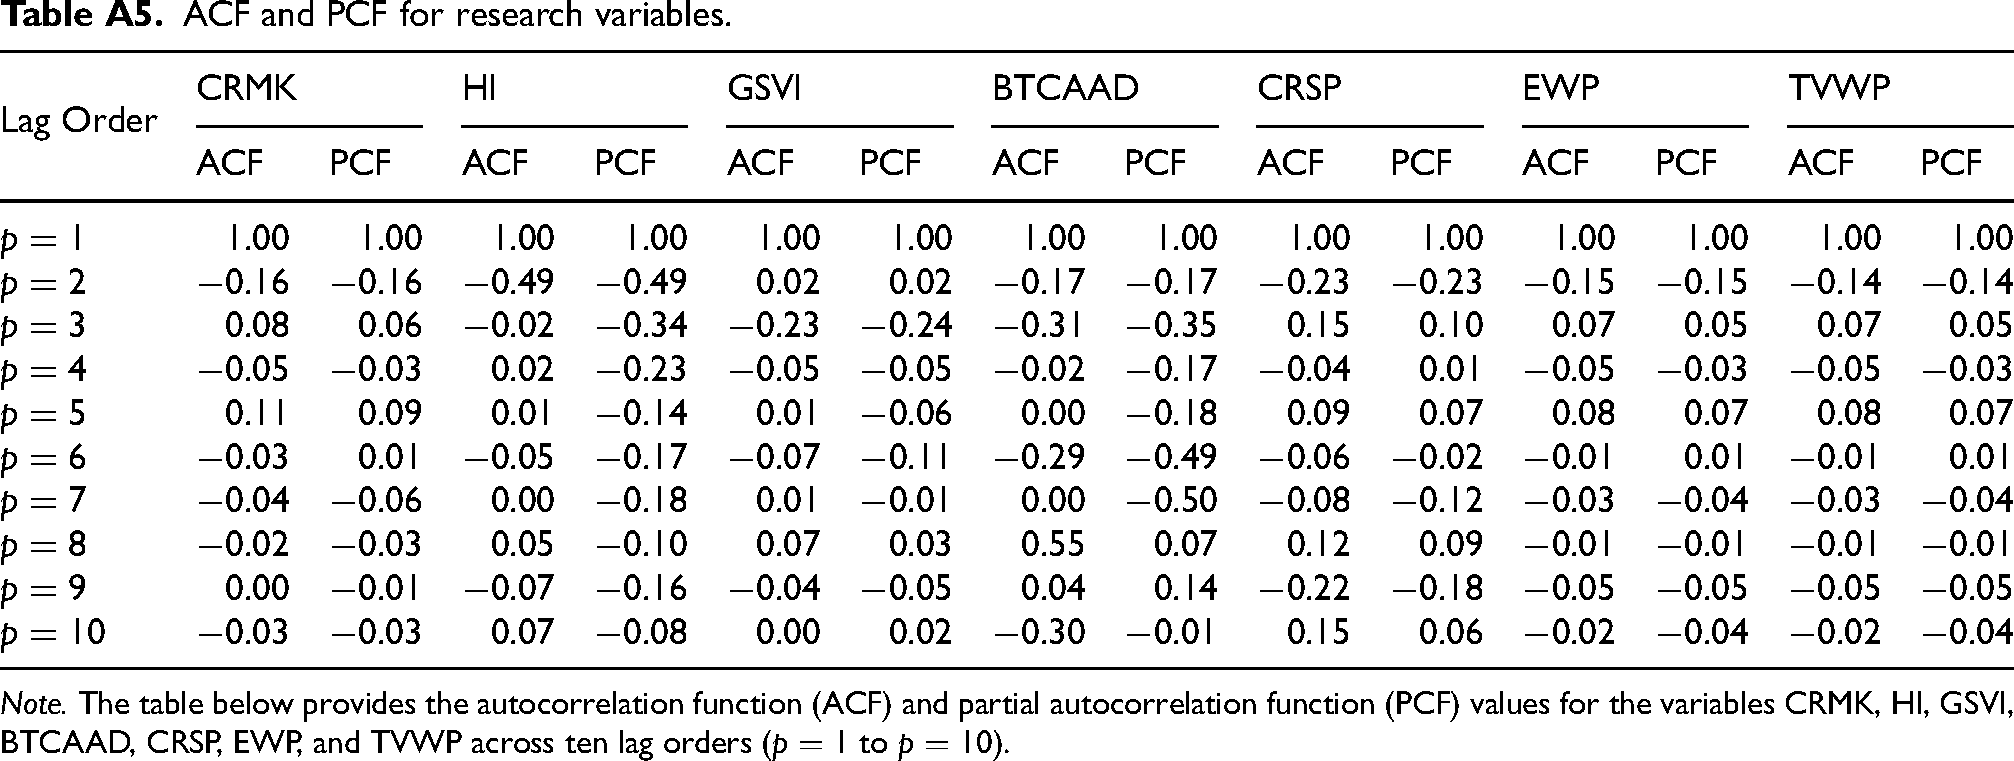
To understand the dynamic behavior of our research variables, we provide the autocorrelation function (ACF) and partial autocorrelation function (PCF) values for the variables CRMK, HI, GSVI, BTCAAD, CRSP, EWP, and TVWP across ten lag orders (p=1 to p=10) in Table A5. The ACF values for CRMK indicate a strong positive correlation at the first lag, which diminishes over subsequent lags, showing decreasing persistence. HI displays a strong negative autocorrelation at the second lag, suggesting an inverse relationship at this interval, which weakens at further lags. GSVI shows low and fluctuating autocorrelations, indicating minimal persistence. BTCAAD exhibits significant negative autocorrelation at the third and sixth lags, suggesting periodic negative correlations. CRSP shows a mix of negative and positive autocorrelations, with significant values at the second and ninth lags, respectively. EWP and TVWP display weak positive autocorrelations at the first and third lags, indicating limited persistence overall. These findings provide insights into the temporal dependencies and behaviors of each variable, highlighting the importance of considering these patterns when analyzing cryptocurrency portfolio returns.
To ensure the accuracy of the results, we regress control variables on EWP (TVWP). The control variables we include, based on previous literature, are BTCAAD, CRSP stock market, GSVI, HI, and CRMK, as shown in Table 5. The regression analysis based on Model (5) in Table 5 shows the explainability of GSVI, HI, and CRMK in the variation of the cryptoasset portfolios. Additionally, our auxiliary regression analysis in the Appendix, which includes CSSD, confirms that our findings are consistent. Similarly, Table A2 exhibits that CRMK, HI, and GSVI remain consistently significant even when controlling for CSSD. Therefore, we select three variables to build forecasting models as summarized in Table 9.
Exogenous event of COVID-19
Our sample period encompasses the exogenous event of COVID-19. The pandemic resulted in lockdowns, decreased in-person interactions, and increased online communication through social media comments. To assess the potential impact on our study, we conduct additional econometric tests using a control variable related to the COVID-19 pandemic, proxied by the number of COVID-19 fatalities obtained from the Centers for Disease Control and Prevention (CDC) as shown in Table A3.
We find that information on COVID-19 deaths does not influence the variation in the crypto market, as the coefficient of COVID-19 fatalities is not statistically significant and is close to zero (0.07 for EWP and 0.07 for TVWP). This lack of effect suggests that HI and CRMS already reflect sentiment related to COVID-19.
Impulse response function (IRF) analysis
In order to investigate the impact of Reddit posts on cryptocurrency returns, we utilize the local projection method proposed by Jordà (2005) to estimate an impulse response function.
According to the findings of the regression analysis, as presented in Table 5, we have established
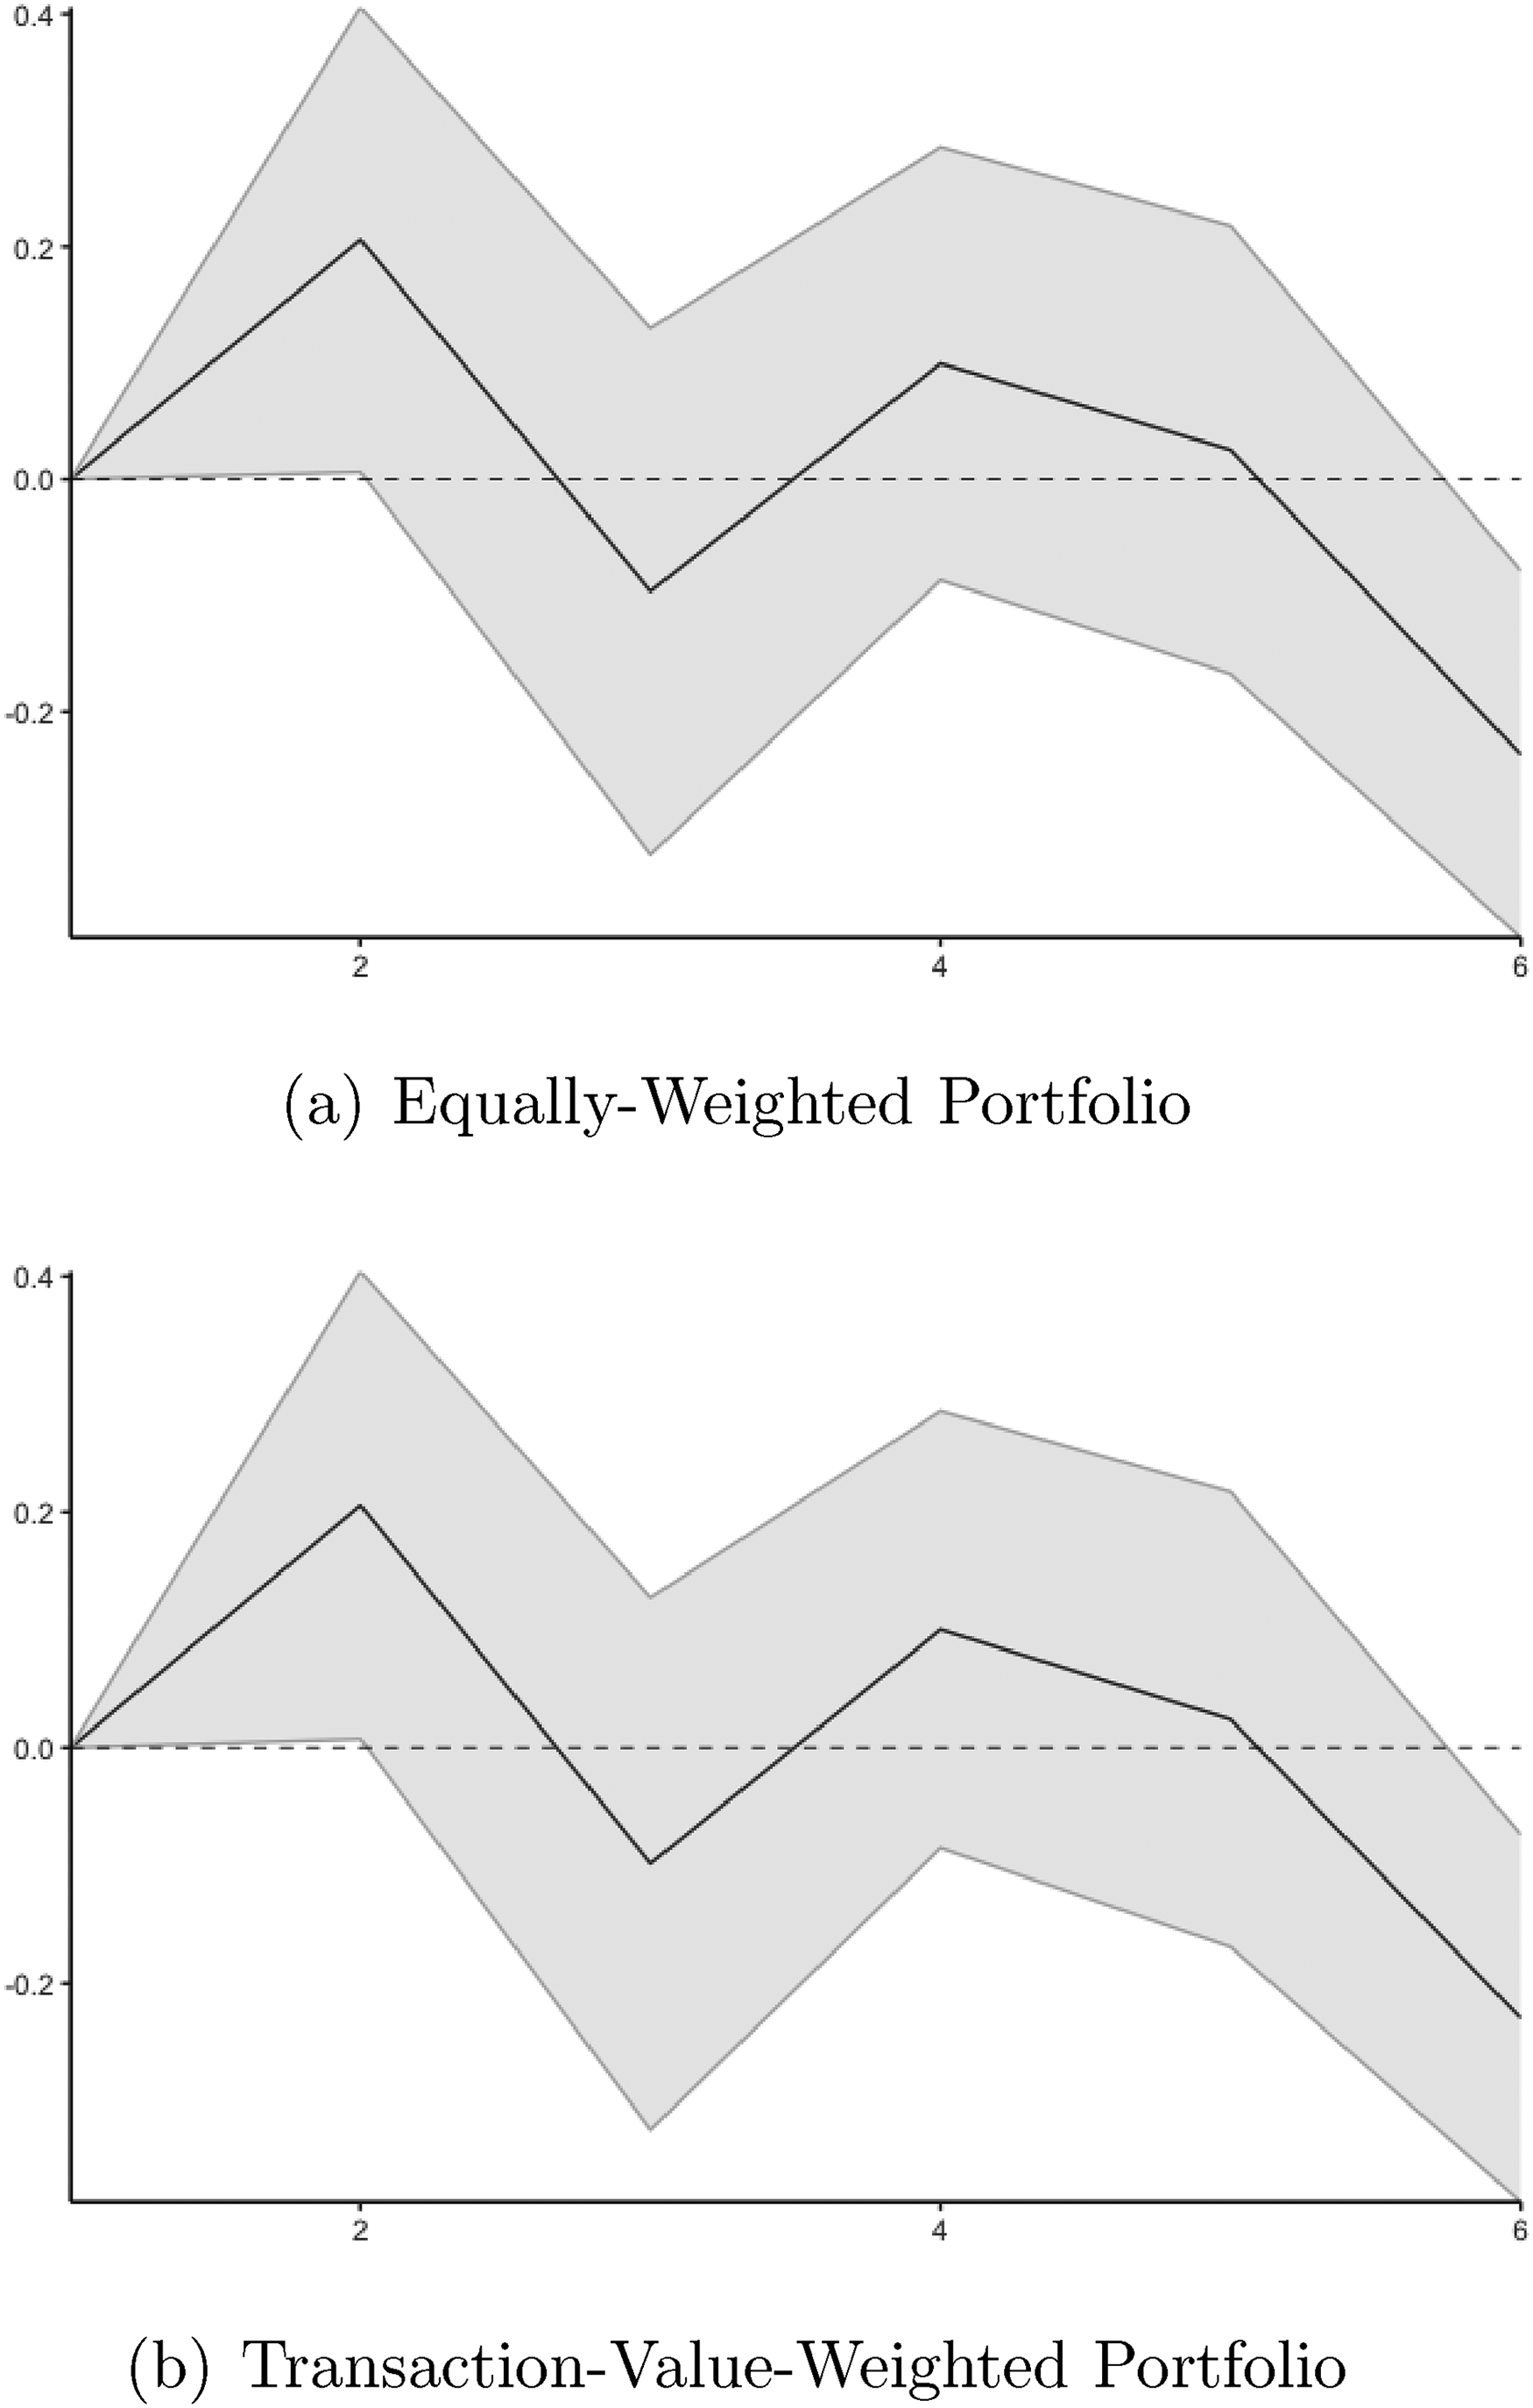
Impulse responses of herd behavior indicator to shock in portfolios’ returns. This figure displays the cumulative impulse response of the herd behavior indicator to shock in returns of portfolios for six days (horizontal axis). Panel (a) exhibits the impulse response to the shock for an Equally-Weighted Portfolio. Panel (b) depicts the impulse response to the shock for a Transaction-Value-Weighted Portfolio. Light grey highlighted areas in each panel represent the corresponding 90% confidence intervals of the impulse responses.
Wavelet analysis
To further investigate the impact of HI on cryptocurrency returns, we utilize the wavelet approach to assess the robustness of impulse response functions (IRFs). The wavelet approach decomposes time series data into different scales, allowing for the detection of relationships that may not be visible through traditional methods. Kim and In (2005) use wavelet analysis to study the relationship between stock returns and inflation, finding that time-scale decomposition by wavelet analysis reveals the dynamic structure of the relationship and varies across time scales and horizons, whereas traditional methodology only examines short- and long-run scales. Our study aims to reveal the lead-lag relationship between cryptocurrency returns and other factors through wavelet analysis, in conjunction with impulse response analysis.
Table 7 presents the multiscale correlation between the Herd Behavior Index (HI) and two cryptocurrency portfolios: the Equally-Weighted Portfolio (EWP) and the Transaction-Value-Weighted Portfolio (TVWP). Using the Maximal Overlap Discrete Wavelet Transform (MODWT), illustrated in Appendix, this table reports wavelet correlation coefficients across different time scales. D1 (2–4 days), D2 (4–8 days), and D3 (8–16 days) represent the very short-run dynamics of a signal and contain most of the noise. In contrast, detail levels D4 (16–32 days) and D5 (32–64 days) capture fluctuations within the 16–64 day frequency range, corresponding to the business cycle frequency band.
Wavelet correlation between herd behavior index (HI) and cryptocurrency portfolios across time scales.
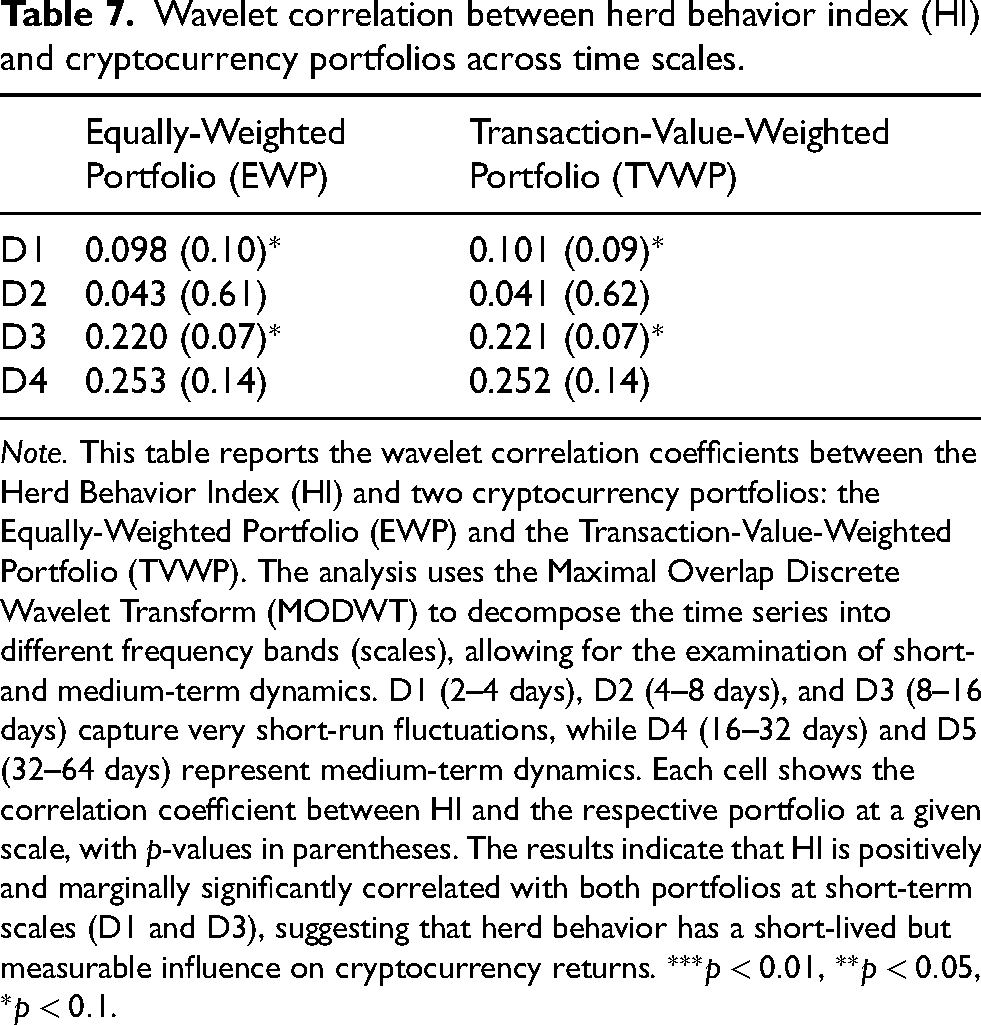
Note. This table reports the wavelet correlation coefficients between the Herd Behavior Index (HI) and two cryptocurrency portfolios: the Equally-Weighted Portfolio (EWP) and the Transaction-Value-Weighted Portfolio (TVWP). The analysis uses the Maximal Overlap Discrete Wavelet Transform (MODWT) to decompose the time series into different frequency bands (scales), allowing for the examination of short- and medium-term dynamics. D1 (2–4 days), D2 (4–8 days), and D3 (8–16 days) capture very short-run fluctuations, while D4 (16–32 days) and D5 (32–64 days) represent medium-term dynamics. Each cell shows the correlation coefficient between HI and the respective portfolio at a given scale, with
At D1 (2–4 days), both portfolios show a positive and marginally significant correlation with HI (EWP: 0.098, TVWP: 0.101;
The EWP and TVWP exhibit very similar correlation patterns across all scales, implying that the weighting method (equal vs. transaction-value) does not significantly alter the relationship with HI. Only D1 and D3 show marginal significance (
In addition, we conduct the wavelet coherence analysis to examine how the portfolio returns and each of the predictors interact and change throughout an unbroken period of time and frequency space. Figure 3 displays the visual findings of cross-wavelet coherences and phase diagrams, where the
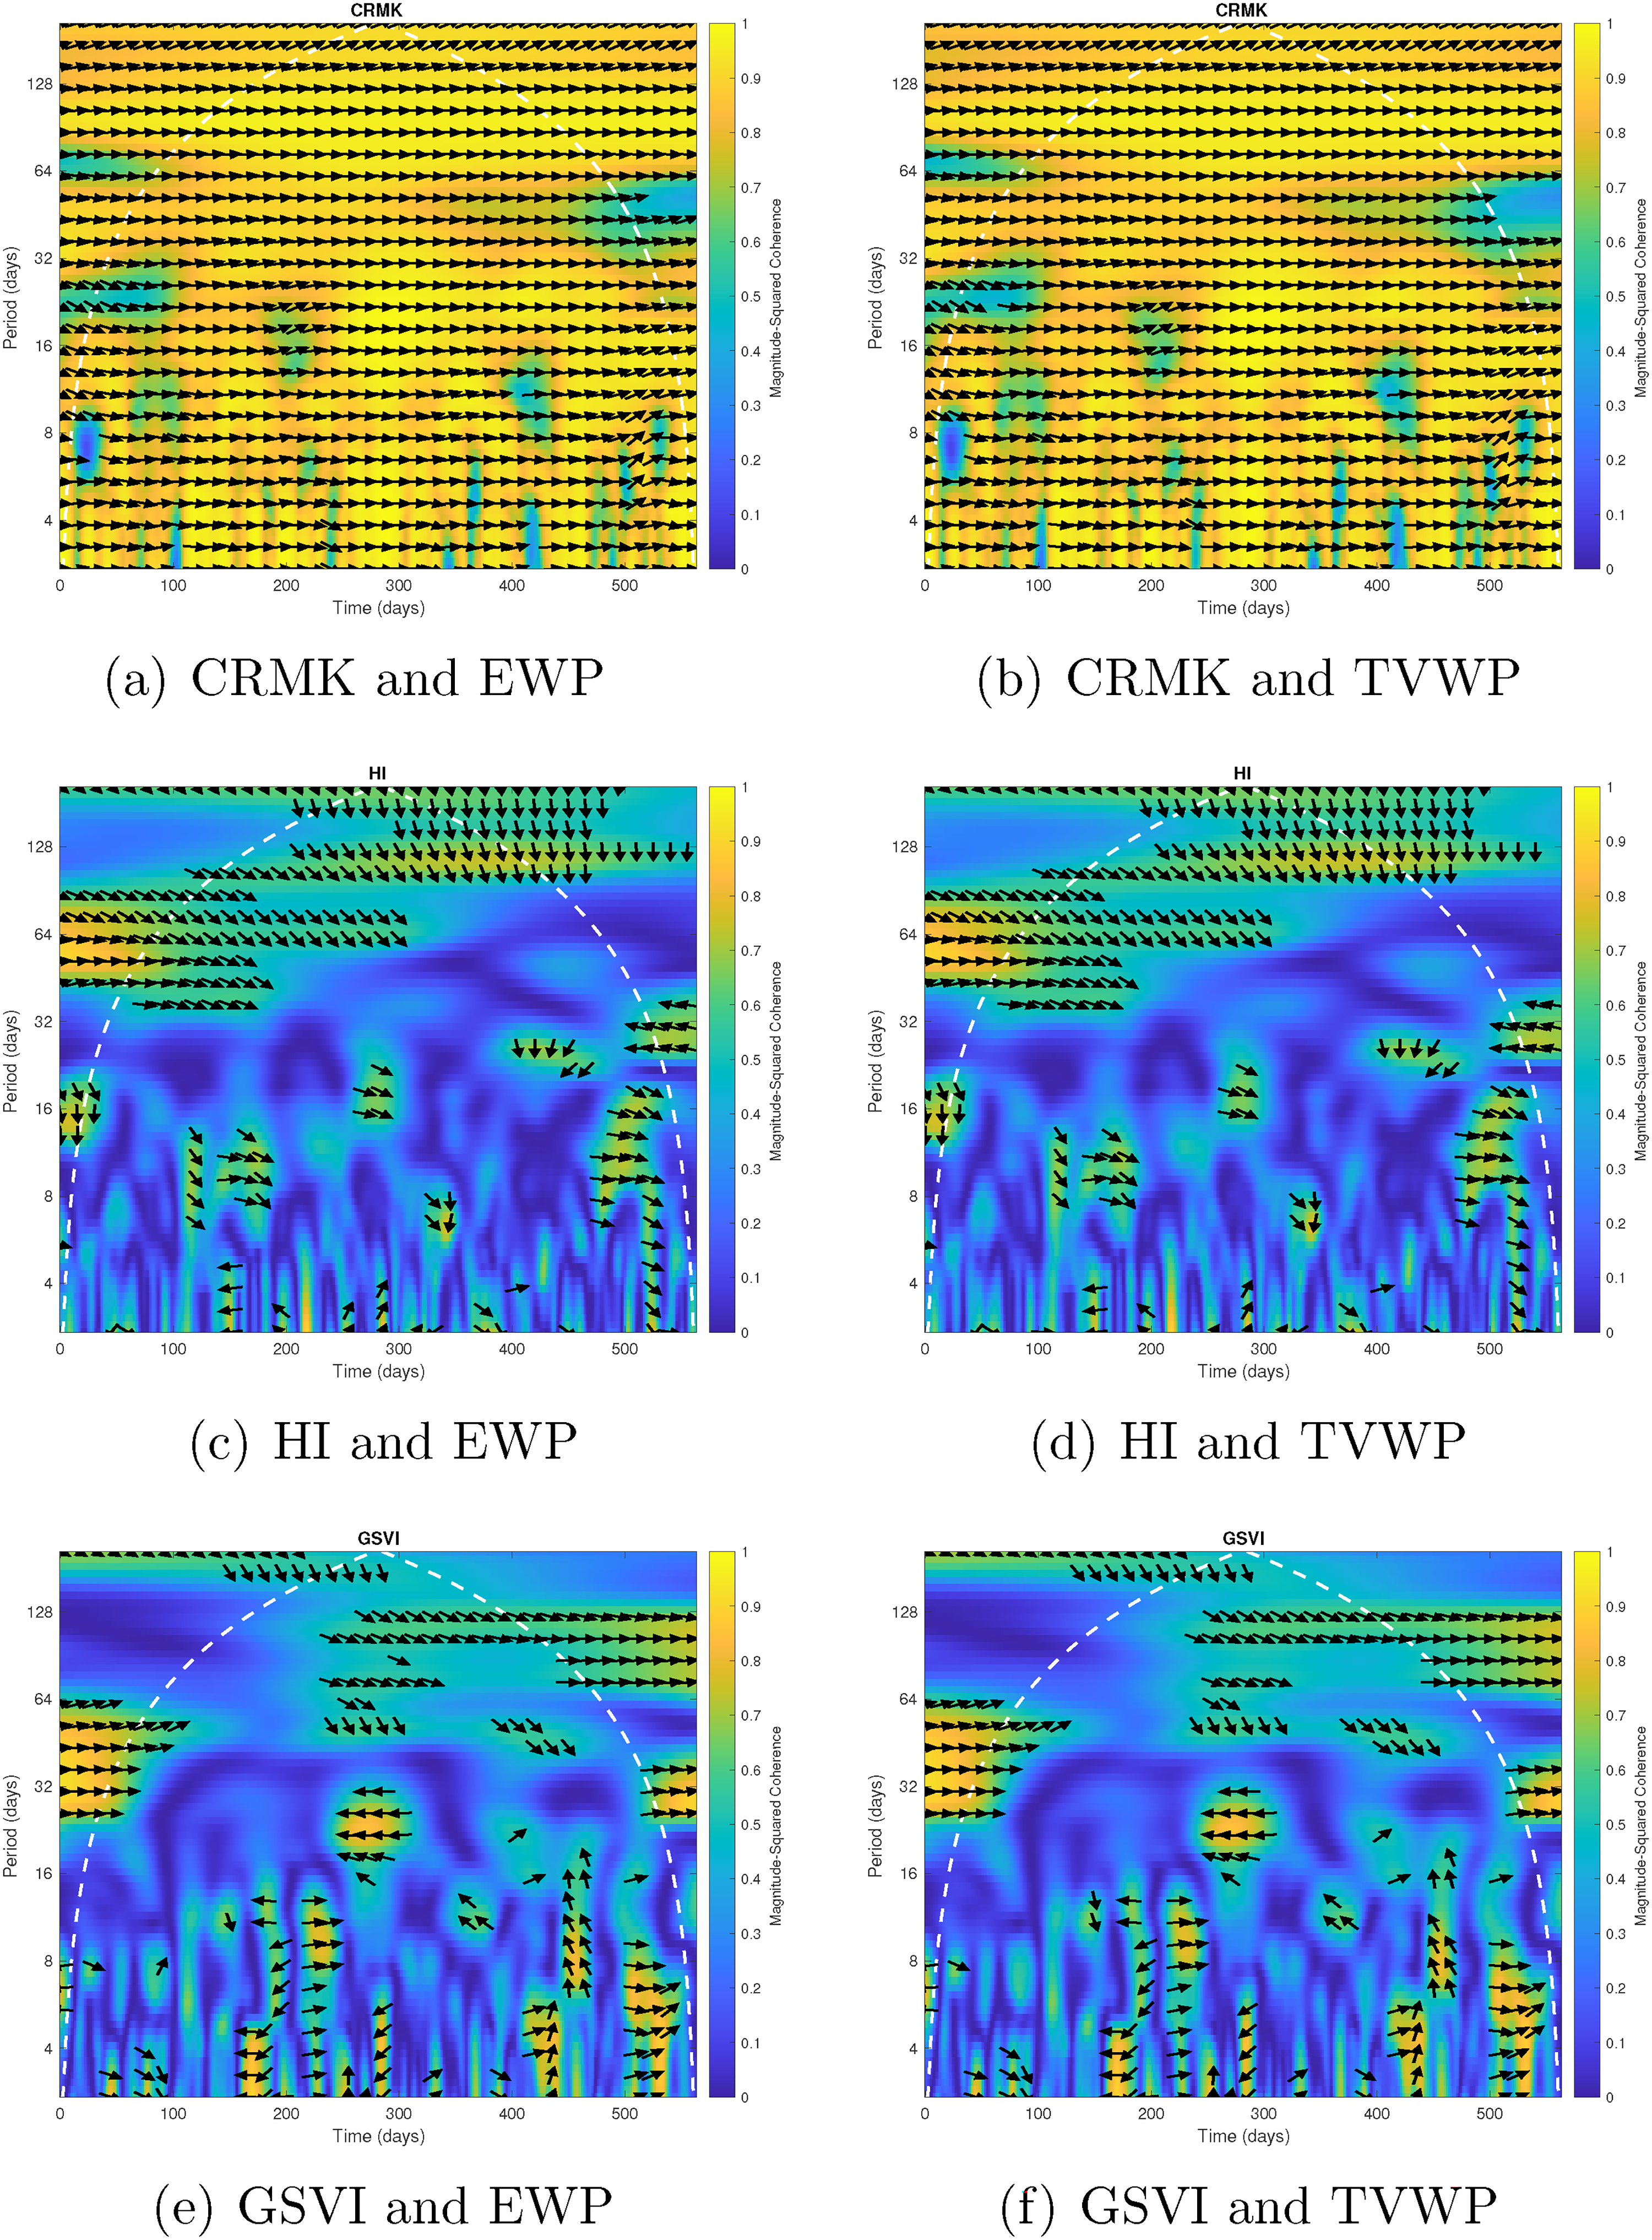
Wavelet coherency and phase diagrams. This figure shows the Wavelet cross-correlation over the entire sample period (June 2019 to December 2020). The x-axis and y-axis are the time domain and the frequency components, respectively. The phase arrows are displayed only where the coherence is greater than or equal to 0.5. If the arrow points to the right (left), they are positively (negatively) correlated. A downward pointing arrow shows the leadership of the first variable (CRMK, HI, and GSVI).
Figure 3 presents that there is a highly positive coherency between cryptocurrencies, as evidenced by the yellow area and phase arrows pointing to the right. The lead-lag relationships between the first variable and portfolios (EWP and TVWP) are indicated by arrows: a downward-pointing arrow indicates that the first variable leads (lags) the portfolios, while an upward-pointing arrow indicates that the first variable lags (leads) the portfolios. Thus, we find that CRMK and HI positively and distinctively lead EWP and TVWP returns.
Herding behavior and demand shock
We examine whether the herd instinct score extracted from Reddit can detect demand shock due to the herding investment in the cryptocurrency markets. To test this empirically, we hypothesize that long and short herd instinct signals change the demand for cryptocurrencies, resulting in increased transaction volumes in the market. Table 7 demonstrates that both long and short HI signals trigger substantial increases in trading volume across all major cryptocurrencies. This finding confirms that investor sentiment, as captured by HI, acts as a catalyst for demand shocks, especially during periods of heightened uncertainty. Trading volume is defined as the log of the respective trading volume of the following day after receiving a signal. The short signal is the lowest tercile in the herd behavior index (i.e. HI), while the long signal is the highest tercile in HI. We regard no signal as HI values close to zero (a range between
Notably, when long and short instinct signals occur, the demand for digital currencies tends to rise, as evidenced by increased trading volumes for BTC, ETH, LTC, and BCH the following day. The trading volumes in every cryptocurrency for no herd instinct signal are less than those of short and long instinct signal (No signal vs Long (Short) signal: 9.23 vs 9.27 (9.26) for BTC, 11.26 vs. 11.66 (11.71) for ETH, 11.69 vs. 12.01 (12.03) for LTC, 9.59 vs. 10.22 (10.30) for ETH). To study the aggregate level of demand shock in the crypto market, we sum all the trading volumes by signals and test the null hypothesis of the mean equivalence of the trading volumes by signals. In the last column, the
Therefore, our findings indicate that changes in investor demand occur when the HI value falls within the lowest or highest tercile. Specifically, a short signal is generated when the HI value falls within the lowest tercile, while a long signal is generated when the HI value falls within the highest tercile. In particular, when the HI value falls within the low tercile, transaction volume increases more than usual. This suggests that investors tend to follow each other’s actions in times of uncertainty or when information is scarce, leading to herding behavior that affects transaction volume.
Predictability of cryptocurrency returns
Based on the findings in Table 8, we examine whether the herd behavior index (HI) can be used to forecast the cumulative returns of cryptocurrencies following Liu and Tsyvinski (2021). Table 8 shows HI detects the herding behavior in advance, suggesting that it would be helpful to predict future price movements. Thus, we aim to investigate its predictive role in cryptocurrency returns.
Herd instinct signals and cryptocurrencies’ demand shocks.
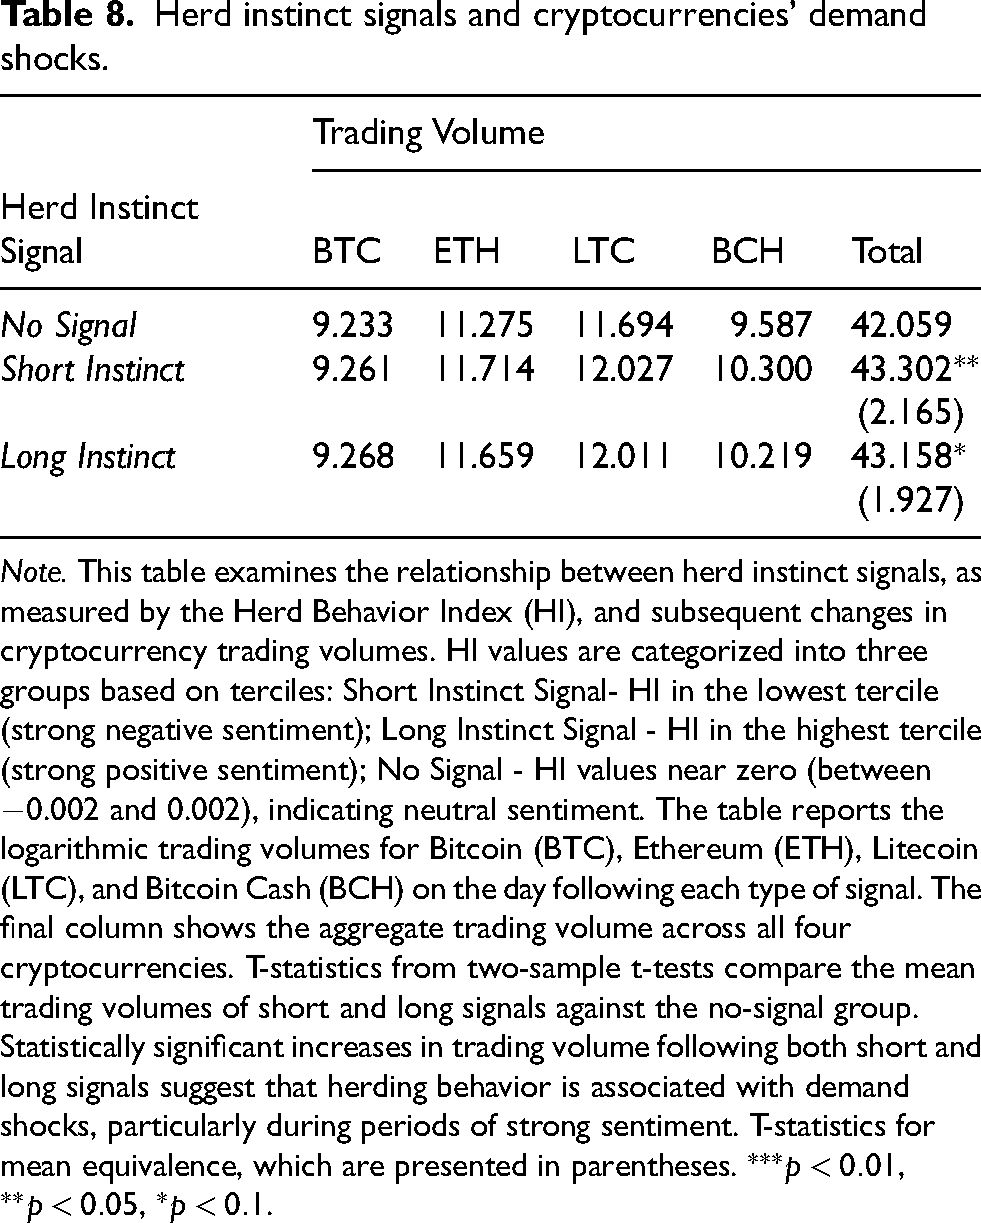
Note. This table examines the relationship between herd instinct signals, as measured by the Herd Behavior Index (HI), and subsequent changes in cryptocurrency trading volumes. HI values are categorized into three groups based on terciles: Short Instinct Signal- HI in the lowest tercile (strong negative sentiment); Long Instinct Signal - HI in the highest tercile (strong positive sentiment); No Signal - HI values near zero (between
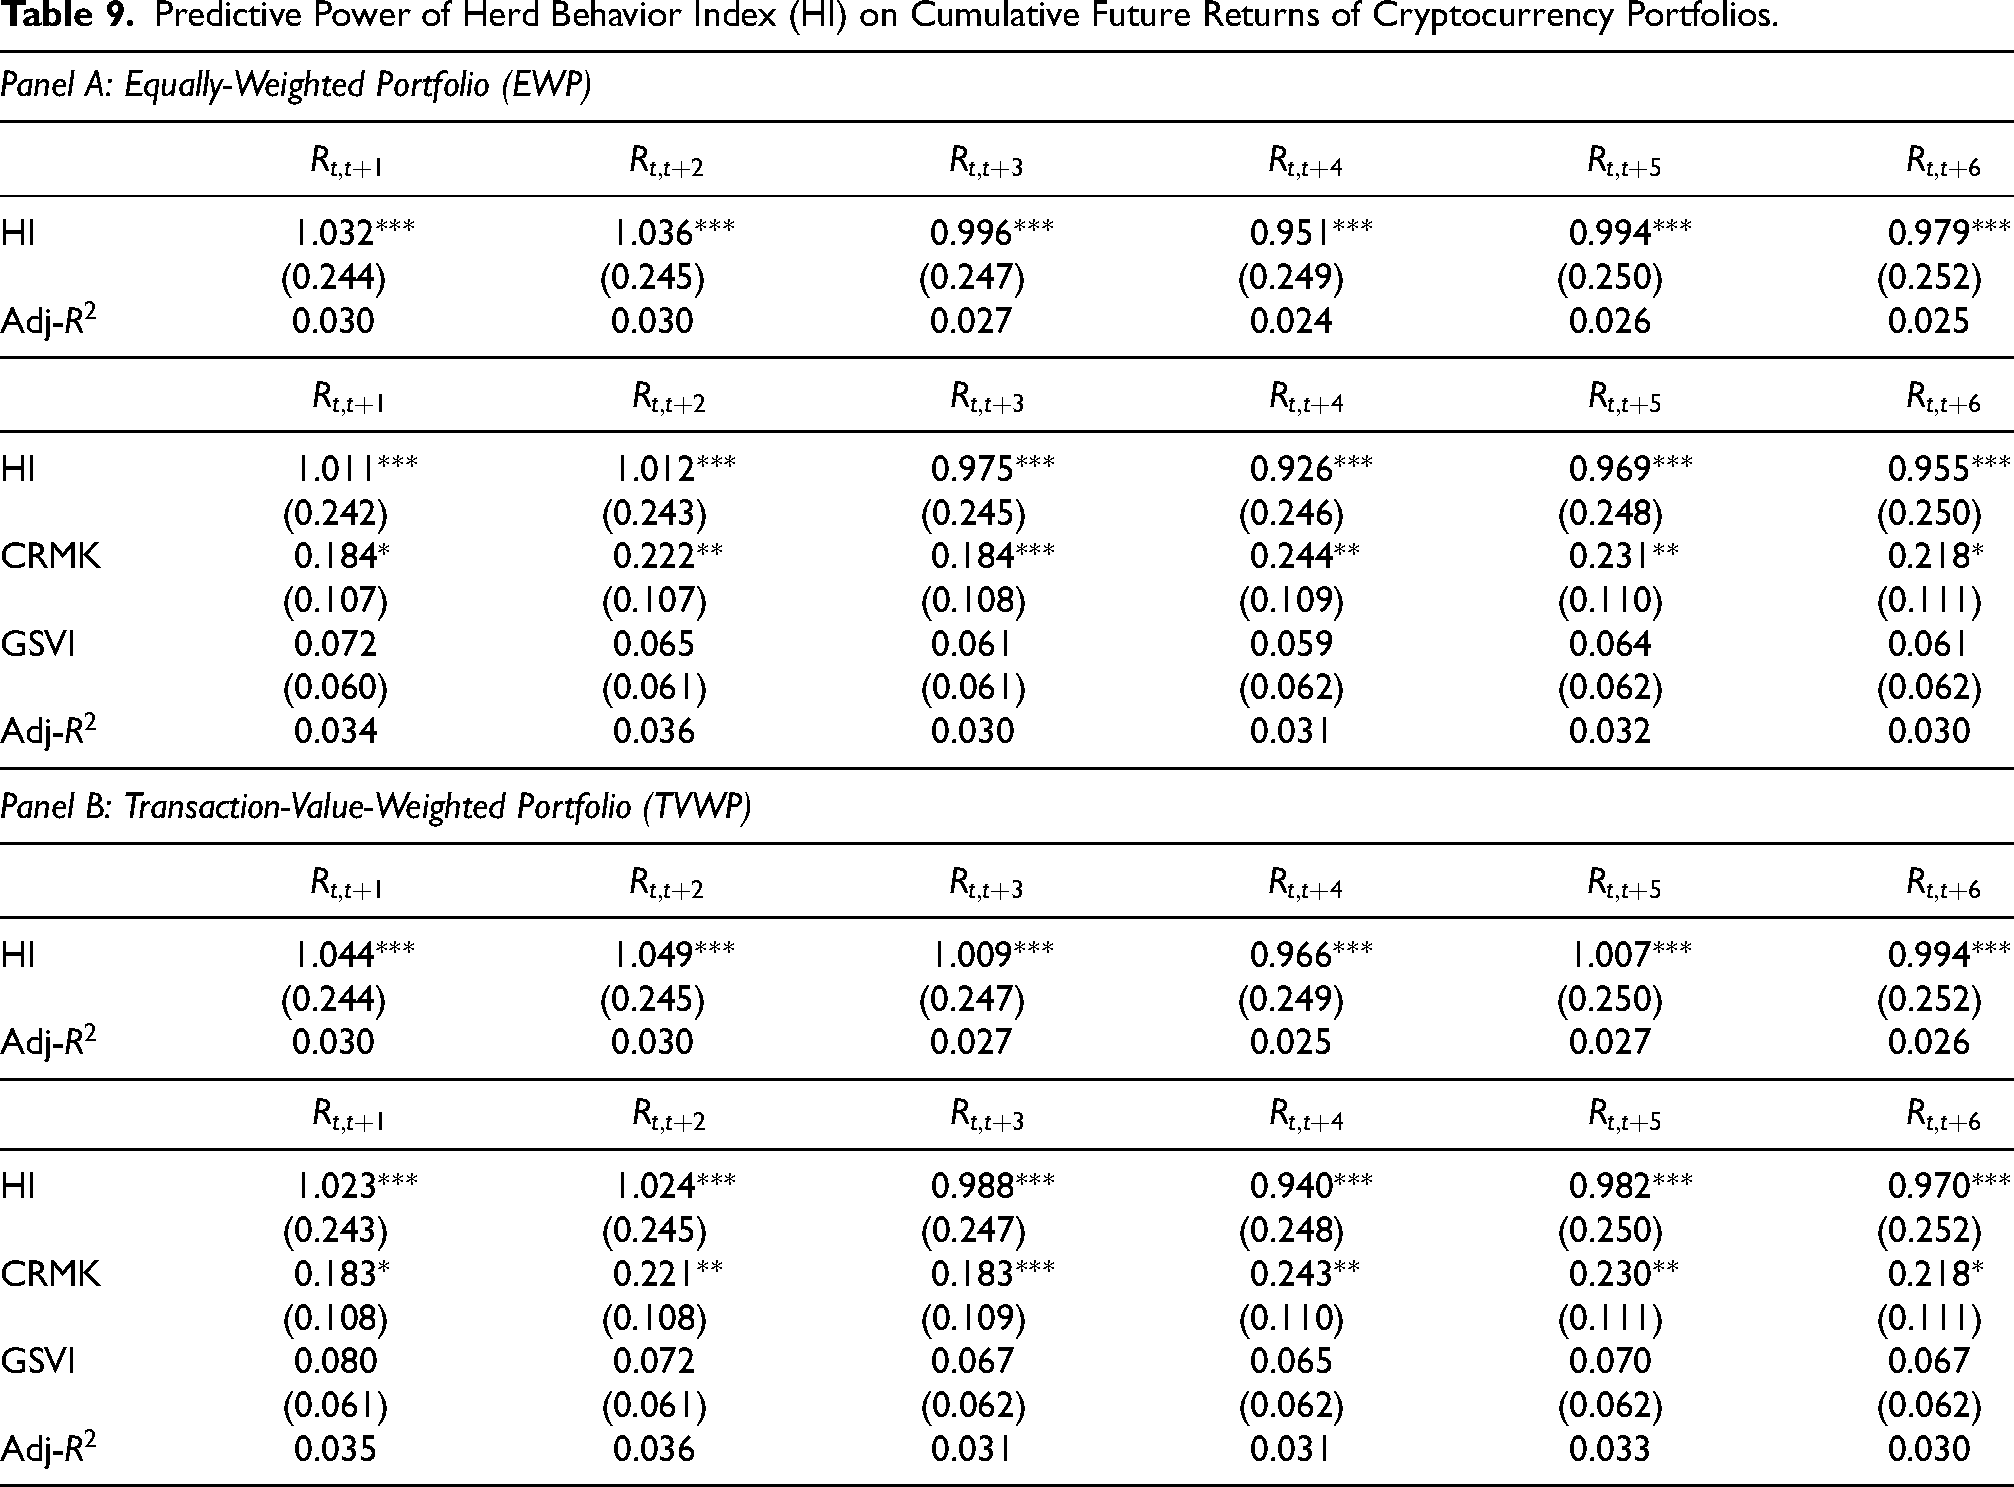
As shown in Table 5, three factors (CRMK, HI, and GSVI) demonstrate statistically significant associations with cryptocurrency returns. Using these three variables, we start by examining whether HI as well as two other variables are helpful to explain the cumulative future returns of cryptocurrencies in that they can be deemed influential factors in predicting returns. The results presented in Table 9 illustrate the outcome of conducting regression analysis to explore the relationship between the cumulative future returns of two portfolios, EWP and TVWP, over a range of further time horizons, ranging from one day ahead to six days ahead. Table 9 highlights HI’s predictive strength, particularly for one- and two-day cumulative returns. The consistent statistical significance across models suggests that HI is not merely reactive but serves as a forward-looking indicator of market movements. In Panel A and Panel B, HI positively and significantly predicts cumulative future EWP and TVWP returns ranging from one-day to six-day horizons returns at the 1% level. In one-day and two-day horizons, the coefficients of regressions are relatively higher than those of other horizons (EWP: 1.032 for one day, 1.036 for two days; TVWP: 1.044 for one day, 1.049 for two days). This says that the cumulative one-day future and two-day future returns are responded more sensitively to HI among other variables. This finding is supported by the results obtained from both the impulse response function analysis and wavelet analysis, which also indicate that HI exhibits a stronger sensitivity to the cumulative one-day and two-day future returns than other variables under consideration. Additionally, the results of the regression of cumulative future returns on CRMK, HI, and GSVI summarize that except for GSVI, HI is a significant predictor at 1% significance and CRMK is meaningful at a 10% significant level at all the horizons. Similarly, in this regression results, the coefficients of HI for EWP (1.011 for one day; 1.012 for two days) and TVWP (1.023 for one day; 1.024 for two days) in one day and two days are relatively higher than those in other horizons.
Predictive Power of Herd Behavior Index (HI) on Cumulative Future Returns of Cryptocurrency Portfolios.
By taking into account the influence of herding behavior on transaction volume, investors can make more informed decisions about when to buy or sell cryptocurrency, potentially leading to higher returns. This highlights the importance of considering not only market fundamentals but also the behavioral factors that affect market dynamics when making investment decisions. Overall, the result suggests that HI is a valuable tool for predicting the future performance of cryptocurrencies and can be used by investors to improve their investment strategies.
Out-of-sample analysis
Forecasting model
This section evaluates the forecasting performance of a factor model:
To evaluate the forecasting performance of the factor model, we use two statistical tests. Firstly, we apply the Diebold and Mariano test of equal predictability (Diebold and Mariano, 2002) by comparing the Mean Squared Forecast Errors (MSFE) of the factor model with those of a historical mean model. Secondly, we use the out-of-sample (OOS) test statistics, as documented by Welch and Goyal (2008), to assess the predictability of model (8) by incorporating the herd behavior index. By using these two tests, we aim to determine whether the factor model provides superior forecasting accuracy compared to the historical mean model and whether it captures the predictive power of the herd behavior index (HI) in forecasting EWP and TVWP.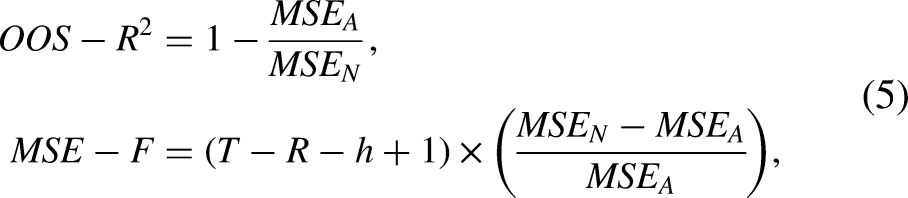
Table 10 presents a comprehensive account of the forecast error statistics for both the in-sample (
In-sample (IS) and out-of-sample (OOS) tests for two portfolios.
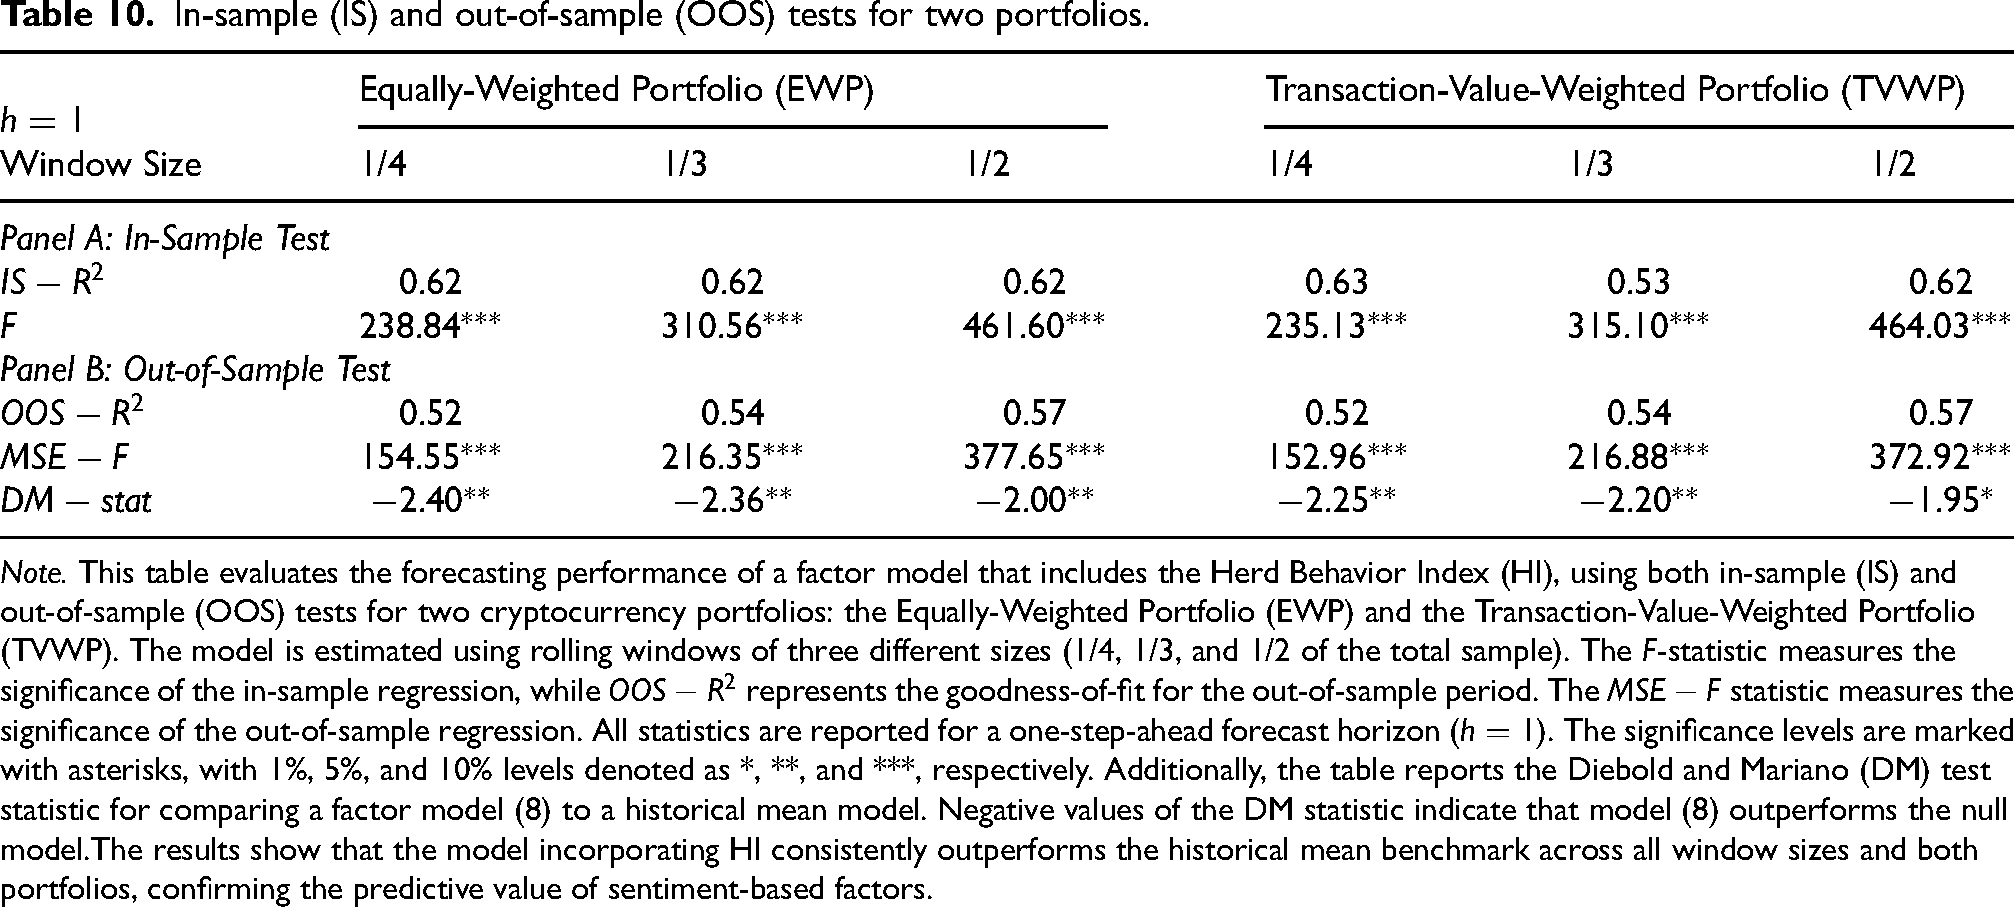
Note. This table evaluates the forecasting performance of a factor model that includes the Herd Behavior Index (HI), using both in-sample (IS) and out-of-sample (OOS) tests for two cryptocurrency portfolios: the Equally-Weighted Portfolio (EWP) and the Transaction-Value-Weighted Portfolio (TVWP). The model is estimated using rolling windows of three different sizes (1/4, 1/3, and 1/2 of the total sample). The
Application of HI to long and short tradings
The empirical findings of this study suggest that our predictive model with HI can be utilized to predict EWP and TVWP returns at a daily frequency, and the role of HI is of nonignorable importance. Intriguingly, our findings imply that higher HI indicates more investors take long positions while lower HI signals short positions in the digital currency market. To examine whether HI can be used to implement a profitable trading strategy, we develop a long and short strategy based on HI and simulate trading for a period of 310 days, commencing from March 27, 2021 and concluding on January 30, 2022.
11
Specifically, we derive 15th, 20th, 75th, 80th, and 85th percentiles, denoted by
To explain our trading strategy more clearly for simulations, let us take an example. We establish a long strategy using a threshold of the 85th percentile of HI from in-sample data,
Although a long signal is observed today, we track the signals from two days ago because there exists two-day persistence of HI. Accordingly, it is necessary to compare the current HI signal and the previous ones in order to make the right trading decision. By taking this into account, we first check whether yesterday’s HI did not indicate a short signal, was greater than the median of HI, and the day before yesterday’s HI was not a short signal. On one hand, for a long investment strategy, we hold the asset for two days and sell it at time
On the other hand, we design a short strategy. This approach mirrors that of the long strategy, with the key difference being that profits are generated when the selling price is lower than the purchasing price. To establish a short position, we employ a threshold of
By taking all into account, our trading rule can be summarized as
Figures 4 and 5 illustrate the cumulative returns of the Equally-Weighted Portfolio (EWP) and the Transaction-Value-Weighted Portfolio (TVWP) for 310 days across three different thresholds. Our strategy based on the herd instinct score yields noticeable net profits and is robust across various thresholds. Specifically, a long strategy with a threshold of
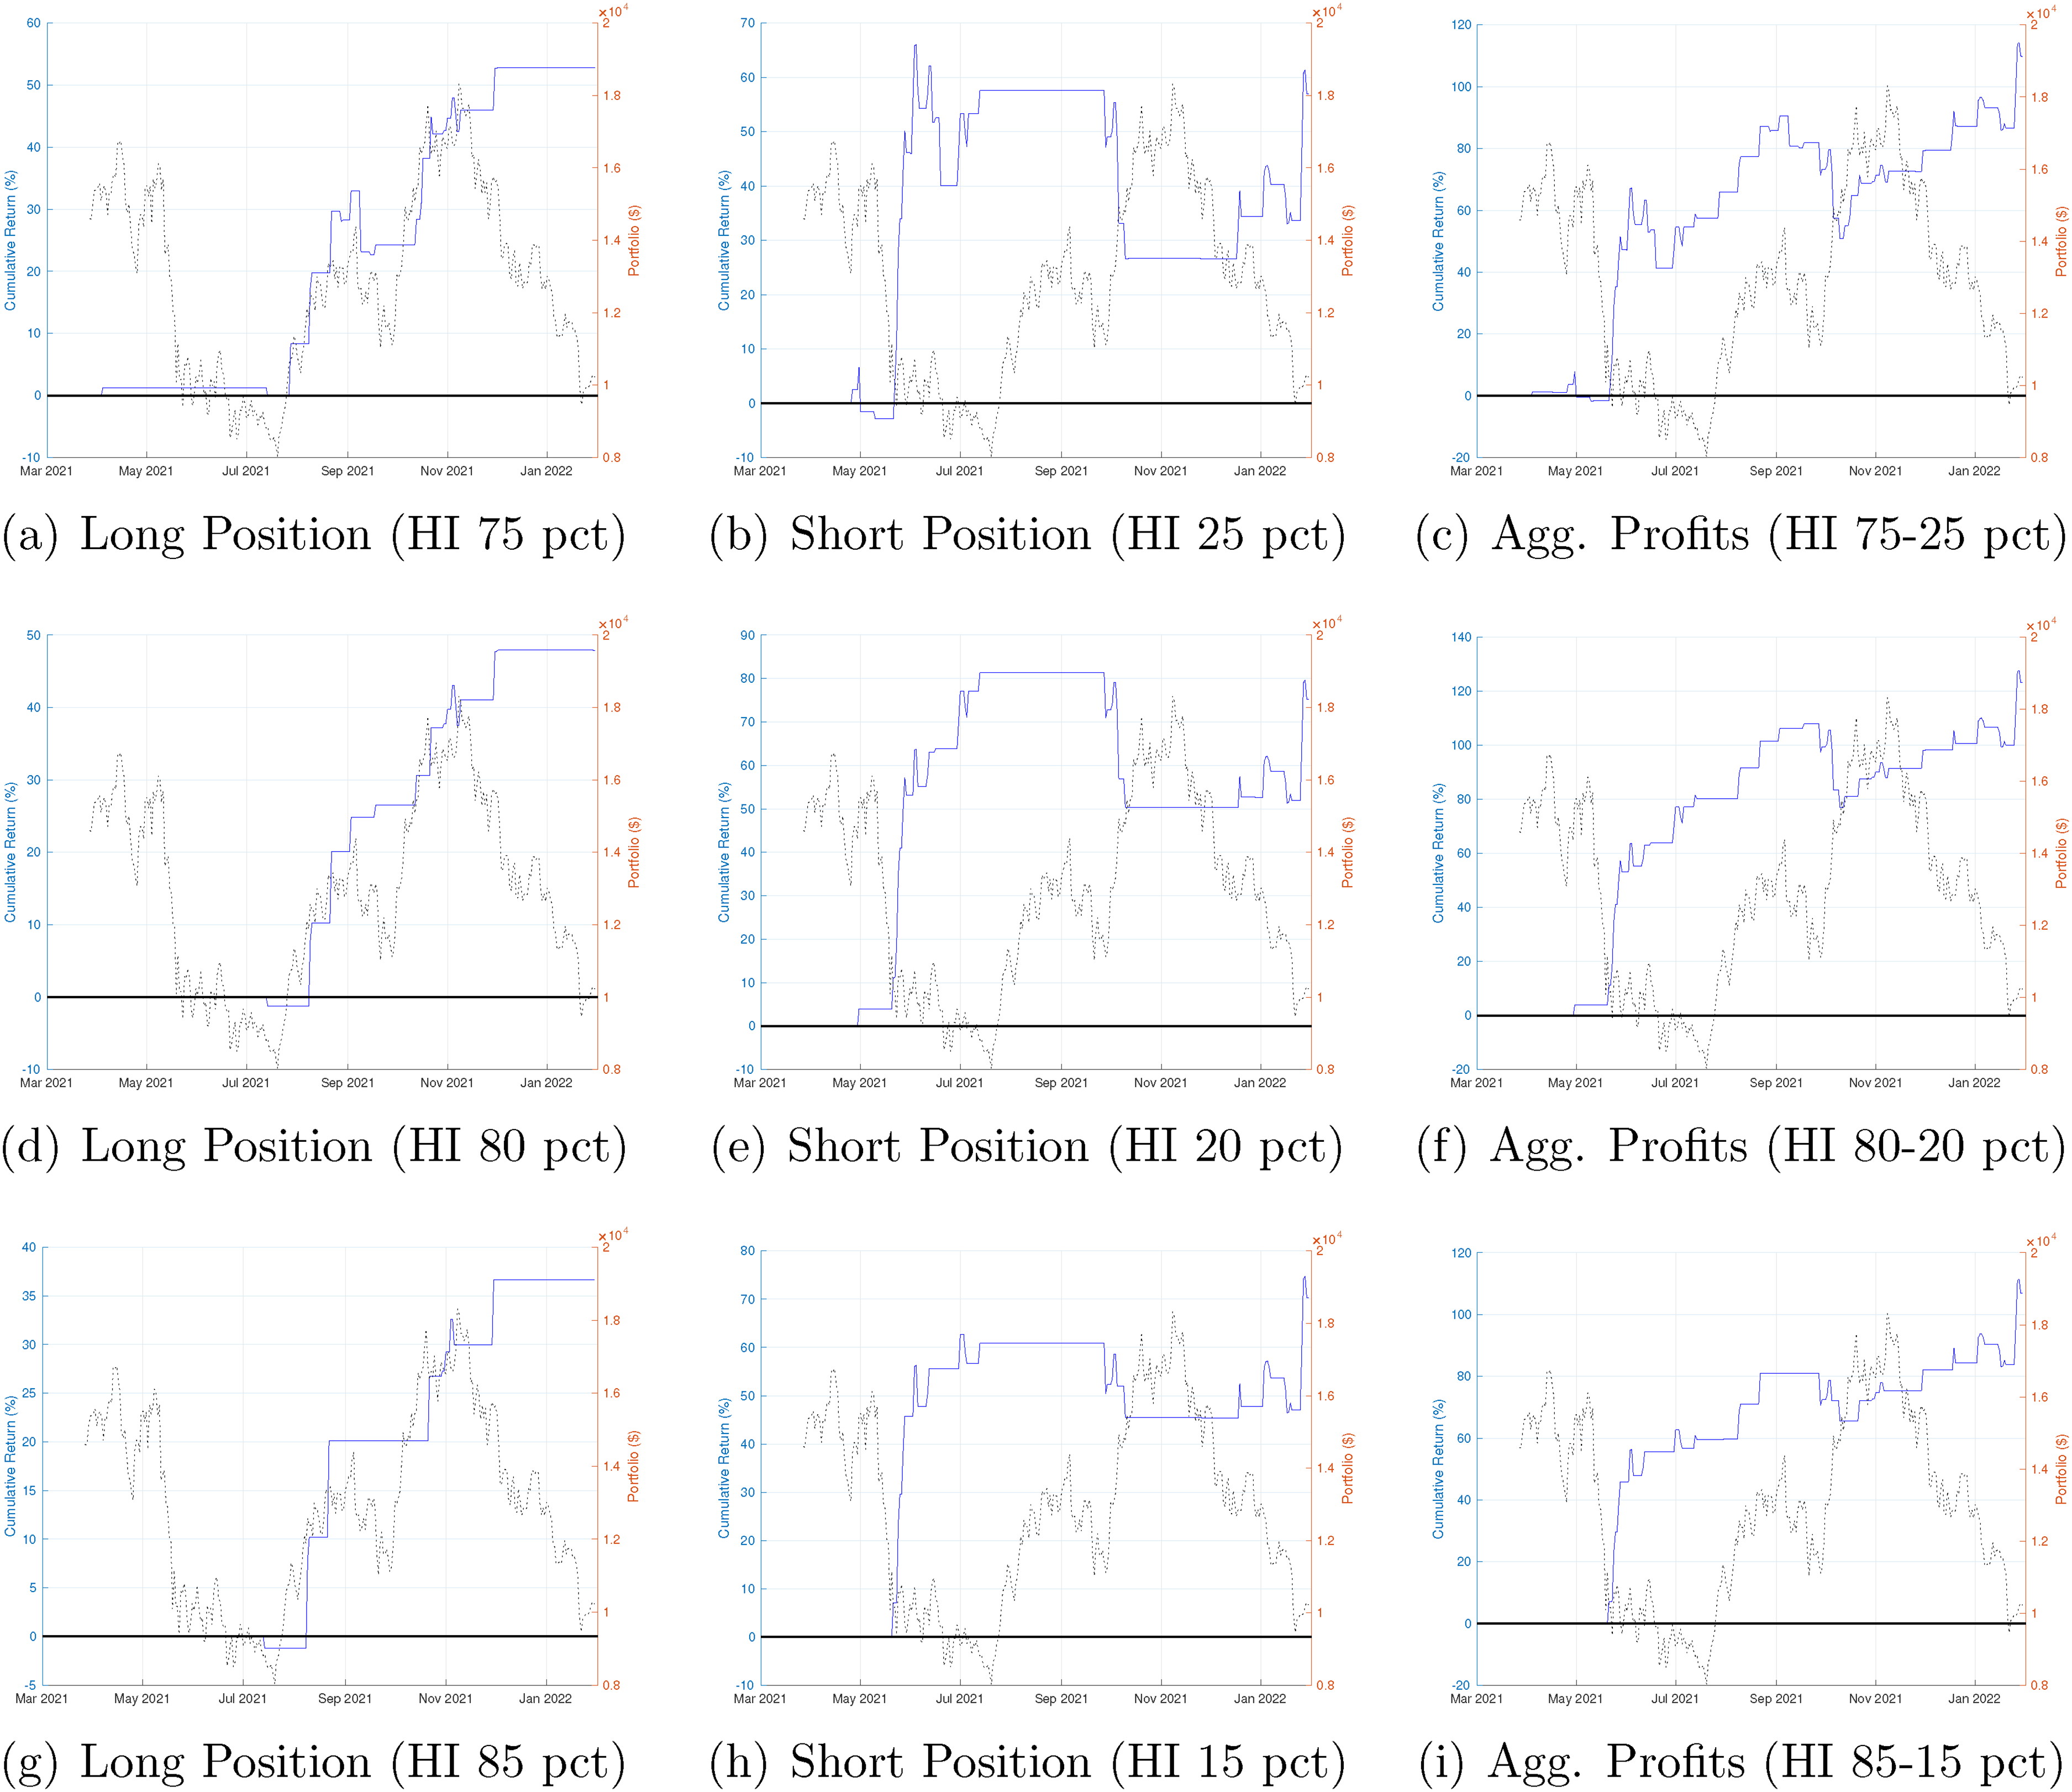
Long-short investment strategies: Herd behavior index (HI) and equally-weighted portfolio (EWP). This figure shows the performances of the HI-based trading simulations for EWP (Equally-Weighted Portfolio). The dashed lines are the price of Bitcoin (the right y-axis), and the solid lines are the cumulative percentage returns (the left y-axis). The simulations cover a period of 310 days, from March 27, 2021 to January 30, 2022. The first row presents a long strategy based on the 75 percentile (a), a short strategy based on the 25 percentile (b), and both aggregated (c). The second row presents a long strategy based on the 80 percentile (d), a short strategy based on the 20 percentile (e), and both aggregated (f). The last row presents a long strategy based on the 85 percentile (g), a short strategy based on the 15 percentile (h), and both aggregated (i). Strategies based on HI thresholds generate robust profits, outperforming the buy-and-hold benchmark. Short strategies yield higher returns but also exhibit greater volatility.
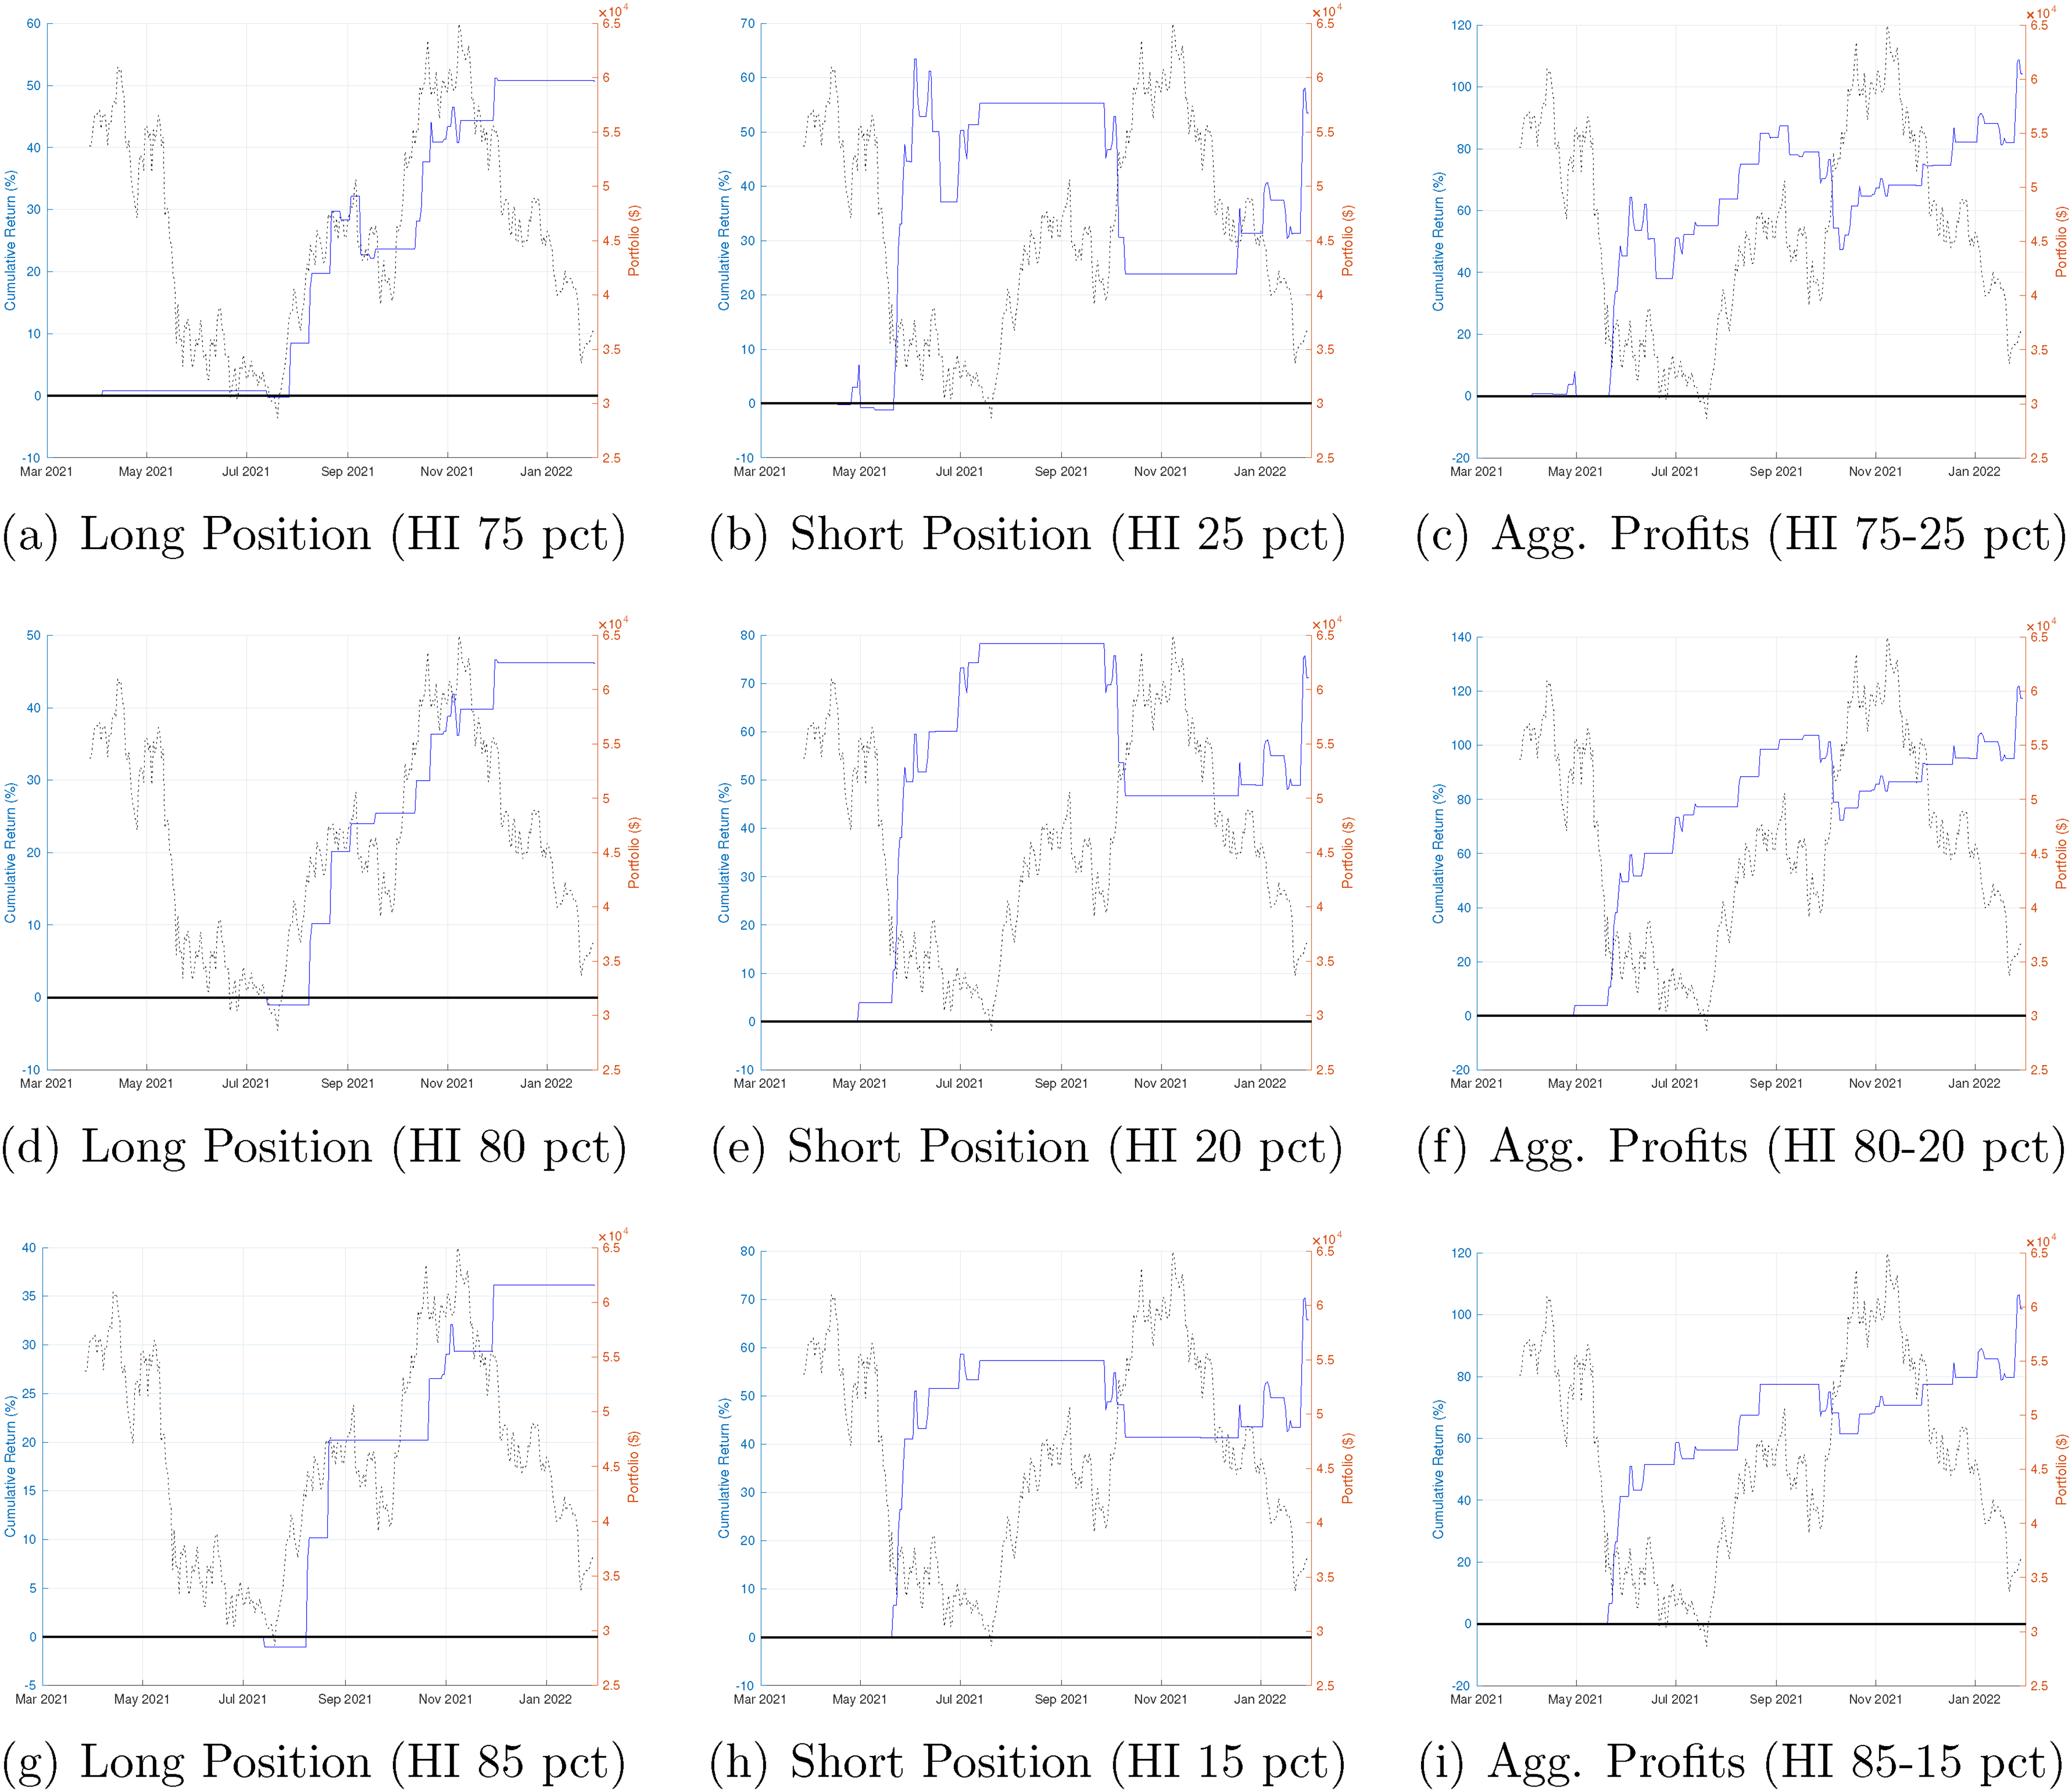
Long-short investment strategies: herd behavior index (HI) and transaction-value-Weighted portfolio (TVWP). This figure shows the performances of the HI-based trading simulations for TVWP (Transaction-Value-Weighted Portfolio). The dashed lines are the price of Bitcoin (the right y-axis), and the solid lines are the cumulative percentage returns (the left y-axis). The simulations cover a period of 310 days, from March 27, 2021 to January 30, 2022. The first row presents a long strategy based on the 75 percentile (a), a short strategy based on the 25 percentile (b), and both aggregated (c). The second row presents a long strategy based on the 80 percentile (d), a short strategy based on the 20 percentile (e), and both aggregated (f). The last row presents a long strategy based on the 85 percentile (g), a short strategy based on the 15 percentile (h), and both aggregated (i). Strategies based on HI thresholds generate robust profits, outperforming the buy-and-hold benchmark. Short strategies yield higher returns but also exhibit greater volatility.
These figures also suggest that the performance of the long and short strategies highlights an asymmetric return structure to investment sentiments. In every long position with three percentiles (75th, 80th, and 85th percentiles), the cumulative returns on EWP and TVWP show steady growth over the trading period. In contrast, in all short positions with three percentiles (15th, 20th, and 25th percentiles), both cumulative EWP and TVWP returns show an upward trend with wide variation, resulting in higher compounding returns from the short tradings than those of long tradings (long vs. short for EWP: 53% (75th) vs 57% (25th), 58% (80th) vs 77% (20th), 34% (85th) vs 70% (15th); long vs. short for EWP: 51% (75th) vs 55% (25th), 46% (80th) vs 72% (20th), 37% (85th) vs 68% (15th)). The results suggest the asymmetric volatility phenomenon, a tendency of digital currency markets’ volatility to be higher in declining than increasing markets, is associated with a symmetric risk reward of herd behaviors. 14
In addition, when it comes to maximum drawdowns, which explain the greatest movement from peak to trough, the higher threshold we use the less maximum drawdown we get for the long and short tradings. This finding is more distinctive in the short trading simulations. For three short trading simulations for EWP and TVWP, we find that the lowest percentile rule exhibits the lowest maximum drawdown while the highest percentile rule shows the highest maximum drawdown (15th, 20th, 25th for EWP:
Additionally, we compare our trading strategies with the buy-and-hold strategy, as shown in Table A5. While the mean return and Sharpe ratio of the buy-and-hold strategy (RTVWP) are negative, with an average return and a Sharpe ratio of
In sum, our findings present that HI can enhance trading performances in the digital currency markets. From our trading simulations, we observe the existence of asymmetric risk-reward along with HI in the cryptocurrency markets. Specifically, the risk-return compensation is relatively small for investors with strong HI signals (i.e., numbers close to 1 or
Discussion on out-of-sample window and data limitations
Our model has been validated over only one short period, which may raise concerns about its robustness across different market regimes—such as the 2017 boom–bust cycle, the 2022 downturn, or the post-ETF approval dynamics. Extending the dataset to include multiple non-overlapping out-of-sample periods, or at least testing the stability of the Herd Behavior Index (HI)’s predictive power across distinct market phases, would substantially reinforce our findings. To address this concern, we conduct additional robustness analyses to assess whether the HI retains its predictive power and whether the associated long–short trading strategy remains effective across varying market environments.
Specifically, we re-estimate the strategy using rolling windows of 100 observations. Within each window, we compute the 25th and 75th percentiles of the HI, with the initial estimation period spanning January 1, 2016, to April 9, 2016. Each subsequent window advances by one day, ensuring that trading signals are continuously updated and not driven by a single in-sample segment.
As an additional robustness exercise, we focus on the period from January 1, 2016 to December, 31, 2018, which captures Bitcoin’s pronounced boom–bust cycle and provides a market regime distinct from the main sample (June 2019–January 2022). During this episode, Bitcoin experienced rapid appreciation followed by a substantial correction, offering a stress test for the stability of any predictive indicator.
The results, summarized in Figure A5 in the Appendix, show that the HI-based strategy continues to generate positive and economically meaningful performance during this earlier market phase. The direction and relative strength of returns are broadly consistent with those obtained in the main sample, suggesting that the HI captures underlying investor heterogeneity and sentiment dynamics that persist across different regimes.
For completeness, Figure A6 in the Appendix presents results for the full sample period (January 1, 2012–January 30, 2022), which similarly confirm the robustness of our findings. Collectively, these analyses indicate that the HI retains its explanatory and predictive relevance even when tested under alternative and more volatile market conditions.
However, further temporal extensions are constrained by data availability. Reddit posts are no longer accessible via web scraping due to policy changes implemented in 2023, when the platform restricted its API and introduced stricter access and licensing requirements (see Reddit Data API Terms: https://www.redditinc.com/policies/data-api-terms). Consequently, our analysis relies on historical Reddit data collected prior to 2023.
Overall, these robustness checks and clarifications enhance our confidence that the heterogeneity index provides a stable and informative measure of market sentiment, even though its predictive scope is inherently bounded by data availability.
Conclusion
Herd instinct is the tendency of investors to follow the actions of others, leading to a lack of independent decision-making. To capture the tendency in the digital currency market, we choose the Bitcoin subreddit on Reddit (https://www.reddit.com/r/Bitcoin/) due to its large size and influence on individual investors. We are interested in the Reddit community because it gives a substantial impact on individual investors’ attention, leading to significant liquidity and changes in stock prices.
We test the hypothesis that investors’ attentions expressed in the subreddit for the Bitcoin forum (r/Bitcoin) can be used to detect herd behavior among individual cryptocurrency investors. Our results indicate that this measure is a significant predictor of equal-weighted and transaction-value-weighted cryptocurrency portfolio returns. The herd behavior index (HI) can also forecast portfolio returns during the out-of-sample period. Investment sentiment is a crucial proxy for herd behavior in cryptocurrency markets. Since speculative market sentiment can cause prices to vary from their fundamental values, our findings suggest a herd instinct measurement can explain the variation in cryptocurrency asset prices
Our study highlights the influence of cryptocurrency investors’ herd instinct, which is a psychological and behavioral factor, in predicting cryptocurrency returns. Unlike traditional stocks, cryptocurrency assets do not have common fundamental factors to explain the variation in their prices. We show that the herd instinct score (or herd behavior index) extracted from Reddit regarding the cryptocurrency market can be used as a psychological and behavioral factor to detect investors’ plausible herd behavior and to explain digital currency returns. Our empirical results provide evidence that the herd behavior index is more informative and leads to an increase in trading volumes. To investigate the lead-lag relationship between the HI index and cryptocurrency returns, we employ the Impulse Response Function (IRF) with local projection and wavelet analysis. Both analysis results indicate that an increase in positive and negative postings on r/Bitcoin leads to a corresponding increase in trading volume (long or short positions) and influences the variation of cryptocurrency returns over a period of one to two days.
Based on the herd behavior index, at a daily frequency, we develop a long and short trading strategy with equal-weighted and transaction value-weighted portfolios at a daily frequency. Our results demonstrate that our trading strategies outperform even after accounting for trading costs. In addition, our results are consistent with earlier studies that have emphasized an asymmetric risk-return structure to investing attitudes and show that a short strategy shows greater sensitivity to HI compared to a long strategy. These findings point to the existence of asymmetric herding behavior in cryptocurrency markets, particularly when it comes to posts on Reddit that contain intangible textual information. Our research data shows that investors react to negative community postings more sensitively and fearfully than they do to favorable postings. This unequal response to textual cryptocurrency information explains the divergent trading results seen between long and short positions.
Our study contributes to the literature on cryptocurrency returns by examining the time-varying relationship between cryptocurrency returns and investors’ herd instinct. Our findings provide policymakers and traders with insights into the significant impact of herd instincts among cryptocurrency investors, as observed in Reddit discussions, on the digital currency market. Strong positive herd instincts tend to occur before the market experiences increased transaction volumes and price upticks, while strong negative herd instincts are likely observed before the market sees increased volumes and price drops. This insight can help traders understand digital currency anomalies and implement effective long and short equity trading strategies. Moreover, it can assist policymakers in taking preemptive actions to prevent market panic, mitigate systemic risks, and avoid the spread of panic to other markets. It also underscores the importance of regulatory oversight and due diligence to control market volatility.
Footnotes
Funding
The author(s) received no financial support for the research, authorship, and/or publication of this article.
Declaration of Conflicting Interests
The author(s) declared no potential conflicts of interest with respect to the research, authorship, and/or publication of this article.
Notes
Appendix I. Impulse response function (IRF)
Consider a reduced form VAR model
From a reduced form VAR model, we can recover a structural VAR model with an identification. Then, we have a structural VAR model.
Following Jordà (2005), we project
The slope matrix
Appendix II. Wavelet analysis
We employ maximal overlap discrete wavelet transform (MODWT), which is a linear operation that decomposes signals into wavelet and scaling coefficients through filtering.[16] To obtain wavelet coefficients and the wavelet correlation at different time scales, we provide a brief review of the process. In essence, wavelets can be decomposed into a scaling function, which represents the trend, and a wavelet function, which describes the deviations from the trend. The wavelet variance is first calculated using the MODWT coefficients for scale
The wavelet covariance is not influenced by coefficients that explicitly incorporate periodic boundary conditions. This means that the covariance does not account for variations in the univariate time series. Consequently, the wavelet correlation can be derived as follows:
Appendix IV. Auxiliary tables
ACF and PCF for research variables.
| Lag Order | CRMK | HI | GSVI | BTCAAD | CRSP | EWP | TVWP | |||||||
|---|---|---|---|---|---|---|---|---|---|---|---|---|---|---|
| ACF | PCF | ACF | PCF | ACF | PCF | ACF | PCF | ACF | PCF | ACF | PCF | ACF | PCF | |
| 1.00 | 1.00 | 1.00 | 1.00 | 1.00 | 1.00 | 1.00 | 1.00 | 1.00 | 1.00 | 1.00 | 1.00 | 1.00 | 1.00 | |
| 0.16 | 0.16 | 0.49 | 0.49 | 0.02 | 0.02 | 0.17 | 0.17 | 0.23 | 0.23 | 0.15 | 0.15 | 0.14 | 0.14 | |
| 0.08 | 0.06 | 0.02 | 0.34 | 0.23 | 0.24 | 0.31 | 0.35 | 0.15 | 0.10 | 0.07 | 0.05 | 0.07 | 0.05 | |
| 0.05 | 0.03 | 0.02 | 0.23 | 0.05 | 0.05 | 0.02 | 0.17 | 0.04 | 0.01 | 0.05 | 0.03 | 0.05 | 0.03 | |
| 0.11 | 0.09 | 0.01 | 0.14 | 0.01 | 0.06 | 0.00 | 0.18 | 0.09 | 0.07 | 0.08 | 0.07 | 0.08 | 0.07 | |
| 0.03 | 0.01 | 0.05 | 0.17 | 0.07 | 0.11 | 0.29 | 0.49 | 0.06 | 0.02 | 0.01 | 0.01 | 0.01 | 0.01 | |
| 0.04 | 0.06 | 0.00 | 0.18 | 0.01 | 0.01 | 0.00 | 0.50 | 0.08 | 0.12 | 0.03 | 0.04 | 0.03 | 0.04 | |
| 0.02 | 0.03 | 0.05 | 0.10 | 0.07 | 0.03 | 0.55 | 0.07 | 0.12 | 0.09 | 0.01 | 0.01 | 0.01 | 0.01 | |
| 0.00 | 0.01 | 0.07 | 0.16 | 0.04 | 0.05 | 0.04 | 0.14 | 0.22 | 0.18 | 0.05 | 0.05 | 0.05 | 0.05 | |
| 0.03 | 0.03 | 0.07 | 0.08 | 0.00 | 0.02 | 0.30 | 0.01 | 0.15 | 0.06 | 0.02 | 0.04 | 0.02 | 0.04 | |
Note. The table below provides the autocorrelation function (ACF) and partial autocorrelation function (PCF) values for the variables CRMK, HI, GSVI, BTCAAD, CRSP, EWP, and TVWP across ten lag orders (