



Abstract
Amid escalating urban environmental challenges, digital evaluation of street environments becomes vital. Deep Learning (DL) and related technologies have been increasingly applied to analyze streetscapes. Existing research predominantly focuses on urban street elements, neglecting comparative analyses across diverse contexts like urban, suburban, and distinctive street types. This research, conducted in Taichung City, Taiwan, employs DL and other methods for a comprehensive assessment of urban street elements, including building facades, dimensions, furniture, greening, and openness, creating a thorough streetscape quality evaluation framework. Utilizing the Delphi method and Analytic Hierarchy Process (AHP), 5 main categories and 16 factors were identified. Street greening emerged as the most critical, accounting for 33.39%, while street proportions were the least at 12%. Visible sky extent and building color harmony were prioritized. The study applied DL to assess landscape quality preferences near the National Taichung Theater, Shuren Business District, and Audit New Village, revealing the highest landscape quality score around the National Taichung Theater (82.7%), the lowest in Shuren Business District (59.6%), and a mid-level at Audit New Village (63.2%). Pearson correlation analysis confirmed a positive correlation between questionnaire and DL-evaluated scores. Multivariable linear regression showed these five categories significantly impact streetscape quality preferences, providing a scientific basis for urban development and enhancing resident satisfaction.
Keywords
Introduction
As the global urban population continues to expand, environmental challenges worldwide are becoming increasingly severe, with human living environments under constant threat from extreme adverse climates, urban heat island effects, and air and water pollution (Blanco et al., 2009). The rapid urbanization conceals an inefficient mode of urban expansion, leading to a series of urban problems such as traffic congestion, insufficient public space, and environmental degradation (Sun et al., 2023). As the quality of life for urban residents improves, they have higher expectations for their living urban environments (Keeler et al., 2019; Pataki et al., 2021). City streets, spaces where residents frequently interact in their daily lives, are also key factors affecting their emotions and behaviors (Markevych et al., 2017; R. Wang, Feng, Pearce, Zhou, et al., 2021). Therefore, there is an urgent need to assess urban street environments digitally. This approach not only provides an understanding of the current urban conditions but also makes rational suggestions for street planning, thereby enhancing the life satisfaction of residents (Gao, 2021; Labib et al., 2020).
In the process of urban street research, the common practice has been to rely on experienced personnel to personally collect surveys and data, while also recruiting volunteers to help complete the investigations. However, due to the potential lack of relevant professional background, errors such as data duplication may occur during collection (Fryer, 2014; Seiferling et al., 2017). In most urban street studies, the data collection and analysis process is often both time-consuming and labor-intensive, frequently limited by observation times and the number of observers (Gehl & Gemzøe, 2004). Since urban planning projects require a significant amount of time and an unpredictable budget, some large-scale plans may not be implemented (R. Wang, Feng, Pearce, Yao, et al., 2021). The latest DL and big data technologies have brought about significant changes to urban street research (Dong et al., 2021; Sulis et al., 2018). Utilizing street view photos allows for convenient in-depth research and analysis of urban streets (Ibrahim et al., 2020). Image segmentation models in DL algorithms, such as DeepLab, are capable of interpreting the semantic information and features of streetscape photos (Badrinarayanan et al., 2017; L. C. Chen et al., 2018). With the popularization of DL technology in urban street research, it has become possible to automatically recognize various elements from a large number of street view images (Zhou et al., 2019; Zuurbier et al., 2021). Although people’s perception of urban landscapes is subjective, numerous studies have shown that street view images and deep learning models can effectively assess human perception (Dubey et al., 2016; Yao et al., 2019; Zhang et al., 2018).
Numerous scholars have utilized DL to examine urban streetscapes, such as using DL to measure the visibility of street greening by categorizing images into 19 classes, including roads, buildings, vegetation, sky, cars, and pedestrians, among others (Xia et al., 2021). Researchers have assessed the spatial characteristics of urban streets in the main urban area of Fuzhou City through DL technology, covering the spatial distribution of indices such as car interference, space availability, road area, green visual perception, sky visibility, spatial enclosure, color diversity, and visual complexity (Rui & Cheng, 2023). Taking Xiamen Island as an example, scholars combined DL with landscape ecology to automatically quantify urban street quality using a large number of street view images (Wen et al., 2022). Researchers analyzed the appearance of buildings using DL technology to identify their style and historical period (Sun et al., 2022). The object detection algorithm YOLO, a DL technique, has been applied to identify and assess the condition of street trees (Choi et al., 2022). DL technology has been widely applied across various aspects of urban streetscape research (e.g., perception, greening, spatial characteristics, quality quantification, architecture, vegetation). However, existing studies predominantly focus on single street types or specific elements, lacking integrated consideration. This constrains the development of a holistic framework for comprehensive streetscape quality assessment and hinders a deeper understanding of overall street environmental quality and its influence mechanisms.
Based on the context and research gap identified, this study examines key factors influencing street landscape quality from a landscape design perspective. It specifically focuses on identifying street design strategies that better accommodate both pedestrian and vehicular environments, given that street view preference studies constitute a key branch of environmental preference research (Kaplan & Berman, 2010). Researchers have analyzed differences in environmental cognition among experts, non-experts, and individuals across cultures, establishing environmental preferences through urban space imagery assessment (Herzog, 1992). Pleasing urban spaces are characterized by the orderliness of design elements and an appropriate level of complexity (Nasar, 1994). Streets constitute the primary space for pedestrians to carry out daily activities (Adkins et al., 2012). The experiential quality and standard of streets rely on their ability to provide comfort, safety, and visual appeal (Southworth, 2005). Numerous scholars have utilized DL technology to study streetscape preferences and have derived effective street design and improvement recommendations (Ma et al., 2021; Rossetti et al., 2019; Zhang et al., 2018). In summary, employing technologies such as DL to study streetscape quality and construct preference models is not only necessary but also a key step in advancing urban planning and development.
This study explores DL and related technologies for urban street identification and evaluation to enhance data collection efficiency and accuracy. It aims to develop a comprehensive streetscape quality assessment model integrating landscape features, greenery, architectural characteristics, and vegetation. Focusing on urban, suburban, and distinctive district streets in Taichung City, Taiwan, the research objectives are:
Identify and explore key factors influencing streetscape quality preferences.
Compare and analyze variations in streetscape quality across different street types (urban, suburban, and distinctive streets).
Develop a DL-based, integrated streetscape quality preference assessment model.
Validate the rationality and accuracy of the proposed streetscape quality preference model.
Provide targeted recommendations for street design and improvement based on research findings.
Literature Review
Exploring Factors Influencing Streetscape Quality
To construct a model of factors affecting preferences for streetscape quality, exploring key factors to improve streetscape quality is a crucial initial step. This study employs a literature review method, analyzing and organizing 21 domestic and international pieces of literature in detail, as shown in Table 1. The research results present four strategies for enhancing streetscape quality: (1) streets with reasonable scales, (2) multi-level streetscapes, (3) comprehensive street facilities, and (4) safe and comfortable street environments.
Factors Influencing Preferences for Streetscape Quality.

This article has thoroughly sorted out the key factors that affect the quality of streetscapes and organized their definitions, calculation formulas, and evaluation criteria according to the literature, as shown in Appendix 1. Considering that future research will use technologies such as DL to identify these key factors, this study will select factors that can be accurately identified by technologies like DL, as shown in Table 2.
Factors Affecting Streetscape Quality that can be Identified by Technologies such as DL.

Study Area and Data
Study Area
The research sites chosen for this study are situated in Taichung City, Taiwan, encompassing three distinct types of streets: urban streets, suburban streets, and streets in characteristic areas. Specifically, the locations selected include the National Taichung Theater, Shuren Business District, and Audit New Village, as illustrated in Table 3 and Figure 1. The streets near the National Taichung Theater form part of an urban planning area, signifying that these streets have undergone meticulous planning and traffic optimization. Conversely, the streets surrounding the Shuren Business District in the Wufeng District have not been detailedly planned, frequently resulting in traffic congestion. Audit New Village is one of the characteristic areas within the urban district, where vehicle traffic is prohibited, featuring distinctive architectural styles, and street layouts that demonstrate unique overall coherence.
Basic Information on Study Area.


Locations of the study area.
Data Collection
To address these challenges associated with quantifying streetscape appearance for identification purposes in this study, we employ semantic segmentation of street view imagery. Specifically, we utilize the DeepLabV3+ model (Chen et al., 2018; Peng et al., 2023), an advanced deep learning architecture designed for image semantic segmentation. DeepLabV3+ excels at pixel-level classification, significantly enhancing the accuracy of object recognition and boundary delineation within complex scenes like street view images (its structure is illustrated in Figure 2). This capability makes it particularly suitable for parsing urban landscapes into distinct semantic categories.

DeepLabV3+ model framework.
For training and applying this model to street scenes, we use the Cityscapes dataset. The Cityscapes dataset, a popular dataset specifically utilized for training and evaluating technologies for identifying and classifying various elements within urban street scenes (e.g., roads, buildings, pedestrians, etc.), when processed using the state-of-the-art image segmentation technology DeepLabV3+, accurately identifies and classifies 82% of the pixel areas within images. This model demonstrates exceptional accuracy, with the dataset categories presented in Table 4 (L.-C. Chen et al., 2018; Cordts, 2025; Cordts et al., 2016). Overall, employing the DeepLabV3+ model in combination with the Cityscapes dataset effectively overcomes the challenges of urban streetscape identification and quantitative analysis, thereby elevating the standard of recognition and classification for urban street scene elements.
Class Definitions for the Cityscapes Dataset.

Collection of Street View Images
This study obtained data through the Open Street Map (OSM) interface and used ArcGIS software and the Python language to capture static street view images taken in 2023. These images were collected every 25 m on a road network pointing northward (with a heading angle of 0°). The selection of static street view images for this research is primarily based on considerations of visual needs in different study areas. For urban and suburban areas, the focus is on the driver’s perspective, while in distinctive areas, the emphasis is on the pedestrian’s viewpoint. Therefore, in these two scenarios, the visual range is usually more limited. Moreover, although panoramic images can provide a broader perspective, they are prone to image distortion due to their inherent characteristics, which could affect the accuracy of assessments (Li et al., 2018; Tsai & Chang, 2013; Yin et al., 2015), making the use of static images more appropriate. Previous researchers collected streetscape images at intervals of 20 to 100 m along the road network (Helbich et al., 2019; Lu, 2019; Lu et al., 2018; Wang et al., 2019; Ye et al., 2019). In this study, the decision to collect an image every 25 m was mainly for two reasons: firstly, to effectively reduce the visual overlap between street view images, enhancing the uniqueness and efficacy of the data. Secondly, considering the characteristics of Taiwanese streets, which are generally narrower and shorter, this interval setting is more suitable for capturing key changes on the streets, ensuring the representativeness and practicality of the collected data. When collecting street images in three study areas, considering that some areas have wider roads, images from both sides of these roads were chosen to obtain a more comprehensive perspective. The collection results are as follows: a total of 112 street images were obtained around the National Taichung Theater research area; 90 images were captured around the Shuren Business District; and 19 images were collected near the Audit New Village, as shown in Figure 3. This method ensures that the streetscapes of each study area can be captured from multiple perspectives.

Sampling points of the three study areas.
Methodology
This study adopts a mixed-methods approach integrating subjective and objective data. An initial indicator framework, refined via Delphi expert consultation, was weighted using AHP through expert pairwise comparisons. Street scene semantic segmentation (DeepLabV3+) quantified environmental elements across multiple sites, while structured surveys captured subjective perceptions. Spatially matched objective measurements and subjective ratings underwent Pearson correlation for cross-validation. Multiple linear regression analyzed factor interactions. In this study, the concrete steps for exploring and evaluating the factors affecting streetscape quality are as follows:
Literature review: A comprehensive review of literature was conducted to collate various factors impacting streetscape quality.
Delphi method questionnaire: The Delphi method was applied to gather expert opinions from multiple fields, conducting a preliminary assessment and filtering of these factors, eliminating relatively less important indicators.
Analytic hierarchy process (AHP): Utilizing AHP and inviting an expert panel to re-evaluate the remaining key factors aimed to determine their relative importance and calculate the weights of each factor accordingly.
Evaluation and calculation with DL and other technologies: For the three study areas, DL and other relevant technologies were used to assess these key factors and calculate their scores based on the standards summarized in the literature review.
The field investigation for this study was conducted over a seven-week period from March 28 to May 16, 2023. A structured questionnaire survey was administered across three designated study areas to assess public preferences regarding street visual landscape quality. In each study area, a total of 100 valid responses were systematically collected, yielding an overall sample size of 300 completed questionnaires for subsequent analysis.
Pearson correlation analysis: The average preference scores of various factors from the questionnaire results were calculated and subjected to Pearson correlation analysis with the average factor scores previously obtained through technical means, to validate the effectiveness and rationality of the constructed streetscape quality preference model.
Multiple regression analysis: Utilizing questionnaire statistical data for multiple regression analysis to further dissect how these factors collectively influence streetscape quality preferences.
Delphi Method
This study employed the Delphi method to perform an importance assessment of the factors affecting streetscape quality listed in Table 3, inviting 12 experts from various fields to complete the Delphi survey questionnaire. The importance of the factors was measured using a Likert five-point scale, ranging from 1 (not important at all) to 5 (extremely important). The set screening criterion was an average score of 3.5 for a factor, with those scoring equal to or greater than 3.5 considered significant and retained, while those below this standard were excluded. Additionally, this research utilized Excel software for auxiliary calculations. The Delphi technique is a scientific method designed to organize and manage structured group communication processes to generate a profound understanding of current or future challenges (Dalkey & Helmer, 1963; Kendall, 1977; Rowe & Wright, 2011). The required number of experts generally falls between 3 and 30 (Buriack & Shinn, 1989; Loo, 2002; Powell, 2003). In most Delphi studies, the range considered as acceptable consensus is broad, varying between 50% and 97% (Diamond et al., 2014; Foth et al., 2016).
Analytic Hierarchy Process (AHP)
This research continued to invite the previously mentioned experts to fill out the AHP questionnaire regarding factors influencing streetscape quality. The aim was to calculate the weights of these factors and rank them in order of importance. The scale was set from 1 (equally important) to 9 (extremely important). The consistency ratio of the obtained calculation results must be below .1 to ensure the reliability of the outcomes. The yaahp software was utilized to perform the AHP calculation process. AHP, proposed by Saaty, is used to handle complex multi-criteria decision-making problems (Saaty, 1980). AHP assists decision-makers in making more informed choices when faced with multiple interrelated and often competing criteria. By setting criteria in the context of the decision objective, AHP establishes a priority among these criteria, thereby optimizing the decision-making process (Shapira & Goldenberg, 2005). The AHP process is divided into three main steps: first, constructing a hierarchy; second, making pairwise comparisons; and finally, performing a consistency test (Saaty, 1980). In the application of AHP, if the consistency ratio is less than .1, this indicates that the results of the pairwise comparisons are highly consistent, hence, the judgments made during the decision-making process can be considered reliable (Saaty, 2001).
Identification and Assessment of DL and Other Technologies
Deep learning techniques quantified pedestrian preferences by analyzing street imagery. Using the DeepLabV3+ semantic segmentation model and the Cityscapes dataset, we identified street elements. Component proportions were calculated to support street assessments. Implementation in PyCharm involved:
Setup: Created a Python virtual environment, installing TensorFlow, OpenCV-Python, and NumPy.
Data/model acquisition: Downloaded the pretrained DeepLabV3+ model and Cityscapes dataset into the project directory.
Processing/inference: Target images stored in an Input directory were preprocessed automatically. The loaded model performed semantic segmentation.
Output: Upon completion (“Processing Complete”), segmented images saved to an Output directory. The program computed relative proportions of identified elements per image, compiling results into an Excel file for analysis. For instance, as shown in Figure 4, the DeepLabV3+ image segmentation technique is used to process the Cityscapes dataset, thereby segmenting and calculating the street elements and their proportions in the images.

Semantic segmentation of streetscape images.
Not all factors are suitable for measurement using semantic image segmentation, including Preference for Architectural Form Edges, Color Harmony Degree, Street Height-to-Width Ratio, the Shading Capacity of Trees, and Ornamental Value of Trees. The common characteristic of most factors is their subjectivity, while this study attempts to assess them through technical and objective methods.
The method for calculating the Preference for Architectural Form Edges involves initially using eCognition software to analyze the size and edges of architectural blocks in images; then, the analysis results are input into Fragstats software to calculate the Fractal Dimension (FD) values (Chen et al., 2006). FD analysis is a precise method used to measure the geometric information density and diversity in images or objects (Ostwald & Vaughan, 2016). The fractal dimension of an image ranges between 1 and 2, serving as an indicator of complexity. Lower values signify simpler forms, while higher values indicate more complexity and irregularity (Foroutan-Pour et al., 1999). Fractal dimensions between 1.3 and 1.5 are most preferred (Taylor, 2001), as illustrated in Figure 5.

The eCognition software analyzes the size and edges of architectural blocks; the Fragstats software calculates the FD values.
The method for calculating the Color Harmony Degree involves using Python’s OpenCV and Matplotlib libraries to identify and analyze the grayscale histograms of two adjacent streetscape images, which show the distribution of each grayscale level in the images. Subsequently, the cosine similarity between the images is calculated according to the following formula. If the two images are identical, their grayscale histograms will also match perfectly, resulting in a cosine similarity of 1. The closer the cosine similarity is to 1, the higher the similarity between the pixels, indicating a higher Color Harmony Degree of the architecture (Jiang et al., 2022). An example is shown in Figure 6, comparing and analyzing the grayscale histograms of two adjacent streetscape buildings, contrasting the distribution of grayscale levels, and calculating the cosine similarity based on the formula. As shown in the following Equation 1:

In the formula, A and B represent two adjacent streetscape images in the streetscape spot, with

The architectural façade and its grayscale histogram.
The street height-to-width ratio is used to measure the relationship between the height of buildings and the width of streets (Ali-Toudert & Mayer, 2006; Santamouris et al., 1999). It is necessary first to collect data on the street’s Digital Elevation Model (DEM) and width, and then use the raster calculation method in ArcGIS, adopting an area-weighted approach, to divide the average height of the street buildings by the street’s average width to perform the calculation. The average width of the street is the numerical value obtained by dividing the street area by its total length (Zheng et al., 2018) The ideal street space scale height-to-width ratio is between 1 and 2 (Zhang et al., 2010).
When evaluating factors such as the shading capacity of trees and the ornamental value of trees, this study utilizes Python to read the BJFU100 dataset in order to obtain data on various trees on the streets. The BJFU100 dataset is among the critical databases focused on natural images, including pictures of ornamental plants’ leaves and overall morphology. It encompasses 10,000 images of 100 plant species, playing a key role in the field of plant identification and achieving a plant identification accuracy rate of up to 91.78% (Sun et al., 2017) . Due to the limited data range of this dataset, which cannot cover all tree species within the research area, it is necessary to supplement with tree identification software to recognize the tree species in the images. This method of tree species detection lies in assessing the shading effects of various trees and their ornamental value, as exemplified in Figure 7. To enhance the accuracy of identification, it is necessary to preprocess the image quality or extract the identification object beforehand.

Image preprocessing prior to tree species identification.
Data Collection, Model Validation, and Preference Analysis
Pedestrians, as primary street space users, evaluated street landscape quality. Using real-world photographs, pedestrians (n = 300 across three areas) assessed multidimensional design criteria and overall experience via 5-point Likert scale questionnaires. DL techniques objectively scored key landscape features following Appendix 1 criteria. Pearson correlation validated the model comparing DL-derived objective scores with pedestrian subjective ratings. Multiple linear regression identified key factors influencing pedestrian preferences (Table 5).
Streetscape Quality Preference Questionnaire Survey.

Results
Identification and Weight Ranking of Key Influencing Factors
According to the statistical results of the Delphi method expert questionnaire, among a total of 19 factors, the average scores of 16 factors exceeded 3.5, thus being selected for retention. The three excluded factors are: tables and chairs (3.08), trash cans (2.83), and clocks (2.92). The factors ultimately confirmed for retention are listed in Table 6.
Average Factors Influencing Streetscape.
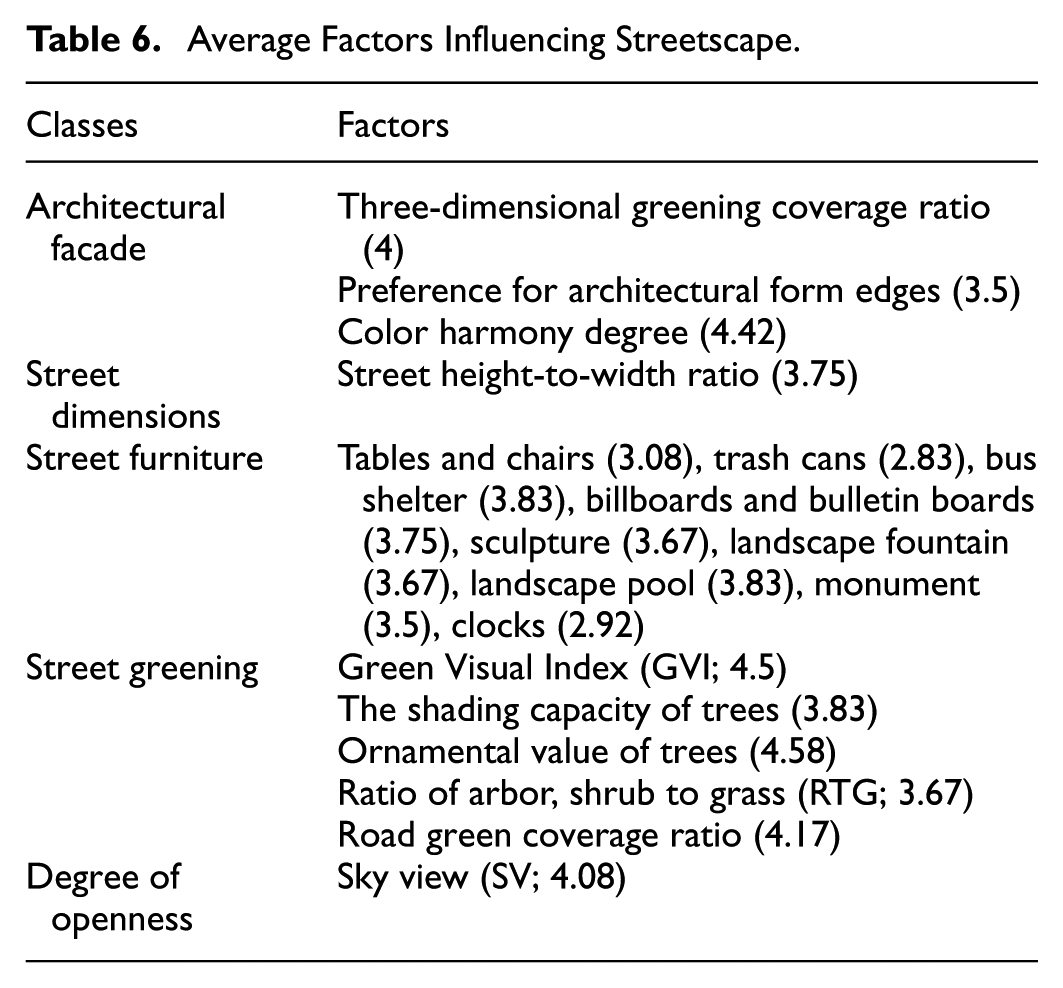
The purpose of using AHP is to calculate the weights of different factors and rank their importance. After collecting and organizing all questionnaire data, it is necessary to build a hierarchical model in yaahp software for subsequent calculations. The results indicate that, among all categories, Street Greening has the highest weight (33.39%), followed by Architectural Facade (19.99%), while Street Dimensions have the lowest weight (12%). Among all evaluated factors, Sky View has the highest weight (16.98%), followed by Color Harmony Degree (13.73%), and the weight of Monument is the lowest (.67%), as shown in Table 7. Additionally, the Consistency Ratio (CR) is .08, which is below the threshold of .1, indicating that the judgment matrix has good consistency, the experts’ opinions are relatively unified, and the model results are reliable, as shown in Table 8.
Weights and Rankings of Streetscape Quality Factors.

Weight Analysis of Streetscape Quality Factors.
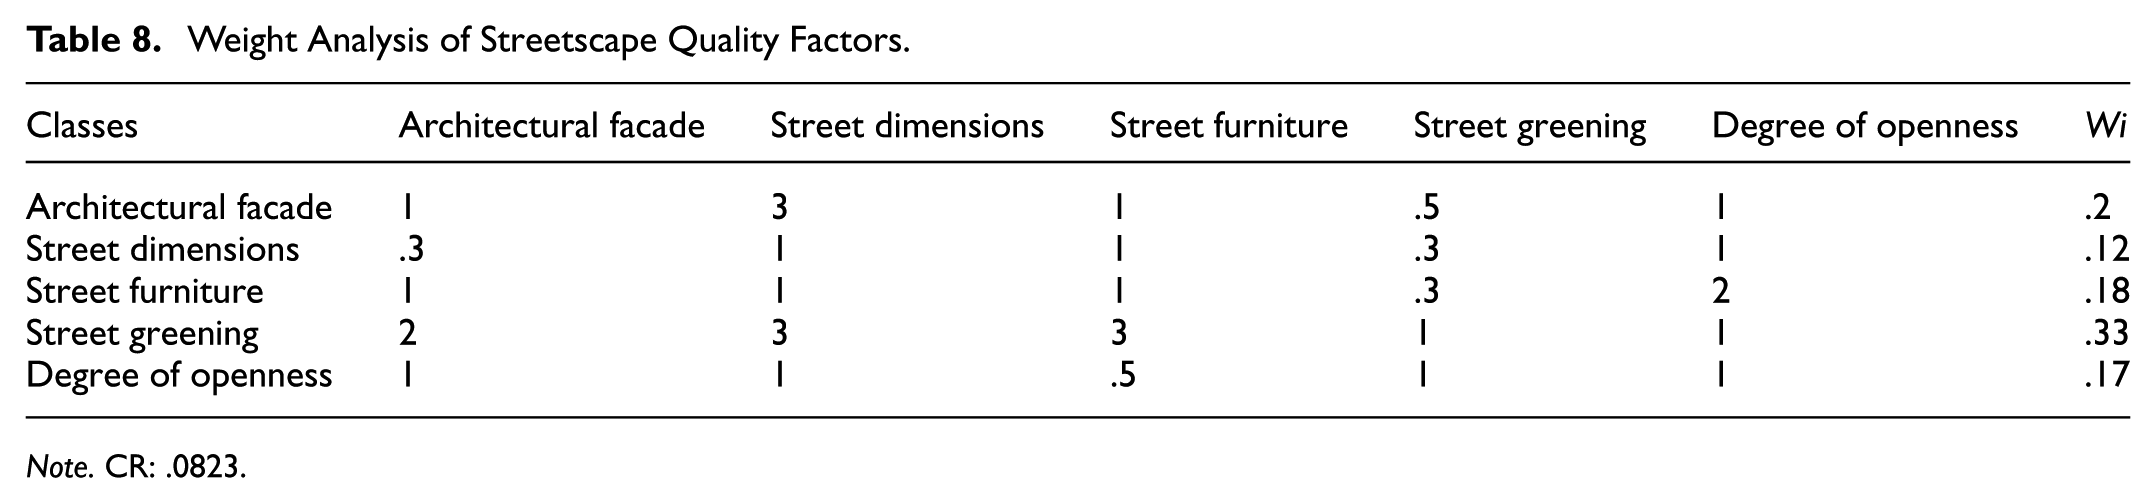
Note. CR: .0823.
Comprehensive Evaluation of Streetscape Quality Factors for the National Taichung Theater
Based on the evaluation criteria outlined in Appendix 1, this study conducted a comprehensive assessment of various elements of urban streets, incorporating techniques such as DL. Theoretically, the maximum attainable raw score—defined as the highest possible sum of all unweighted factor scores—is 53 points. The average raw score of all evaluated streets within the study area was 38.2 points, representing 72.1% of the theoretical maximum. According to these raw scores, the preliminary ranking of the streets is shown in Figures 8 and 9: Huimin Road has the highest score (41 points), followed by Municipal North Second Road (40 points), Huilai Road Section 2 (39 points), Municipal North Sixth Road (37 points), Henan Road Section 3, and Municipal North First Road are tied (all 36 points).

National Taichung theater street evaluation results.

Overall evaluation of the National Taichung theater street.
To more accurately reflect the relative importance of various factors influencing streetscape quality, weighted scoring criteria were introduced. The maximum score for each factor was multiplied by its corresponding weight, resulting in a theoretical maximum weighted total score of 343.85 points. For each street, the score for each factor was likewise multiplied by its weight and then summed to obtain the final weighted total score. The weighted average score across all streets was 284.45 points, representing 82.7% of the theoretical maximum (343.85 points). This performance, significantly exceeding the benchmark threshold of 60%, clearly indicates that the overall streetscape quality within the study area is at a high level. It demonstrates that, under a comprehensive evaluation framework that accounts for the significance of key elements, the area as a whole performs excellently. Based on the final weighted total scores, the detailed ranking of the streets is presented in Appendix 2: Huimin Road (301.93 points) > Municipal North Second Road (298.88 points) oiHuilai Road Section 2 (285.83 points) oiMunicipal North Sixth Road (284.99 points) oiHenan Road Section 3 (271.26 points) > Municipal North Road (263.81 points).
Through in-depth analysis and quantitative evaluation of various street elements, significant deficiencies were identified in the building facade dimension of this area: The vertical greening coverage score was notably low, indicating a severe shortage of three-dimensional vegetation; the building edge preference score was moderate, suggesting relatively standardized architectural forms with limited unconventional designs. The district performed exceptionally well in the color dimension, achieving high scores in chromatic harmony. The predominant building hues were concentrated in blue-gray and brown-gray tones, exhibiting high color similarity with minimal clashes (Figure 10), resulting in a cohesive and harmonious visual impression. Street scale and planning-related metrics demonstrated reasonable scores, reflecting an overall appropriate spatial layout. Evaluation of street furniture revealed satisfactory scores for the rationality of distribution and adequacy in quantity of facilities such as bus stops, billboards, and signage. However, the richness score for artistic and landscape features—including sculptures, fountains, pools, and monuments—was notably low, highlighting a pronounced lack of public art elements. The greenery performance was outstanding overall: High scores were achieved in green view index, indicating excellent street vegetation coverage; shade capacity assessment of street trees (e.g., Zelkova, Rosewood, Sweetgum, Goldenrain Tree, and Chinaberry) scored prominently; ornamental value evaluation showed appropriate application of species such as Bald Cypress, Hong Kong Orchid Tree, Sweetgum, Goldenrain Tree, and Frangipani. The high score in tree-shrub-grass ratio confirmed scientifically structured plant layering, though road greening rate remained moderate, leaving room for improvement. Additionally, the high street openness score provided drivers with expansive sightlines. Comprehensive evaluation results of all elements are detailed in Figure 11.

The predominant color scheme of the buildings surrounding the National Taichung Theater.

The evaluation of various elements along the streets surrounding the National Taichung Theater.
Comprehensive Evaluation of Streetscape Quality Factors in Shuren Business District
The average landscape quality assessment score for all streets within the study area was 26.4 points, representing only 49.8% of the maximum possible score (53 points). This indicates that the overall street landscape quality of the area falls within the medium-to-lower range, with considerable room for improvement towards the ideal standard. Notable disparities were observed among individual streets, with the specific ranking as follows: Side Road (32 points) > Linsen Road (31 points) > Yuqun Road, Zhongzheng Road Lane 817 (26 points) > Zhongzheng Road (25 points) > Shuren Road and Shuren First Street (23 points) > Yuren Street and Shuren Second Street (22 points; Figures 12 and 13). The weighted analysis, which further accounts for the relative importance of each indicator, reveals a weighted average score of 204.78 points, representing 59.6% of the maximum possible weighted score (343.6 points). This proportion demonstrates an increase compared to the unweighted mean (49.8%), indicating that the street performance is relatively stronger on core evaluation metrics with higher weights. However, the overall landscape quality remains at a moderate level. The ranking of streets based on weighted scores generally aligns with the trend observed in the simple average ranking: Side Road (255.79 points) > Linsen Road (244.41 points) > Yuqun Road (198.22 points) > Zhongzheng Road Lane 817 (194.92 points) > Zhongzheng Road (185.34 points) > Shuren Road and Shuren First Street (185.04 points) > Yuren Street and Shuren Second Street (169.77 points; Appendix 3).

Shuren business district street assessment results.

Shuren business district street overall evaluation.
Analysis of the evaluation scores for various street elements reveals specific urban landscape deficiencies in the study area. The “vertical greening” indicator scored markedly low, with its poor coverage rate not only indicating insufficient three-dimensional vegetation but also highlighting significant shortcomings in ecological benefit enhancement, spatial hierarchy enrichment, and visual experience improvement. The “building edge profile” indicator demonstrated low preference, directly reflecting disordered architectural contours caused by numerous irregular structures, which diminished public appreciation of building aesthetics. A weak performance was observed in the “architectural color coordination” indicator. Analytical results suggest that the absence of meticulous urban design guidelines has led to irregular building color schemes and low chromatic similarity, resulting in noticeable color conflicts that severely compromise environmental harmony (Figure 14). Regarding street facilities, while the distribution of bus stops and signage along arterial roads was relatively reasonable, the lack of street furniture yielded low scores, indicating aesthetic deficiencies in existing infrastructure that failed to enhance environmental quality or attractiveness. Greening issues were particularly prominent: the “street green view index” scored poorly due to inadequate vegetation planning, while indicators such as “tree canopy coverage,”“ornamental tree quality,” and “road greening rate” all fell substantially below standards. These low scores collectively underscore a critical problem—insufficient shade provision and visually appealing plant landscapes in street spaces, resulting in weak ecological regulation and poor pedestrian comfort. Notably, the “sky openness” indicator performed adequately, suggesting relatively unobstructed street sightlines that positively influenced environmental perception. As illustrated by the comprehensive evaluation of street elements (Figure 15), the radar chart visually contrasts all indicator scores, holistically demonstrating the multifaceted challenges in creating high-quality, harmonious, and attractive streetscapes in this area.

The partial color tones of the buildings around Shuren Business District.

Evaluation of various elements of the streets in Shuren Business District.
Comprehensive Evaluation of Streetscape Quality Factors in Audit New Village
The average score of all streets in the study area was 29 points, accounting for 54.7% of the maximum possible score (53 points). This indicates that the overall streetscape quality of the area is at a moderate level, with considerable room for improvement toward the ideal condition. The comparison of scores among streets is as follows: Lane 4, Alley 368, Minsheng Road (31 points) > Lanes 1-2, Alley 368, Minsheng Road (30 points) > Alley 368, Minsheng Road (29 points) > Zhongxing Street (28 points) > Minsheng Road (26 points), as shown in Figures 16 and 17. This ranking intuitively reflects the nuanced variations in landscape quality among different streets, with Lane 4, Alley 368, and Minsheng Road demonstrating relatively superior performance, while Minsheng Road alone exhibits comparatively weaker outcomes. A weighted analysis reveals that the average score for all streets is 217.4 points; the specific rankings are Lane 4, Alley 368, Minsheng Road (257.14 points) > Lanes 1-2, Alley 368, Minsheng Road (225.67 points) > Alley 368, Minsheng Road (209.92 points) > Zhongxing Street (201.26 points) > Minsheng Road (193.19 points), as shown in Appendix 4. The weighted average score proportion (63.2%) exceeds the baseline score proportion (54.7%), primarily attributable to the weight allocation reflecting the structural or functional significance of the road network. This indicates an overall improvement in the regional streetscape quality assessment when accounting for road hierarchy or functional weighting. Although the weighted ranking pattern remains consistent with the baseline scores, the score differentials are amplified, thereby accentuating the disparity between the highest- and lowest-performing streets.

Audit new village street assessment results.

The overall evaluation of audit new village street.
In the assessment of building facades, it was observed that no vertical greening measures had been implemented. The evaluation of the building edge morphology was rated as moderate, meeting basic requirements but lacking distinctive features. In terms of color coordination, the primary tone of the buildings is a brownish-gray, and the overall color harmony was rated as good. The color scheme is cohesive and consistent, with no apparent visual conflicts, particularly enhancing the identity of the featured street. Following unified planning efforts, the overall tonal consistency and color similarity have significantly improved, as shown in Figure 18. The evaluation of street scale indicated appropriateness, with proportional relationships between street elements deemed reasonable and functional. Regarding the arrangement of street furniture, public bus stops were found to be relatively insufficient, while the distribution of billboards was relatively balanced, falling within a moderate range. However, the lack of visually engaging and characteristic street furniture diminishes the vibrancy and aesthetic appeal of the streetscape. In terms of greenery, the street green view index was assessed at a moderate level, though there remains significant room for enhancement. Shade trees—such as Acacia confusa and Ficus microcarpa—are scarce, and while ornamental trees like Taxodium distichum and Acacia confusa are present, their quantity and visual impact are limited, placing them at a slightly below-average level. Additionally, the configuration of shrubs and herbaceous plants is inadequate, resulting in low green coverage along the roadway and compromising the overall landscape quality. The sky view factor was evaluated as average. The overall evaluation of street factors is shown in Figure 19.

The primary color scheme of audit new village architecture.

Evaluation of various factors of audit new village streets.
Model Validation and Predictive Modeling of Streetscape Preferences
A comparison was made between the average scores obtained from field survey questionnaires of different streets within three study areas and those evaluated using techniques such as DL. The effectiveness of the constructed model was verified through Pearson correlation analysis. The statistical results indicate a positive correlation between the actual values and technical evaluation scores across all three study areas, with correlation coefficients for the National Taichung Theater at .909, Audit New Village at .926, and Shuren Business District at .931, as shown in Table 9. These outcomes demonstrate a high degree of consistency between the evaluation results of techniques such as DL and subjective survey questionnaires, affirming the rationality and feasibility of the model in predicting streetscape quality preferences.
Results of Pearson Correlation Analysis.

The correlation is significant at the .05 level (two-tailed).
The correlation is significant at the .01 level (two-tailed).
This study employed multiple linear regression analysis to explore the factors affecting streetscape quality preferences. The method involved selecting five categories from the questionnaire, each with 100 valid data points. Their averages were calculated and used as independent variables. Similarly, the average values of streetscape preferences in the three study areas were set as dependent variables for analysis. The derived regression formulas were as follows:
National Taichung Theater: Streetscape preference = .315 + .190 × architectural façade aesthetics + .202 × appropriate street dimensions + 0.176 × variety of street furniture + .189 × moderate street greening + 0.158 × sufficient sunlight exposure.
Audit New Village: Streetscape preference = 0 + .200 × architectural façade aesthetics + .200 × appropriate street dimensions + .200 × variety of street furniture + .200 × moderate street greening + .200 × sufficient sunlight exposure.
Shuren Business District: Streetscape preference = .005 + .197 × architectural façade aesthetics + .201 × appropriate street dimensions + .200 × variety of street furniture + 0.198 × moderate street greening + .201 × sufficient sunlight exposure. In summary, the five categories in the three study areas have a direct and significant impact on streetscape quality preferences, making these formulas reliable tools for future assessment and improvement of streetscape preferences.
Discussion
The Research Findings
A literature review initially identified multiple factors influencing streetscape quality, which were narrowed down to 19 assessable factors across 5 categories using DL and related technologies. Through the Delphi method, 3 indicators were eliminated, resulting in 16 factors under 5 categories. AHP-derived weights revealed Street Greening as the most influential category (33.39%), followed by Street Dimensions (12%). Among individual factors, Sky View (16.98%) and Color Harmony Degree (13.73%) ranked highest. DL-based assessments showed that streets near the National Taichung Theater had the highest landscape quality (weighted score: 284.45, 82.7% of the maximum), followed by Audit New Village (217.4, 63.2%), and Shuren Business District (204.78, 59.6%). Pearson correlation confirmed alignment between DL assessments and questionnaire scores, while multiple linear regression affirmed the significant direct impact of all five categories on landscape quality preferences.
This study conducts a systematic evaluation of urban, suburban, and special streetscapes (e.g., art-oriented streets), revealing pronounced differences in streetscape quality across areas with varying levels of urban development. The results show that urban streets achieve the highest overall landscape quality. Their coordinated building façades, well-developed greening systems, and expansive sky views collectively create orderly spatial patterns that align with general pedestrian preferences. In sharp contrast, suburban streets score the lowest, largely due to the absence of coherent planning, which results in discontinuous façades, poor color coordination, insufficient greenery, and disorganized traffic patterns. Streets in special districts—represented here by Audit Village—fall between these two extremes, reflecting pedestrians’ nuanced evaluations that balance cultural character with fundamental landscape quality.
The study further identifies four key components shaping streetscape preference. In terms of ecological visual attributes, greening coverage and vegetation layering emerge as fundamental considerations, calling for refined maintenance in urban streets, aesthetic enhancement in special streets, and ecological strengthening in suburban areas. Regarding morphological order, orderly massing and coordinated color palettes are essential. Suburban streets, in particular, require façade improvements and regulation of signage clutter, while special streets may incorporate color strategically to reinforce distinctive identity. For spatial perception, street scale and sky visibility jointly influence spatial experience. Planting strategies are needed to avoid excessive openness in urban streets, alleviate visual confinement in suburban areas, and balance shade provision with spatial transparency in special streets. Finally, in terms of functional experience, streetscape amenities should integrate practicality with aesthetics. Suburban streets must prioritize basic infrastructure upgrades, whereas central urban and special streets should enhance the cultural and artistic quality of their facilities.
The Scientific Contribution of the Study
This study develops a street landscape quality assessment model for Taichung City, Taiwan, integrating DL techniques for automated street view image recognition and classification with expert consultation and quantified physical environmental indicators. This hybrid approach combines objective spatial analysis and subjective evaluations, improving the efficiency and accuracy of large-scale image data processing. Expert input further refines the model’s sensitivity to spatial features and practical utility.
The multi-tiered framework assesses dimensions including spatial scale, green view index, sky visibility, building interfaces, and street furniture. Key innovations involve translating DL image recognition outputs into quantifiable planning metrics, overcoming limitations of traditional subjective assessments and supporting urban design decisions.
Analysis extends beyond central urban areas to suburbs and cultural districts, revealing variations in landscape preferences across regions. Using platforms including Python, ArcGIS, eCognition, and Fragstats, the model evaluates objective spatial characteristics and subjective preferences. Field surveys and Pearson correlation validate the model’s feasibility. Multiple regression identifies associations between five key environmental variables and landscape preferences, strengthening the theoretical and empirical basis for street landscape evaluation.
Differences in Streetscape Quality Among Urban, Suburban, and Special Areas
Assessment across study areas is vital for designers, revealing variations in street design preferences among distinct urban contexts. This underpins strategy refinement, optimizing schemes and aligning them with area-specific needs. Based on our evaluation framework (Table 10), urban streets scored highest for landscape quality preference, followed by unified-planning character districts. Suburban streets scored lowest. These findings are consistent within the study’s evaluative model. As shown in Figure 20, street images from diverse areas reveal variations in landscape quality. For instance, the streets near the National Taichung Theater exhibit well-coordinated architectural facades, comprehensive sidewalks with greenery (e.g., street trees and shrubs), and well-maintained road facilities, reflecting high-quality urban design. However, opportunities for improvement remain, including the incorporation of vertical greening, more attractive street furniture, and enhanced regular maintenance of sidewalk vegetation. Overall, this area scored high in the evaluation. Notably, the preference for architectural form edges in this study area is only at a medium level. One reason is that compared to nearby residences, the National Taichung Theater has a more irregular shape and distinct characteristics, which impacts the scoring. The street ratings suggest that regular and symmetrical architectural forms bring a sense of comfort or order, hence the relatively high scores. However, as a landmark building in the area, the opera house often presents a unique architectural appearance to highlight its cultural and artistic value. Therefore, while evaluating the preference for architectural form edges is important, it should not be overly generalized in urban planning. A comprehensive consideration from cultural, artistic, social values, and other perspectives is also necessary.
Comparison of Streetscape Quality Scores Across Different Study Areas.

Notes: The total average full score is 53, and the weighted average full score is 343.85.

Street images of different areas.
The streets in the Shuren Business District appear disorganized due to the lack of unified planning. Although the buildings are of similar height, the diversity in the shape and color of billboards, along with sunshades added by some residents, disrupts the architectural harmony. Most streets are narrow and lack sidewalks; motorcycles are parked haphazardly along the roadside, leading to significant traffic chaos. Street greenery is sparse; most streets lack any form of vegetation, with street trees only positioned along the main roads in both directions. The absence of street furniture, along with narrow streets and cluttered billboards, obstructs the view of the sky, resulting in the lowest score for this area. The specific issues observed in the study—such as interface disjunction, lack of pedestrian pathways, insufficient greenery, traffic disorder, inadequate facilities, and obstructed views—were identified as key factors contributing to the lower evaluation scores. It is recommended that future efforts focus on unified street planning, the establishment of sidewalks, appropriate planting of street greenery, unification of the form and color of street architecture, and the improvement of the traffic system and street furniture.
Despite being located within the urban area, Audit New Village, as a distinctive district, has a lower streetscape quality score compared to the National Taichung Theater. The main reasons include the lack of attractive street furniture, the scarcity of grass and shrubbery, and unpruned trees, leading to a lower sky view angle. This study suggests that, in distinctive districts as opposed to ordinary streets, pedestrians might prefer the shading function of trees and a lesser view of the sky; whereas drivers might be more inclined towards a higher sky view and trees that do not obstruct their sight. Additionally, distinctive districts might opt for bright colors on certain buildings or street furniture to attract people. Therefore, discussions on streetscapes in distinctive districts and urban streets should be conducted based on specific circumstances.
The Specific Impact of Multiple Factors on Streetscape Quality Preferences
Streetscape preference modeling revealed inadequate 3D greening on building facades across most sites, indicating its under prioritization in urban planning. This contradicts Goel et al.’s (2022) findings emphasizing its visual, spatial, and behavioral benefits. Lower greening ratios also produced spatially compressed streets, constraining social interaction, and reducing communal engagement. Another scholar, Pugh, proposed that green walls can effectively improve the air quality of urban streets (Pugh et al., 2012). Therefore, future street design and improvements should incorporate green walls, which not only enhance aesthetic appeal but also significantly improve air quality. Assessments of “preference for architectural form edges” revealed that urban and distinctive areas feature more regular building forms, whereas suburban buildings—despite some having regular shapes—often appear irregular due to attached billboards of varying designs. This aligns with existing research, where FD analysis of buildings, stations, and green spaces identifies FD value as a key variable in evaluating walkability. High density and morphological diversity in built forms have been shown to influence pedestrian experience (Bari & Tekel, 2022; Cooper et al., 2013; El-Darwish, 2019). Therefore, future urban and suburban street renovations could standardize architectural forms through building regulations, while allowing flexibility in distinctive districts as needed. Regarding the “Color Harmony Degree” assessment, urban buildings—primarily residential—exhibited harmonious low-saturation tones (e.g., blue-gray and brown-gray). Buildings in distinctive areas showed even greater color harmony, whereas suburban buildings displayed chaotic coloration due to highly saturated billboards. These findings align with existing research, such as Behbudi et al. (2012), who emphasize that urban color planning must account for a building’s function, scale, and environmental context. Scholar Wang noted that the colors of residential buildings are mostly warm, with high brightness and low saturation (J. Wang et al., 2021). However, Gou and others had a different view, believing that the color saturation in developed urban areas is higher than in suburban areas (Gou et al., 2021). Therefore, in future architectural color planning, principles of equal tone, equal chroma, unequal brightness values, or high brightness and low saturation should be considered.
In the “Street Dimensions” category, the average street height-to-width ratio varies significantly across urban contexts: 4.4 in general urban streets, 1.7 in characteristic areas, and 2.9 in the Shuren commercial district. These findings suggest that urban streets tend to be overly open, while characteristic areas strike a balanced, comfortable scale. The Shuren district exhibits a mix of spacious main roads and narrower interior pathways. The results align with Gao’s research, highlighting that urban centers—distanced from historic areas—develop taller buildings and larger street scales, creating an open feel, whereas historic districts maintain more proportionate dimensions (Gao et al., 2023). Therefore, in urban planning, not only should urban greening be emphasized, but also the impact of street dimensions on streetscape quality preferences should be considered, appropriately managing the dimensions of various streets.
Urban and characteristic areas exhibit ample bus stops and billboards but lack sculptures, fountains, and monuments. Suburban streets require improved traffic management, controlled outdoor advertising, and enhanced street furniture provision. The findings of this study are consistent with the research results of other scholars, who pointed out that street facilities, such as bus stops, have a positive impact on pedestrian satisfaction (Kim & Lee, 2016). Other scholars have noted that street facilities like sculptures and landscape fountains can enhance the quality of walking. Furthermore, it has been proposed that street facilities such as sculptures and landscape fountains can improve the quality of the walking experience (Kang & Cho, 2014). Therefore, in the future, while supplementing basic transportation facilities, attractive street furniture should also be added to enhance the overall quality of the streetscape.
In the “Street Greening” category, the study reveals key urban-rural disparities: Urban streets exhibit the highest average green view index (32%), tree-to-shrub/grass ratio (41.3%), and road green space rate (20.5%) among all regions. Urban areas exhibit diverse shade-providing and aesthetic vegetation, reflecting advanced greening strategies. Characteristic areas feature some shade and ornamental species but reduced shrubs and herbaceous plants, while suburban streets display sparse tree cover with minimal understory vegetation. These findings align with previous research. For example, Tang and Long (2019), after evaluating the green view index of Beijing’s Hutongs, found that most areas lack greening. Du and Huang (2022) noted that larger-scale greening landscapes could add more green plants to streets, helping to create more ecological street spaces for pedestrians, thereby providing a better street environment. Scholars emphasize that the identification of vegetation elements is crucial for quantifying the spatial quality of urban landscapes (Feng et al., 2021; Sharma et al., 2022). Li et al. (2015) pointed out that green plants can increase the sense of safety for pedestrians. Therefore, for future street greening transformations, this study suggests that urban streets should pay attention to regular pruning of plants to maintain their shade-providing and aesthetic qualities; streets in characteristic areas could moderately increase vegetation arrangements to enhance street aesthetics; while suburban streets should focus on urban vegetation planning, increasing the planting of trees, shrubs, and grasslands to promote an overall improvement in the street environment.
In the “Degree of Openness” category, this study encompasses three distinct research areas. The results indicate that urban streets have the highest average Sky View (38.5%). This suggests that urban streets exhibit a higher degree of visual openness. In contrast, suburban streets, due to some narrower sections and billboards with various architectural facades obstructing the view, have relatively lower visibility of the sky. As for the streets in the characteristic areas, the view is partly obscured due to the lushness of trees and the presence of overpasses and colorful lights in the region. The findings of this study are consistent with previous research. For instance, Li et al. (2017) mentioned that the visibility of the sky is a key factor in perceiving brightness, significantly impacting visual perception and pleasure. It was also noted that streets with more sky elements typically have fewer buildings, more lush greenery, but lack a sense of space and vitality; both too much or too little sky exposure can affect the quality of street space. In evaluating the sky visibility in three central districts of Guangzhou city, Du and Huang found that the proportion of the sky was generally larger (Du & Huang, 2022). This study believes that the Sky View of streets in characteristic areas differs from the other two areas and merits separate discussion. Due to the uniqueness of its area aimed at creating a more intense cultural and artistic atmosphere, some Sky View was sacrificed. Furthermore, considering that the main users of the characteristic area are pedestrians, more shading facilities may be needed.
The Research Limitations
This study proposes a model to analyze factors influencing streetscape quality preferences, using three compact areas for preliminary testing and model validation. The focus is limited to landscape design, excluding engineering, economic, and social dimensions. Street view imagery was primarily captured from a vehicular perspective in urban and suburban areas, with pedestrian views used in distinctive zones. To control for variability, photos were taken only on clear days, without accounting for time-of-day or seasonal changes, which may affect assessments of greenery. While psychological and other factors influence streetscape quality, this study addresses only the most common elements. The current deep learning model and dataset achieve high accuracy but remain subject to ongoing optimization; future work will explore more advanced, discriminative methods.
Future Research Directions
Future research will focus on validating the streetscape quality preference model proposed in this study while broadening its application scope. To examine potential regional limitations, we plan to apply the model across streets in different cities. By guiding students to use the framework in street design and comparing their evaluation results with the model’s outputs through Pearson correlation analysis, we aim to assess its reliability. As the accuracy of the deep learning model and dataset improves, they will be employed to assist in street identification. Given the current reliance on planar imagery, which limits the observation of temporal vegetation changes, future work will incorporate NDVI analysis to evaluate long-term greening dynamics.
This study developed a comprehensive, quantifiable framework for streetscape quality assessment by integrating DL with expert and public perception. The resulting model, structured around 16 factors across 5 categories, identifies street greening and sky view as the most critical indicators, offering a robust and practical tool for urban landscape evaluation. Empirical testing in Taichung City confirmed significant disparities in streetscape quality among urban, suburban, and special district streets. The findings not only validate the framework’s alignment with pedestrian perception but also translate into readily actionable planning strategies: prioritizing greening and spatial order in suburban areas, balancing cultural identity with baseline quality in special districts, and refining spatial experience and amenities in urban centers.
Footnotes
Appendix
The Analysis Results of the Weight of Various Factors for Audit New Village Streets.

| Road name | X 1 | X 2 | X 3 | X 4 | X 5 | X 6 | X 7 | X 8 | X 9 | X 10 | X 11 | X 12 | X 13 | X 14 | X 15 | X 16 | Total |
|---|---|---|---|---|---|---|---|---|---|---|---|---|---|---|---|---|---|
| W 1 | W 2 | W 3 | W 4 | W 5 | W 6 | W 7 | W 8 | W 9 | W 10 | W 11 | W 12 | W 13 | W 14 | W15 | W 16 | ||
| Minsheng road | 3.7 | 5.1 | 41.2 | 24.0 | 2.6 | 5.1 | 7.5 | 2.2 | 2.1 | 0.7 | 6.1 | 22.9 | 33.8 | 10.0 | 5.2 | 84.9 | 257.1 |
| 368 Lane, Minsheng road | 3.7 | 5.1 | 41.2 | 36.0 | 2.6 | 7.7 | 15.1 | 2.2 | 2.1 | 0.7 | 6.1 | 22.9 | 33.8 | 10.0 | 2.6 | 34.0 | 225.7 |
| Lane 1-2, Lane 368, Minsheng road | 3.7 | 5.1 | 41.2 | 36.0 | 2.6 | 7.7 | 7.5 | 2.2 | 2.1 | 0.7 | 9.2 | 22.9 | 22.5 | 10.0 | 2.6 | 34.0 | 209.9 |
| Lane 4, Lane 368, Minsheng road | 3.7 | 5.1 | 27.5 | 24.0 | 5.3 | 5.1 | 7.5 | 2.2 | 2.1 | 0.7 | 9.2 | 22.9 | 22.5 | 10.0 | 2.6 | 50.9 | 201.3 |
| Zhongxing street | 3.7 | 5.1 | 27.5 | 24.0 | 5.3 | 5.1 | 7.5 | 2.2 | 2.1 | 0.7 | 6.1 | 22.9 | 22.5 | 5.0 | 2.6 | 50.9 | 193.2 |
Acknowledgements
I sincerely thank Professor for his invaluable guidance and unwavering support throughout this research. His expertise was instrumental in shaping the study’s carbon neutrality framework, refining methodologies, and applying advanced computational techniques. I am particularly grateful for his technical assistance in drone deployment, which was pivotal to data collection. Beyond technical mentorship, his meticulous feedback on the thesis structure and literature review significantly strengthened the scholarly rigor of this work. His dedication has profoundly enhanced the quality of this research and my academic growth.

Ethical Considerations
To Shengjung Ou, Fuer Ning, and Haozhang Pan: This is to confirm that the study titled “Building Models to Assess Streetscape Quality Preferences Using Deep Learning Techniques: Comparative Analysis of Different Street Types in Taichung City” has been reviewed and approved by the Institutional Review Board (IRB) of the Department of Landscape and Urban Design, Chaoyang University of Technology, Taiwan. The study was conducted in compliance with the ethical principles outlined in the Declaration of Helsinki and adheres to all ethical guidelines for research involving human participants.
Consent to Participate
Verbal consent was obtained from all participants prior to their involvement in the questionnaire survey. Before the survey began, participants were thoroughly informed about the study’s purpose, the structure and content of the questionnaire, and their role in the research. No personal or identifiable information was collected at any stage of the study. Furthermore, participants were clearly briefed on the objectives, procedures, potential risks, and benefits of the research to ensure their full understanding and voluntary participation. The researchers are committed to maintaining the highest ethical standards and are prepared to provide any additional information or documentation upon request.
Author Contributions
Conceptualization: Shengjung Ou and Haozhang Pan. Data curation: Shengjung Ou, Fuer Ning and Haozhang Pan. Formal analysis: Fuer Ning. Visualization: Fuer Ning. Investigation: Shengjung Ou and Haozhang Pan. Supervision: Haozhang Pan. Writing – review & editing: Haozhang Pan. Methodology: Shengjung Ou and Haozhang Pan. Writing– original draft: Shengjung Ou.
Funding
The authors disclosed receipt of the following financial support for the research, authorship, and/or publication of this article: This research was funded by the General Project of Philosophy and Social Science Research in Jiangsu Universities, project number 2024SJYB0136.
Declaration of Conflicting Interests
The authors declared no potential conflicts of interest with respect to the research, authorship, and/or publication of this article.
Data Availability Statement
Data sharing not applicable to this article as no datasets were generated or analyzed during the current study.