
Abstract
With the re-launch of China Certified Emission Reduction (CCER), the carbon market has embraced a dual-driven approach, and the significance of FinTech in this context is growing. The discussion regarding the impact of FinTech on carbon emission reduction carries significant academic and practical importance. It not only enhances our understanding of its operational mechanisms within the carbon market, but also highlights its stimulatory role in carbon emission reduction. Using panel data from Chinese prefecture-level cities from 2011 to 2023, this study explores FinTech’s role in carbon emission reduction and its moderation effect on carbon market policies. Results indicate that FinTech promote carbon emission reduction across regions, validated by endogeneity and robustness tests. It facilitates urban carbon emission reduction through green technology innovation, industrial upgrading, and enhancing green total factor productivity. Moreover, FinTech positively moderates the carbon emission reduction effects of carbon market policies. Therefore, the study puts forward three policy recommendations for governmental consideration, to promote the development of FinTech and strengthen the construction of the carbon market to achieve the “dual carbon” goal.
Introduction
Climate warming, driven by greenhouse gas emissions, presents a global challenge (Grassl, 2011). The “World Meteorological Organization (WMO) Greenhouse Gas Bulletin (2022) No. 19”, dated November 15, 2023, reports that the global atmospheric CO2 concentration reached 417.9 ppm in 2022, which is 150% of pre-industrial levels (before 1750) and the highest in the past 2 million years. Consequently, reducing carbon dioxide emission has become a primary goal internationally.
The International Energy Agency (IEA) in its “CO2 Emission in 2022” report noted that China’s emission were approximately 10.2 billion tons, representing 27.72% of global carbon emission. At the 75th session of the United Nations General Assembly, China committed to a “dual carbon” target: peaking carbon emission by 2030 and achieving carbon neutrality by 2060 (Liang et al., 2022). To fulfill these commitments, China reinitiated its National Greenhouse Gas Voluntary Emission Reduction Trading Market on January 22, 2024, using China Certified Emission Reduction (CCER) as the trading product. Thus, enhancing carbon market policies to stimulate market development and meet carbon emission reduction targets is imperative.
Recent advances in artificial intelligence, blockchain, and big data have positioned FinTech as a pivotal promoter of sustainable economic development (Rizvi et al., 2024). As the nexus of finance and technology, FinTech enhances the efficiency and reach of financial services through digitalization and intelligence (Kimani et al., 2020), supporting the innovation of green financial products. Additionally, FinTech increases the transparency and efficiency of carbon market, facilitating the transition to a low-carbon economy (Tao et al., 2022). Effective carbon market policies can promote carbon emission reduction by optimizing energy structures, reducing fossil fuel use (Zhao et al., 2020), and fostering the development and application of green technologies (S. Chen et al., 2020).
A systematic literature review reveals a strong logical connection between FinTech, carbon market policies, and carbon emission reduction. Firstly, the advancement of FinTech provides essential technical support and innovative tools for carbon market policies, facilitating the effective functioning of carbon market and achieving carbon emission reduction targets. Secondly, the development of carbon market policies creates new application opportunities for FinTech, fostering further innovation. Finally, the integration of FinTech and carbon market policies aid in promoting carbon emission reduction, advancing low-carbon economic development through optimized resource allocation, improved market efficiency, and enhanced innovation.
Existing studies have separately confirmed the direct impact of FinTech on carbon emissions (Rizvi et al., 2024; Tao et al., 2022), the emission reduction effect of carbon market policies (Gao et al., 2025b, 2025c, 2025d; Qi et al., 2021; Zhao et al., 2020), and the technical adaptability between FinTech and carbon markets (Tiwari et al., 2023). However, the systematic interaction mechanism among the three remains insufficiently deconstructed. Specifically, previous literatures have mostly focused on the binary relationships of “FinTech – carbon emissions” or “carbon market policies – carbon emissions” (S. Chen et al., 2020; H. Zhang et al., 2019), ignoring the transmission logic that FinTech, as a technology-enabled tool, may amplify the policy’s emission reduction effect by optimizing carbon market operational efficiency and reducing policy implementation costs. Meanwhile, the theoretical framework explaining how FinTech affects carbon emissions through the chain reaction of technology empowerment, policy efficiency enhancement and emission reduction implementation has not been established, leading to a lack of in-depth interpretation of the intrinsic mechanism of their interaction, which constitutes the core gap in current research.
The theoretical contributions of this study are mainly reflected in three aspects: First, it classifies carbon emission sources into three types of direct and indirect emissions, accurately identifies the heterogeneous impacts of FinTech on different emission types, and makes up for the deficiency of existing studies in paying insufficient attention to differences in emission sources. Second, from the dual perspectives of micro (corporate green innovation, resource allocation) and macro (industrial structure upgrading, green total factor productivity improvement), it systematically reveals the multiple transmission paths through which FinTech affects carbon emission intensity, improving the theoretical mechanism system of FinTech’s environmental effects. Third, it constructs an integrated analytical framework of FinTech, carbon market policies and carbon emissions, and for the first time clarifies the positive moderating role of FinTech in the emission reduction effect of carbon market policies, filling the gap in existing literature on the interaction mechanism among the three, and providing a new theoretical perspective for understanding the synergistic emission reduction logic between digital technology and environmental policies.
The remaining structure of this study is as follows: The second section discusses the theoretical framework and posits hypotheses. The third section describes the empirical model and data used. The fourth section presents the empirical findings, and the fifth section offers conclusions and policy implications.
Theoretical Mechanism Analysis and Hypotheses
Analysis of the Impact Mechanism of FinTech on Carbon Emission Reduction
Based on the theory of information asymmetry (Clarkson et al., 2007), the integration of traditional finance with novel Internet technologies, often referred to as FinTech (M. Zhang & Liu, 2022), offers a promising avenue for controlling environmental pollution and promoting carbon emission reduction (Rizvi et al., 2024). It is also demonstrated in our previous work (Y. Xu et al., 2021) that FinTech, as a disruptive innovation, has revolutionized the logic, operation, and business scope of traditional financial models. Real-world applications of FinTech demonstrate that the adoption of advanced technologies such as big data and blockchain minimizes the informational divide between financial institutions and economic agents (Wu & Yu, 2023). This, in turn, enhances the efficiency of capital and resource management (L. Zhang et al., 2021), optimizes resource allocation, and diminishes unnecessary resource loss, ultimately reducing carbon emission intensity (Y. Wang et al., 2023). Meanwhile, according to the transaction cost theory, the enhancement of the convenience of financial services can reduce the friction costs and resource wastage in market transactions (Gao et al., 2025a; Geyskens et al., 2006). Cheng et al. (2023) confirmed that the application of FinTech in daily consumption scenarios not only enhances convenience through digital payments but also significantly reduces resource consumption and carbon emissions during the transaction process by simplifying transaction procedures and reducing the use of paper vouchers.
Therefore, the following hypothesis is proposed:
Analysis of the Transmission Mechanism of FinTech on Carbon Emission Reduction
FinTech not only directly influences carbon emission intensity but also indirectly impacts it through intermediate variables such as green technology innovation, industrial structure, and green total factor productivity. The pathways of this influence can be examined at both micro and macro levels.
From the micro perspective, based on the theories of information asymmetry and financing constraints, green technological innovation has the characteristics of high risk and high uncertainty. Traditional financial intermediaries are reluctant to provide large-scale financing support because they find it difficult to accurately assess project risks and there are severe information barriers (M. Zhang & Liu, 2022). This phenomenon is a typical manifestation of the “financial exclusion faced by high-risk innovative activities” as revealed by the financing constraints theory. However, the core advantages of FinTech, such as wide coverage (Cao et al., 2021), high efficiency (Kong et al., 2022), and low cost (H. Wang & Guo, 2022), can solve the problem of information asymmetry through technological means such as big data risk control and blockchain information traceability, effectively alleviating the financing constraints of green technological innovation and providing sustainable financial support (Li et al., 2021). For example, the green financial service platform established in Huzhou City, Zhejiang Province, precisely connected the environmental information of enterprises with the credit decision-making of financial institutions by leveraging FinTech technology, prompting financial institutions to allocate more credit resources to the environmental protection industry (Liu et al., 2023).
Furthermore, in light of the resource-based theory, the current situation where most Chinese industrial enterprises rely on fossil energy and have high pollution emissions determines that their green transformation must focus on optimizing resource allocation (Song et al., 2011). The financing support provided by FinTech for green technological innovation can encourage enterprises to adopt clean production methods, accelerate the green transformation process, and ultimately achieve sustainable development and carbon reduction goals (Luo et al., 2022). Meanwhile, the empirical research by Y. Chen et al. (2022) also verified the core logic of the resource-based theory: Fintech can significantly enhance the efficiency of internal resource allocation within enterprises, optimize the allocation of production factors, and thereby increase production efficiency. This mechanism not only indirectly boosts total factor productivity and reduces unit production costs but also minimizes resource waste and carbon emissions during the production process. From a macro perspective, based on the theories of industrial structure upgrading and supply-demand equilibrium, the development of FinTech can promote the optimization and rationalization of the industrial structure through the Engel effect on the demand side (the upgrading of residents’ consumption structure leads to the growth of demand for low-carbon services) and the Baumol effect on the supply side (technological progress drives the transformation of high-carbon industries to low-carbon industries). (Cheng et al., 2023) This mechanism precisely aligns with the core viewpoint of the industrial structure upgrading theory that “technological innovation is the core driving force for industrial transformation.”Dong et al. (2020) further verified the theoretical connection between industrial structure and carbon emission reduction: there is a long-term equilibrium relationship between industrial structure upgrading, economic growth, and carbon emission intensity, and the carbon emission reduction target will be forced the industrial structure to upgrade through policy guidance, while industrial upgrading can have a significant positive impact on economic growth by optimizing the energy consumption structure and improving production efficiency. (Zhou & Li, 2020). It is worth noting that the impact of industrial structure upgrading on economic growth has a time lag effect, and this time lag provides a buffer space for the smooth transition from high-carbon industries to low-carbon industries, thereby gradually reducing regional carbon emissions levels (Dong et al., 2020).Therefore, the hypotheses concerning the mechanisms of transmission are as follows:
Analysis of the Moderating Effect of FinTech on Carbon Market Policies
There exist mainly two methods that are employed to analyze the impact of carbon market policies on carbon emission reduction. The first method is the Difference-in-Differences (DID) approach (Nawaz et al., 2021), and the second method is the matching and multiplication approach (H. Zhang et al., 2019). These methods explore various ways carbon market policies influence carbon emission reduction.
Using the DID method, Qi et al. (2021) found that low-carbon pilot policies enhance urban green total factor productivity and indirectly reduce carbon emission intensity in pilot areas. Zhao et al. (2020) adopted the DID model and found that the carbon emission trading system, established under carbon market policies, optimizes energy structure, decreases fossil energy consumption, and thus reduces greenhouse gas emissions.
H. Zhang et al. (2019) employed the matching and multiplication method to analyze the carbon emission reduction effect of the pilot carbon market in China. It was found that the moderating effect of carbon market policy on carbon emission reduction was primarily realized through the output decline of industrial sub-sectors, with the policy effect increasing over time. Similarly, S. Chen et al. (2020) applied the matching and multiplication method and confirmed that pilot policies on carbon emission trading promote the study and development, foster the creation of new products, and encourage the application of green technologies, thus advancing China’s low-carbon economic transition (H. Wang et al., 2019).
The quota allocation methods in each pilot region of China’s carbon market share common features. The core approach is mainly free allocation, supplemented by paid allocation. Moreover, they generally adopt mainstream allocation logic such as the historical method and the baseline method. Although the specific operations may vary slightly, the underlying framework is highly similar. The carbon market conveys enterprises’ sustainable development signals to the market through the establishment of a cap-and-trade mechanism, thereby providing an institutional incentive framework for FinTech to facilitate carbon emission reduction. As a policy-driven market-based instrument, the carbon trading system creates economic incentives via quota allocation and price discovery functions. Its core value lies in internalizing environmental costs and encouraging enterprises to proactively disclose carbon emission information. This design incentivizes financial institutions to leverage IoT sensors for real-time collection of enterprise energy consumption data, employ big data algorithms to construct emission monitoring models, and accurately calculate actual carbon emission levels. Blockchain-based smart contract technology ensures the traceability of carbon quota confirmation and transaction records, forming a dynamically updated database of corporate environmental information. Consequently, fluctuations in carbon market prices have become a critical parameter for financial institutions to evaluate environmental risks, with the impact of carbon prices on asset valuation quantified through machine learning models to guide credit resources toward low-carbon technology research and development. It is evident that by establishing a standardized environmental information production and transmission mechanism, the carbon market has significantly enhanced the technical efficiency of FinTech in carbon accounting, risk pricing, and other areas, thereby improving the efficiency of green financial resource allocation.
Therefore, the following hypothesis is proposed:
Data and Methodology
Variable Selection and Indicator Setting
Dependent Variable: Urban Carbon Emission Intensity
In this study, urban carbon emission intensity (ci) is regarded as the dependent variable to represent the carbon emission level of the city, which is derived from both direct and indirect emission. Direct emission include those from fossil fuel consumption, industrial processes, and indoor solid waste disposal, while indirect emission originate from electricity and energy production facilities not located within the city. Following the classification by Cong et al. (2014), urban carbon emission are categorized into three distinct types. Type 1 (ci1) includes all direct emission generated within the city. Type 2 (ci2) includes indirect emission associated with energy produced outside the city boundaries. Type 3 (ci3) covers other indirect emission that are produced within the city but fall outside the city’s jurisdiction and are not included in Type 2. This framework allows for a comparative analysis of carbon emission relative to the GDP of each city, using the city’s carbon emission intensity as the dependent variable.
Core Independent Variable: FinTech
The FinTech index (FinTech) is regarded as the core independent variable in this study. To comprehensively measure the development level of FinTech, previous works within two main categories have been developed. The first approach is based on a frequency index derived from Internet word searches, for example, by employing web crawler technology to analyze keyword frequencies from internet searches to construct the FinTech index (Yao et al., 2021). The second approach is based on the use of structured data, which relies on the structured transaction from FinTech companies (e.g., China Ant Financial Group leading in the FinTech industry through Alipay service) to evaluate the development level of FinTech across various dimensions, including service coverage and digital support (Bian et al., 2023).
Upon comparing the structured data-based FinTech index with the word frequency-based FinTech index, this study posits that FinTech service like Alipay, through their expansive structured data resources, provides a more accurate and comprehensive portrayal of the deep-seated trends in China’s FinTech sector. Based on the research of Guo et al. (2020), this indicator consists of 26 sub-indicators covering three aspects: coverage breadth, usage depth and digitalization degree. After being dimensionlessized using the logarithmic efficiency function, the weights are determined through a combination of subjective weighting and objective weighting methods. Specifically, the coefficient of variation method is used to calculate the weights of each specific indicator for the upper-level criterion layer, then the analytic hierarchy process is used to calculate the weights of each criterion layer indicators for the upper-level goal, and finally the total index is obtained. Consequently, this study selects the China Digital Inclusive Financial Index (CDIFI) at the municipal level, co-compiled by Peking University’s Digital Finance Research Center and Ant Financial Group, and take ln (CDIFI) as the proxy of core independent variable to gauge the development level of FinTech, thereby ensuring the study’s accuracy and comprehensiveness.
Control Variables
To accurately assess the causal relationships between FinTech, carbon market, and carbon emission reduction, it is essential to incorporate a variety of control variables into a robust econometric model (J. Xu et al., 2023). The selection of control variables in this study is based on the theoretical framework of “FinTech-carbon emission reduction” and relevant existing literature, focusing on variables that may affect the core relationship by influencing regional economic operation, social development, government regulation, and energy utilization. This study includes traditional financial development (tfd) and urbanization rate (ur) as indicators of regional economic development (N. Zhang et al., 2017). Concerning international trade, the degree of openness (open) is considered. Population density (pd) and education level (edu) are chosen to reflect demographic and educational factors. Additionally, technology expenditure (te) and regional government behavior (rgb) are included to represent governmental actions (Y. J. Zhang et al., 2017). Finally, energy intensity (ei) is used to measure energy consumption.
Mediating Variables
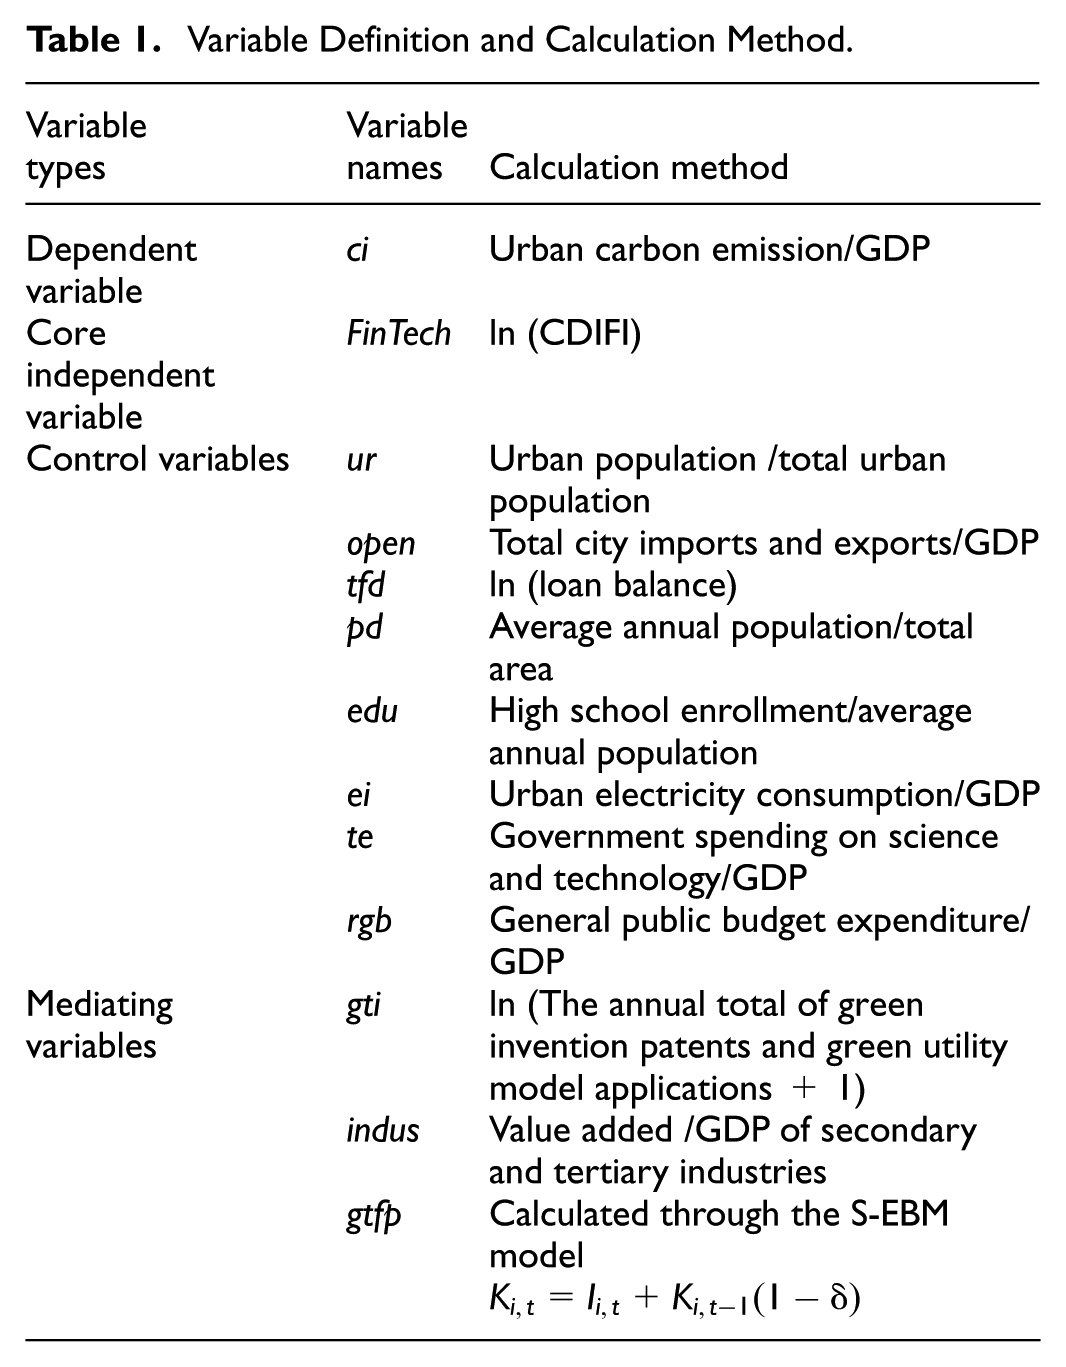
This study also examines the indirect mechanisms through which FinTech influences carbon emission reduction, by selecting green technology innovation, industrial structure, and green total factor productivity as mediating variables (Table 1). The descriptions of these variables are as follows:
(1) Green technology innovation (gti): This variable is quantified by the annual total of green invention patents and green utility model applications (N. Wang et al., 2022). To normalize data across different scales, years, and regions, logarithmic transformation of the green technology innovation indicators is employed.
(2) Industrial structure (indus): The study uses the ratio of the value added by the secondary and tertiary industries to GDP as the proxy of industrial structure (Cheng et al., 2023). These sectors, particularly the tertiary industry, are typically linked with higher technological levels and lower environmental impact.
(3) Green total factor productivity (gtfp): Following Ren et al. (2020) and Gao et al. (2022), the Super Epsilon-Based Measure (S-EBM) model is utilized to measure green total factor productivity across 283 prefecture-level cities in China from 2011 to 2021. The S-EBM model enhances the accuracy of production efficiency assessments by accounting for resource consumption and environmental pollution.
The input and output variables for the measurement of green total factor productivity are as follows:
(1) Input variable indicators. First, physical capital stock. It is measured by the perpetual inventory method. The formula is as follows:

In this formula K refers to physical capital stock, I refers to current total capital formation, and δ refers to the depreciation rate. We convert the value to the constant price of 2004 by applying the annual fixed asset investment price index; the depreciation rate is set at 9.6% following the specification by J. Zhang and Zhang (2003), while the base-period capital stock is computed based on the total fixed asset investment. The second input indicator is labor input, which is measured by the year-end employment figure of the city.
(2) Output variable indicators. Output variables are divided into two categories: desired output and undesired output. First, desired output is defined as the Gross Domestic Product (GDP) converted to the constant price of 2004. Second, undesired output encompasses wastewater discharge, sulfur dioxide emissions, and dust and fume emissions. The specifics of variables and calculation methods are detailed in Table 1, while the selection and descriptive statistics of the variables are shown in Table 2.
Variable Definition and Calculation Method.
Basic Statistical Characteristics of Main Variables.

Data and Sample
The carbon emission intensity data for this study are sourced from the Carbon Accounting Database and the China Energy Statistical Yearbook, with gaps filled using the Intergovernmental Panel on Climate Change (IPCC) emission factor database. The green innovation data is sourced from the China Research Data Service Platform (CNRDS). The data related to green total factor productivity comes from the National Bureau of Statistics of China. Additional data were obtained from the China City Statistical Yearbook, the China Study Data Service Platform, and the China Stock Market and Accounting Research Database (CSMAR) database. To ensure the representativeness and reliability of the study, samples with missing values of key variables were excluded to maintain data integrity and authenticity. Meanwhile, this paper selected data from 283 prefecture-level cities in China as the research sample. These data cover the period from 2011 to 2023, ensuring the accuracy and reliability of the analysis.
Model Design and Estimation Method
Two-Way Fixed Effects Model
This section clarifies the nature of the methodological framework and specifies the empirical approach adopted to examine the relationship between financial technology (FinTech) development and carbon emission reduction, with rigorous control for other confounding economic and social factors. To accurately identify the causal effect of FinTech on carbon emission reduction while mitigating biases from unobserved individual and time-specific heterogeneity, this study employs a two-way fixed effects model (J. Xu et al., 2023), which is widely recognized for its suitability in panel data analysis involving cross-sectional and temporal variations. The two-way fixed effects model is specified in Equation 1:
where, i and t respectively refer to different cities and years (2011–2021), dependent variable ci represents carbon emission intensity,
Mediating Effect Model
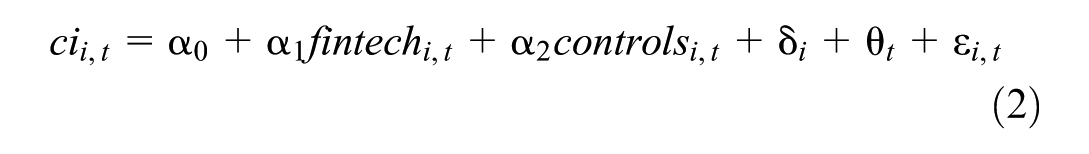
Building on the baseline regression, this study further investigates and constructs a mediating effect model, which is designed to empirically test the transmission mechanisms through which FinTech influences carbon reduction. The mediating effect model is constructed in Equations 2 to 7:

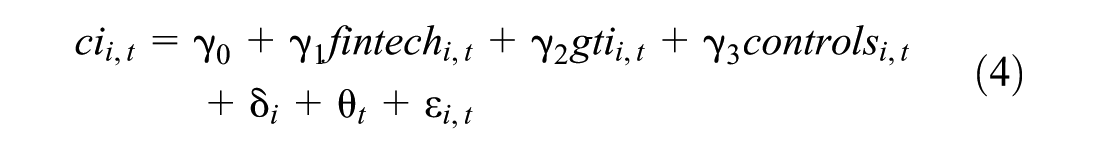


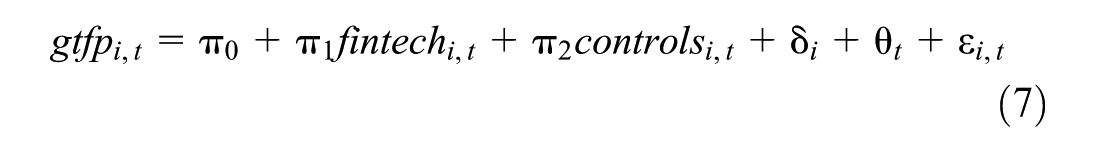

The above equations test the mediating utility of urban green technology innovation, industrial structure and green total factor productivity respectively, where
Difference-in-Differences Model
Since 2013, China has launched carbon market trading pilot projects in several regions, including Shanghai and Guangdong in June 2013, Beijing in November 2013, Tianjin in December 2013, Hubei in April 2014, Chongqing in June 2014, and Fujian in December 2016. These pilots aim to observe carbon market operations on a small scale, collect vital data on carbon emission and trading, and assess the effectiveness of carbon market. This information will guide the establishment of a national carbon market and promote policy adjustments. The DID method is employed to control for pre-existing differences between the subjects of the study, enhancing the accuracy and reliability of the results. This study uses the DID model to evaluate the impact of carbon market policies on reducing carbon emission and to explore how FinTech contributes to these efforts. The DID model and the moderating effect model are structured in Equations 8 and 9:

where
In this study, the implementation of carbon market policy is regarded as a representative quasi-natural experiment, in which regions of Shanghai, Guangdong, Beijing, Tianjin, Hubei, Chongqing, and Fujian that lead in launching carbon emission trading pilot are set as the experimental group, while the regions that have not carried out such pilot are set as the control group. After adding both
Empirical Results and Analysis
Basic Model
Table 3 presents the baseline regression results for the impact of FinTech on regional carbon emission reduction. Column (1) to (4) indicate that, without controlling for fixed effects, only controlling for the fixed effect of cities, only controlling for the fixed effect of time, or both controlling for the fixed effects of cities and time, fintech significantly reduced total carbon emissions at a 1% significance level, supporting Hypothesis H1. In addition, referring to the research of Cong et al. (2014), carbon emissions are classified into three categories. 1. Scope 1 refers to all direct emissions within the urban area, mainly including those from transportation and construction, industrial production processes, agriculture and forestry, and land use changes, as well as emissions from waste treatment activities. Scope 2 refers to indirect emissions occurring outside the urban area that are related to energy, mainly including emissions from purchased electricity, heating, and/or cooling to meet urban consumption. Scope 3 refers to emissions caused by activities within the urban area but occurring outside the area, excluding other indirect emissions in Scope 2. It includes greenhouse gas emissions from the production, transportation, use, and waste disposal of all items purchased by towns from outside the area. In Columns (5) to (7), where carbon emission are segmented into three ranges, the coefficients of FinTech remains significantly negative at the 1% level. However, the coefficient for ci1 is significantly larger than those for other ranges. This suggests that FinTech primarily contributes to carbon emission reduction through the reduction of direct emission.
Baseline Regression Results of FinTech on Carbon Emission Reduction.

Note. Robust t-statistics, adjusted for heteroskedasticity, are presented in parentheses.
Significance levels are indicated as follows: *** for 1%, ** for 5%, and * for 10%.
Regarding control variables, the degree of openness, urbanization rate, education level, energy intensity, technology expenditure, and regional government behavior all impact urban carbon emission reduction. Notably, there is a negative correlation between urbanization rate and carbon emission intensity in urban areas. This may be because regions with higher levels of urbanization often have more developed economies that focus on low-carbon, high-quality development and are shifting away from traditional extensive economic modes. Conversely, less developed regions may still rely on these older economic modes. To further assess the robustness of this conclusion, the study will analyze and test data excluding samples from municipalities under direct control of central government.
Endogeneity Test
Although this study has controlled for numerous variables and utilized a two-way fixed effects model in the baseline analysis to estimate the impact of FinTech on carbon emission reduction, potential endogeneity issues may still persist. Firstly, carbon market pilot cities, which often advocate their sustainable development prospects, tend to promote the green transformation of industries that increase the local demand for green credit (Lee and Wang, 2022). This operation could create a reverse causality between FinTech development and urban characteristics, thereby affecting the accuracy of the analysis. Secondly, regional carbon emission reduction is influenced by multiple factors, making it challenging to include all relevant variables in the regression model, leading to omitted variable bias.
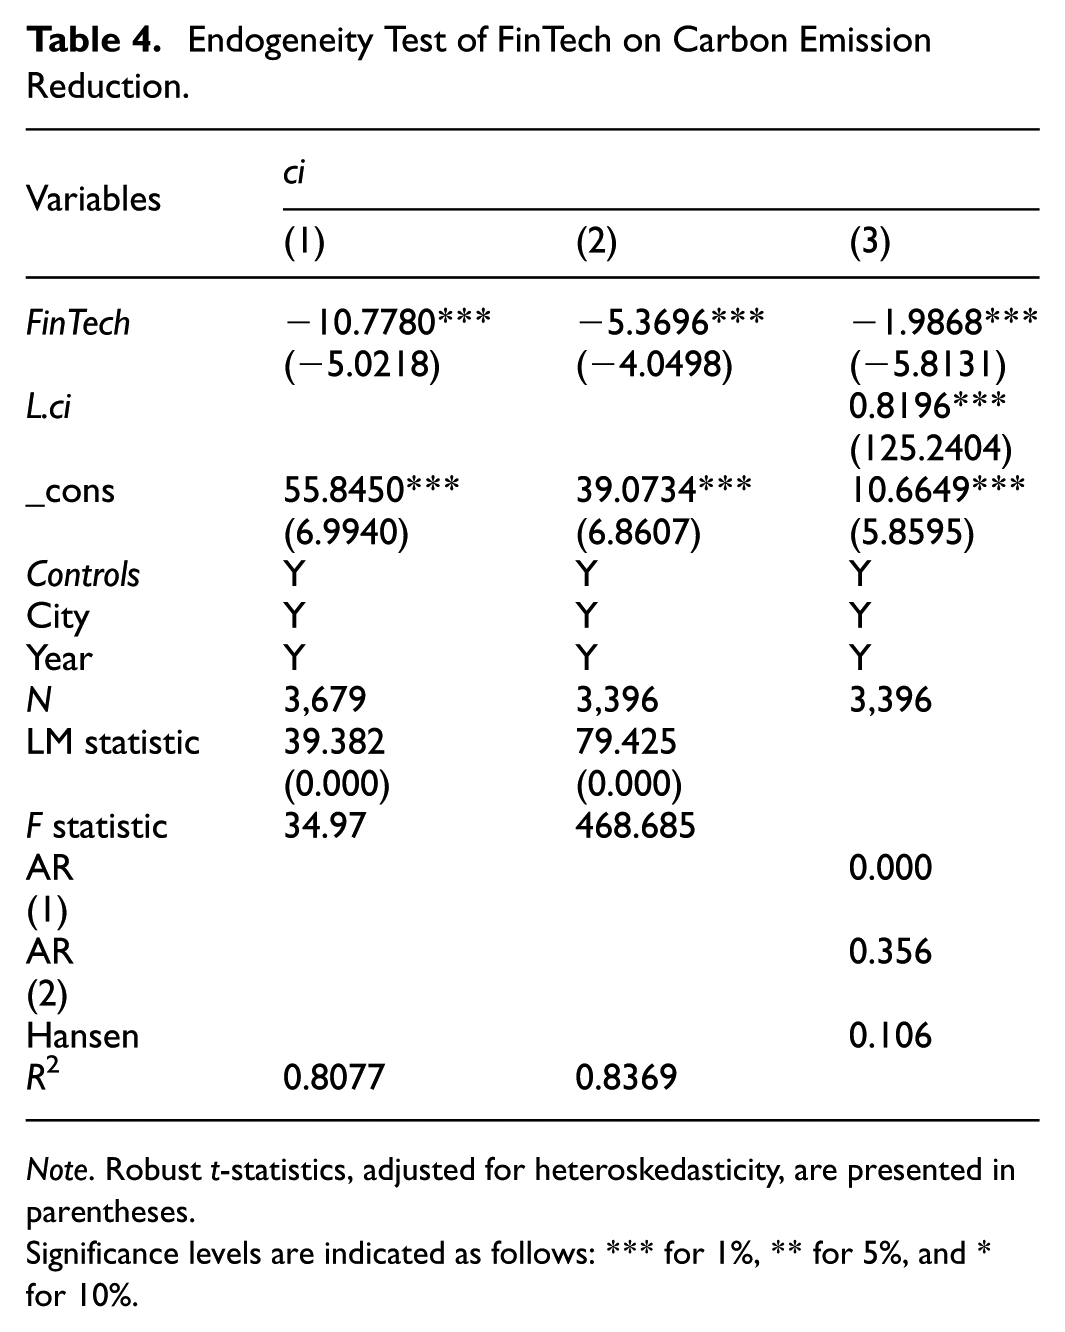
To address these endogeneity issues, the study employs instrumental variables and utilizes the Two-Stage Least Squares (2SLS) and Generalized Method of Moments (GMM) for more accurate estimations, aiming to produce more reliable and robust results. Following the approach of J. Xu et al. (2023), this study uses the Internet penetration rate (Int) and the one-period lagged FinTech index (L.FinTech) as instrumental variables. The regression results are shown in Columns (1) and (2) of Table 4. The LM statistics are 39.382 and 79.425 respectively, with p-values less than 0.05, indicating that the two selected instrumental variables are both valid instrumental variables. The F statistics are 34.97 and 468.685 respectively, both of which are greater than 10, indicating that the weak instrumental variable test has been passed. The instrumental variable analysis confirms that the core independent variable remains significantly negative at the 1% level, aligning with the baseline regression conclusions.
Endogeneity Test of FinTech on Carbon Emission Reduction.
Note. Robust t-statistics, adjusted for heteroskedasticity, are presented in parentheses.
Significance levels are indicated as follows: *** for 1%, ** for 5%, and * for 10%.
To further assess the robustness of the model, the study incorporates methodologies from Zhou et al. (2022) and Tao et al. (2022), employing the system GMM model for regression analysis on the sample data. As shown in Column (3) of Table 4, the p-value in the AR (1) test is less than .01, indicating the presence of first-order serial correlation. The p-value in the AR (2) test is greater than .1, suggesting that there is no second-order serial correlation in the residuals. And the p-value in the Hansen test is also greater than .1, indicating that the instrumental variables satisfy exogeneity. All these tests indicate that the model satisfies the system GMM assumptions. The regression results reiterate that the core independent variables are significantly negative at the 1% level, consistent with the baseline regression findings.
Robustness Test
To enhance the accuracy of the regression results, this study employs three robustness testing methods: Replace the core independent variable, select sub-samples for regressions, and winnow the samples.
Select Sub-Samples for Regression
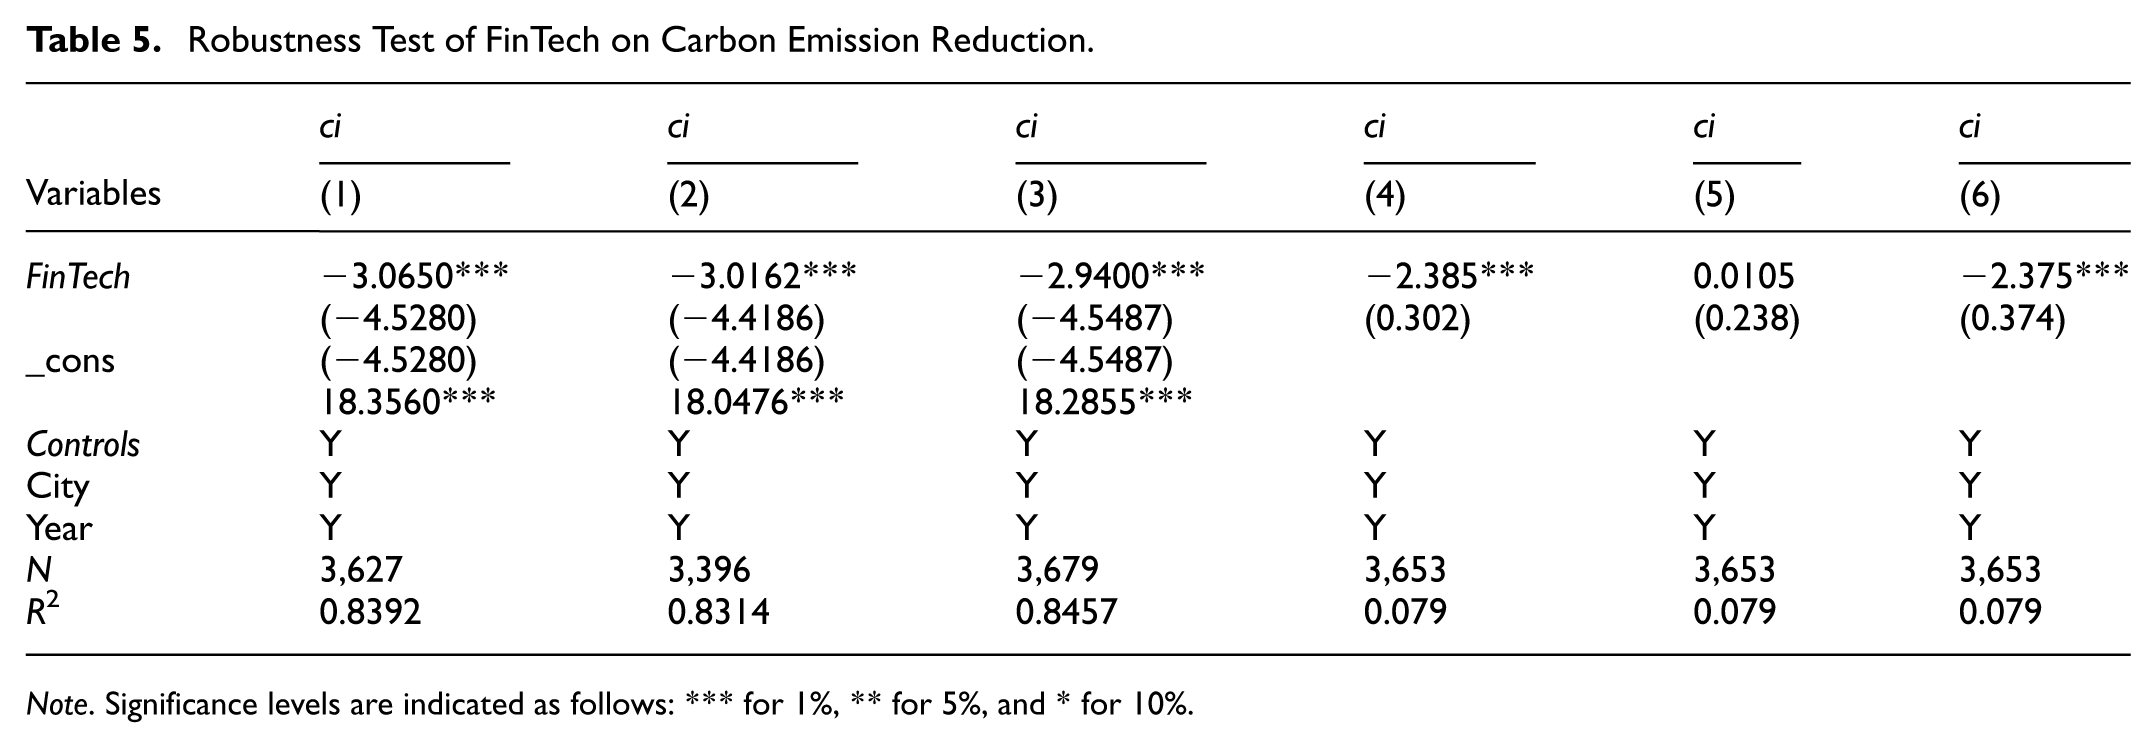
To examine the relationship between the economy and environment in Chinese cities, it is essential to select sub-samples judiciously due to the considerable variation in factors like factor endowment, industrial structure, and administrative level across cities. Municipalities, which differ significantly in urbanization levels, scientific and technological talents, and market development, and whose industrial layouts influence surrounding prefecture-level cities, were excluded from the samples to enhance the robustness of the regression results. The regression results are displayed in Column (1) of Table 5. The analysis of these sub-samples reveals that the coefficients of FinTech remain significantly negative at the 1% significance level, aligning with the baseline regression findings.
Robustness Test of FinTech on Carbon Emission Reduction.
Note. Significance levels are indicated as follows: *** for 1%, ** for 5%, and * for 10%.
Additionally, furthermore, due to the impact of the COVID-19 pandemic, many enterprises and institutions encountered difficulties in operation and liquidity issues. This recession led to distorted data in 2020. To reduce the deviations caused by the economic recession during the pandemic, the 2020 data was excluded for regression analysis. The regression results are displayed in Column (2) of Table 5. The analysis of these sub-samples reveals that the coefficients of FinTech remain significantly negative at the 1% significance level, aligning with the baseline regression findings.
Winnow the Samples
When the data distribution is irregular, extreme values and outliers can significantly distort the regression results. To enhance data reliability, the samples at the 1% level for both dependent and independent variables are winnowed. The revised regression results, presented in Column (3) of Table 5, show that the coefficients of FinTech are significantly negative at the 1% significance level, consistent with the baseline regression findings.
Spatial Overflow Effect
There may be a spatial spillover effect between urban carbon emissions and the development of fintech. To account for the biases caused by spatial correlation, this paper introduces the spatial Durbin model for robustness testing. The simple 0-1 spatial weight matrix based on distance will greatly weaken the spatial spillover effect of fintech. Therefore, a spatial geographic space matrix based on longitude and latitude is adopted to eliminate the interference of spatial dependence on the estimation results. The regression results are shown in Columns (4) and (6) of Table 5. They indicate that the coefficient of FinTech is significantly negative at the 1% significance level, which is consistent with the baseline regression results. However, as shown in column (5) of Table 5, the coefficient of FinTech is not significant. It indicates that fintech has a carbon emission reduction effect in this region, but there is no spatial spillover effect on the surrounding areas.
Heterogeneity Test
China’s vast territory encompasses diverse resources and varying economic development levels, leading to significant regional differences in energy mixes and industrial concentrations. This study examines the regional impacts of FinTech on carbon emission reduction. Following the National Bureau of Statistics’ classification standards, it categorizes the samples into three regions: eastern, central, and western. Each category is analyzed based on its respective provincial location. At the same time, based on whether the mining and processing of natural resources such as minerals and forests are the leading industries in the region, cities are classified as resource-based cities or non-resource-based cities.
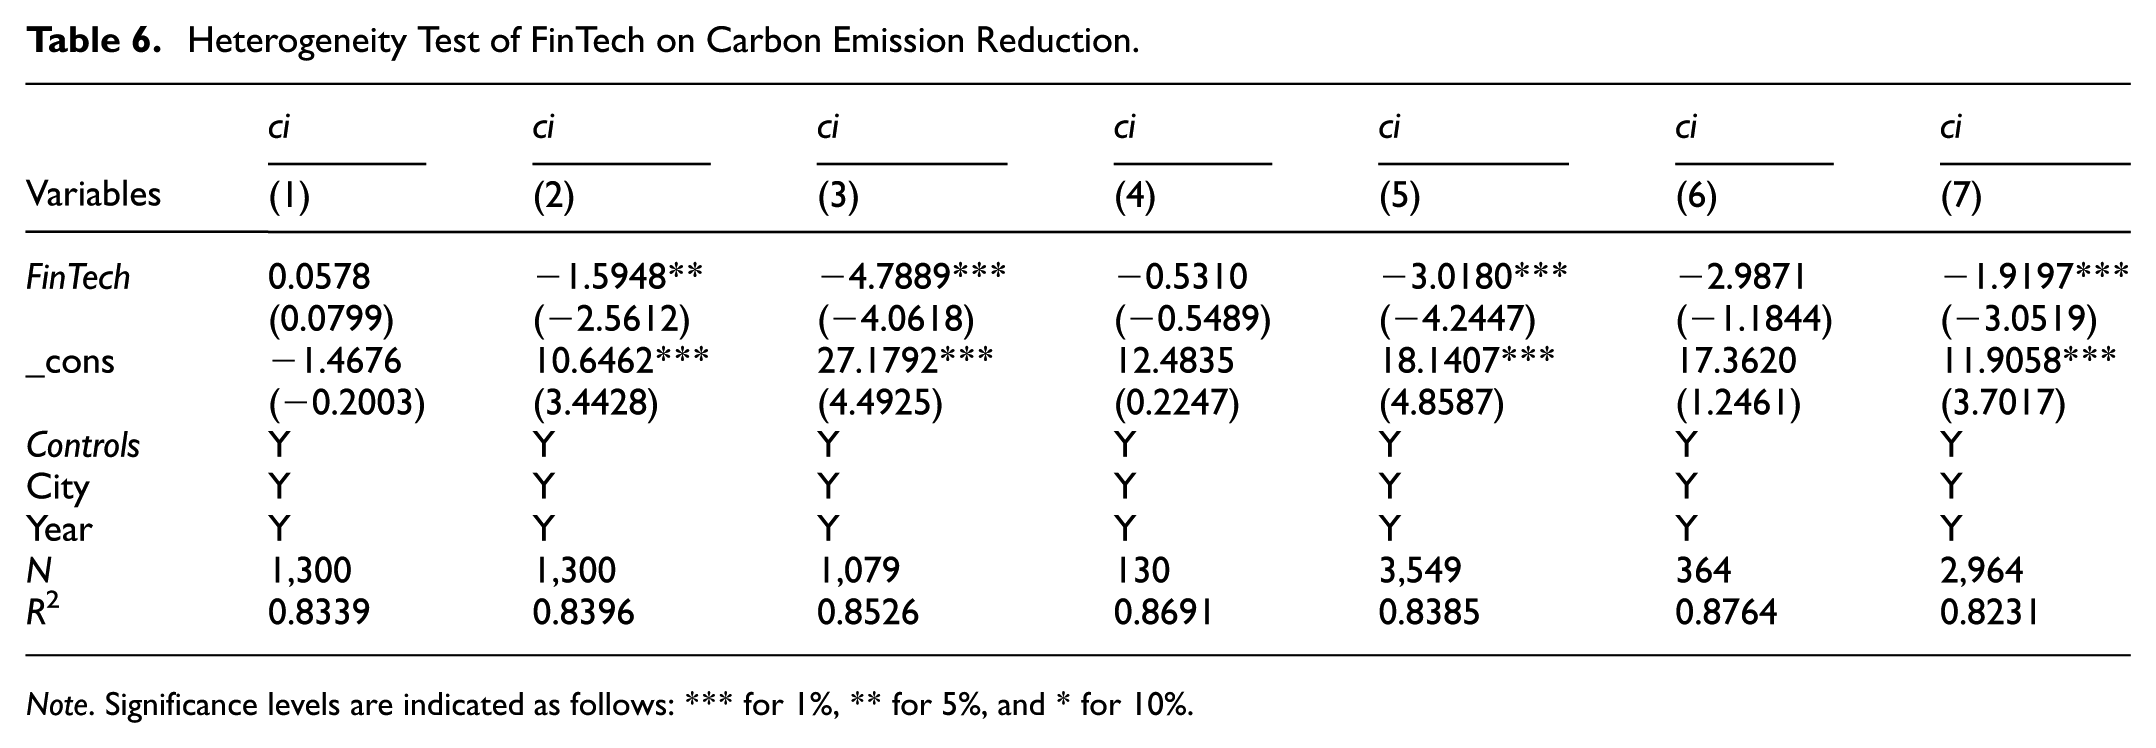
Columns (1) and (2) of Table 6 presents regression results by region, revealing that the coefficient of FinTech is significantly negative in the central and western regions but not significant in the eastern region. Columns (4) and (5) indicate that the coefficient of fintech is significantly negative in non-resource-based cities, but not significant in resource-based cities. Columns (6) and (7) show that the fintech coefficient is significantly negative in first- and second-tier cities, but not significant in third- and fourth-tier cities. This indicates a more pronounced carbon reduction effect of FinTech in the central and western regions, non-resource cities, and third- and fourth-tier cities. Possible explanations include:
(1) Energy structure differences: China’s energy supply varies geographically, with the central and western regions being rich in both traditional fossil fuels and renewable energy sources like solar and wind energy. These regions also host heavy chemical industries and other high-energy-consuming sectors. The rapid development of FinTech offers opportunities to enhance the agglomeration of energy-intensive and new energy industries, promoting the adoption of clean energy.
(2) Industrial structure differences: Resource-based cities are dominated by heavy carbon industries such as mineral extraction and resource processing. Their industrial structure is monotonous and rigid, and economic growth is highly dependent on resource consumption. Financial technology is unable to break through the resource-dependent development model and cannot fundamentally change the high-carbon emission industrial pattern. Instead, non-resource-based cities have a diversified industrial structure, with a higher proportion of low-carbon industries such as services and advanced manufacturing, and possess flexible transformation space.
Heterogeneity Test of FinTech on Carbon Emission Reduction.
Note. Significance levels are indicated as follows: *** for 1%, ** for 5%, and * for 10%.
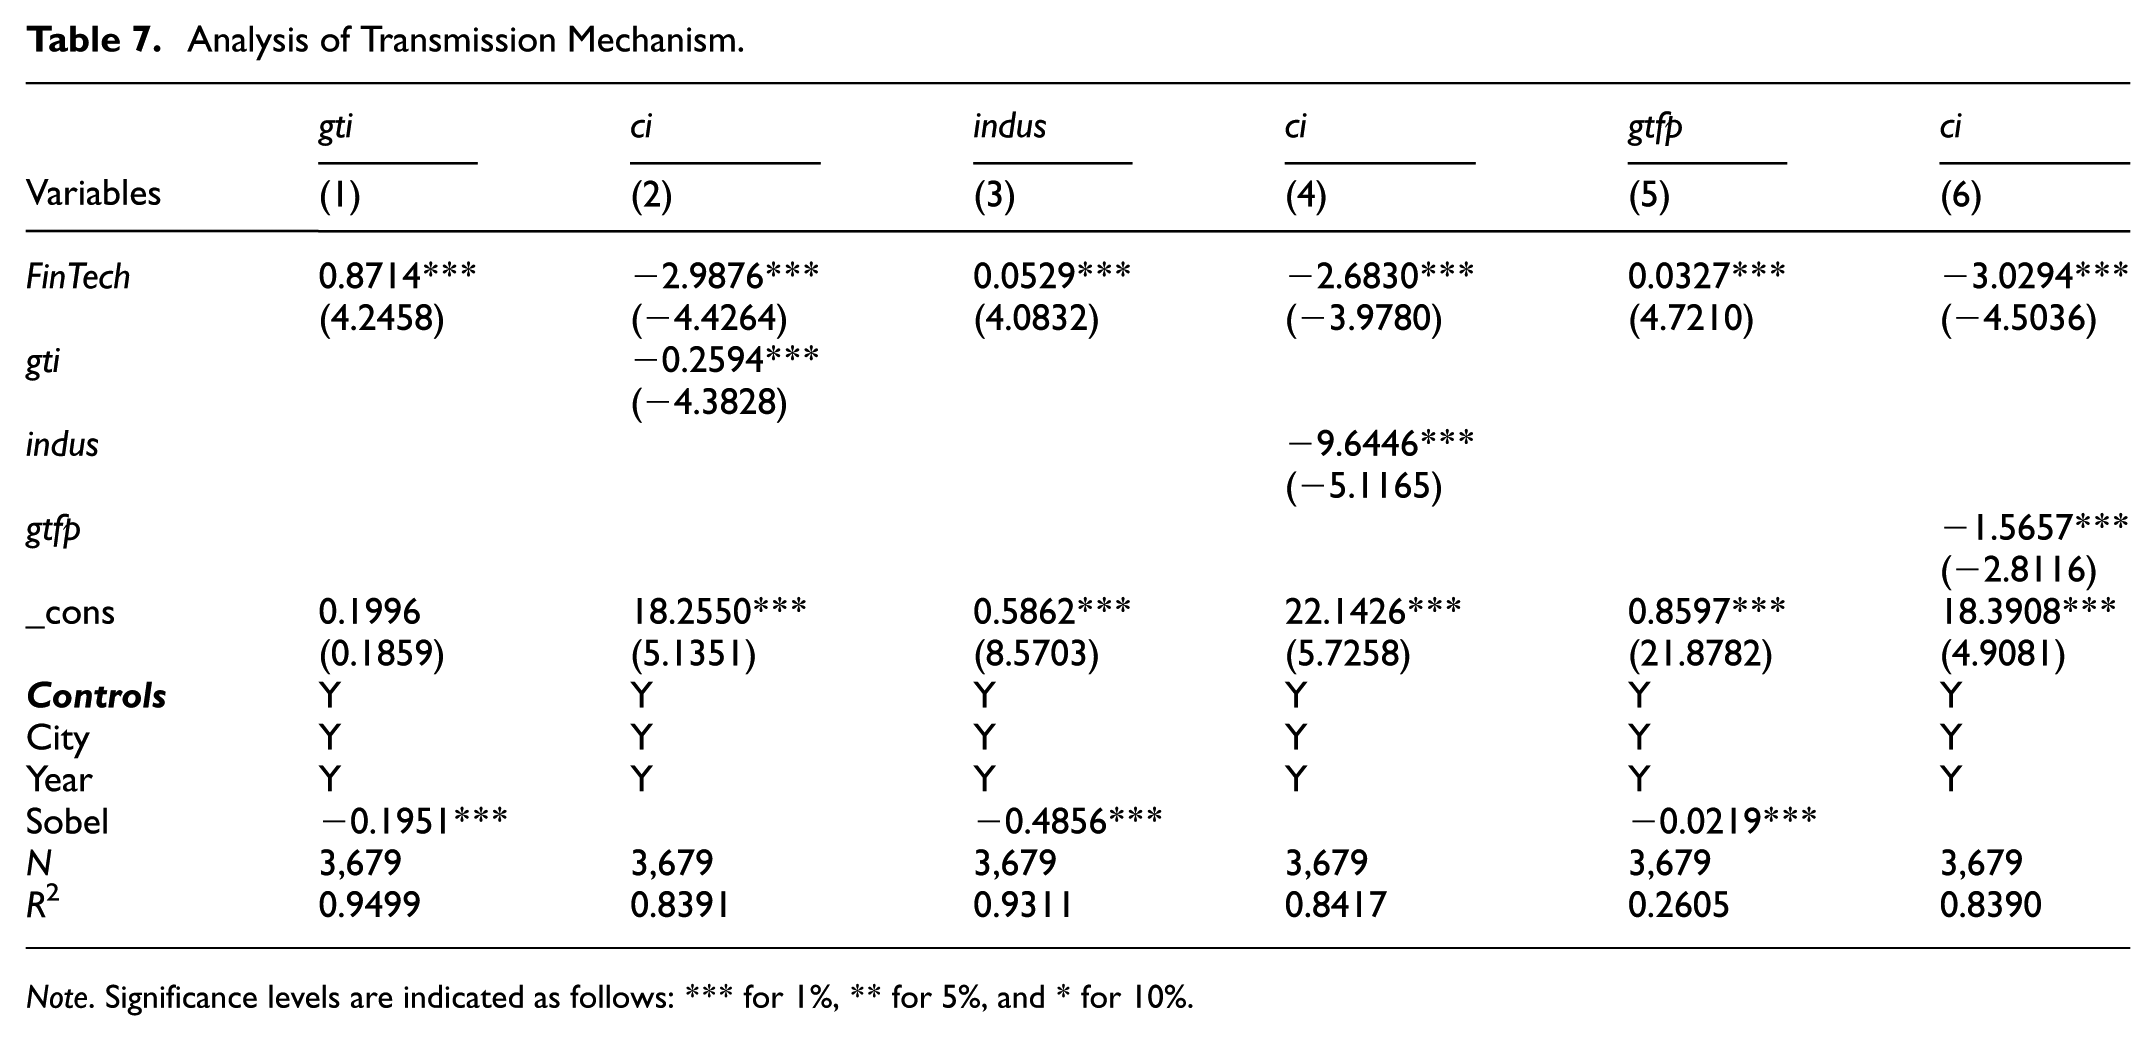
Analysis of Transmission Mechanism
Based on the mediating effect models in Equations 2 to 7, this study empirically examines the specific mechanisms through which FinTech affects carbon emission intensity. According to prior analysis, FinTech reduces the carbon emission intensity of cities through three main pathways: firstly, by promoting green technology innovation and supporting the study, development, and application of environmental protection technologies; secondly, by improving industrial structures and guiding resource allocation towards low-carbon and efficient industries; thirdly, by enhancing green total factor productivity, which contributes to low-carbon development through improved economic efficiency.
Columns (1) and (2) of Table 7 present the regression results with green technology innovation as a mediating variable in the relationship between FinTech and carbon emission intensity. The coefficient of FinTech in Column (1) is significantly positive at the 1% level, illustrating FinTech’s positive impact on green technology innovation. Column (2) shows significantly negative coefficients for both FinTech and gti at the 1% significance level, demonstrating the role of improved green technology innovation in carbon emission reduction and its mediating effect.
Analysis of Transmission Mechanism.
Note. Significance levels are indicated as follows: *** for 1%, ** for 5%, and * for 10%.
Columns (3) and (4) discuss the mediating role of industrial structure. In Column (3), the coefficient of FinTech is significantly positive at the 1% level, indicating that FinTech positively influences the industrial structure. Column (4) shows significantly negative coefficients for both FinTech and indus at the 1% significance level, demonstrating the role of improved industrial structure in carbon emission reduction and its mediating effect.
Columns (5) and (6) address the role of green total factor productivity as a mediating variable. In Column (5), the coefficient of FinTech is significantly positive at the 1% level, indicating a promotive effect on green total factor productivity. Column (6) shows significantly negative coefficients for both FinTech and gtfp at the 1% significance level, verifying the role of green total factor productivity in promoting carbon emission reduction and confirming its partial mediating effect in the relationship between FinTech and carbon emission intensity. Through optimizing resource allocation, reducing financing costs, advancing green industries, and enhancing risk management, FinTech positively influences green total factor productivity and supports sustainable economic and social development.
Klein et al. (2021) noted that the potential endogeneity might bias the regression results when the traditional causal reasoning-based three-step method (J. Xu et al., 2023) is used to verify the mediating effect. Therefore, to validate the impact of FinTech on carbon emission reduction, it suffices to demonstrate a significant impact of FinTech on mediating variables, and that these variables theoretically support an effect on carbon emission intensity, thereby inferring the existence of the transmission mechanism. This approach effectively avoids the endogeneity issues inherent in the traditional causal reasoning-based three-step method, thereby enhancing the reliability of the study’s conclusions. To ensure the robustness and accuracy of the conclusions, and inspired by Cheng et al. (2023), this study used the Sobel method to test the significance of the mediating effect. The results were significant at the 1% level, confirming the hypotheses H2a, H2b, and H2c.
Policy Effect Analysis
Regulatory Effect Analysis
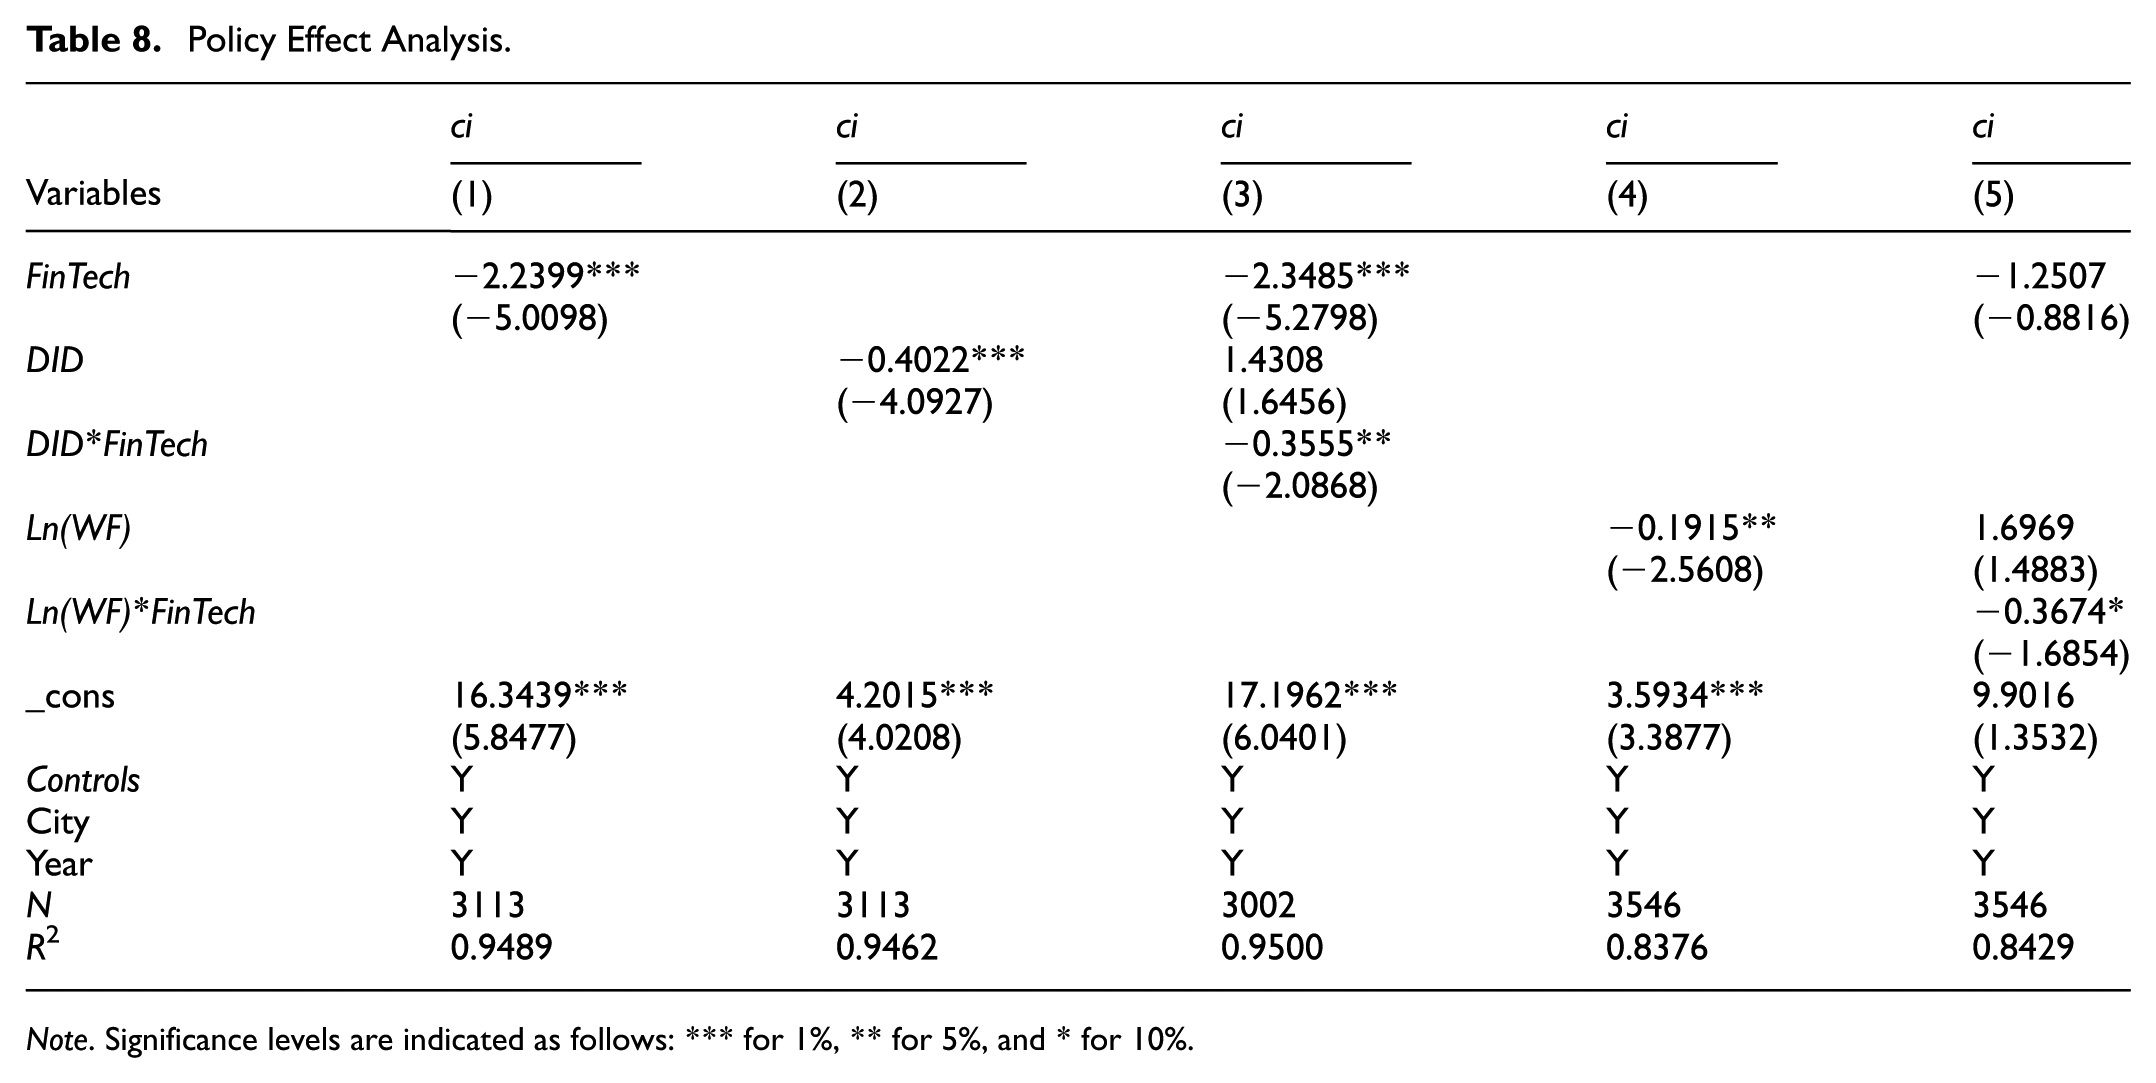
To further explore the mechanism which regulates the impact of FinTech on carbon emission reduction, the study examines the role of carbon market policy as an initial factor.
The coefficient of DID in Column (2) of Table 8 is significantly negative at the 1% level, demonstrating that carbon market policy effectively promotes carbon emission reduction. The coefficient of DID*FinTech in Column (3) is also significantly negative at the 5% level, confirming that FinTech positively moderates the carbon reduction effects of carbon market policy, thus verifying H3. This study also takes into account more detailed policy characteristics, considering the government’s support for the policies. Referencing the research of Tu et al. (2024), it measures the frequency of related words on green emission reduction in the government work report. The results are shown in Table 8 Columns (4) and (5). The coefficient of Ln(WF) is significantly negative at the 5% level, and the coefficient of Ln(WF)*FinTech is significantly negative at the 10% level. This indicates that the government’s attention to green and environmental protection development can significantly reduce carbon emissions, and at the same time, the government’s attention to green and environmental protection development can positively regulate the impact of FinTech on carbon emission reduction.
Policy Effect Analysis.
Note. Significance levels are indicated as follows: *** for 1%, ** for 5%, and * for 10%.
The likely reason is that FinTech enhances the transparency and efficiency of the carbon market through advanced technologies, providing a more effective carbon pricing mechanism. This encourages enterprise participation in carbon market trading, fostering the sustainable development of the carbon market and further promoting carbon emission reduction.
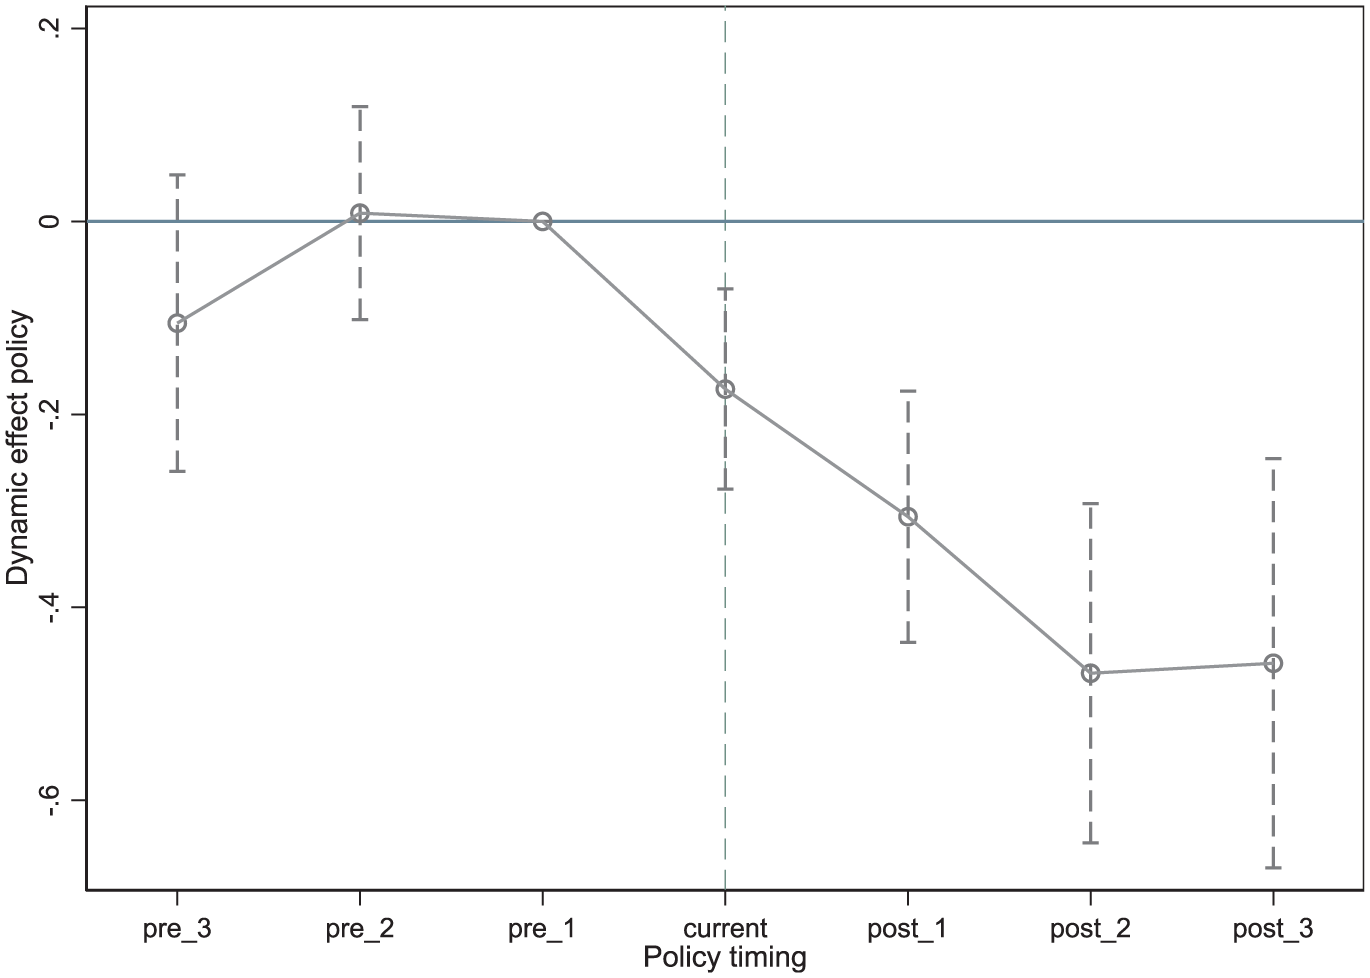
Parallel Trend Test
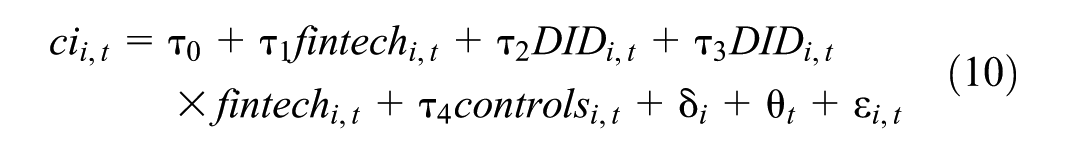
When employing the DID model, it is crucial that certain preconditions are met, namely, the absence of significant differences in the development trends of the dependent variable between the experimental group and control group prior to the policy implementation. Drawing on the methodologies of Jacobson et al. (1993), this study employs the event analysis method to perform a parallel trend test. The year before the implementation of the carbon market policy serves as the base period, while the 3 years prior to policy implementation are designated as the experimental group, and the 7 years following the policy implementation are used as the control group. To increase comparability, all years beyond 3 years for post-implementation are consolidated into the third year. This arrangement facilitates a parallel trend test on the effect of carbon market policy on carbon emission reduction. The model of parallel trend test is detailed in Equation 10:
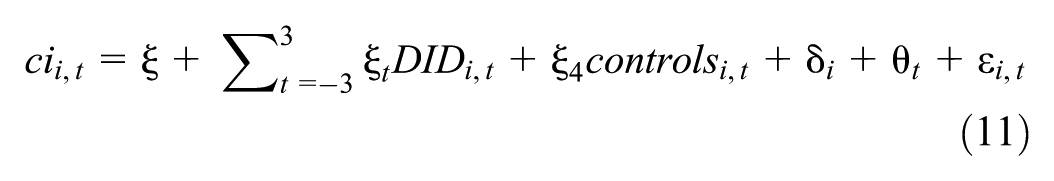
Figure 1 illustrates that there were no significant differences between the experimental group and the control group before the implementation of the carbon market policy. However, significant differences emerged between these groups following the policy’s implementation. This finding, derived from the parallel trend test, demonstrates the significant impact of the carbon market policy on carbon emission reduction.
Parallel trend test.
Placebo Test
To mitigate the impact of random factors and omitted variables in the DID model, this study conducted a placebo test, drawing on methodologies from Chetty et al. (2009) and Ferrara et al. (2012). The procedure is as follows: seven regions are randomly selected, and a new virtual interaction term is created using a randomly generated policy timeline. In Equation 8, the DID term is replaced with this virtual interaction term for regression analysis. This process is repeated 1,000 times. As shown in Figure 2, the estimated coefficients from these regressions generally cluster around 0 and exhibit a positively skewed distribution, significantly differing from the actual regression coefficient of −0.4022. Moreover, most p-values are not significant, indicating that the baseline regression results are robust and not influenced by external factors.

Placebo test.
Conclusion and Policy Implications
Achieving the “dual carbon” goal is a critical strategic task in building a modern economy. This study utilizes data from 283 prefecture-level cities in China from 2011 to 2023 to examine the impact of regional FinTech development on carbon emission reduction and its underlying mechanisms. Firstly, the study finds that regional FinTech development significantly contributes to carbon emission reduction. The validity of this conclusion is reinforced by addressing endogeneity concerns and conducting robustness tests. Secondly, the study identifies the underlying mechanisms, through which FinTech drives green technology innovation and industrial upgrading, and enhances green total factor productivity, thus providing a strong driving force for urban carbon emission reduction. Lastly, FinTech is found to positively moderate the carbon emission reduction effects of carbon market policies. In summary, the findings of this study offer policy implications for promoting FinTech development and realizing the “dual carbon” objective. The following are three policy recommendations from this study for government consideration:
Firstly, to enhance the resource allocation efficiency, local governments should implement differentiated policies. For the central and western regions, they should strengthen the construction of digital infrastructure such as big data centers and blockchain platforms, and reduce the cost of FinTech application in traditional industries; for the green FinTech projects in this region, implement targeted tax exemptions and subsidies to guide financial institutions to allocate more funds to the low-carbon sector. For the eastern region, leveraging its FinTech leading position, establish a national green financial innovation demonstration zone, focus on developing high-end services such as carbon financial derivatives and green technology equity financing, and promote the dissemination of FinTech achievements to the central and western regions through cross-regional cooperation mechanisms.
Secondly, for resource-based regions dominated by traditional manufacturing industries, guide FinTech enterprises to develop customized financial services—such as low-cost long-term green credit based on industrial internet data and intellectual property pledge financing for green technology transformation—to support manufacturing enterprises in low-carbon upgrading. Meanwhile, proactively cooperate with scientific research institutes to establish green technology innovation funds, accelerate the transformation of green technological achievements, and strengthen the mechanism through which FinTech enhances green total factor productivity. Thirdly, establish a unified national digital assessment system for enterprise carbon emissions, achieving precise and differentiated allocation of initial carbon quotas. Relying on financial big data and IoT monitoring technology, integrate multi-dimensional information such as enterprise energy consumption data, production and operation scale, and industry emission reduction benchmarks, and establish a dynamic assessment model covering large, medium, small and micro enterprises. For enterprises in high-energy-consuming industries, key core indicators such as carbon emission intensity and energy-saving renovation progress should be included; for enterprises with light assets and low-carbon potential, auxiliary indicators such as green technology application and carbon emission reduction commitment should be strengthened to ensure that the quota allocation not only conforms to the overall national carbon emission reduction goals but also meets the actual operating conditions of different regions and types of enterprises.
Limitation and Future Research
The limitations of this study mainly stem from the inherent constraints of data availability and the theoretical framework. Firstly, due to the convergence of the core logic of quota allocation in each carbon market pilot, the lack of quantifiable differentiated indicators, and the inconsistent statistical standards and insufficient availability of some micro-data in the trading activity data, the model failed to incorporate the refined characteristics such as the details of quota allocation. This might to some extent affect the accuracy of policy evaluation.
Future research can further obtain detailed policy documents and micro transaction data from the pilot areas, attempt to construct an index for policy implementation intensity, quantify the differentiated quota allocation rules, unify the statistical standards for trading activity, and precisely identify the emission reduction effects of the core features of the carbon market policies. This will provide more targeted empirical evidence for the optimization of the carbon market mechanism.
Footnotes
Ethical Considerations
This research project does not involve the use of animals or human subjects, therefore, an ethics statement including a committee approval number is not applicable.
Author Contributions
Yueling Xu: Conceptualization, Writing-Reviewing and Editing, Visualization, Investigation; Jiafeng Chen: Conceptualization, Methodology, Software; Huijie Yao: Writing-Original draft preparation, Software, Validation; Xin Fang: Conceptualization, Writing-Reviewing and Editing, Supervision.
Funding
The authors disclosed receipt of the following financial support for the research, authorship, and/or publication of this article: This study is supported by the Hangzhou Philosophy and Social Science Planning Regular Project (no. Z24YD046) and a project supported by Scientific Research Fund of Zhejiang Provincial Education Department (no.Y202455848).
Declaration of Conflicting Interests
The authors declared no potential conflicts of interest with respect to the research, authorship, and/or publication of this article.
Data Availability Statement
Data sharing not applicable to this article as no datasets were generated or analyzed during the current study.