
Abstract
Fostering innovation has become a central national strategy aiming at accelerating the transition to a knowledge-based economy. However, sustaining innovation activities requires strategic planning and resource allocation, posing significant challenges for firms. Without structured guidance and governmental support, many firms struggle to advance their innovation initiatives effectively. This study delves into the impact of national innovation systems (NIS) on firm performance, leveraging the fixed effect estimator on a dataset consisting of 16,228 firms in 50 countries. Our findings reveal a short-term inverse effect of NIS on firm performance, persisting for approximately 3 years. This effect is primarily driven by two innovation pillars: infrastructure and creative outputs, and is more pronounced in developing markets where government support for private innovation is comparably insufficient. The association can be explained via the rising innovation intensity channel with patent applications amplifying the effect. Our findings suggest policymakers should pay close attention to key innovation pillars and prudently consider the short-term consequences of innovation-boosting programs on firm performance, ensuring that national innovation strategies are designed to foster sustainable and inclusive economic growth.
Plain Language Summary
Why was the study done? Many governments invest heavily in national innovation systems (NISs), aiming to help firms become more competitive by improving their access to knowledge and technology, thereby fostering economic growth. While prior studies agree on the beneficial long-term effect of NIS development on business development, it remains unclear about the immediate effect of NISs. That is, challenges arising from intensified innovation environments can increase firms’ operational uncertainty, making the immediate effect of national innovation policies unknown. What did the researchers do? We analyzed data from 16,228 firms across 50 countries to see how changes in NISs, measured using the Global Innovation Index, affect firm performance from both the profitability and market value viewpoints. What did the researchers find? We found that strengthened NISs reduce firm performance in the short term, and this effect can last for up to three years. The main reason is that firms increase their innovation activities, such as investing in research and applying for patents, which are costly and take time to generate returns. The negative effect is more pronounced in developing countries. What do the findings mean? These results suggest that innovation policies may create short-term pressures for firms, even though they are important for long-term growth. Policymakers should not only promote innovation but also support firms in managing their short-term costs and risks, such as through financial incentives, innovation training, better infrastructure, and stronger intellectual property protection, so that firms can pursue innovation in a more sustainable and less risky manner.
Keywords
Introduction
Innovation has become a cornerstone of economic growth and competitiveness in the global economy. According to the Global Innovation Index 2024, despite economic uncertainties, innovation expenditures have continued to rise globally at the rate of 5% in 2022, and noticeable growth in technology adoption has been witnessed, especially in 5G, robotics, and electric vehicles (World Intellectual Property Organization, 2024). Recognizing the critical role of innovation in boosting economic growth, governments worldwide have introduced a diverse range of policies aiming at fostering corporate innovation through multifaceted efforts, involving policy reforms, strategic investments, and fostering collaborations among key stakeholders. Many countries, especially developing ones, are proactively leveraging innovation to change their economic landscapes (Archibugi et al., 2020; Cirera & Maloney, 2017). For example, EU member states implemented the European Research Area and Horizon 2020 programs to foster cross-border knowledge flows and public–private R&D collaboration, while large emerging economies such as China and India substantially increased R&D intensity and university–industry partnerships (OECD, 2023; World Intellectual Property Organization, 2023). These policy moves, together with the diffusion of digital technologies and the rise of data-driven sectors, have reshaped the innovation landscape and provide a rich setting to examine how improvements in NIS affect firm-level outcomes.
The innovation outputs in developed countries, which are at the forefront of global innovation thanks to their long-established national innovation systems (NISs), dominate the outputs from developing markets, such as in terms of scientific publications, R&D expenditure, and venture capital. That said, emerging economies are joining the race by rigorously reforming their national policies to strengthen their innovation systems, with China emerging as a global leader in patent filings and R&D spending (Archibugi et al., 2020; Wadho & Chaudhry, 2018; World Intellectual Property Organization, 2024). Another example is the United Arab Emirates, which was historically reliant on resource-based industries, has successfully transitioned into a prominent global hub for artificial intelligence (AI) thanks to sustained support from the government and tremendous investment in AI development. United Arab Emirates’ success also comes from the creation of effective partnerships and a foreign investment-friendly environment, exemplified by its flagship AI company–Group 42 – receiving substantial investments from Microsoft and establishing close partnerships with tech giants such as NVIDIA and OpenAI (G42 Group, 2024). By encouraging business entities to engage in innovation activities through supporting policies and incentives, the government can promote innovation-driven advancements through both domestic and foreign technological absorption, which subsequently contribute to broader economic dynamism as a result of improved operational efficiency, job creation and increased investment (Chege & Wang, 2020; Fagerberg & Srholec, 2008; Liu et al., 2023; Su et al., 2022).
At the firm level, innovation is inevitable as it shapes firms’ competitive advantages in the digitalized era. Many studies stress the importance of innovation on firm outcomes in the long term, such as financial performance, value creation and productivity (e.g., Hall et al., 2009; Liu et al., 2023; Simeth & Cincera, 2016). However, much of this literature adopts a firm-centric perspective, overlooking a critical antecedent: the business environment in which firms are operating. Observing firm performance from that important macro-level lens can yield some helpful recommendations for policymakers on which specific actions need to be taken to strengthen NISs. Even within the existing studies on firm-level innovation, its impact on firm performance is mixed. While some studies show that government R&D grants improve corporate financial performance (Howell, 2017; Zhao & Ziedonis, 2020), others empirically argue that such impact is minimal (De Blasio et al., 2015; Karhunen & Huovari, 2015; Wang et al., 2017). Taking research collaborations into consideration, the performance effect of research partnerships and collaborations is also inconclusive (Aguiar & Gagnepain, 2017; Guisado-González et al., 2018; Vanino et al., 2019). Such divergence in prior research findings might stem from various factors, for example, the costs associated with innovation, the absorptive capacity of firms and countries, and the innovation-supporting program framework (Guisado-González et al., 2018; Hewitt-Dundas et al., 2019).
Another thing to note is that the benefits of innovation are not immediately realized. Firms incur considerable financial and time costs when initiating and executing innovation strategies, and such efforts do not guarantee success. Christensen et al. (2016) document that even firms with well-developed business model innovation may fail to achieve desired outcomes if the innovation process is not effectively managed. Therefore, one key consideration is to weigh the short-term financial burdens and long-term gains. Firms engaging in early-stage innovation can bear significant costs in the form of R&D expenditures and operational disruptions; these investments, nonetheless, can yield long-term benefits that align with broader sustainable development goals (Archibugi et al., 2020). Given that firm performance, both in terms of accounting profits and market perception, is critical to firm long-term growth, it is imperative to delve into the performance effect of changes in NIS, a major driver of corporate innovation. Studying firm performance from the NIS perspective offers valuable insights into how systemic innovation structures influence corporate success, ultimately informing policymakers on how to foster an environment conducive to sustained innovation.
This study investigates the impact of NIS development, a macro-proxy of innovation, on firm performance in a cross-country setting. Using an international sample consisting of 16,228 firms from 50 countries and WIPO’s global innovation indices as the proxy for the NIS during the 2011 to 2019 period, we document a poorer short-term performance when NIS is improved. The reliability of this finding is confirmed via a variety of robustness tests, including alternative measures of firm performance and national innovation system states, entropy balancing, and two-stage least-squares (2SLS) estimation. By analyzing the components of the global innovation index, we show that innovation infrastructure and creative outputs represent the source of the performance effect. This negative impact is clearly present in developing markets.
To understand the mechanism behind this effect, we identify rising innovation intensity as a key channel that can explain the performance-destroying effect of NIS in the short term. This exploration highlights that enhancing NISs creates challenges for firms to maintain their performance while competing in the innovation landscape.
This study presents some novel contributions from both the theoretical and practical sides. While prior research has intensively investigated the performance consequences of innovation at the firm level (e.g., Choi & Williams, 2013; Huang, Xu et al., 2023; Lee & Wu, 2016; Santi & Santoleri, 2017), this is the first study to examine the impact of NIS on firm performance in an international setting. Departing from the existing literature which concentrates on the performance effect of firm-level innovation or certain forms of government support (e.g., Hewitt-Dundas et al., 2019; Vanino et al., 2019; Zhao & Ziedonis, 2020), this study offers a more comprehensive understanding from the national system of innovation viewpoint, which consists of diverse innovation pillars constructed by WIPO. While prior theories, such as the Triple Helix framework (Etzkowitz & Leydesdorff, 2000) and dynamic capabilities theory (Teece, 2007), primarily emphasize the role of NIS in facilitating knowledge creation, collaboration, and sustained competitive advantage, they largely focus on long-term performance implications. Building on Schumpeterian growth theory and the innovation cost paradox, our findings refine this view by demonstrating that the benefits of enhanced innovation systems are not immediately realized at the firm level. Instead, improvements in NIS can intensify innovation efforts and competitive pressures, creating short-term cost burdens that negatively affect both accounting and market performance. Our findings lend support to Ciarli et al. (2021) which claim that governments’ innovation interventions entail both opportunities and challenges, and the challenges seem to outweigh in the short term as reflected via firms’ unimpressive bottom lines. By highlighting this temporal misalignment between NIS development and firm-level outcomes, this study extends NIS theory beyond its traditional focus on aggregate and long-run gains, offering a more comprehensive understanding of how NISs affect firms across different time horizons.
Second, this study adds to the literature by revealing the mechanism through which NIS influences firms’ ability to generate profits. Improved innovation-supporting systems are found to increase nation-level innovation outputs, indicating a greater inclination for corporate innovation financing that compromises short-term gains. We do not document empirical evidence on the market competition channel, which is a commonly recognized channel in the innovation literature and practice (Aghion et al., 2018; OECD, 2023). The lack of explanatory power may reflect measurement limitations, as conventional indicators of market competition, such as the Herfindahl–Hirschman Index and the Boone indicator used in this study, do not capture industry- or firm-level innovation capacity. Accordingly, our finding should not be interpreted as contradicting the existing literature, but rather as underscoring the need for the development of more comprehensive metrics of market competition.
In terms of practical contributions, we point out that this undesired effect is more pronounced in developing markets where the infrastructure and policies for innovation are incomparable to developed ones. One surprise is that although NIS does not significantly affect firms’ profits in developed markets, investors in those markets do not seem to appreciate firms’ increasing expenditure spent on innovation. This finding should be attended to by developed markets’ firms during their innovation planning to maintain their public image. Moreover, the component analysis shows that not all national innovation pillars, as proposed by WIPO, drive the short-term performance-depressing effect. Although infrastructure and creative outputs can cast an unexpected effect on firm performance, especially in developing markets, this also indicates that firms’ innovation tendency rises with the development of these two innovation pillars. Knowing the innovation-boosting properties of those two pillars and that the negative effect of NIS on firm performance is faded after roughly 3 years, policymakers are provided with helpful references when formulating their national innovation strategies.
The remainder of this study is structured as follows. Section 2 summarizes the literature and develops research hypotheses. Section 3 presents the method and data used in this research. Section 4 reports and discusses the research findings. Finally, Section 5 offers some implications and suggests future research avenues based on our findings.
Literature Review and Hypothesis Development
The Impact of National Innovation System on Firm Performance
While understanding firms’ responses to changes in NISs is essential as many countries are increasing their reliance on innovation to boost economic development and shape competitive advantages, this relationship is complex and subject to multifaceted, often contradictory interpretations. The first perspective suggests that NISs positively influence firm performance by fostering innovation and facilitating collaboration among economic actors via several channels. First, conventional theories on NIS models, such as Nonaka and Takeuchi’s (1995) Socialization, Externalization, Combination, and Internalization model and Etzkowitz and Leydesdorff’s (2000) Triple Helix model, assert that the promotion of NISs can facilitate knowledge spillovers, which directly benefit firms through improving their accessibility to knowledge generated by academia, research institutions and government agencies. Chen et al. (2018) highlight that the establishment of successful NISs entails continual interactions among various components, facilitating the diffusion of advanced knowledge and technologies across firms and industries. Furthermore, the collaborative networks formed from such interactions can promote resource sharing and joint problem-solving among involved parties, which leads to more cost-effective innovation and greater technological absorption (Karlsson & Warda, 2014). Another key mechanism fostering firm performance is the growth of dynamic capabilities resulting from innovation-enabling contexts that encourage firms to quickly adapt to market changes and leverage emerging opportunities. Dynamic capabilities, which are referred to as a firm’s ability to integrate, build, and reconfigure internal and external competencies, can enhance corporate resource utilization efficiency and assist them in shaping their innovation-based competitive advantages (Teece, 2018). Moreover, incentives provided by NISs (e.g., R&D subsidies, tax incentives, and innovation grants) can reduce the financial barriers to corporate innovation, thus driving firms to engage in the development of new products, processes, and technologies. This increasing utilization of governments’ supporting schemes for corporate innovation subsequently translates into more innovation outputs and improved corporate profitability (Cunningham et al., 2018). Looking forward, such government policies can foster a culture encouraging firms to continuously innovate to maintain their competitiveness, which is essential for sustaining long-term competitiveness in global markets.
Conversely, counterarguments cast doubt on the amplifying effect of NIS on firms’ ability to generate profits, at least in the short term. According to Edler and Fagerberg (2017), governments’ efforts to create more complete innovation systems may not always align with anticipated outcomes. Instead of focusing on businesses as the focal point in economic development strategies, governments come up with policies that prioritize macro-level outcomes. These policies can be beneficial for large firms that have available resources to pursue innovative activities; however, smaller firms that are under resource constraints or are tech-lagging may find it difficult to align their strategies with these priorities, resulting in diminished performance while trying to compete by means of innovation (Acs & Audretsch, 1988; Wellalage & Fernandez, 2019). From the viewpoint of the innovation cost paradox, despite that NISs are designed to encourage innovation, firms may falsely estimate the financial burden of adopting new technologies, conducting R&D and complying with stricter innovation-related regulations, causing innovation spending to exceed the short-term benefits (Terry, 2023; Wu & Liu, 2023). Furthermore, while firms might be more inclined to innovate following NIS improvements, their limited knowledge and experience disable them from effectively planning and managing innovation projects (Cruz-Gonzalez et al., 2015; Hoang, 2025a). This is especially true in emerging economies where firms often lack the knowledge, infrastructure, and networks needed to leverage the benefits of an upgraded NIS (Cirera & Maloney, 2017). Instead of improving performance, the increased complexity of the innovation system may lead to a widening gap between well-resourced firms and those struggling to keep pace, deepening inequalities and hindering overall productivity.
Even when firms are supplied with sufficient capital through government funding, firms might be subject to the crowding-out effect. Public R&D grants can lead firms to substitute external funding for their own internal resources originally allocated for innovation projects, thereby shifting (part of) the financial risk associated with innovation to public funders. This reliance on “free money” can result in inefficiencies, as inadequate government resource allocation and firms’ short-term budgeting misallocations diminish the effectiveness of financial support (Fang et al., 2023). In addition, even when firms take innovation seriously, excessive government interventions in NISs, such as direct funding of public research institutions or state-sponsored innovation projects, can reduce firms’ incentives to invest independently in innovation (Aghion & Jaravel, 2015). As a result, the lack of vigorous innovation strategies, coupled with firms’ over-reliance on government funding, could hamper firms’ long-term growth potential.
Despite differing opinions in the literature, the positive and negative views on the relationship between national innovation systems (NIS) and firm performance are not mutually exclusive. While some theories support a positive long-run relationship, they do not imply that the benefits materialize immediately once an NIS improves. Rather, these theories emphasize that by strengthening NISs, governments create a conducive environment for firms to learn, collaborate, and continuously innovate, thereby fostering sustainable economic growth (Freeman, 1995; Lundvall, 1992). Our framework is grounded in NIS theory and is complemented by the Schumpeterian model of innovation and competition (Aghion & Howitt, 1992; Schumpeter, 1942), highlighting NIS as a dual mechanism: it generates long-term gains through knowledge spillovers and capability accumulation, but it also triggers creative destruction, intensifying rivalry and eroding incumbent rents as new technologies diffuse. In such settings, firms face the innovation cost paradox – high upfront expenditures on R&D and capability building while immediate profits remain elusive (Peters & Taylor, 2017). This notion is reinforced by absorptive capacity theory, which argues that firms must invest in internal R&D and related knowledge assets to recognize, assimilate, and exploit external knowledge flows (Cohen & Levinthal, 1990). The returns to these investments are inherently lagged: only after sufficient absorptive capacity is built can firms fully capitalize on the spillovers created by an improved NIS. Similarly, the dynamic capabilities perspective (Teece et al., 1997) stresses that firms need to reconfigure and integrate resources to capture value from new technological opportunities, a process that entails significant adjustment costs and organizational learning before payoffs emerge.
Empirical evidence is consistent with this logic. Lee and Wu (2016) show that current-year R&D spending depresses contemporaneous firm performance, whereas accumulated R&D capital over the previous 3 years enhances it, illustrating the lag between innovation investment and financial returns. These findings support the idea that innovation, although value-creating in the long run, is initially associated with profit pressures and uncertainty. Investors, however, may anticipate these future returns, so forward-looking market valuations can remain stable or even increase despite short-term earnings reductions (Peters & Taylor, 2017). Taken together, these theoretical strands provide a coherent foundation for our hypothesis: improvements in a country’s NIS are expected to impose short-run cost pressures on firms’ accounting performance while laying the groundwork for long-run value creation that forward-looking investors may already price into firm valuations.
While ample studies have enriched the association between firms’ innovation and their performance, none of the prior studies address how firm performance reacts to changes in the country-level innovation systems. Understanding this link is crucial, as NISs shape the broader innovation environment in which firms operate and may impose costs and constraints that differ fundamentally from firm-level innovation choices. To seek an answer for this interesting yet imperative relationship, we propose Hypothesis 1 as follows:
Channel Hypothesis – Innovation Intensity
Corporate investments in technology and knowledge creation are expected to increase following heightened government efforts to foster innovative activities. Support from the government can be manifested in several forms and generally categorized into two groups of input support (e.g., financial aid, infrastructure, human capital) and output support (e.g., intellectual property rights protection). Such supports provide firms with access to necessary resources and facilities to initiate their innovative activities, ensure their legal ownership of innovation outputs, and discourage any commercialized ideas that violate the owners’ copyrights (Nguyen et al., 2024; Xu et al., 2021). These factors collectively increase firms’ likelihood of investing in innovation and producing measurable outputs, such as patents and new products (Castellacci & Natera, 2013).
At the same time, stronger national innovation systems often induce firms to intensify their innovation efforts, which can amplify short-run cost pressures and adversely impact firms’ short-term profitability. Innovation projects entail substantial upfront expenses and uncertain commercialization prospects, signifying that foreseeable expenditures precede measurable benefits, at least in the short run (Hall & Lerner, 2010). Therefore, firms that intensify R&D/innovation spending often experience significant financial strain (Lichter et al., 2025; McKinsey & Company, 2024). Elevated R&D intensity also increases earnings volatility and reduces free cash flows, leading equity markets to discount firm value in the near term (Chan et al., 2001; D. Li, 2011). This deterrent effect of the substantial upfront investments on firm performance, as suggested by Coad and Rao (2010), is not limited to small firms but also to those with high levels of slack resources, which aligns with the innovation cost paradox. Additionally, the pressure to innovate can lead firms to divert resources from core operations toward R&D, which in turn disrupts established routines and creates coordination frictions (Ahlawat et al., 2019). As a result, firms may experience short-term productivity slowdowns and less effective operations before any innovation benefits materialize (Hall & Lerner, 2010).
Together, these underlying reasons imply that innovation-intensive responses to improved NIS conditions impose immediate financial strain on firms, lowering both profitability and market valuation in the short run. Hypothesis 2 is, therefore, stated as follows:
Channel Hypothesis – Industry Competition
An improved NIS fosters innovation across firms, which is expected to increase the level of competition within industries. Bloom et al. (2019) suggest that innovation policies that promote widespread innovation capabilities intensify rivalries as firms compete for market share through differentiated products and technologies. Similarly, Granstrand and Holgersson (2020) highlight that strong innovation ecosystems amplify competition by reducing barriers to entry and enabling new firms to challenge established players in an industry. Specifically, greater diffusion of innovation capacity expands the pool of technologically capable firms, raising the number of rivals able to imitate or overtake competitors. This mechanism is consistent with Schumpeterian models, where innovation induces business-stealing effects that squeeze competitors’ profits and reshape the market positions (Aghion et al., 2015). As more innovative firms simultaneously join the competition, incumbent firms face mounting pressure to protect their relevance in the market, forcing them to tradeoff short-term profits for innovation opportunities.
The reduced firm performance can be explained via three major lenses. First, intense competition can erode profit margins as firms engage in price wars or invest heavily in marketing to differentiate their offerings (Coad et al., 2016; Porter, 1985). Second, firms may face higher costs related to rapid innovation cycles, such as frequent product upgrades and the need to attract and retain top talent (Dockner & Siyahhan, 2015). Accelerated technological change often requires continuous capability renewal, leading firms to invest heavily in advanced equipment, specialized human capital, and organizational restructuring. These recurring adaptation costs can significantly raise operating expenses and strain short-term financial performance (Jacobides et al., 2018). Third, the competition fueled by increasing innovation support can also be attributed to innovation herding – a phenomenon where firms within an industry engage in innovation activities to respond to similar behaviors by competitors (Xu et al., 2012). This innovation herding arises as firms seek to capitalize on the opportunities offered by an enhanced NIS to create their own innovation remarks. On the one hand, simultaneous engagement in innovation activities among various firms in an industry can accelerate technological advancements and market offerings. On the other hand, the convergence of innovation efforts increases pressure on firms to match the prevailing innovation tempo, often resulting in rushed or poorly integrated innovation investments and resource misallocation that potentially undermine firms’ short-run overall performance (Ahlawat et al., 2019; Yiu et al., 2020).
All in all, while an improved NIS can enhance competitiveness, the associated costs and pressures stemming from heightened competition may outweigh the benefits in the short term, negatively impacting firm performance. These rationales lead to our Hypothesis 3:
Methodology and Data
Global Innovation Index
This study examines the influence of national innovation on firm performance by employing the Global Innovation Index (GII) as a comprehensive metric for a country’s innovation capacity and output. Developed by the WIPO, the GII provides a multidimensional framework that evaluates the extent to which national policies, investments, and institutional frameworks facilitate innovation. Its extensive cross-country coverage and standardized methodology make it a robust and comparative indicator for analyzing the role of national innovation in shaping firm-level outcomes.
In the GII, seven innovation pillars are categorized into innovation inputs and innovation outputs. Innovation inputs reflect the enabling environment for innovation, including institutions, human capital and research, infrastructure, market sophistication, and business sophistication. Meanwhile, innovation outputs measure knowledge and technology production, as well as creative outputs, capturing tangible innovation-driven results such as patent filings, high-tech exports, and knowledge diffusion. Including those key input and output measures of NIS makes the GII particularly suitable for holistically analyzing the extent to which national innovation efforts translate into firm-level benefits. Furthermore, the employment of the GII as a country-level innovation measure enables cross-country comparisons, enabling this study to assess whether changing NIS conditions consistently impact firm-level outcomes, by that offering invaluable insights for policymakers aiming to enhance innovation-driven firm performance and national competitiveness through innovation-led growth
While the GII provides a relatively comprehensive measure of NIS, it has inherent limitations. It should be noted that some components of the GII rely on perception-based indicators and self-reported data, which may introduce subjectivity and measurement noise. Moreover, cross-country comparability may be affected by discrepancies in countries’ economic and institutional contexts, potentially leading to systematic biases favoring higher-income economies (Cirera & Maloney, 2017; World Intellectual Property Organization, 2023). This research seeks to address these shortcomings of GII by designing a research model that captures fundamental country-level indicators to enhance GII’s credibility as a proxy for NISs.
Research Model
To investigate the impact of NIS on firm performance, the fixed effect model is employed in this study. The use of the fixed effect model allows better controls for the variation at both the time series and cross-section that might otherwise bias the estimated effect. The research model is designed as follows:
in which FP is measured by two alternative proxies, namely return on assets (ROA) and Tobin’s Q (TOBINSQ). ROA is computed by dividing a firm’s net income by its average total assets. Meanwhile, to calculate TOBINSQ, we use the following formula:

Although both ROA and Tobin’s Q are extensively utilized as proxies for firm performance in the literature, these two measures differ fundamentally. While ROA captures the accounting-based performance, Tobin’s Q represents market-based performance by reflecting market valuation relative to asset replacement costs. Thus, simultaneously employing ROA and TOBINSQ may not yield completely identical statistical results but can offer some interesting insights into how the accounting- and market-based performance vary with a changing NIS context. Regarding national innovation, GII represents the WIPO’s composite Global Innovation Index, which is re-evaluated on an annual basis to update the current capacity of innovation systems worldwide.
Two sets of control variables at the firm level and country level are employed to capture the differences among firms and countries. At the firm level, we follow H. H. Huang et al. (2018), Hu and Zhang (2021), and Gull et al. (2022) to account for firm size (SIZE), leverage (LEVERAGE), cash holdings (CASH), sales growth (REV_GROWTH), tangible assets (TANGIBILITY), and net working capital (NWC). At the country level, GDP growth (GDP_GROWTH), inflation (INFLATION), rule of law (RULEOFLAW), GINI index (GINI) and national spending for R&D (NATION_RDEXP) are included. To further account for the heterogeneity across firms, countries and periods, we include firm, country and year fixed effects in Model 1. The definition of our variables and associated sources are presented in Table A1.
Following the conventional approach in finance research, we winsorize all firm-level continuous variables at the top and bottom percentiles to relieve the outlier effect that can lead to estimation bias. Robust standard errors are clustered by country to alleviate the heteroskedasticity and autocorrelation misspecification.
Data
Data used in this study are compiled from several sources. Firm-level data are collected from Thomson Reuters’ Refinitiv. GII and its components are retrieved from WIPO’s annual Global Innovation Index reports. The macroeconomic and institutional variables are downloaded from the World Bank open database.
In accordance with the conventional approach in finance research, we exclude financial firms since the financial industry is typically highly regulated and is subject to distinct accounting and operation natures. Our sample is then gone through a filtering process to eliminate observations with insufficient data to estimate Equation 1. Eventually, the final sample consists of 77,819 observations of 16,228 firms from 2011 to 2019. These firms are scattered across 50 countries (see Table A2 for the complete list of countries), enabling us to observe the examined impact in an international context, thus adding significant understanding to the general knowledge revolving around NISs. Furthermore, the cross-country sample choice facilitates the generalization of the research findings, which is expected to help policymakers in formulating effective national innovation strategies.
We restrict our sample to 2019 since extending data beyond that point could introduce uncontrollable confounding factors, such as the health pandemic which triggered unprecedented disruptions in global supply chains, labor markets, and innovation activities, and international conflicts, led by the Russia–Ukraine war, that exacerbate economic instability. By focusing on the pre-2019 period, we aim to maintain the internal validity of our findings, ensuring that observed effects are attributable to changes in NISs rather than external crises.
Descriptive Statistics
The descriptive statistics of variables used in this study are presented in Panel A of Table 1. The statistics show that the firms averagely have a ROA as low as 0.3% and are highly overvalued (mean of TOBINSQ = 2.485). It seems that the market is optimistic about the firms’ prospects despite that firms are not profitable at the moment. On the flip side, this contradiction also presents a challenge for firms as the market may correct their valuation once future performance does not align with their expectation. Debt only accounts for a low proportion (≈11%) of firms’ total assets, and 12.7% of their assets are under the cash form. Meanwhile, more than one-fourth of the total assets are property, plant and equipment. The growth rate of revenue is quite noticeable at 17.4% per annum.
Descriptive Statistics.
Panel A. Summary Statistics.

Note. Panel A, Table 1 reports summary statistics of all variables in this study. Variable definitions and data sources are shown in Table A1. All continuous variables are winsorized at 1st and 99th percentiles.
Panel B. Pearson Pairwise Correlation Coefficient Matrix.

Note. Panel B, Table 1 reports Pearson pairwise correlation coefficients of variables in Model 1. Variable definitions and data sources are shown in Table A1. Coefficients significant at 5% level are typed in bold. All continuous variables are winsorized at 1st and 99th percentiles.
Panel B, Table 1 reports the Pearson correlation coefficient matrix of variables in Model 1. It can be seen that almost all correlation coefficients are significant at the 5% level, stressing the necessity to include them in Model 1. Moreover, none of the coefficients has their values exceed 0.8, thus further indicating that our estimates are unlikely to be falsely driven by the multicollinearity concern.
Empirical Results
Multivariate Regression
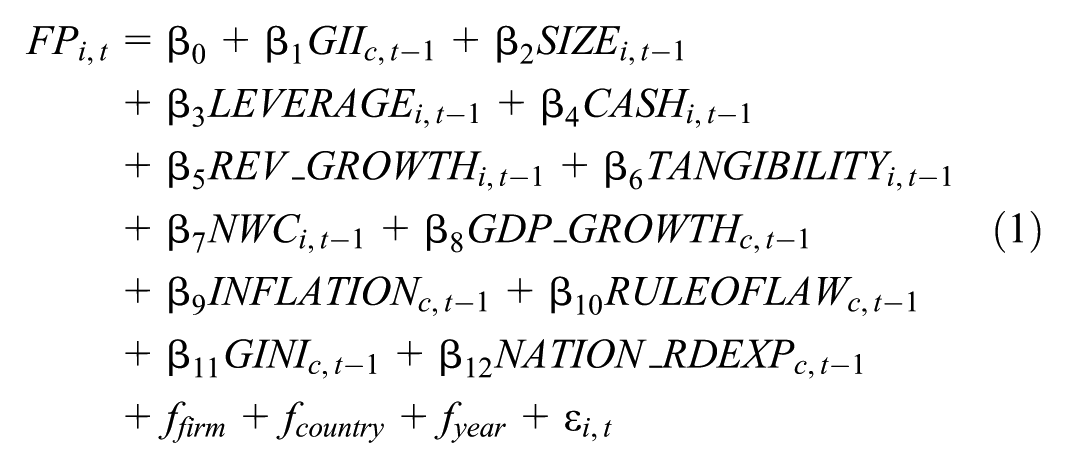
This section examines the direct effect of NIS on firm performance by estimating Model 1 using different model specifications and reporting the results in Table 2. First, we conduct bivariate regressions of firm performance measures on GIIt−1 (Columns 1 and 3). Next, Model 1 is estimated (Columns 2 and 4). The coefficients of GIIt−1 in all tests are significantly negative, indicating that an NIS upgrade is unbeneficial for firms in the short run, both in terms of accounting profits (ROA) and market valuation (TOBINSQ). These results validate our Hypothesis 1, which suggests a negative association between NIS development and firm performance. As NIS improves, firms may have better access to the facilities and financial resources needed for innovation projects and are more incentivized to engage in such activities. Increasing innovation spending represents a shift in operational direction that entails current financial burdens in exchange for potentially larger long-term gains. As a result, we witness a reduction in firm performance in the short run. Additional robustness tests, including estimating Model 1 in subsamples of non-high-tech industries and high-tech industries, and with Chinese and Indian firms dropped, are presented in Appendix A3.
Baseline Model Regressions.
Note. Table 2 reports the regression results of Model 1 with ROA and TOBINSQ as two firm performance proxies. Columns 1 to 2 report the results of the bivariate regression and Model 1 regression, using ROA as the dependent variable. Columns 3 to 4 replicate Columns 1 to 2, replacing ROA with TOBINSQ as the dependent variable. Variable definitions and data sources are shown in Table A1. Robust standard errors are clustered by firm. Robust t-statistics are in parentheses. All continuous variables are winsorized at 1st and 99th percentiles.
*, **, and *** indicate levels of significance at 10%, 5%, and 1%, respectively.
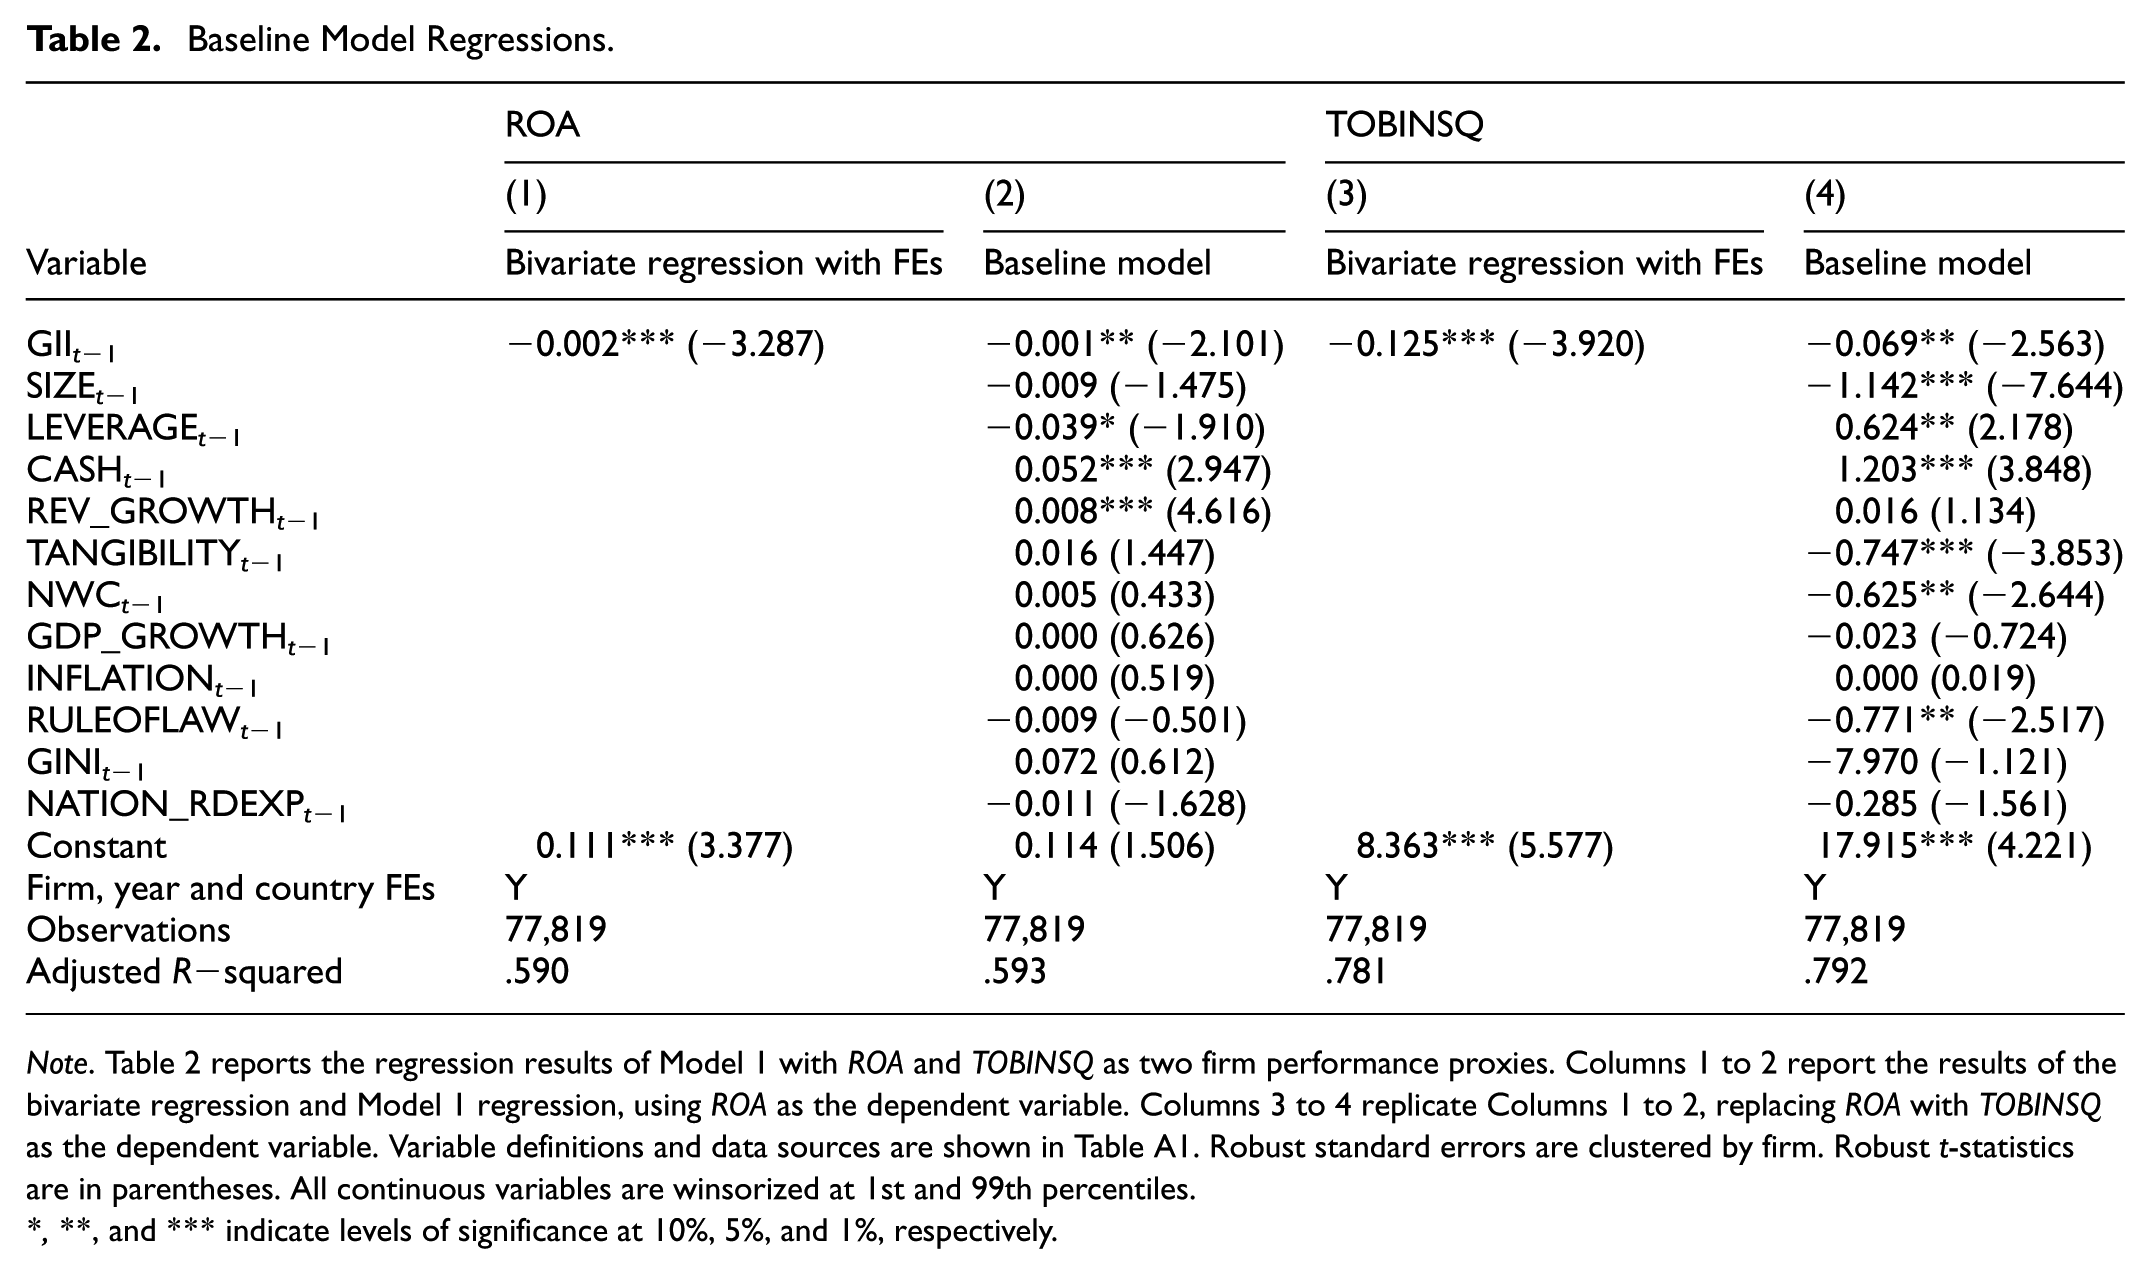
To get further insight into this association, we delve into the component analysis. We separately examine each of the seven pillars that constitute the GII, namely Institutions, Human capital and research, Infrastructure, Market sophistication, Business sophistication, Knowledge and technology outputs, and Creative outputs. The results shown in Table 3 imply that the impact of NIS is driven by the infrastructure and creative outputs pillars. In parallel, the coefficient of Market sophistication (MARKETSOPHISt−1) is significant in Panel A, suggesting that firms’ accounting performance is negatively influenced by this pillar, which comprises the key aspects of ease of getting credit, investment, trade, and market competition and scale. On the contrary, TOBINSQ is not affected by this dimension.
Component Analysis.
Note. Table 3 reports the regression results of Model 1, with ROA (Panel A) and TOBINSQ (Panel B) as two firm performance proxies, after replacing GII with each of its innovation pillars. Seven innovation pillars include Institutions, Human capital and research, Infrastructure, Market sophistication, Business sophistication, Knowledge and technology outputs, and Creative outputs. Variable definitions and data sources are shown in Table A1. Robust standard errors are clustered by firm. Robust t-statistics are in parentheses. All continuous variables are winsorized at 1st and 99th percentiles.
*, **, and *** indicate levels of significance at 10%, 5%, and 1%, respectively.
These results reveal that each GII pillar impacts firm performance differently. The findings that infrastructure is a primary driver of firm performance align with the infrastructure-driven competition effect. Specifically, improvements in infrastructure lower search, logistics, and entry costs economy-wide, leading to compressed markups and intensified rivalry – the mechanisms in settings where connectivity reduces price dispersion and strengthens competitive pressure (Brown & Goolsbee, 2002; Brynjolfsson & Smith, 2000). Market-linking infrastructure also raises the threats of new entrants, thus slashing average profitability in the short run as competition intensifies (Donaldson, 2018; Porter, 1985).
Likewise, an environment abundant in creative outputs implies dense product variety and fierce competition. Such markets are characterized by high revenue volatility and squeezed average profits even as a few winners capture large rents (Caves, 2003). Creative outputs might also bid up skilled employees’ wages, resulting in raising businesses’ input costs across the economy (J. Li et al., 2020). Near-term firm performance, hence, is deemed to decline. Moreover, our finding that market sophistication is negatively associated with Tobin’s Q but unrelated to accounting performance supports the efficient market hypothesis, suggesting that increased competition – due to anticipated heightened innovative activities – factors into valuations faster than reported profit, which might not recognize a profitability reduction in the immediate accounting period (Huang, Lin et al., 2023).
The non-significance of the other pillars (institutions, human capital and research, business sophistication, and knowledge and technology outputs) does not necessarily imply irrelevance. Research on NIS emphasizes complementarities and capabilities, which means these inputs contribute to absorptive capacity and the efficiency of knowledge use, but effects typically materialize over longer horizons and through interaction with downstream enablers (Fagerberg & Srholec, 2008). We therefore cautiously interpret these insignificant coefficients as slower, capability-dependent transmission rather than an absence of impacts.
Endogeneity Diagnoses
Alternative Measures of Firm Performance and National Innovation System
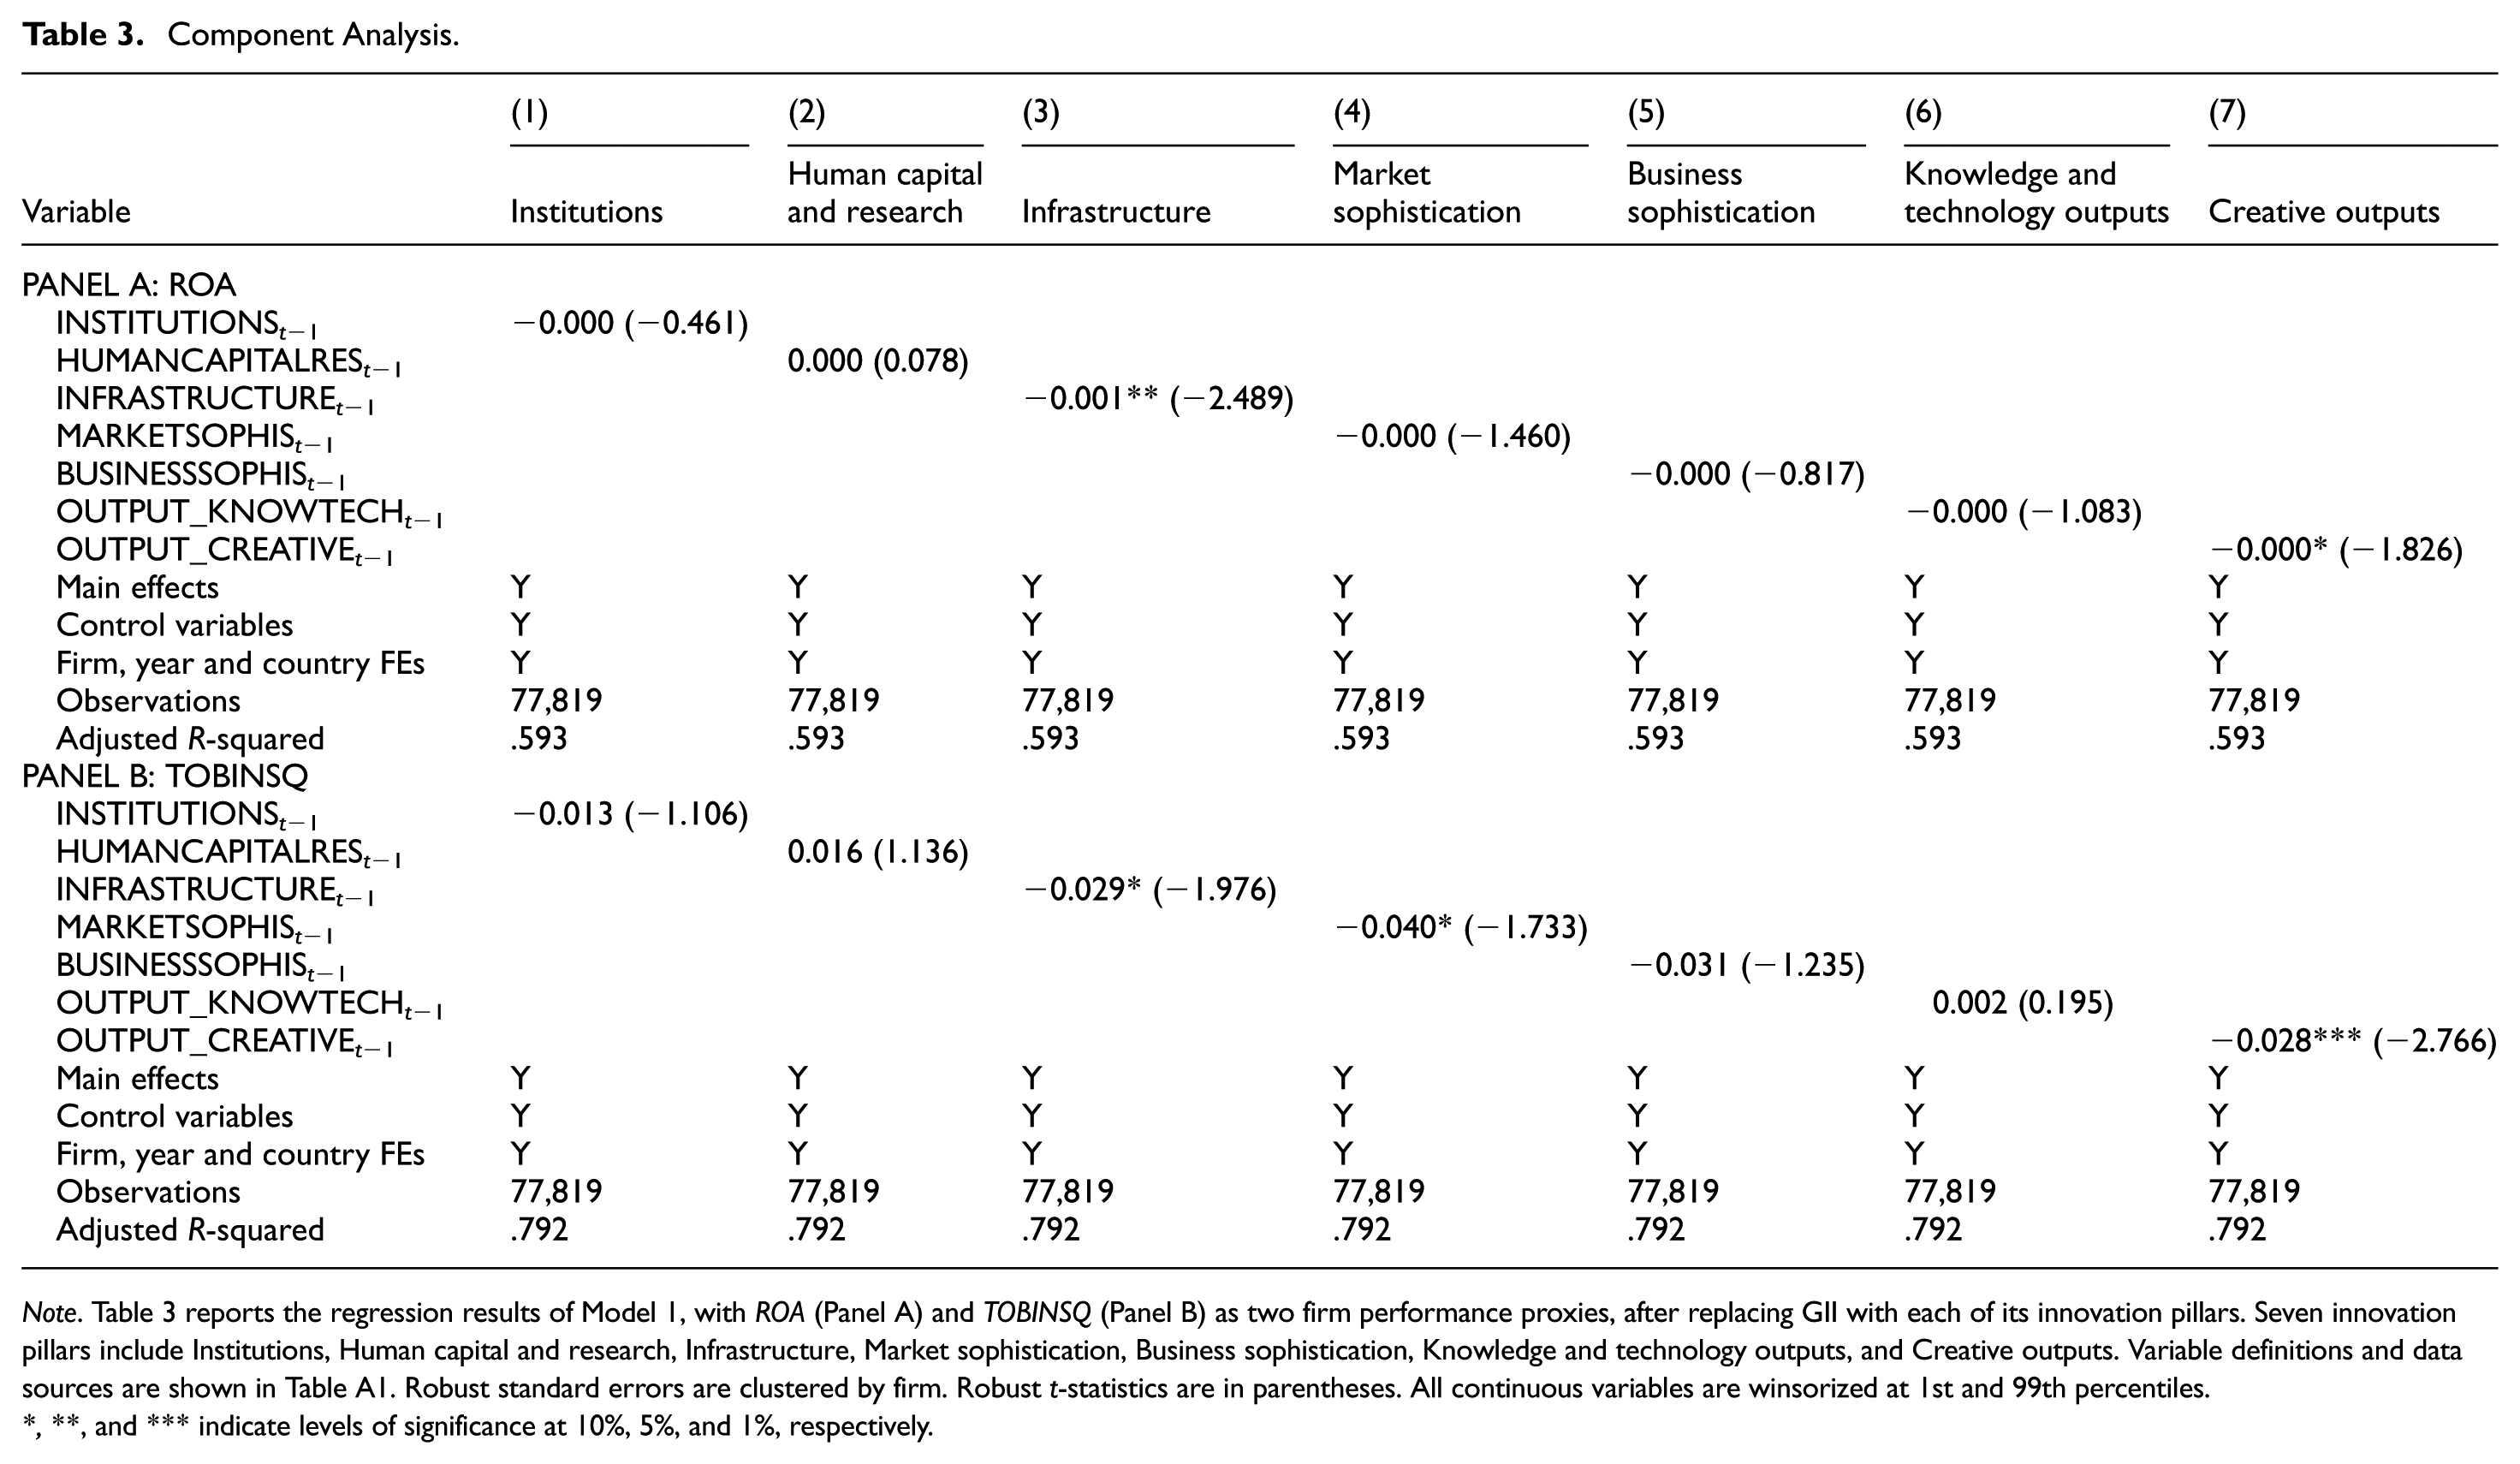
To inspect whether our finding is sensitive to measurement choice, we make use of different measures of firm performance and GII in our Model 1. Since firms’ profitability among a diverse range of industries might not be comparable, we adjust ROA by industry; that is, we compute the annual industry-average firm performance, then take the difference between a firm’s ROA and its industry average. The use of industry-adjusted measures allows us to focus on examining firm performance in relation to other companies within the same industry, thereby enabling an assessment of the impact of the GII from an industry-specific perspective. As for NIS, we transform the 1-year lag of GII to derive the natural logarithm of GIIt−1 as an alternative measure. Furthermore, since GII is subject to bias due to inappropriate weight generation and indicator aggregation (Alqararah, 2023), employing another proxy for NIS is necessary. We make use of the OECD Research and Development Statistics Data, which offer data on Gross domestic expenditure on R&D, R&D personnel, and Government budgets on R&D. We construct an alternative OECD-based innovation index using the data reduction technique Principal Component Analysis (PCA) method. Applying PCA helps retain the combined informational content of the innovation indicators and provides a more neutral representation of the present state of the national innovation system (Shabir et al., 2023). In addition, PCA serves to lessen potential measurement noise and reduce multicollinearity among these closely related variables (Chao et al., 2017). Only the first factor extracted from the PCA is employed, as the factor itself accounts for 94.88% of the variation of the newly created NIS index. The higher the value of the factor, the greater the innovation intensity of the country in a given year.
As reported in Table 4, we find the results using alternative proxies for firm performance and NIS consistent with our main finding in Section 4.1. That is, all the coefficients of NIS variables are statistically negative at 10% significance level for ROA and at (at least) 5% significance level for TOBINSQ. These pieces of evidence bolster our confidence in the robustness of the findings.
Alternative Measures.
Note. Table 4 reports the regression results of Model 1, with ROA (Panel A) and TOBINSQ (Panel B) as two firm performance proxies, after replacing PF with the industry-adjusted firm performance (Column 1), GIIt−1 with the natural logarithm of GIIt−1 (Column 2) and OECD-based innovation index (Column 3). Variable definitions and data sources are shown in Table A1. Robust standard errors are clustered by firm. Robust t-statistics are in parentheses. All continuous variables are winsorized at 1st and 99th percentiles.
*, **, and *** indicate levels of significance at 10%, 5%, and 1%, respectively.
Entropy Balancing for Continuous Treatment
Selection bias can arise from our international research setting given that our sample might skew toward larger listed firms whose financial statements are reported more consistently. The exclusion of firms with incomplete data might lead to the overrepresentation of successful firms rather than capturing the overall performance of all listed firms. To examine whether our research results are biased, we use Tübbicke’s (2022) entropy balancing for continuous treatments (EBCT) method, which can be utilized to eradicate the correlations between the treatment (and its higher moments) with all covariates. Entropy balancing is considered “doubly robust” as compared with the conventional propensity score matching (Zhao & Percival, 2017). The summary statistics on balancing quality, presented at the foot of each panel of Table 5, indicate that the entropy balancing is successfully done since the R-squared of the regression of firm performance (ROA and TOBINSQ) on all the control variables equals zero.
Endogeneity Diagnoses.
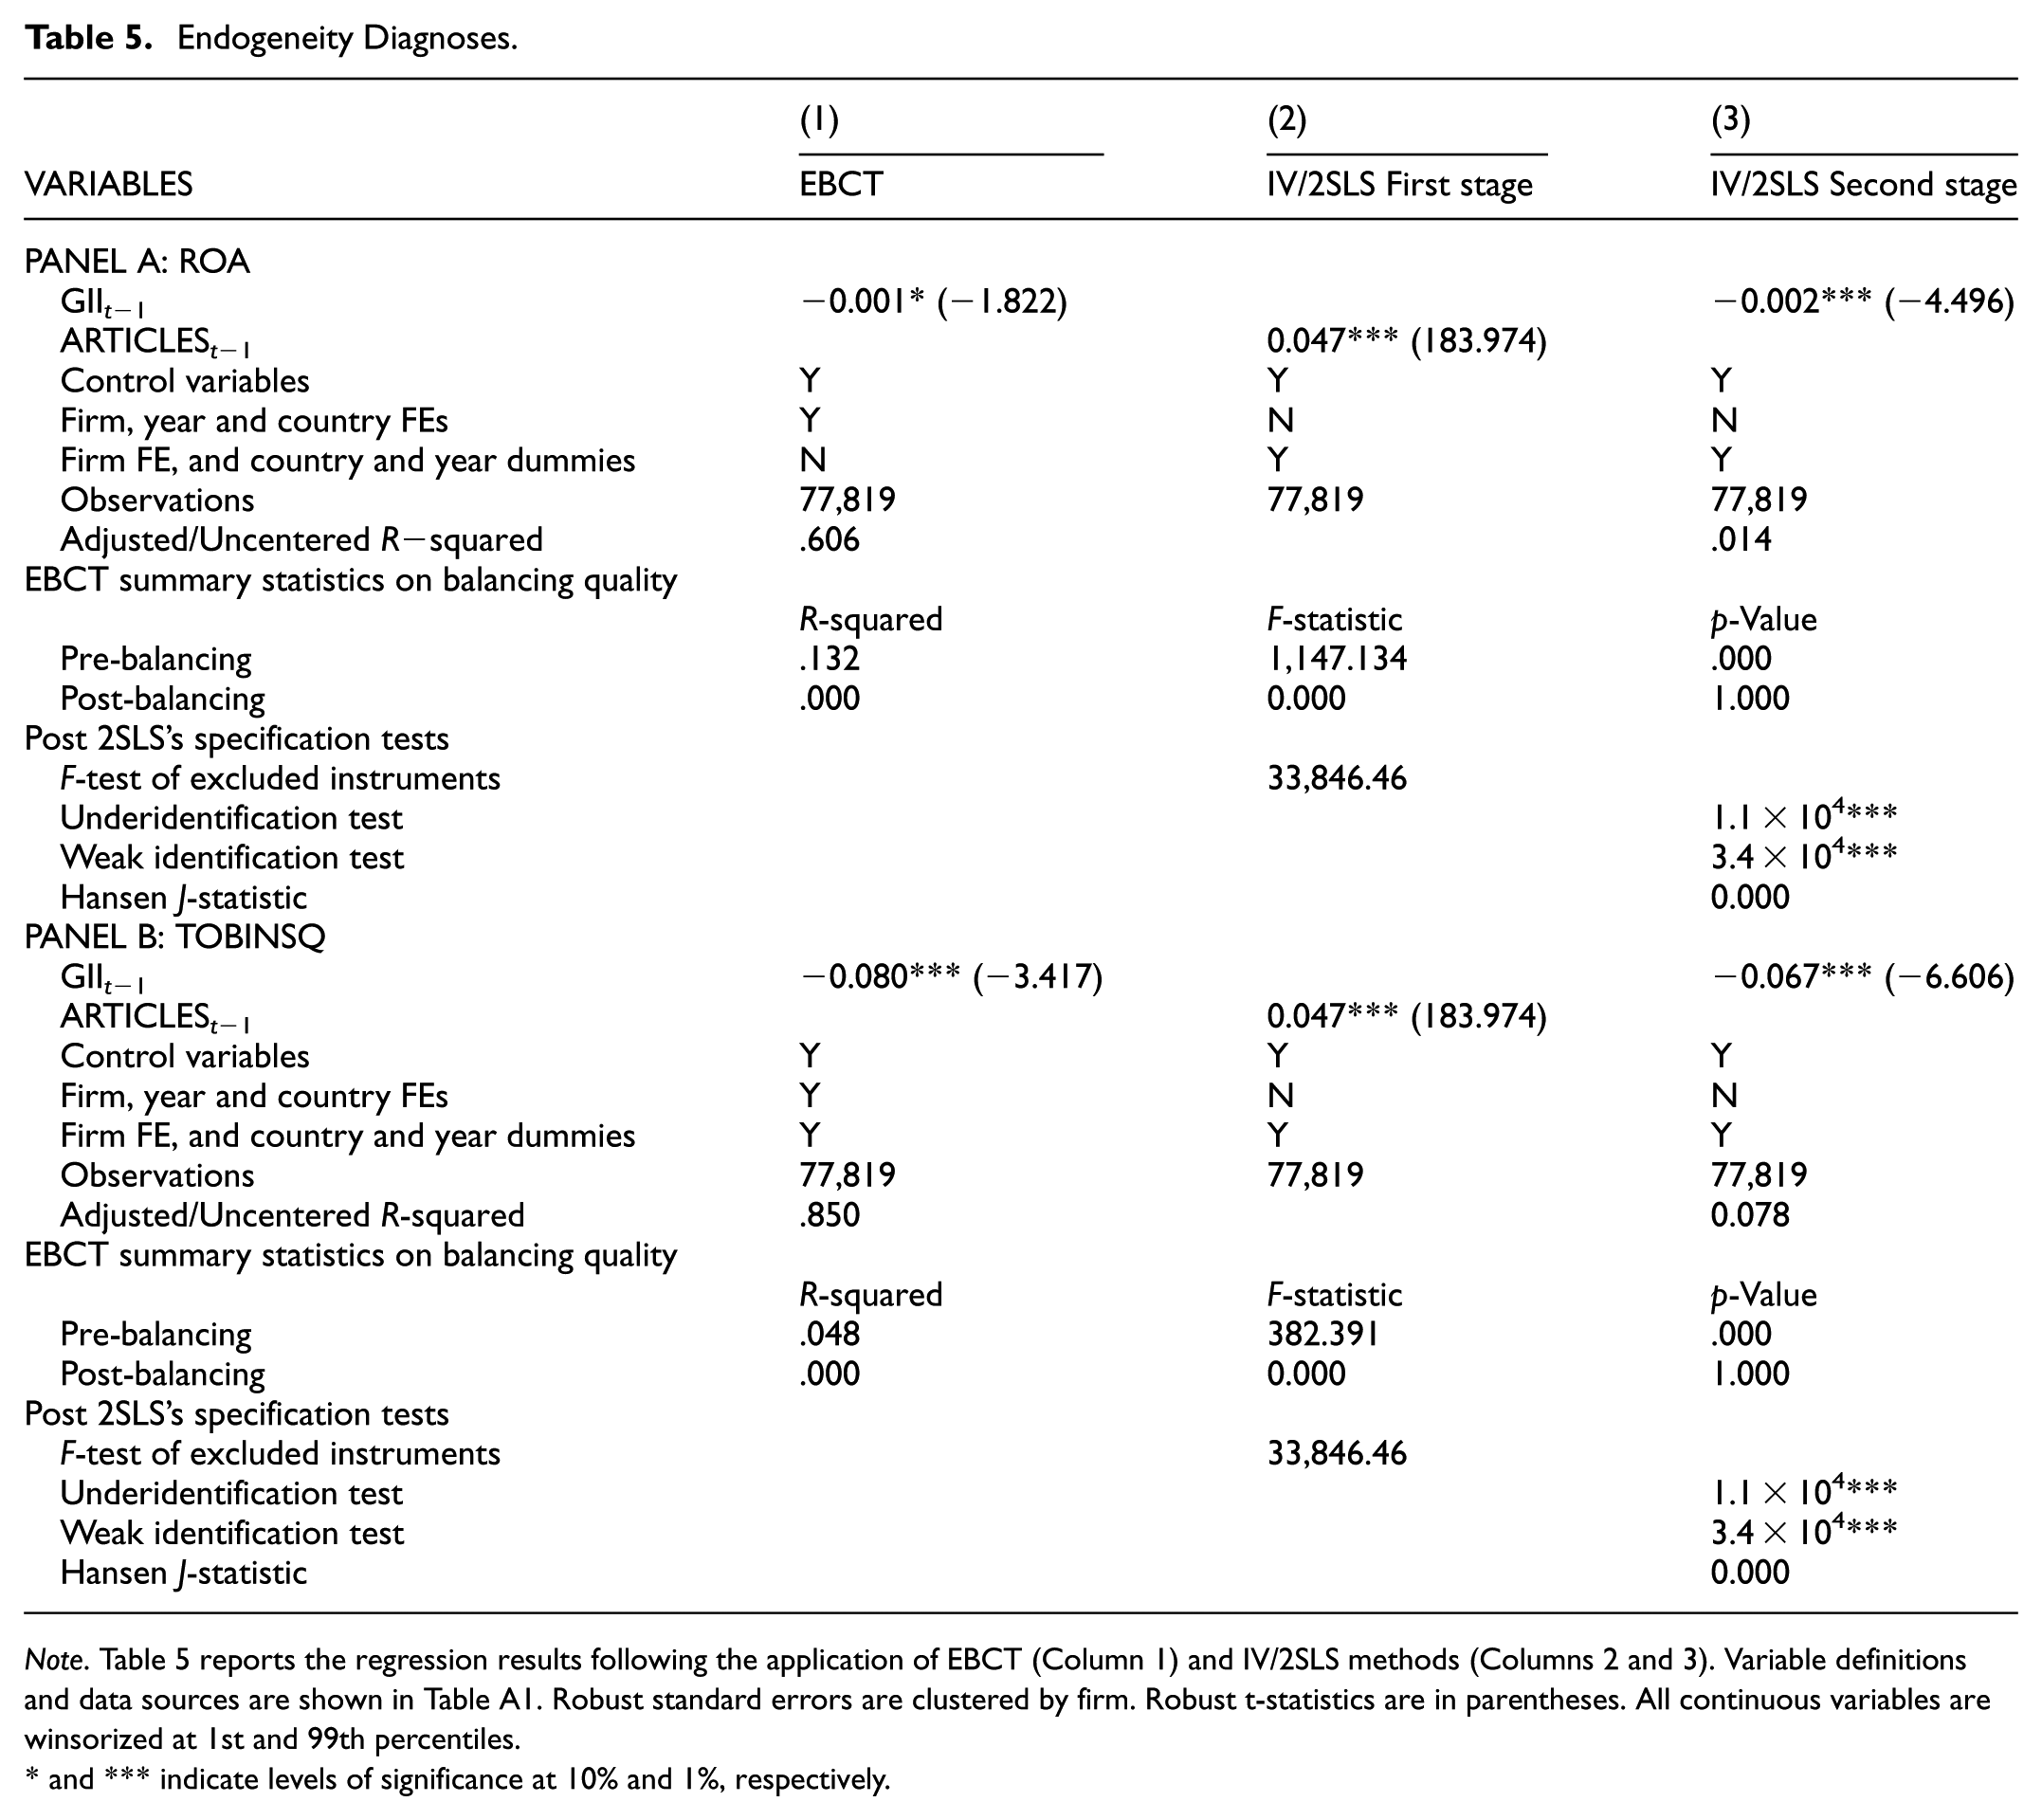
Note. Table 5 reports the regression results following the application of EBCT (Column 1) and IV/2SLS methods (Columns 2 and 3). Variable definitions and data sources are shown in Table A1. Robust standard errors are clustered by firm. Robust t-statistics are in parentheses. All continuous variables are winsorized at 1st and 99th percentiles.
* and *** indicate levels of significance at 10% and 1%, respectively.
Afterward, Model 1 is estimated with the weight generated from the EBCT procedure. The GII’s coefficients are negative and significant at 10% level, thus relieving our concern about reverse causality and lending support to our main finding on the inverse relationship between NIS and firm performance (see Table 5).
Two-Stage Least-Squares
Although firm performance this year logically cannot affect the development of NIS in the preceding year, we exercise additional caution to address this low-chance reverse causality possibility by estimating Model 1 using the two-stage least-squares with an instrumental variable (IV). The IV is expected to be correlated with the endogenous independent variable, but should not be statistically associated with the dependent variable (Hoang, 2025b). In this study, we employ the number of scientific and technical journal articles published in peer-reviewed international journals annually, attributed to the country of the author’s institutional affiliation (ARTICLEt−1) as the instrumental variable. In the literature on national innovative capacity, scientific publications are considered a key component defining a country’s technological capability (Archibugi & Coco, 2004; Furman et al., 2002), implying the close connection between scientific publications and NISs. Yet, it does not directly determine individual firms’ short-term financial performance, except through national innovation channels. Specifically, scientific outputs primarily reflect upstream knowledge creation within universities and research institutions, contributing to the national stock of codified knowledge. Such knowledge does not effectively translate into firm-level performance unless it is effectively transmitted, absorbed, and implemented. In this context, NISs play a critical mediating role by providing the institutional infrastructure, networks, and policy support that enable firms to access and utilize knowledge spillovers. Prior studies support this view. Jaffe (1989) shows that academic research generates localized knowledge spillovers, while Toole (2012) demonstrates that public research investments significantly contribute to the introduction of new drugs in the pharmaceutical industry through early-stage knowledge creation, which subsequently requires downstream institutional and industrial mechanisms to be commercialized. Moreover, the transmission of scientific knowledge to firms typically involves significant lags and intermediary processes that require a strong government innovation-supporting scheme, aligning with the assumption that its direct effect on contemporaneous firm performance is limited. This combination of strong relevance and exogeneity satisfies the standard criteria for an instrumental variable and provides a credible strategy for identifying the causal impact of GII on firm performance. Our post-estimation tests, shown in Table 5’s “Post 2SLS’s specification tests” sections, lend support to our choice of the instrumental variable. First, the model is not underidentified, as indicated by a highly significant Kleibergen–Paap rk LM statistic (1.1 × 10⁴***), confirming that the IV is sufficiently correlated with the endogenous regressor GII. Second, weak-instrument concerns are alleviated since the Kleibergen–Paap rk Wald F-statistic equals 3.4 × 10⁴, far exceeding conventional weak-instrument thresholds. Finally, since ARTICLESt−1 is the only IV employed in this analysis, the model is exactly identified (Hansen J-statistic = 0); hence, overidentification is not a problem in this setting. These pieces of evidence together indicate the validity of ARTICLESt−1 as the IV.
Turning to the estimations, in the first stage, ARTICLEt−1 is positively correlated with GIIt−1, statistically meaning that an increasing proportion of the annual number of articles published by authors from a country is beneficial for NIS development. The first-stage estimation, therefore, supports the idea that scientific output serves as an economically meaningful predictor of NIS development, which is in line with the extant literature on the proximate link between knowledge creation and the development of NISs (Erzurumlu et al., 2022; X. Li et al., 2023).
In the second stage, GIIt−1 inversely influences both ROA and TOBINSQ at the 5% significance level. These results further ratify our finding on the negative NIS – firm performance relationship and provide stronger evidence for a causal negative short-run effect of NIS improvement on firm performance rather than a spurious correlation driven by omitted variables or reverse causality.
Market Development and the Forward-Looking Effect of National Innovation Systems
Another question arising from this finding: Is this impact uniform across the country? Given that each country has a different build of its NIS, assuming the uniformity of firm performance sensitivity to NIS development is illogical. For instance, a country that is struggling to transition to a knowledge-based economy might not have its innovation ecosystem as mature as the first-world countries. We dissect this potential discrepancy by segregating our sample into two country groups based on the MSCI market classification. The first group consists of the markets that are classified as developed markets, while the other groups comprise markets that are assigned to either emerging, frontier, or standalone categories. As can be seen from Panel A of Table 6, the negative effect of GII on ROA only exists in developing countries. We attribute this effect to the fact that firms in less developed markets are less attentive to innovation due to their lack of resources and inadequate regulatory frameworks supporting corporate innovation activities. This negligence also indicates an enormous potential for innovation-driven economic development once more inclusive NISs and generous innovation incentives are introduced. Figure 1 compares the sum of patent applications in developing and developed markets during the period of study, showing that developing markets dominate in this regard. Firms’ profitability, therefore, declines to a greater extent in developing markets. Conversely, with well-built NISs and innovation activities being an integral part of operations, firms in developed markets do not need to adjust their financing decisions as much, thus having milder performance reactions to NIS advancement.
Market Development and the Forward Effect of National Innovation.
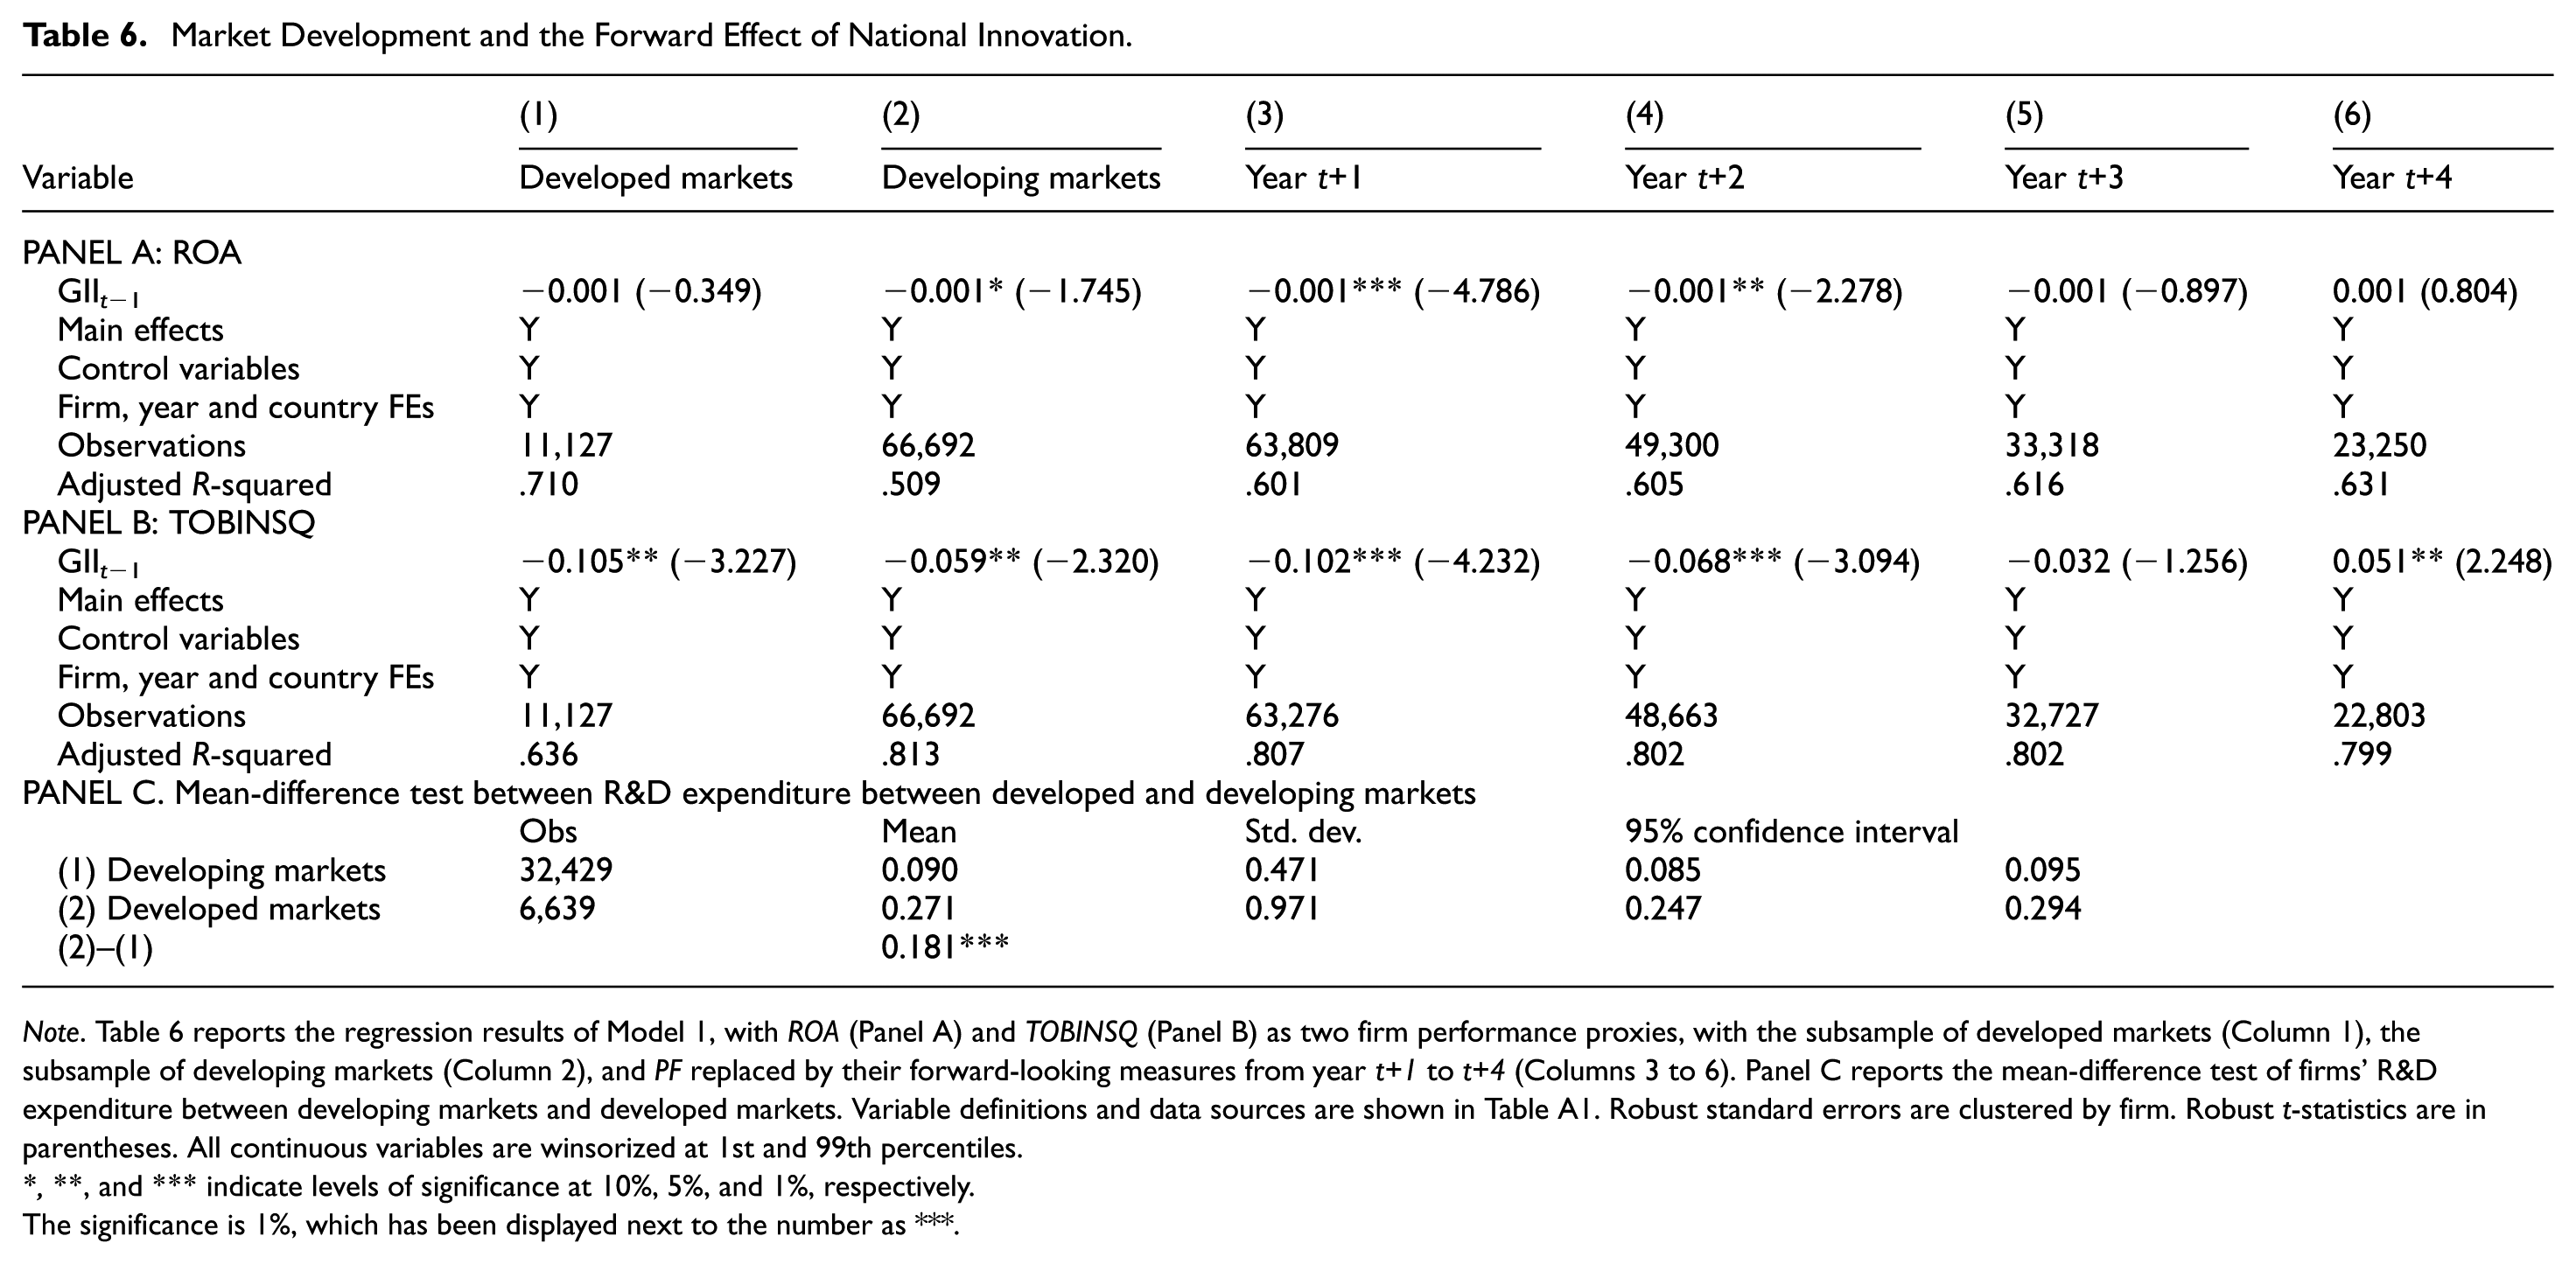
Note. Table 6 reports the regression results of Model 1, with ROA (Panel A) and TOBINSQ (Panel B) as two firm performance proxies, with the subsample of developed markets (Column 1), the subsample of developing markets (Column 2), and PF replaced by their forward-looking measures from year t+1 to t+4 (Columns 3 to 6). Panel C reports the mean-difference test of firms’ R&D expenditure between developing markets and developed markets. Variable definitions and data sources are shown in Table A1. Robust standard errors are clustered by firm. Robust t-statistics are in parentheses. All continuous variables are winsorized at 1st and 99th percentiles.
*, **, and *** indicate levels of significance at 10%, 5%, and 1%, respectively.
The significance is 1%, which has been displayed next to the number as ***.
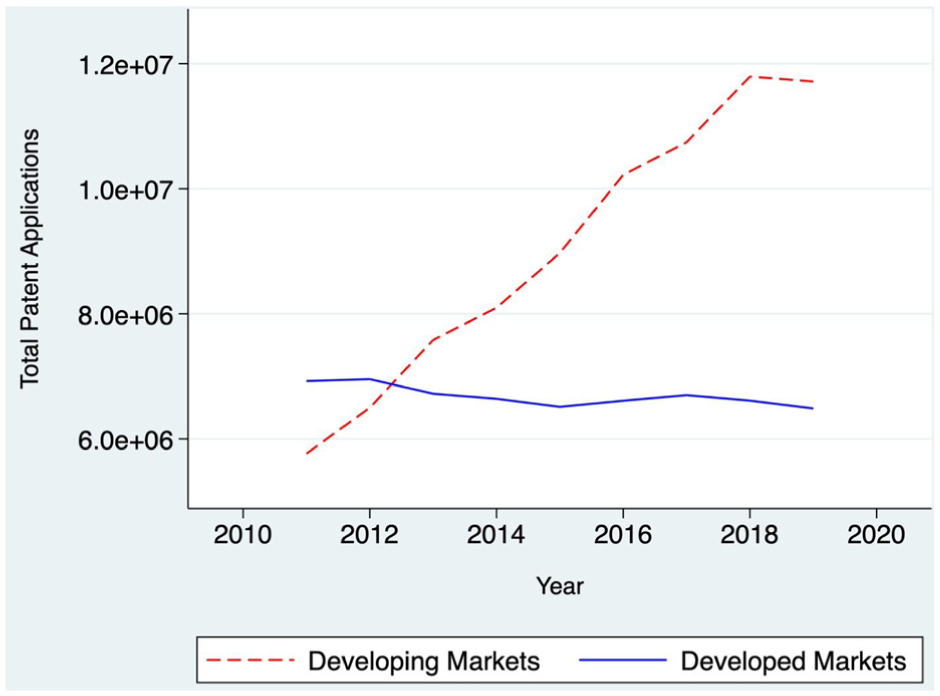
Patent application comparison by years.
Differently, the adverse impact of GII on TOBINSQ is consistent regardless of the level of market development. If reduced performance is a logical reason for lowered Tobin’s Q in developing markets, the negative impact of GII on TOBINSQ in developed markets can be viewed from the cost perspective. As shown in the foot of Table 6, developed markets’ firms spend significantly more than their counterparts in developing markets on R&D, indicating that market participants might have their eyes on immediate costs that cannot be converted into profits immediately. Market devaluation might reflect investors’ concerns about firms’ weaker short-run profitability and return uncertainty since innovation requires persistent investments to build up and maintain competitive advantages (Gu, 2005). Explaining the heterogeneous effect of NISs on firms’ market-based performance, in developed markets with mature NISs, the rapid spread of knowledge and technologies erodes the advantages of early adopters of such advancement. If firms cannot leverage NIS upgrades to earn abnormal profits, market participants may expect lower profits in the future due to the business-stealing effect, leading to a decline in stock valuations (Bloom et al., 2013; Kogan et al., 2017). On the contrary, financial constraints and weaker absorptive capacity, alongside less effective NISs, discourage developing markets’ firms from deeply integrating innovation activities in corporate strategies. As a result, once deciding to innovate, those firms must incur substantial costs associated with initiation, implementation and adjustment frictions, which subsequently depress accounting performance. Meanwhile, valuations co-move more closely with near-term earnings in thinner, noisier information environments (Hail & Leuz, 2006). Consequently, the negative effect on Q in developed markets reflects anticipated rent erosion, whereas in developing markets it primarily tracks realized profitability pressures.
It is important to note that the aforementioned results only capture the short-term effect of NIS, while how long this impact persists has not been inspected. To investigate this, we replace FP with its forward measures in Model 1, then regress the model. The results presented in columns 3 to 6 in Table 6 unveil that the impact of GII on ROA remains in the subsequent 2 years (years t+1 and t+2) and then disappears. In terms of TOBINSQ, the impact even reverses in year t+4, hinting that although the bottom line has not been improved, the market starts to appreciate the innovation endeavors made by firms and willingly factor them into the firm valuation. These results demonstrate that NIS upgrades only slow down firms’ profitability in the short run while potentially casting a desirable effect in the longer horizon, which corroborates the long-term beneficial impact of national innovation on firm performance.
Channel Analysis
Innovation Intensity Channel
If building a comprehensive NIS can unlock the innovation potential of a country by providing a business environment conducive to innovation at multiple levels, the degree to which organizations and individuals commit to promoting innovation plays a vital role in boosting economic development. Israel is a salient example of a contemporary innovation powerhouse that is typically referred to as a “startup nation.” To realize its current success, Israel fuels its innovation through enormous R&D expenditure – considerably one of the largest innovation spenders worldwide (Lemarchand et al., 2016). Furthermore, Israel continuously promotes the entrepreneurial spirit, achieving the highest rate of startups per capita globally with high-tech industries driving 20% of Israel’s economic output (Scheer, 2024). These facts highlight the vital role of fostering innovation in boosting national economic development.
To examine whether the impact of GII transmits via the innovation intensity channel, we employ the natural logarithm of the number of patent applications per annum in each country as a proxy for innovation output. As reported in Table 7, we uncover a weaker firm performance in countries with more patent applications as the coefficients of GIIt−1 × PATENTAPPSt−1 are significantly negative (Columns 1 in Panels A and B, Table 7). These results are in line with our discussion earlier that in response to the government’s efforts to foster NIS, firms are more inclined to engage in innovative activities by leveraging the supporting regulatory framework and infrastructure, resulting in more patent applications. Consequently, both ROA and Tobin’s Q drop since investing in innovation is costly but does not yield immediate profits or guarantee future cash inflows.
Explanatory Channels.
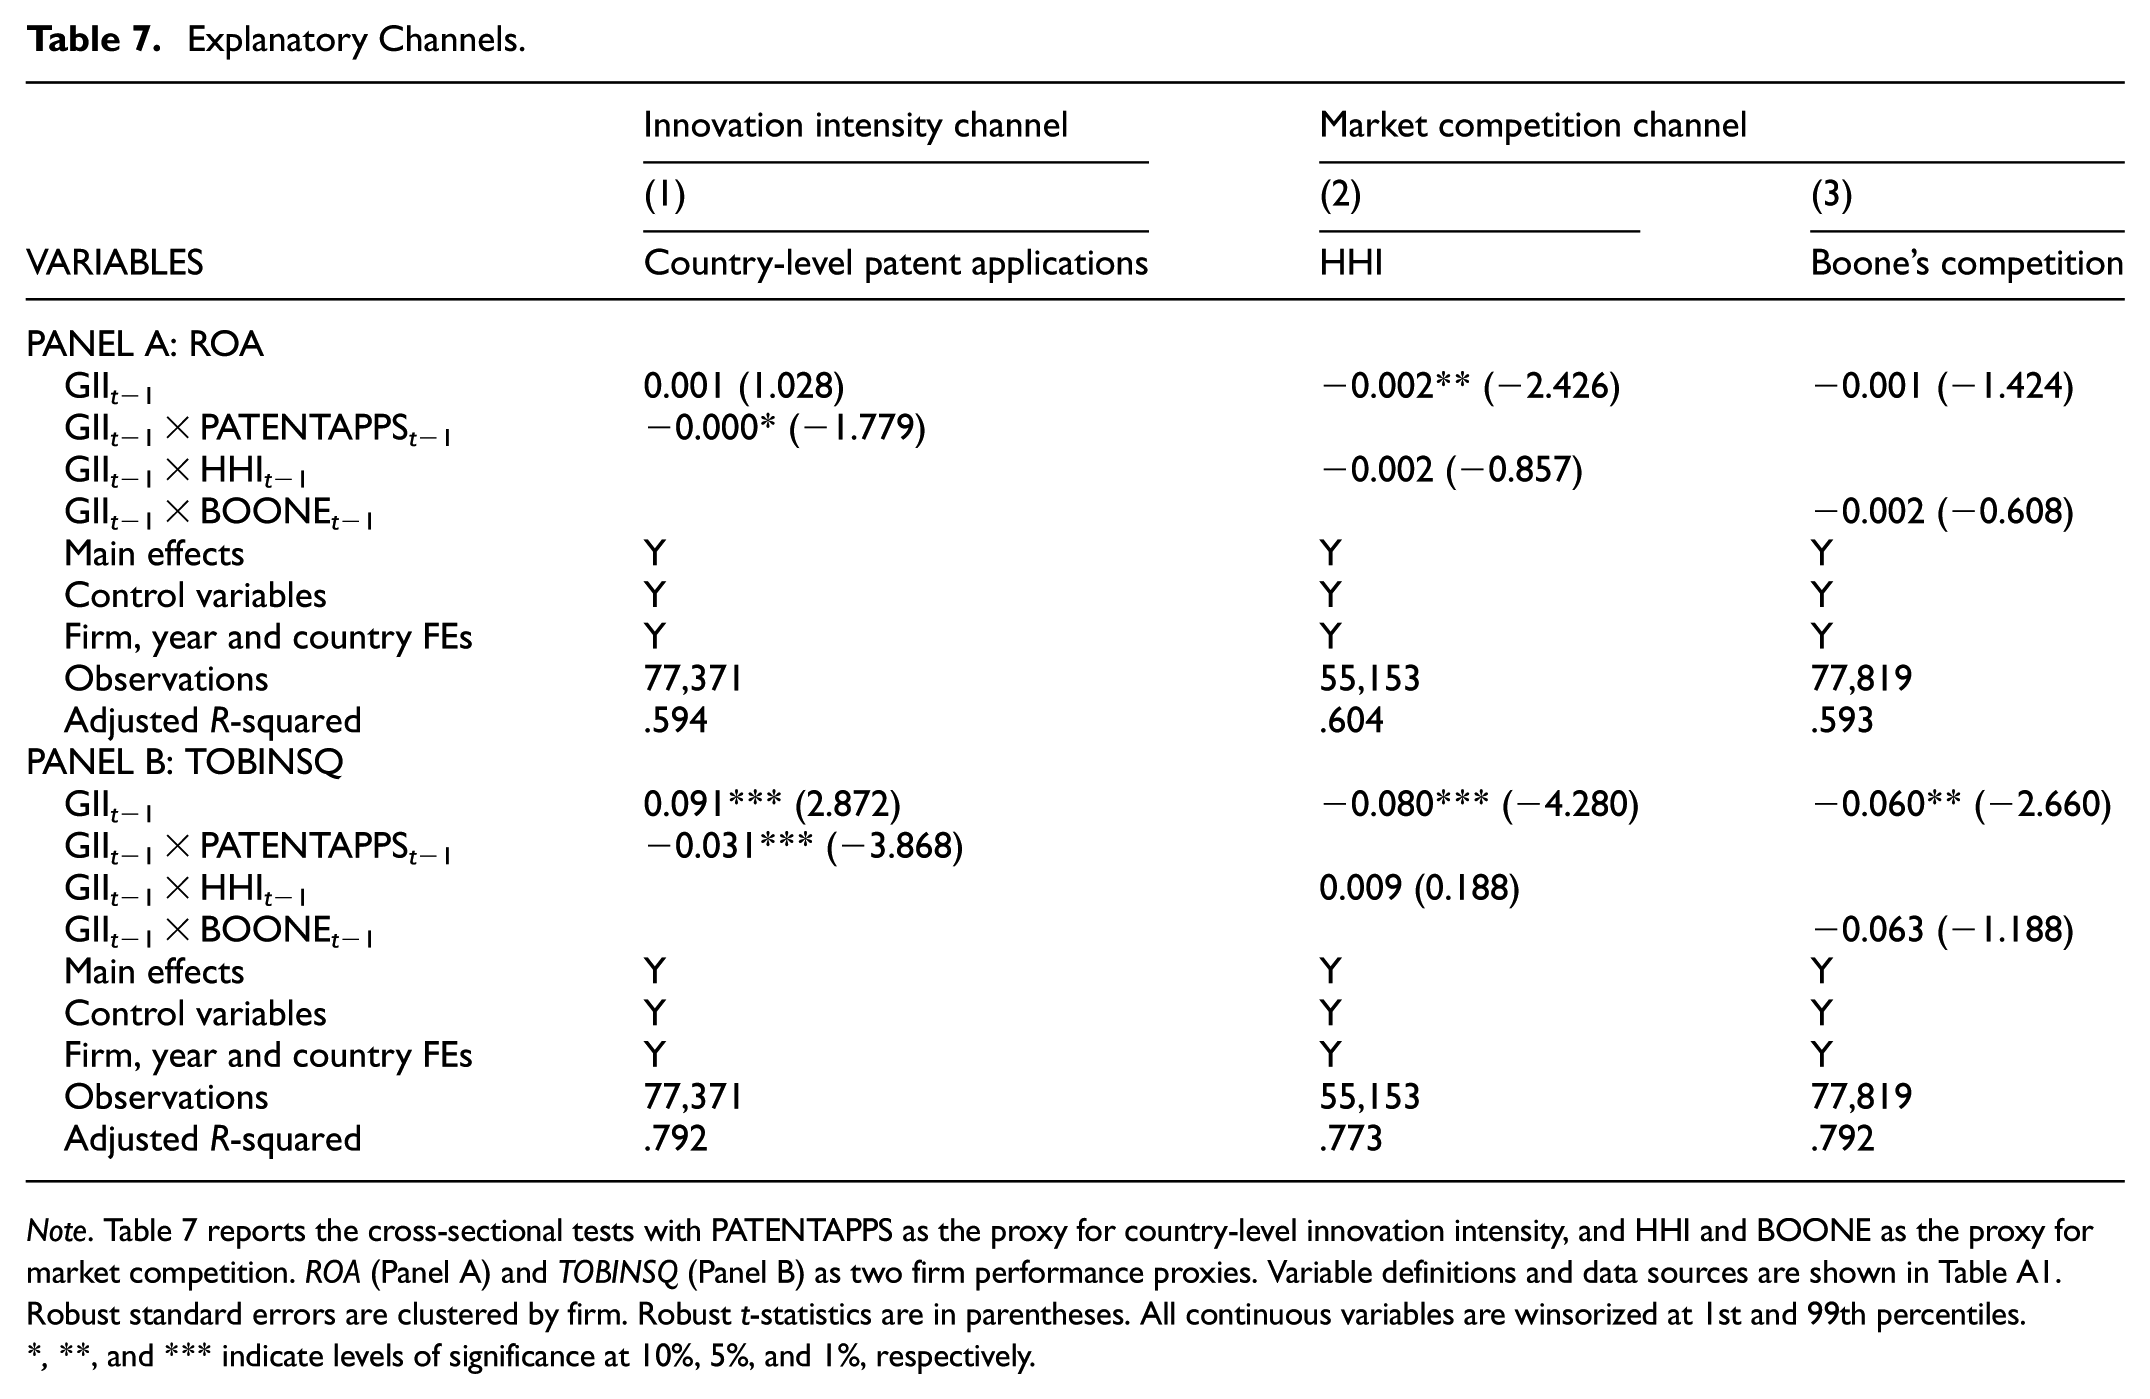
Note. Table 7 reports the cross-sectional tests with PATENTAPPS as the proxy for country-level innovation intensity, and HHI and BOONE as the proxy for market competition. ROA (Panel A) and TOBINSQ (Panel B) as two firm performance proxies. Variable definitions and data sources are shown in Table A1. Robust standard errors are clustered by firm. Robust t-statistics are in parentheses. All continuous variables are winsorized at 1st and 99th percentiles.
*, **, and *** indicate levels of significance at 10%, 5%, and 1%, respectively.
Market Competition
Firm performance might also decline due to an increase in competition within an industry. To capture within-industry competition, we employ two common proxies: the Herfindahl–Hirschman Index (HHI) and the Boone indicator (Boone, 2008; Fosu, 2013). Following Fosu (2013), we measure HHI by summing the squared market shares of each firm in a given industry in a year.

where HHIj,t is the HHI of industry j and year t, and Salesi,j,t is the revenue of firm i of industry j and year t.
Meanwhile, the Boone indicator is built upon the idea that in a highly competitive industry, the punishment for firms being inefficient is more profound (Boone, 2008; Boone et al., 2007). Hence, in such industry, a rise in marginal cost causes a greater reduction in variable profits. The Boone indicator is estimated by the following regression:

in which VROAi,t is the variable profits of firm i in year t; lnMCi,j represents the marginal cost, computed by taking the natural logarithm of a firm’s marginal cost of firm i in industry j year t. In this equation,
Using HHI and BOONE as proxies for industry competition, we find that both HII and BOONE do not play moderating roles in the relationship between GII and PF. Hence, market competition, though is supported by the literature as a potential channel, does not contribute to the explanation of the NIS – firm performance relationship.
Overall, although two feasible channels are hypothesized and empirically tested to explore the relationship between NIS and firm performance, only the innovation intensity channel shows its explanatory power. NIS and its components operate as economy-wide knowledge public assets; thus, although industry rivalry might accelerate the acquisition of new knowledge and technology, the impact of NIS on firms depends more on absorptive capacity and the ability to capture value through complementary assets (Castellacci & Natera, 2013; Cohen & Levinthal, 1990). Empirical evidence from our analysis documents that the primary NIS pathway to firm performance is through fostering innovation outputs – particularly patent applications, whereas the industry competitiveness channel is muted. The insignificant industry competitiveness channel indicates that innovation-driven competition may operate through more dynamic and less observable channels. NISs often stimulate technology-based rivalry/collaboration as well as knowledge spillovers, and are therefore more likely to shape firms’ competitive positions through capability accumulation than immediate price or market share adjustments. As a result, the competitive pressures induced by stronger NISs may not be adequately reflected in traditional industry competition measures, such as market structure and price pressure as specified in Boone (2008) and Fosu (2013). This suggests that innovation-led competition is likely to be multidimensional, involving both rivalry and cooperation, and may require alternative metrics that better capture knowledge-based and network-oriented competitive dynamics. Exploring such measures represents a promising direction for future research. We, therefore, cautiously interpret that the impact of NISs is channeled via innovation intensity while remaining neutral about the market competition channel.
Conclusions
This study explores the impact of NIS on firm performance in a sample of 16,228 listed firms in a cross-country setting and documents a performance-decreasing effect of NIS. This impact is majorly attributed to (a) enhanced infrastructure that improves firms’ access to innovation-supporting facilities and (b) rising creative outputs, reflecting firms’ tendency to invest in innovative technologies and products. In addition, the impact is found to be more profound in developing markets. This performance-adverse effect, however, disappears after 3 years, in which Tobin’s Q sees a rise after 5 years. Rising innovation intensity, as a result of governments’ elevated efforts to endorse increasing innovation support, is identified as an explanatory channel for the examined relationship as firms reallocate their capital more heavily to innovation expenditure.
Some helpful implications can be drawn from this study’s findings. First, given that improvements in NISs have a dampening effect on short-term firm performance, governments must implement innovation-supporting policies with caution. While enhancing physical and financial support mechanisms is crucial, such efforts should be complemented by targeted innovation education programs to guide firms toward sustainable and strategic innovation practices. This integrated approach can improve the success rate of innovation projects, ultimately strengthening domestic firms. The need for such structured support is particularly pressing in underdeveloped economies, where gaps in innovation-related knowledge, technical skills, and regulatory frameworks remain significant barriers to progress.
Second, at the current stage, infrastructure and creative outputs emerge as key innovation pillars that intensify firms’ pursuit of innovation projects. Policymakers should prioritize enhancing innovation-supporting infrastructure to reinforce innovation incentives and cultivate a dynamic corporate innovation culture. Moreover, being an output pillar of innovation, creative outputs can push within-industry competition and induce firms to compete by means of innovation rather than price-based strategies. To ensure that such competition remains a catalyst for sustained competitiveness, policymakers must reinforce legal protections for innovation. Strengthening intellectual property rights and enforcement mechanisms can mitigate the risk of unlicensed imitation, thereby compelling firms to engage in genuine, innovation-driven competition.
Third, policymakers must strike a balance between short-term losses and long-term gains given the inverse relationship between innovation outputs (particularly patent applications) and firm performance. Designing effective innovation-supporting programs requires careful calibration – not only to stimulate the introduction of new innovation outputs into the economy but also to prevent firms from overhyping innovation and engaging in unstructured, rushed innovation efforts. Without careful planning, firms may face increased financial vulnerabilities, particularly when innovation attempts fail. A well-balanced policy approach should ensure that innovation incentives drive sustainable firm growth rather than exposing firms to excessive risk and instability.
This study is not without limitations. The use of GII as a proxy for NIS may fail to capture the fact that the innovation environment is not uniform across a country; thus, observed correlations may be partially driven by unobserved within-country variation rather than cross-country differences alone. In addition, the GII itself is subject to two key critiques: (a) consistently favor high-income economies across editions, suggesting that results may reflect income-level effects more than innovation capacity; and (b) a non-trivial share of its indicators are drawn from World Economic Forum’s Executive Opinion Survey and Global Entrepreneurship Monitor’s National Expert Survey, which are heavily perception-based (World Intellectual Property Organization, 2024). This approach can introduce cross-country comparability and reporting-bias concerns. These constraints highlight the need for caution in interpreting our findings and point to the value of future research developing NIS indices with greater emphasis on local innovation environments.
Another caveat in our approach arises from the lack of industry competition measures that can embed the degree of innovation across industry firms. This shortcoming reduces our confidence in giving a resolute conclusion of this channel. Greater insight into this channel can be achieved if future research can reasonably develop an innovation-based competition measure at the industry level. Our limitations also lie in the shortage of data, leading to a lack of control variables for firm-level innovation in the research model. Being able to capture those corporate innovation traits can yield more reliable results and add substantially to the NIS literature. Limited data on firm-level R&D expenditure also prevents us from further developing the innovation intensity channel by extending the innovation intensity analysis to the firm level. We leave that shortcoming for future studies.
Finally, it is important to recognize that the global innovation landscape has changed markedly since 2019. The COVID-19 pandemic accelerated digitalization and remote collaboration, the AI boom has transformed both research and commercial innovation trajectories, and geopolitical realignments have reshaped global supply chains and technology policies. While our data predate these developments to preserve internal validity, this limits the external validity of our estimates when applied to today’s rapidly evolving context. In particular, recent developments may alter both the intensity and timing of innovation-related costs and benefits at the firm level. On the one hand, advances in digital infrastructure and AI technologies could shorten the lag between innovation investment and observable performance outcomes. On the other hand, heightened uncertainty and intensified global competition may amplify short-term pressures on firms, reinforcing or even strengthening the cost-related mechanisms identified in this study. Accordingly, while the underlying relationships documented here are likely to remain relevant, their magnitude and temporal dynamics may differ in the contemporary context. We, therefore, view the post-2019 transformation of innovation ecosystems as a compelling avenue for future research, in which the interplay of NISs and firm performance can be re-examined in light of these structural shifts.
Footnotes
Appendix A1
Appendix A2
Appendix A3
Acknowledgements
This research is funded by National Economics University, Vietnam.
Ethical Considerations
There are no human participants in this article and informed consent is not required.
Funding
The authors disclosed receipt of the following financial support for the research, authorship, and/or publication of this article: This research is funded by National Economics University, Vietnam.
Declaration of Conflicting Interests
The authors declared no potential conflicts of interest with respect to the research, authorship, and/or publication of this article.
Data Availability Statement
The data that support the findings of this study are available from multiple studies and subscription databases. Restrictions apply to the availability of subscription data, which were used under license for this study. Data retrieved from other sources can be downloaded directly from the websites and requested from the original authors. The subscription data (Refinitiv) are available from the authors with the permission of Thomson Reuters Corporation.