
Abstract
Oligonucleotide therapeutics are emerging as a promising modality for targeting disease-associated RNAs. Phosphorothioate (PS)-containing oligonucleotides have gained prominence due to their enhanced stability and pharmacodynamic properties. However, current manufacturing practices afford a mixture of Rp and Sp stereoisomers, and this distribution has been linked to changes in product efficacy. Understanding the sensitivity of analytical methods to changes in this quality attribute has therefore become critically important. Here, we used a suite of analytical techniques—ultraviolet (UV) thermal denaturation, circular dichroism (CD), and nuclear magnetic resonance (NMR) spectroscopy—to evaluate the PS diastereomer distribution using Tegsedi, a Food and Drug Administration-approved PS-containing antisense oligonucleotide, and with other synthetic inotersen samples having varied PS diastereomer distributions. While UV and CD techniques showed limited sensitivity, NMR excelled in detecting small changes in the PS diastereomer distribution. The univariate metric of 31P integration was shown to be insufficient for this quality metric evaluation; application of principal component analysis to both 1D 31P and 2D 1H,13C spectra revealed distinct PS changes that arose from the different activators used during manufacturing. This comprehensive evaluation highlights the necessity of advanced analytical techniques in ensuring the quality and consistency of PS-containing oligonucleotide therapeutics.
Keywords
Introduction
Oligonucleotide therapeutics represent an emerging class of therapeutics that are comprised of short RNA sequences to target disease-associated mRNA and noncoding RNAs, triggering their degradation.1–3 Their facile sequence design and high specificity for disease targets highlight their utility as a promising therapeutic modality.4,5 To date, over 20 oligonucleotide therapeutics, including short-interfering RNA, antisense oligonucleotide (ASO), and aptamer drugs, have been approved by the Food and Drug Administration (FDA) and/or European Medicines Agency,6,7 with hundreds in phase I–III clinical trials. 8 They can target previously undruggable protein targets as well as rare genetic disorders4,6,9 and greatly expand the repertoire of diseases that can be potentially treated. Understanding their biochemical and biophysical properties is the key to rational design of these therapeutics.5,10
Native nucleic acids are chemically modified to serve as therapeutic molecules.11,12 Phosphorothioate (PS), in which one of the nonbridging oxygen atoms on the phosphodiester is replaced with a sulfur, is a commonly utilized modification. While PS confers resistance of oligonucleotides to nucleases and imparts favorable pharmacodynamic properties, 13 it makes the phosphorous a chiral center, introducing Rp and Sp diastereomers at each PS linkage. Numerous studies have shown that the PS stereochemistry can affect the stability and protein interactions of these oligos,13–23 consequently impacting their therapeutic potential and making the PS diastereomer distribution an important drug quality attribute. These studies highlight the importance of controlling and assessing PS diastereomer composition during drug development and manufacturing.
Despite wide implementation of the PS modification for the oligonucleotide therapeutic platform, methods to characterize PS diastereomer distribution are not yet fully developed.8,24–26 The current goal for the field is to obtain quantitative and robust measures of the overall diastereomer distribution to evaluate the consistency between various batches of the drug substance and for the evaluation of future generic products.
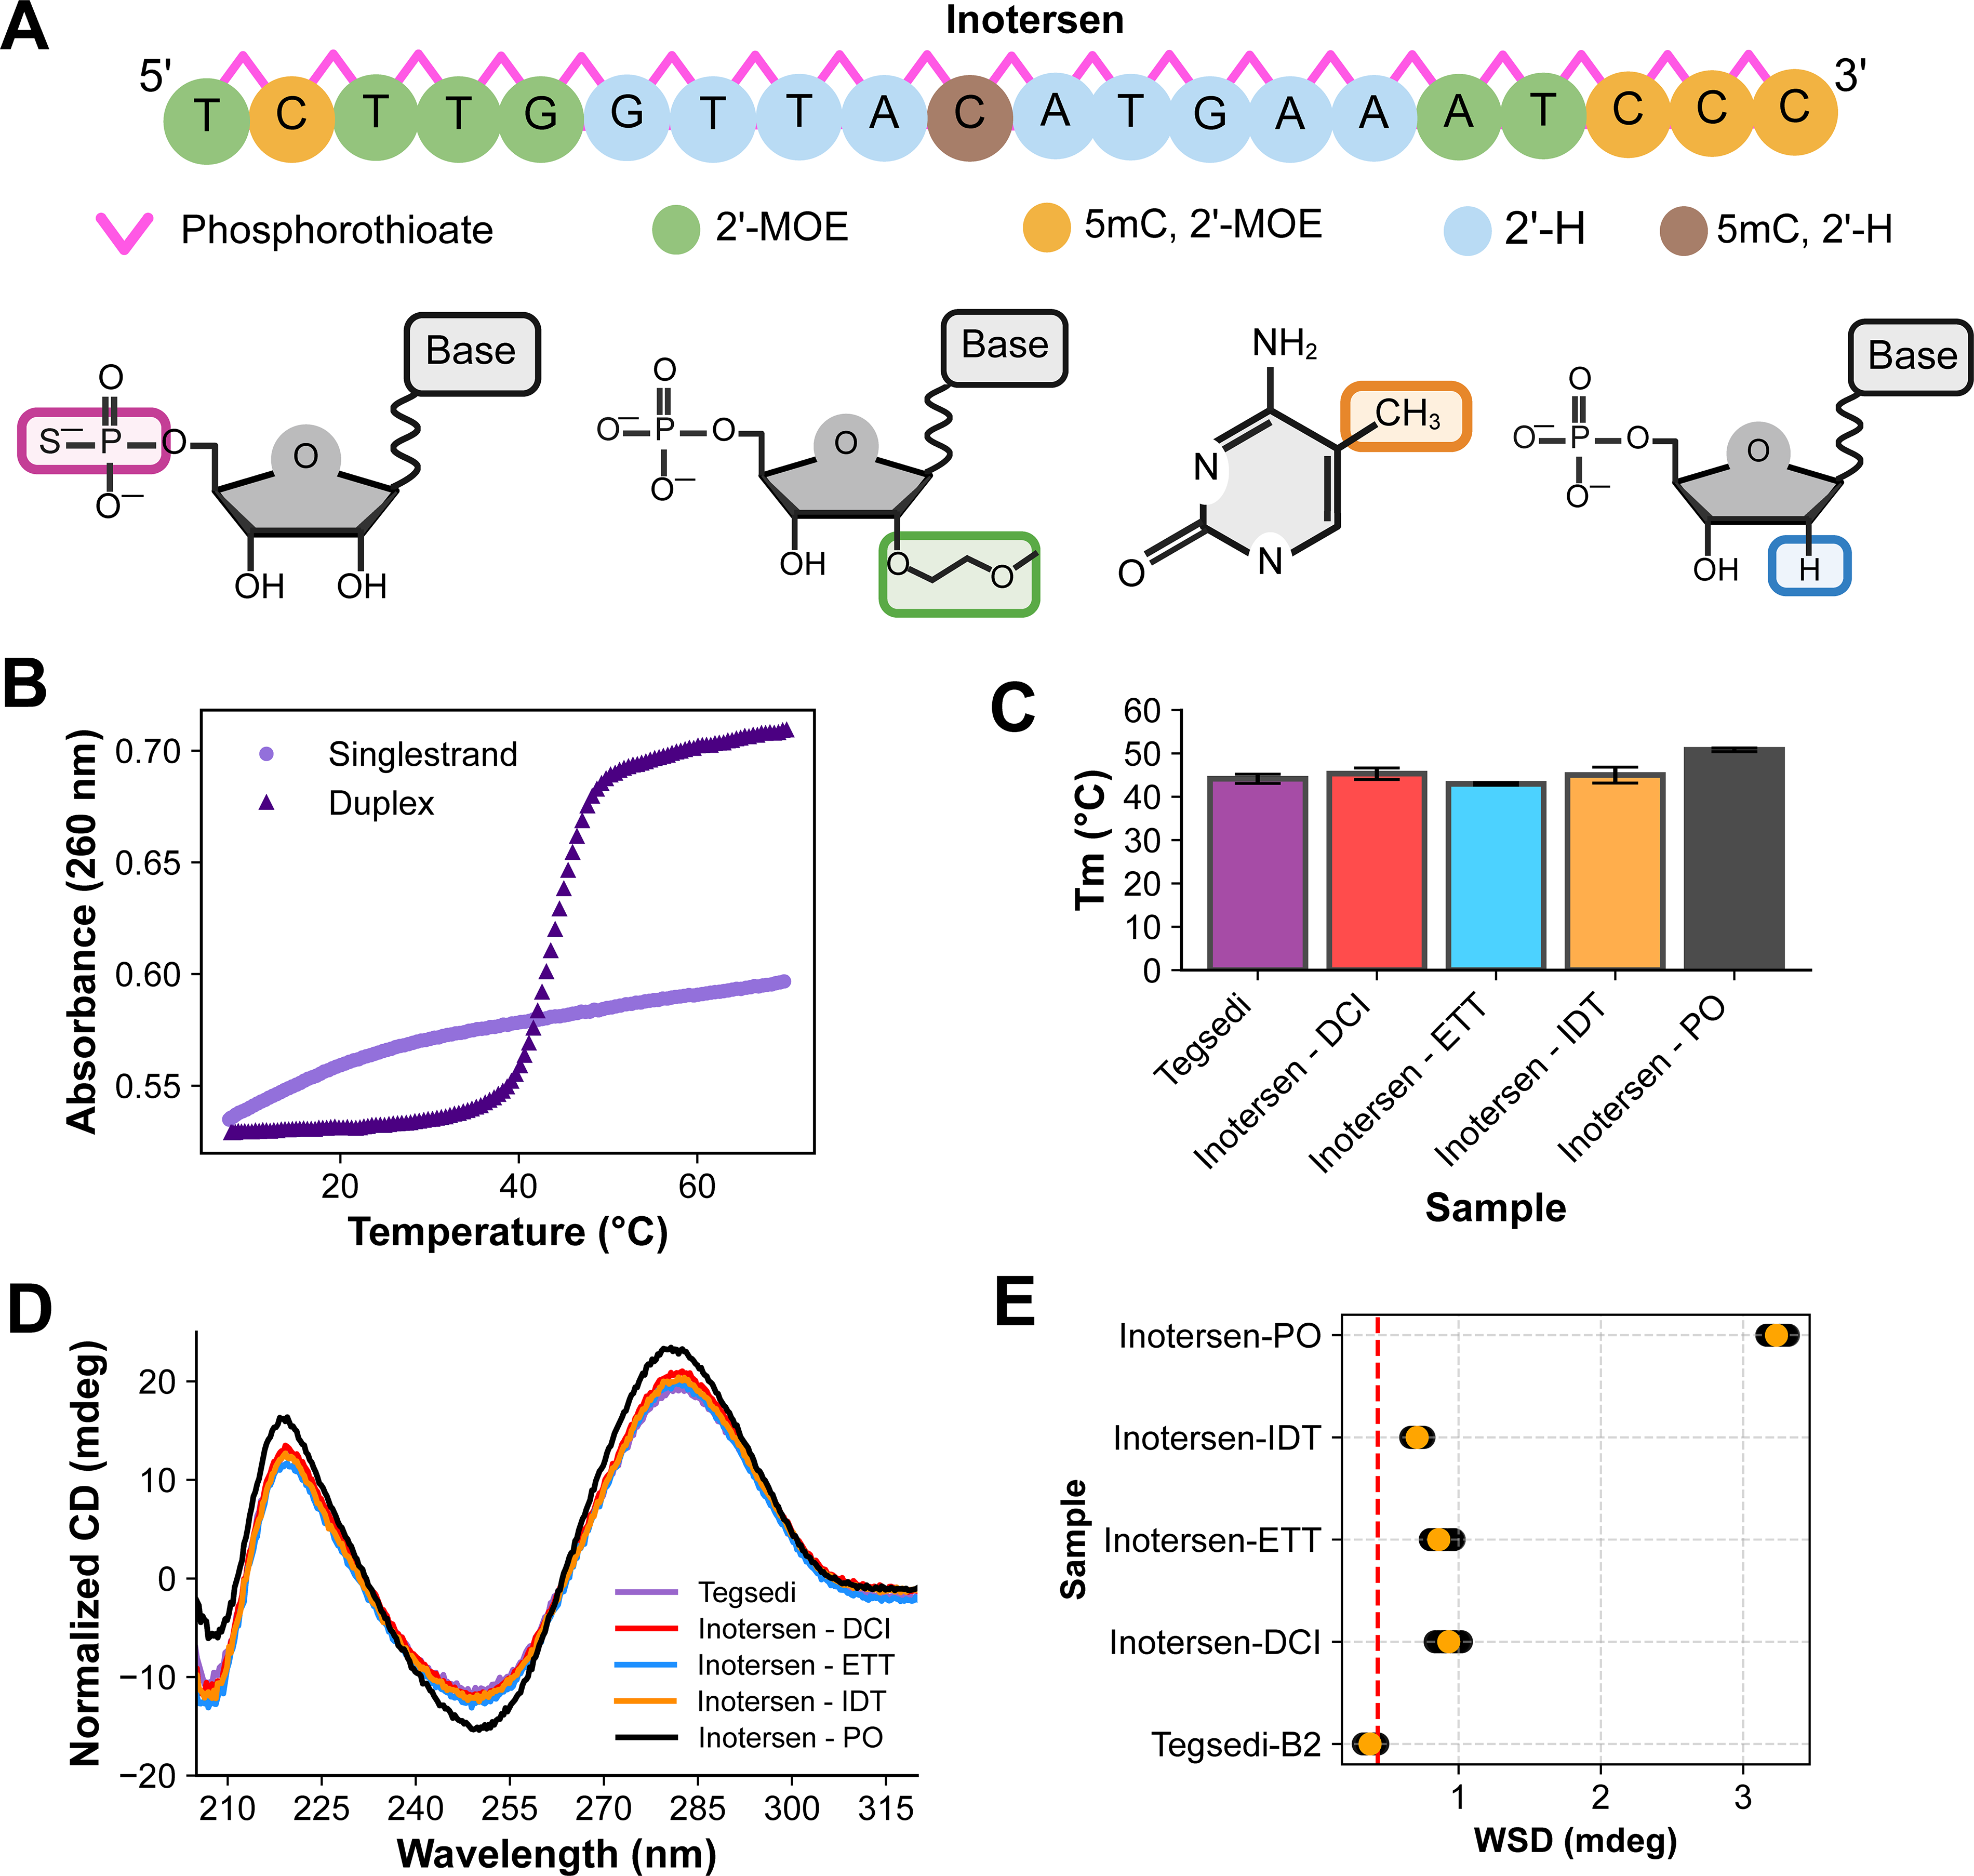
Here we present an in-depth analytical characterization for PS-modified ASOs using three lots of the FDA-approved Tegsedi (inotersen) as the reference listed drug product (RLD, Fig. 1A). As the stereochemistry is introduced during the coupling step of the synthesis cycle and is affected by the choice of activation reagent, three lots each of inotersen were custom synthesized with either ETT [5-(ethylthio)-1H-tetrazole] or DCI (4,5-dicyanoimidazole) activation reagents. Herein, these samples are called inotersen-ETT and inotersen-DCI, respectively, in this study. DCI is known to produce a major Sp product (60%), whereas ETT results in an Rp major product (70%). 26 Two other samples were also manufactured as controls, an inotersen with an unknown activator from a second vendor (inotersen-IDT) and an inotersen with a native phosphate backbone (inotersen-PO). These synthetic inotersen samples were compared with the commercially available RLD Tegsedi, whose activator is proprietary.
Biophysical characterization of inotersen.
A suite of analytical techniques—ultraviolet (UV) thermal denaturation, circular dichroism (CD), 1D 31P nuclear magnetic resonance (NMR) spectroscopy, and 2D 1H,13C NMR—were used to evaluate the PS distribution of Tegsedi and custom inotersen sample series. Our analysis revealed that UV thermal denaturation and CD spectra have limited sensitivity to the overall PS diastereomer distribution, whereas 1D 31P NMR is the most sensitive to the overall PS diastereomer distribution. The sugar and nucleobase moieties also sensed PS stereochemistry. Taken together, our results suggest that NMR spectra of PS stereoisomer distribution need to be analyzed using multivariate metrics such as principal component analysis (PCA).
Materials and Methods
Oligonucleotide samples
The primary sequences, vendors, and synthesis activators for oligonucleotides used in this study are shown in Table 1, where * represents a PS linkage, and
Primary Sequence and Synthesis Information for Oligonucleotides
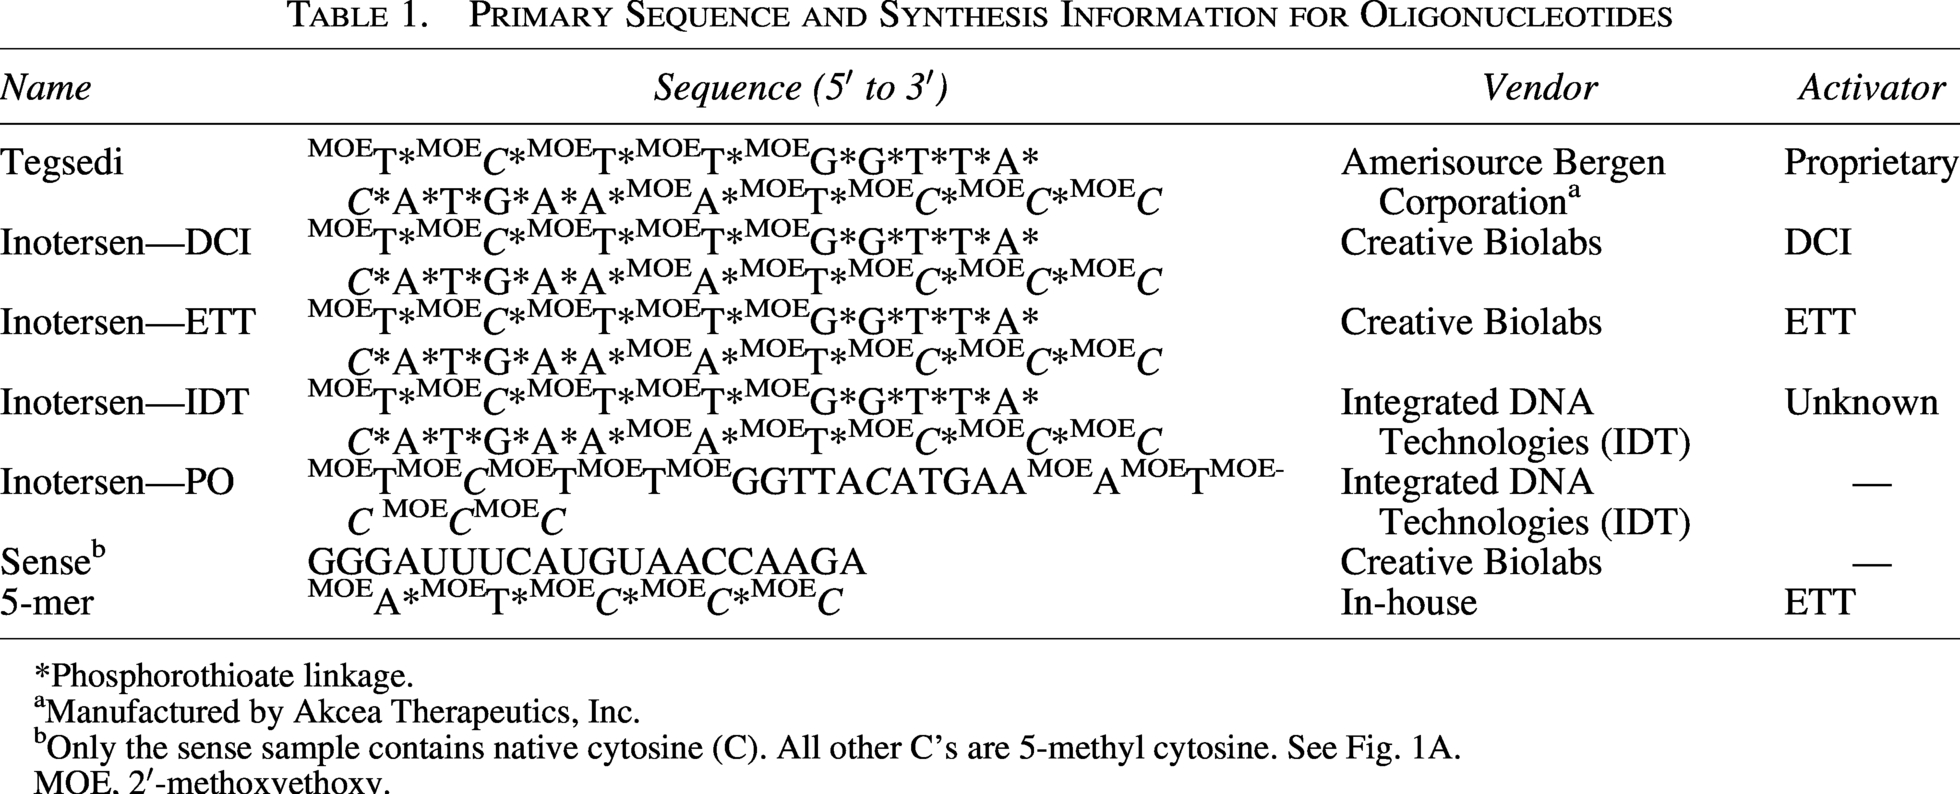
*Phosphorothioate linkage.
Manufactured by Akcea Therapeutics, Inc.
Only the sense sample contains native cytosine (C). All other C’s are 5-methyl cytosine. See Fig. 1A.
MOE, 2′-methoxyethoxy.
The 5-mer sequence was synthesized in-house with ETT, 2′-methoxyethoxy (MOE) modifications, and contained cytosine, thymine, and adenosine bases. The in-house sequences were synthesized using an H-6 DNA/RNA synthesizer (K&A Labs GMBH, Schaafheim, Germany) following standard phosphoramidite solid-phase chemical synthesis. Supplies and chemicals for the oligonucleotide synthesis were purchased from Glen Research (Sterling, VA, USA). Nuclease-free water (0.2 μm filtered) from Thermo Fisher Scientific (Waltman, MA, USA) was used to reconstitute the 5-mer sequence.
Sample preparation
Single-stranded oligonucleotides were dissolved in water and then buffer exchanged to 10 mM Tris-d11, pH 7.85, using Amicon centrifugal filters (Millipore Sigma) with a cutoff of 3 kDa at least four times at 4,000g and 4°C.
Annealing
Equimolar amounts of PS antisense strands (Tegsedi, inotersen-DCI, inotersen-ETT, inotersen-IDT, and inotersen-PO) and sense strands were mixed and incubated at 95°C for 2 to 3 min, followed by slow cooling to room temperature for 1 h.
UV thermal denaturation
UV thermal denaturation was carried out in a V730 instrument (Jasco Inc, Easton, MD) using 1°C min−1 temperature ramp rate. The absorbance at 260 nm (A260) was recorded every 0.5°C. Duplex measurements were carried out at 1.5 µM, whereas single-strand measurements were carried out at 3.0 µM. The first derivative of A260 with respect to temperature was smoothed using the Savitzky–Golay filter,
27
with a window size of 21 and a second-degree polynomial. The first 20 data points were eliminated from the dA/dT curve due to discontinuity in the derivative. The A260 was fit to the Van’t Hoff Equations (1–3) using a python script (adapted from Rangadurai et al.
28
) to extract the melting temperature (Tm), as described by Rangadurai et al.
28


The Tm measurements were run in triplicate for each sample, and the Tm values averaged. The Tm for three batches of Tegsedi, inotersen-DCI, and inotersen-ETT were further averaged (Fig. 1C). Standard deviation in the Tm of the batches, assuming degree of freedom of 1, is reported as the error bar. For inotersen-IDT and inotersen-PO, the average from three measurement replicates is reported in Fig. 1C, whereas the standard deviation in the Tm of the batches, assuming degree of freedom of 1, is reported as the error bar. The statistical significance of differences in average Tm of samples was assessed using two-sided Welch’s t-test with a statistical threshold of 0.05 and implemented in python using scipy.stats.ttest_ind().
CD spectroscopy
Single-strand samples were prepared at 3 µM in 10 mM Tris, pH 7.85, 5% D2O, and 150 µM sodium trimethylsilyl-propanesulfonate (DSS-d6) buffer. CD spectra were collected on a Chirascan instrument (Applied Photophysics, Charlotte, NC) using the same cuvette for all samples and recording all spectra within a few hours to ensure lamp consistency. Data were measured ranging 200–320 nm; however, 200–205 nm data were eliminated from analysis due to high noise. Data were recorded every 0.3 nm and measured in quintuplicates. The raw ellipticity values (mdeg) were normalized with the absorbance at 260 nm measured on the same instrument to account for slight variation in sample concentration (Fig. 1D). Data were measured for inotersen–DCI (B2), inotersen–ETT (B1), inotersen–IDT, inotersen–PO, and Tegsedi (B2).
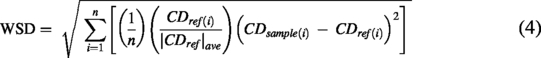
The weighted spectral difference (WSD) for each replicate of each inotersen sample was calculated using Equation 4 with Tegsedi as the reference, resulting in 25 individual WSD values for each sample. Data recorded from 205 to 320 nm were used for WSD analysis. Tegsedi replicates were compared with each other, avoiding self-comparison to yield 20 WSD values. The 95% confidence threshold was computed with the average + 2× standard deviation (red dashed line in Fig. 1E) from Tegsedi to inotersen samples.
Tegsedi and inotersen single-stranded samples (500 µM) were prepared in 10 mM Tris-d11, pH 7.85, and supplemented with 5% D2O and 150 µM DSS-d6 to a final volume of 320 µL for NMR data acquisition. 1D 31P NMR spectra were collected on a 600 MHz JEOL JNM-ECZ600R spectrometer (Peabody, MA) equipped with an HFX ROYAL probe with proton decoupling during acquisition. Spectra were collected at 25°C. Four technical measurement replicates were collected for each sample (Tegsedi batches 1–3 and syringes 1–4, inotersen-IDT as well as inotersen-DCI and -ETT batches 1–3). A relaxation delay of 3 s and acquisition time of 0.3 s were utilized. A total of 4,096 scans for each replicate were collected. The 31P transmitter frequency was set to 57 ppm with a sweep width of 20 ppm. The data were processed using the JEOL DELTA 6.2 software (Peabody, MA), 3 Hz line broadening, and third-order polynomial baseline correction. Rp PS area was integrated from 59.6 to 56.7 ppm, whereas Sp PS area was integrated from 54.0 to 56.7 ppm. Rp abundance was defined as the proportion of Rp PS area relative to the total PS area as defined in the following equation:

The data were exported in ASCII format and plotted using an in-house python script, which normalizes each spectrum to the highest peak intensity in that spectrum, effectively putting all spectra on the same scale (0–1). The PS region (54–60 ppm) was extracted and plotted.
PCA of 31P NMR data
Internally normalized 31P NMR data were mean centered. PCA was performed using single-value decomposition using an in-house MATLAB script. PC scores and loadings were extracted and plotted using an in-house python script.
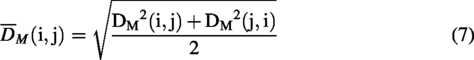
For Mahalanobis distance and silhouette value calculation, clusters were manually defined based on visual inspection of the PCA score plot—all Tegsedi batches were defined as the reference cluster, whereas all inotersen sample batches were assumed to be distinct clusters, yielding a total of eight clusters. As the Mahalanobis distance measures the distance of a point from a distribution, the centroid of one cluster was considered a point and the other clusters a distribution and vice versa. For each pair, the two distances were averaged to make the Mahalanobis distance matrix symmetric. Mahalanobis distance was calculated using the mahal() function in MATLAB, using the covariance matrix of the PC scores for the cluster considered the distribution in each pair. Mahalanobis distance is defined in the following equation:

The silhouette value for each NMR spectrum for each sample was computed as in Equation (8) with the silhouette() function in MATLAB, using Euclidean distances.
2D 1H,13C HSQC spectra were measured on a Bruker 600 MHz Avance III spectrometer (Billerica, MA) equipped with a z-axis gradient triple resonance cryoprobe. Spectra were collected at 25°C with acquisition times of 0.14 s and 0.012 s in the direct and indirect dimensions, respectively, with 64 scans per increment and with a relaxation delay of 1.5 s. The C-H scalar coupling constant was set to 150 Hz. The 13C transmitter frequency was set to 74 ppm with a sweep width of 38 ppm. The 1H transmitter was set to water (4.7 ppm), and a sweep width of 14 ppm was used. Four technical measurement replicates were collected for each sample (Tegsedi batches 1–3 and syringes 1–4, inotersen-IDT as well as inotersen-DCI and -ETT batches 1–3). The 13C data for the aromatic region were spectrally folded. The data were batch processed using nmrPipe, 29 with an in-house automated workflow. The DSS peak was referenced to 0 ppm and 76 ppm in the direct and indirect dimensions, respectively, and all peaks calibrated to the DSS internal standard. All peak intensities were normalized to the anomeric region 5.1–6.4 ppm in the direct dimension and 82–94 ppm in the indirect dimension.
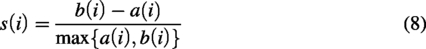
PCA with six components was performed using nmrPipe. 29 The chemical shift ranges (in the folded HSQC spectrum) used for anomeric, aromatic, MOE methylene, and MOE methyl PCA are shown in Table 2.
Extracted Chemical Shift Regions for Principal Component Analysis
Extracted Chemical Shift Regions for Principal Component Analysis
MOE, 2′-methoxyethoxy.
folded.
Results
Chromatographic and mass spectrometry characterization
To confirm high-quality products, all constructs were subjected to ion-pairing reversed-phase liquid chromatography (IP-RPLC) followed by high-resolution mass spectrometry (HRMS) (Supplementary Data, Supplementary Figures S1, S2, S3, S4, S5, S6, and S7). In general, representative IP-RPLC traces showed one peak, with the exception of the 5-mer. For the 5-mer construct, the multiple LC peaks correspond to separation of the diastereomers. We previously reported a complete analysis of multiple chromatographic methods. 30 Subsequent HRMS analysis that included MS1 and MS2 mass spectra confirmed that the primary sequence was inotersen for Tegsedi, inotersen-DCI, -ETT, and -IDT. The inotersen-PO was confirmed to be inotersen sequence but with all PO linkages in place of the PS linkages. The 5-mer sequence was confirmed to be the first five nucleobases of inotersen starting at the 3′ end.
As will be discussed, inotersen-ETT batch 1 could be statistically separated from batches 2 and 3, which statistically clustered together (See 31P NMR results, below). Inspection of the LC traces for inotersen-ETT-1, -ETT-2, and -ETT-3 showed indistinguishable chromatograms (Supplementary Fig. S7A; this was similar to the DCI batches Supplementary Fig. S7B). The HRMS data also confirmed that the primary sequences were the same as well (data not shown). As the inotersen-ETT samples were manufactured externally, analytical assessment of the ETT raw material batches was not possible.
UV thermal denaturation and CD characterization
UV thermal denaturation
UV thermal denaturation profiles provide both qualitative structural information for single-stranded oligonucleotides and quantitative measurement of stability of nucleic acid duplexes.25,28,31 The UV absorbance and first derivative profiles of single-stranded inotersen constructs revealed minimal structural formation (Fig. 1B and Supplementary Fig. S8). To evaluate the stability of inotersen:RNA duplexes, all inotersen samples, including the inotersen-PO:RNA duplex as a control, were annealed to the complementary native (“sense”) RNA strand with a phosphate backbone (see the Materials and Methods section). Three batches of Tegsedi, inotersen-DCI, and -ETT, and one batch of inotersen-IDT and inotersen-PO were used. The UV thermal denaturation curves exhibited two-state behavior28,31 (Fig. 1B and Supplementary Fig. S9), allowing for the extraction of the Tm (Fig. 1C, Supplementary Fig. S10). As expected, the inotersen-PO duplex was approximately 6°C more stable compared with the Tegsedi and inotersen-DCI, -ETT, and -IDT duplexes.13,17,32 However, the inotersen duplexes did not show statistically significant differences in Tm values (see the Materials and Methods section), suggesting that UV thermal denaturation has limited sensitivity for subtle differences in PS diastereomer distribution.
Circular dichroism
CD provides a secondary structure fingerprint and has been widely used for secondary structure investigation of canonical (A-RNA and B-DNA) and noncanonical (G-quadruplexes and Z-DNA) nucleic acid geometries.32–36 CD spectra for all single-stranded Tegsedi, inotersen-DCI, inotersen-ETT, inotersen-IDT, and inotersen-PO constructs were recorded in quintuplicates (Fig. 1D). Visual inspection of the overlaid spectra revealed spectral differences between the inotersen-PO and the PS-modified constructs. Otherwise, no major visual differences were observed among the PS-modified inotersen constructs. To evaluate the differences in the CD profiles quantitatively, the WSD30,31 was computed for all samples using Tegsedi as the reference (Fig. 1E).36,37 As expected from the visual overlay, inotersen-PO showed an approximately 10-fold higher WSD than the 95% confidence threshold, suggesting that the structural ensemble of inotersen-PO is statistically distinct from Tegsedi. However, inotersen-DCI, -ETT, and -IDT showed a moderate, albeit statistically significant, approximately two- to threefold higher WSD, suggesting that CD profiles have limited sensitivity to the overall PS diastereomer distribution.
Larson et al. 36 recently reported sensitivity of CD spectra to changes in PS diastereomer distribution from one PS linkage. Our results show a lower sensitivity compared with Larson et al. The differences in sensitivity compared with Larson et al. could arise from the primary sequence of oligonucleotides used in their study and are consistent with sequence dependence of nucleic acid properties.38–44 A detailed investigation of sequence dependence is beyond the scope of this article.
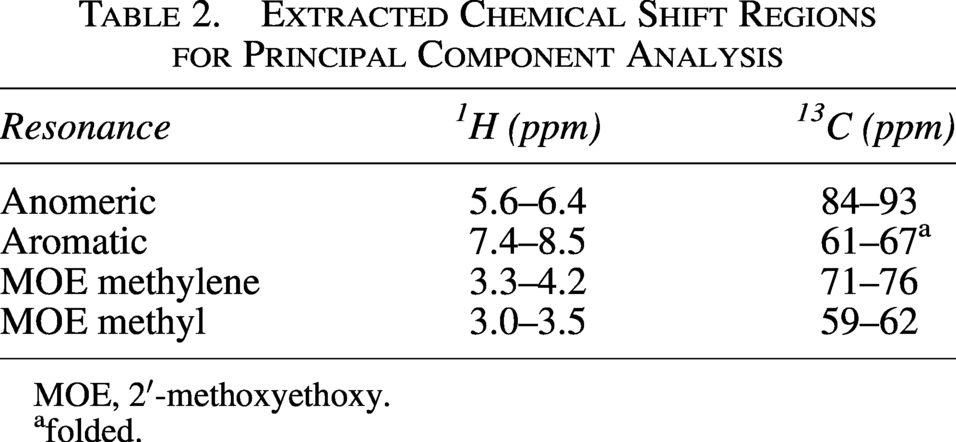
Imino 1H fingerprint of PS and PO duplexes
The PS modification for duplexes is known to impact the imino 1H spectrum of duplexes. 18 Previously, a distinct line broadening was observed, 18 consistent with the observation that each stereoisomer affords distinct yet almost degenerate chemical shifts. To confirm this previous observation, duplexes were prepared: Tegsedi, inotersen-DCI, -ETT, and -IDT were hybridized to its native RNA complement with a phosphate backbone, herein called PS-duplexes (Fig. 2A). As a control, inotersen-PO was also hybridized to the same complementary strand, herein called PO-duplex. For the PO-duplex, the 1H imino resonances were assigned using the sequential NOE walk in the imino region 45 (Fig. 2B, C and Supplementary Fig. S11). The PS-duplex could not be directly assigned due to peak broadening (Fig. 2C). However, an overlay of the 1D 1H imino region of Tegsedi PS- and PO-duplexes showed significant peak broadening in PS-duplex, presumably arising from degenerate chemical shifts, differences in base stacking, and/or conformational dynamics such as base opening, 18 affected by the individual PS diastereomers (Fig. 2C). A detailed biophysical study was not conducted for these samples. However, the overall spectral signature was consistent with the assigned spectrum of the PO-duplex. Consistent with UV and CD signatures, the spectral overlay of inotersen-DCI, -ETT, and -IDT PS-duplexes revealed similar spectra (Fig. 2D).
1D 1H imino spectra of Tegsedi and inotersen duplexes.
31P NMR characterization
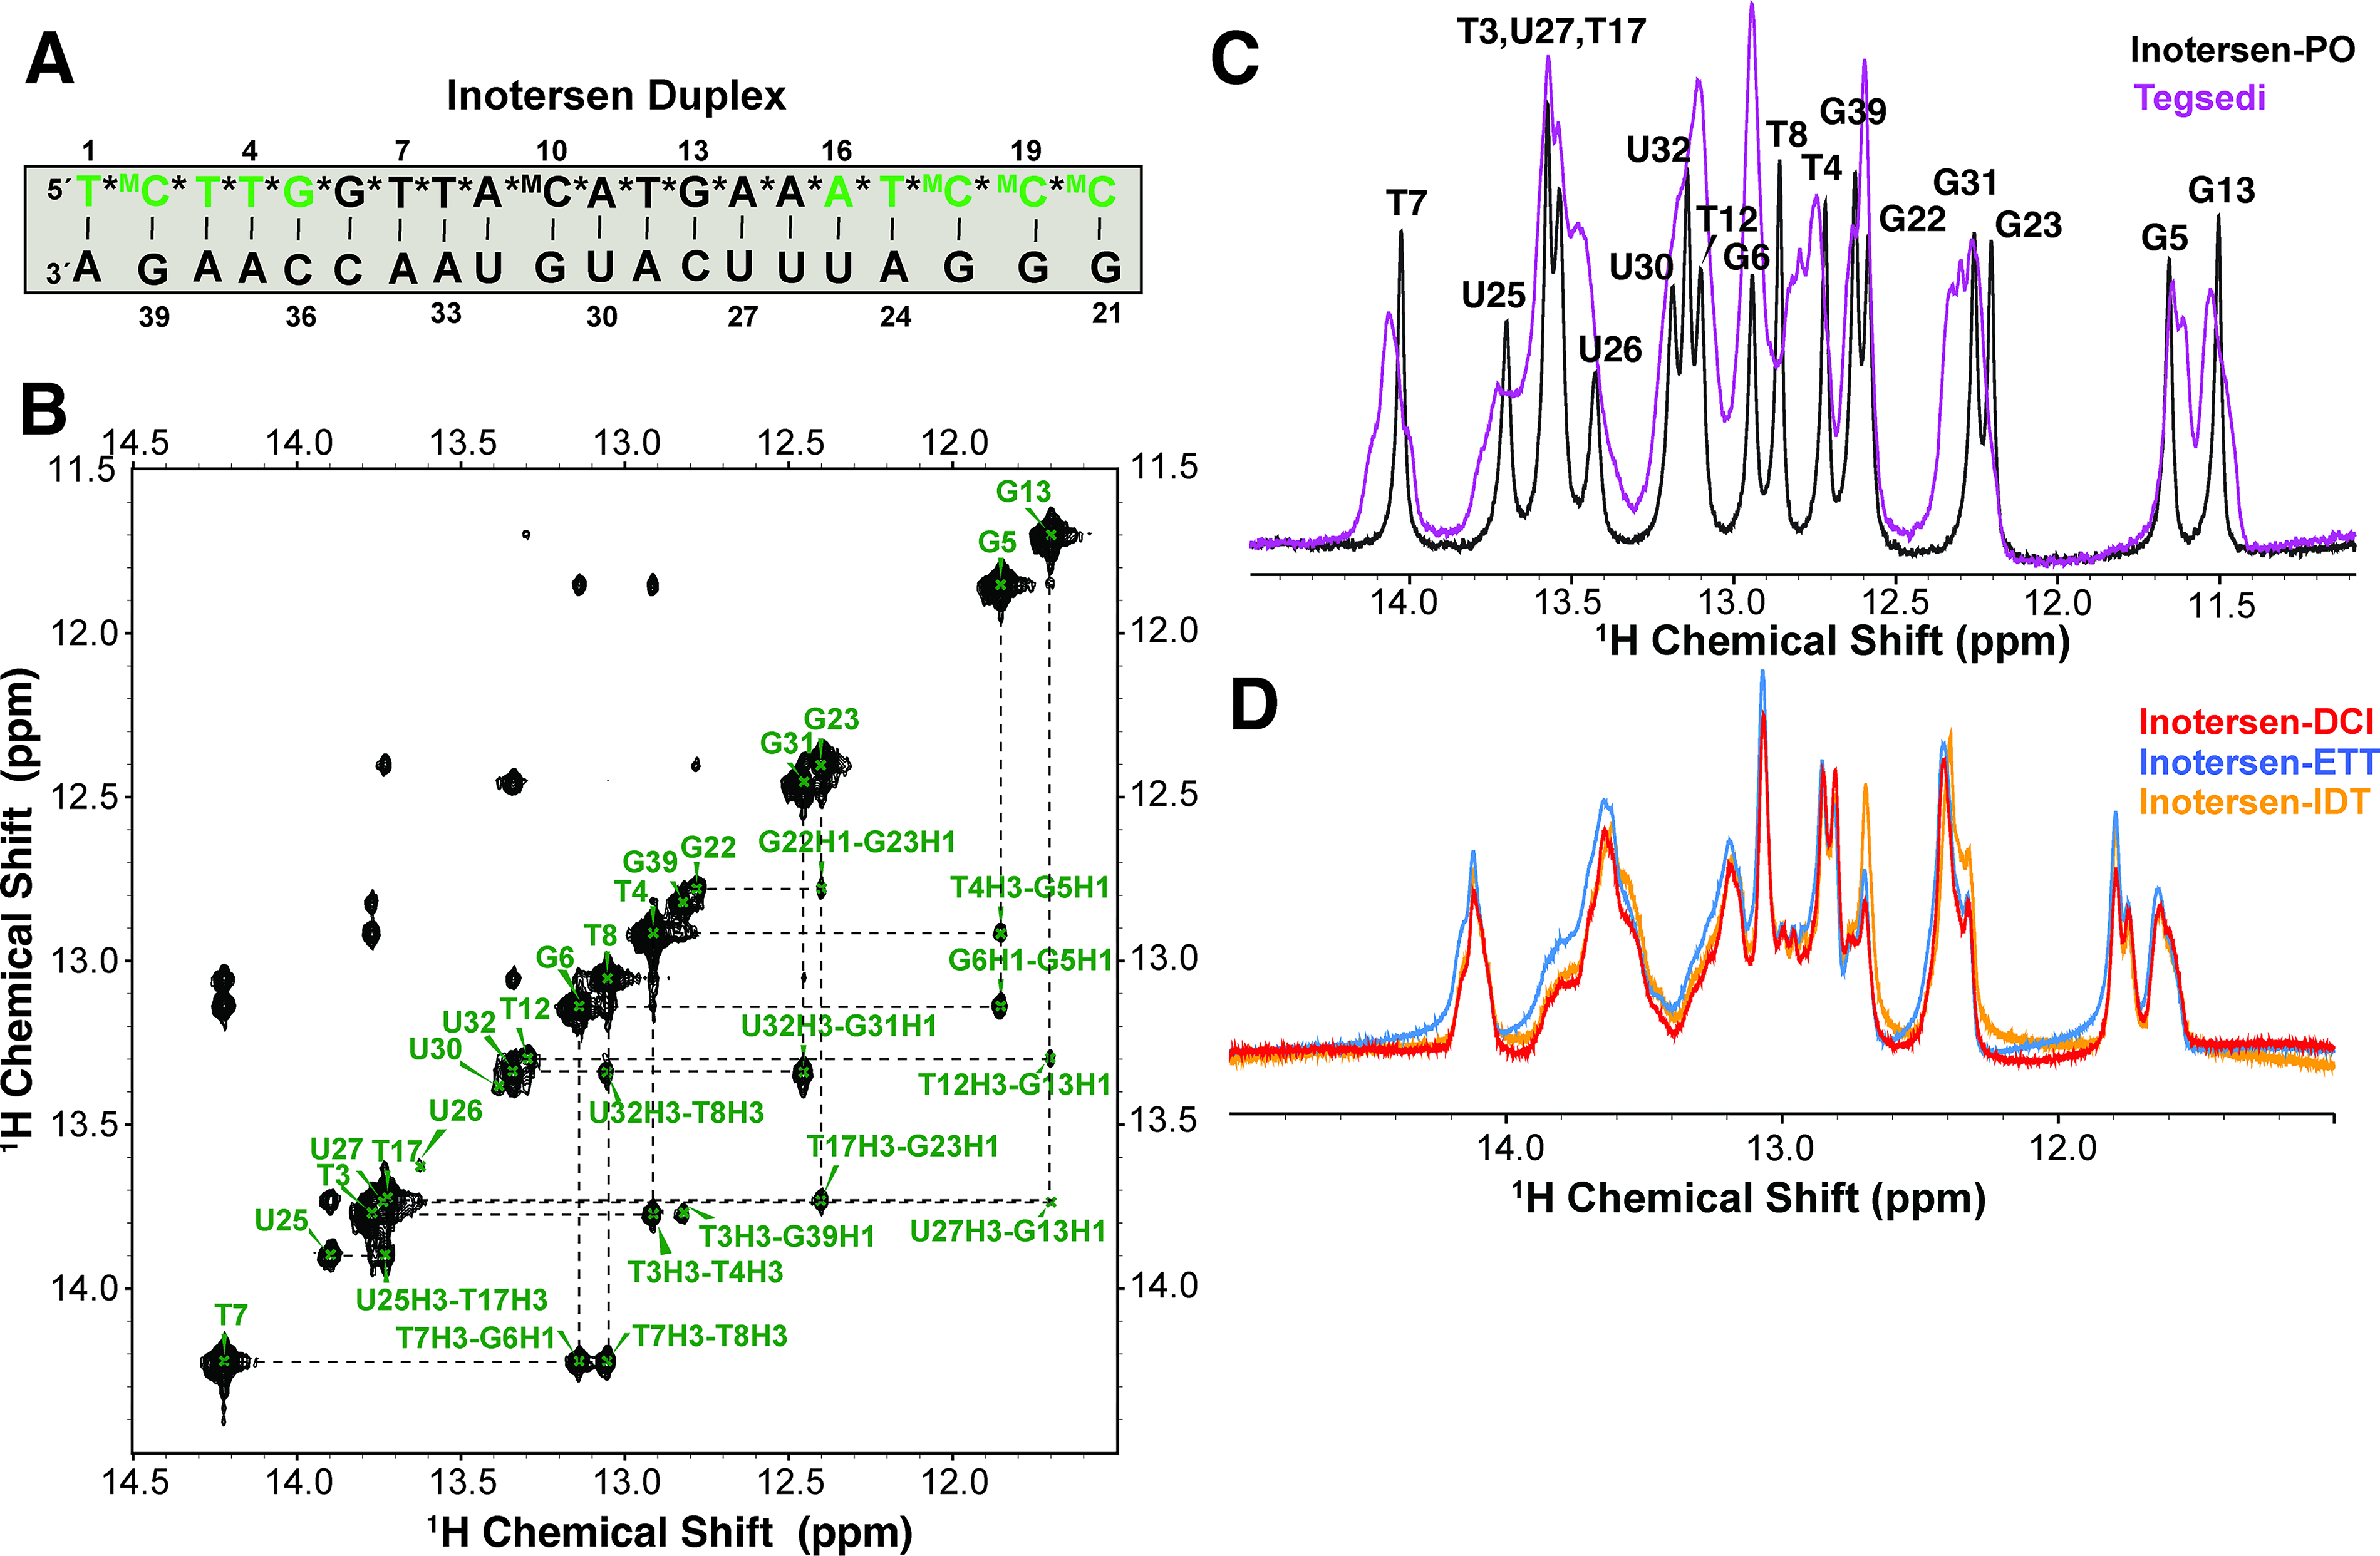
Fingerprinting of the PS stereoisomer distribution by 1D 31P NMR has become one of the industry standard methods for basic PS characterization.36,46–48 31P NMR measurements revealed pronounced differences between the Tegsedi and custom inotersen samples (Fig. 3A, Supplementary Figs. S12 and S13), which were not localized to discrete peaks but rather spread across the entire spectral region. The PS region, 54–60 ppm, 46 is divided into two subregions. The Sp stereoisomer is known to resonate in 54–57 ppm, and the Rp stereoisomer resonates in 57–60 ppm. 26 A spectral overlay of a purified Rp and Sp 2-mers onto full-length Tegsedi 31P spectrum suggested that this subregion assignment is true for the inotersen series. 30 Despite the complexity of the spectra, industry standard practice is to report total Rp and Sp abundance from integration of each respective region, 36 which provides a general quantitative characterization of each stereoisomer distribution. The Tegsedi batches afforded highly similar PS distributions, with Rp values approximately 18% for all batches (Fig. 3B). Inotersen-DCI yielded 29% Rp abundance (Fig. 3B), consistent, although slightly less than the 40% reported in prior studies using homopolymeric sequences. 26 Since Tegsedi was manufactured by a proprietary process, the choice of activator is not disclosed. As such, the observed 11% Rp difference between Tegsedi and the DCI construct may have arisen due to activator and/or manufacturing process differences between inotersen-DCI and Tegsedi. Interestingly, inotersen-ETT also showed 28% Rp abundance (Fig. 3B), instead of the expected 70% from prior studies with homopolymeric sequences. 26 The manufacturer verified the use of each requested activator for both inotersen-DCI and inotersen-ETT.
1D 31P NMR characterization of inotersen batches.
The spectral complexity and the subtle spectral differences between the Tegsedi and inotersen batches suggest that the univariate metric of integration may be insufficient to truly capture the changes in stereoisomer distribution. This observation is highlighted by the similar proportions of the stereoisomer distribution for the ETT and DCI samples. Despite the overall similarity of the stereoisomer distribution, the Rp:Sp ratios at individual PS linkages likely vary, leading to the spectral differences that are visually apparent.
In-depth analysis of 31P NMR signatures of PS diastereomer distribution
NMR is a multiattribute technique, and the data can be mined for additional parameters to answer important questions relevant to drug substance characterization. 49 Within the general field of biologics, the PCA of mAb-based NMR data has been established as a powerful tool for mapping spectral changes attributed to structural perturbations.50–53 In one key example, methionine oxidation of a model IgG therapeutic showed that structural changes extended beyond the methionine residues and showed general structural perturbation. These perturbations could be most easily visualized from the spectral loading plots generated from PCA, 54 allowing the determination of the origin of variation within a spectral series. Despite the lack of methyl group assignments for this case study, specific modeling pinpointed some of these perturbations to isoleucine residues 15Å from the site of oxidation.
Based on the success of PCA for protein-based therapeutics, PCA was adapted to the 31P spectra of the Tegsedi and inotersen samples. While PCA on 31P NMR data has been previously used for investigation of PS diastereomer distribution,26,55 the lack of NMR measurement replicates has precluded in-depth quantitative insights attainable from PCA. The score plot revealed Tegsedi batches as a tight cluster, suggesting high similarity between batches. Interestingly, inotersen batches were well separated from Tegsedi in the PC1 dimension (Fig. 3C), which accounts for the highest sample variation, highlighting that Tegsedi and inotersen are distinct molecules in the context of 31P NMR signatures, consistent with the Rp abundance differences between Tegsedi and inotersen (Fig. 3B). Inotersen-IDT is separated from inotersen-DCI and -ETT in both PC1 and PC2, whereas separation from Tegsedi is only observed in PC2 (Fig. 3C). PCA, therefore, revealed that inotersen-IDT is distinct from Tegsedi as well as inotersen-DCI and -ETT, a distinction that was missed by the overall Rp abundance metric (Fig. 3B). This observation highlights the advantage of utilizing the entire NMR spectrum in conjunction with multiattribute statistical tools such as PCA to reveal intricate dissimilarities between similar samples. Due to the limited number of batches of both Tegsedi and inotersen samples, statistical significance and therefore the overall interpretation are limited. The four technical replicates for each batch only establish measurement variability, not batch variability.
The three batches of inotersen-DCI also clustered together (Fig. 3C), highlighting high batch-to-batch similarity. Surprisingly, the inotersen-ETT batch (B)1 clustered away from inotersen-ETT B2 and B3 (Fig. 3C). The vendor confirmed that the ETT activator batch used for B1 synthesis was different from B2 and B3. This finding provides a possible use case for 31P NMR and PCA for batch-to-batch variability. While further investigation of the batch-to-batch variability in inotersen-ETT samples was beyond the scope of this study, this finding is in agreement with Roussis et al., who observed greater batch-to-batch variability in tetrazole-based (ETT) synthesis compared with imidazole-based (DCI) synthesis. 26
Generation of the spectral loading plots allowed for visualization of spectral features responsible for distinguishing between Tegsedi and inotersen samples (Fig. 3D). The PC1 loading plot reveals distinct peaks encompassing both Rp and Sp regions that correlate to the underlying change of PS diastereomer distribution. While 31P assignments are not available for this case study, unlike applications for which assignments are available, the loading plot could help pinpoint which position(s) contribute the most to PC1 and therefore to changes in overall PS diastereomer distribution. Interestingly, the spectral overlay of 31P NMR data revealed that the most intense peak (55.4 ppm) is invariant for Tegsedi and inotersen samples (Fig. 3A), suggesting that the relative abundance of the highest abundance diastereomer(s) is highly similar in all PS samples. To investigate the origins of the highest abundance diastereomer, the spectrum of full-length Tegsedi was compared with a 5-mer comprising the 3′ end of Tegsedi (Fig. 3D). The 55.4 ppm peak is the second most intense peak in the 5-mer, suggesting that the highest abundance diastereomer may reside in the 3′ end of all inotersen constructs. Additional 2D NMR measurements on the 5-mer were attempted to confirm this result; however, the spectra were in the slow and intermediate exchange regime, precluding in-depth characterization (data not shown). The molecular basis of this observation is beyond the scope of this study.
To assess the distinctness of groups observed in the PCA space, the silhouette values56,57 were computed for each NMR experiment replicate. For this analysis, groups were manually defined based on sample type and batch number; all Tegsedi batches were defined as a singular reference group. The silhouette value measures how well a 31P spectrum fits within its assigned cluster by comparing its distance to the center of the cluster with the distance to the nearest neighboring cluster. High values indicate strong support for the cluster assignment, whereas low values suggest that the sample could plausibly belong to a neighboring cluster. Silhouette values were calculated for each replicate spectrum; the median with the IQR is also reported (Fig. 4A). As expected from visual inspection of the PCA score plot, Tegsedi and inotersen-IDT showed high silhouette values. Lower silhouette values for DCI batches suggest that the three batches are likely highly similar, causing spectra from one batch to also have high similarity to the cluster assigned to the other two batches. The same is also true for ETT-B2 and -B3. Remarkably, the analysis revealed high support for ETT-B1 NMR spectra to be classified into their own cluster, providing further evidence for differences between ETT-B1 versus ETT-B2 and -B3.
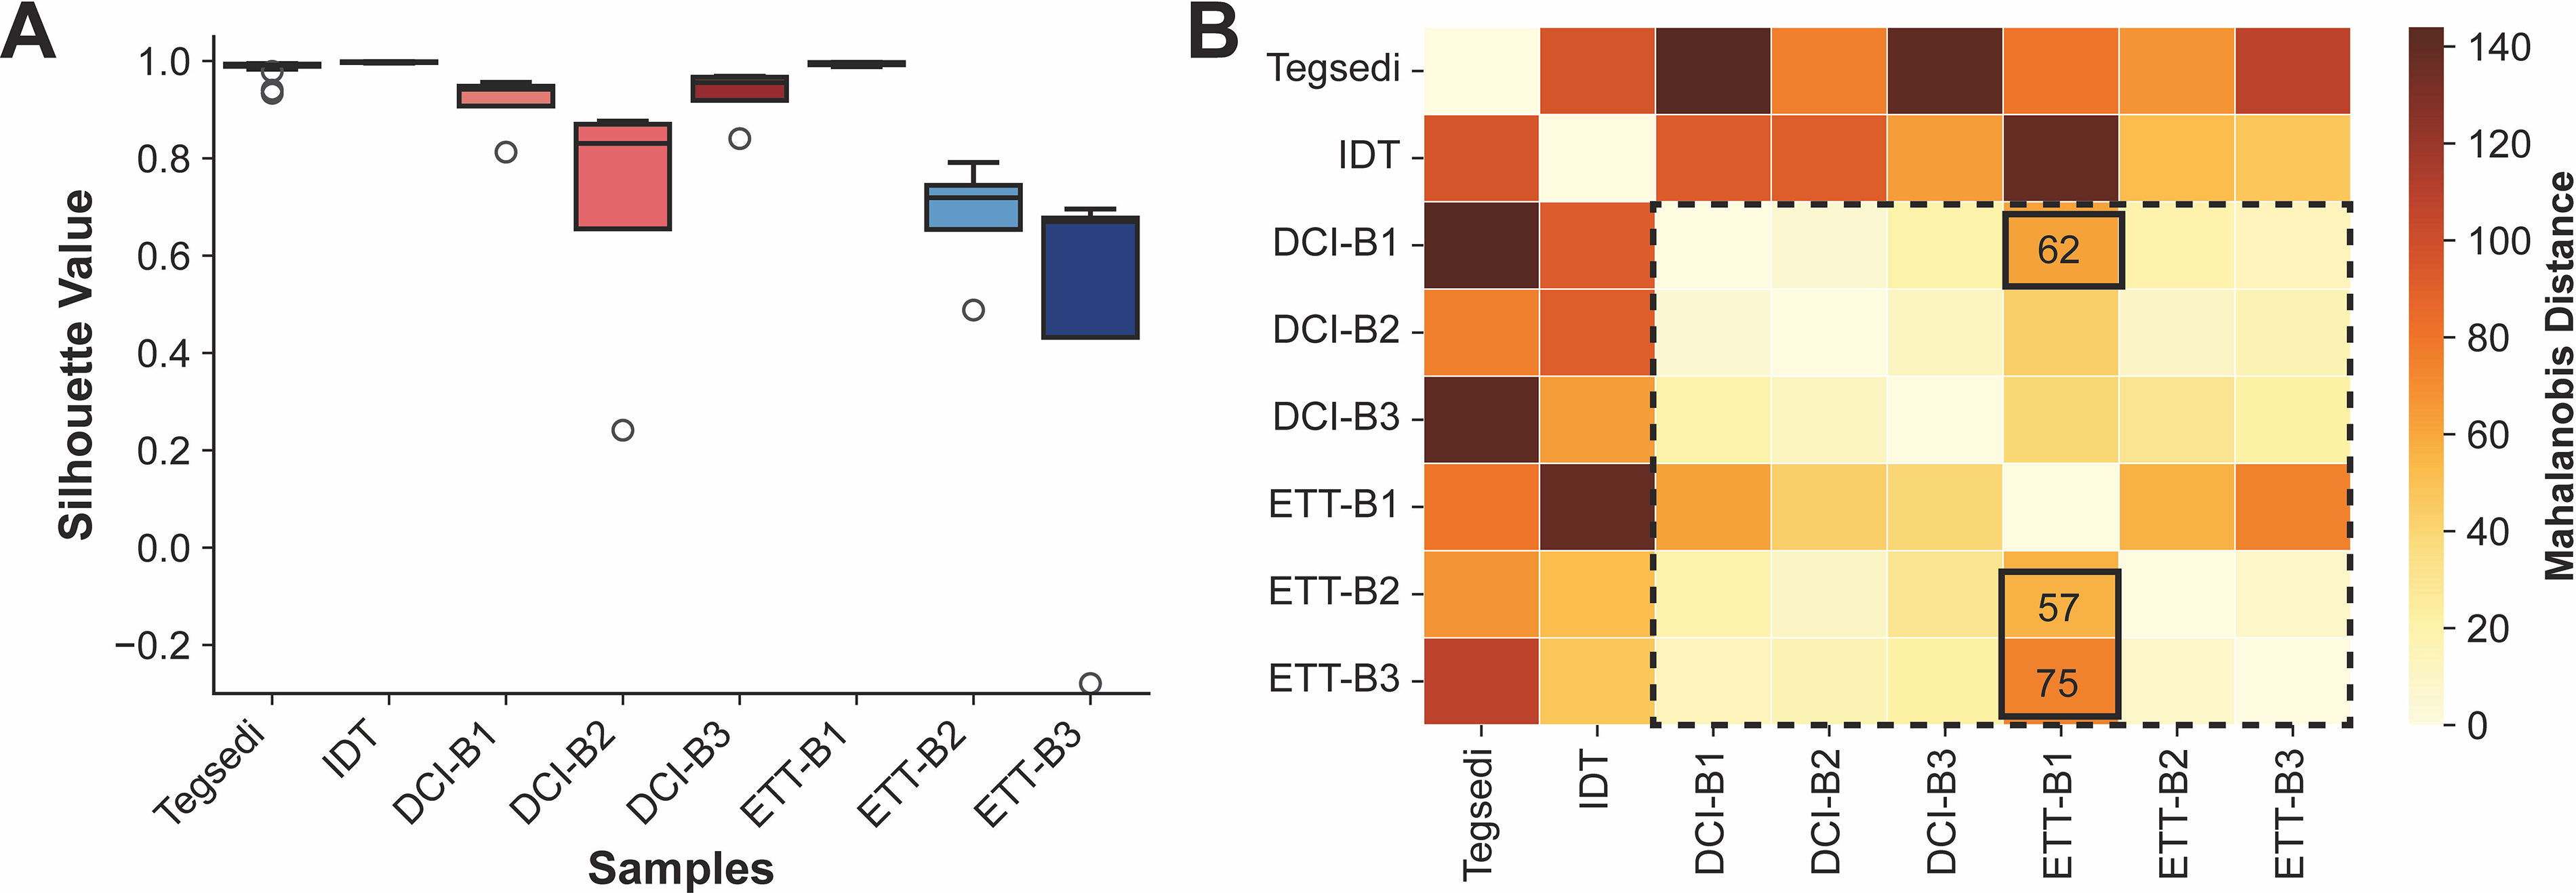
Silhouette value and Mahalanobis distance analysis of 31P NMR PCA.
To further gauge the similarities and dissimilarities between Tegsedi and inotersen samples from the PCA score plot, the Mahalanobis distance,58,59which takes into account the covariance in the PC scores of spectra in each cluster, 58 was computed between the centroid of each pair of the eight manually assigned clusters (Fig. 4B and Supplementary Fig. S14). Tegsedi is the farthest distance from all other clusters, followed by inotersen-IDT, providing support for Tegsedi and inotersen-IDT samples to be distinct from inotersen-DCI and inotersen-ETT. Interestingly, inotersen-DCI (all batches) and -ETT (-B2 and -B3) show low Mahalanobis distances, suggesting high similarity between inotersen-DCI and inotersen-ETT, in contrast to activator-predicted Rp/Sp ratios. Consistent with silhouette values, the three inotersen-DCI batches are close to each other (lower Mahalanobis distance), suggesting good batch-to-batch consistency in inotersen-DCI batches. Similarly, inotersen ETT-B2 and -B3 are close to each other, indicating that these two batches also have high similarity. Consistent with silhouette values, ETT-B1 is farther from ETT-B2 and -B3 as well as DCI-B1 (Fig. 4B, annotated values, and Supplementary Fig. S14), suggesting higher batch-to-batch variability in inotersen-ETT batches.
2D 1H,13C hetereonuclear correlation spectroscopy has been established as a high-resolution fingerprinting method of choice for protein-based biologics49,51 and has been extended to oligonucleotide therapeutics. 60 Although the sugar and base moieties become increasing distal from the chiral center, the impact of the stereoisomers leads to cross peaks that are broader than the corresponding inotersen-PO (Supplementary Fig. S15). Both the anomeric and aromatic regions of the 1H,13C spectrum of inotersen-PO have sharper peaks compared with Tegsedi. Typically, broader lines often suggest a shift from the fast exchange regime toward the intermediate exchange regime on the NMR timescale. 61 A 1D spectral survey at high temperatures afforded similar linewidths to spectra collected at 25°C (data not shown). As such, in this case, it is possible that each stereoisomer has discrete 1H and 13C chemical shift values that are nearly degenerate, giving rise to a peak that is broader than might be expected.
A visual assessment of the anomeric region of 1H,13C HSQC spectral overlays of inotersen and Tegsedi single-strand samples showed highly similar fingerprints (Fig. 5A and Supplementary Fig. S16). The spectra of inotersen samples have distinct spectral differences around 1H 5.6–5.7 ppm and 13C 91–92 ppm compared with the Tegsedi fingerprint (Fig. 5A). Other subtle spectral differences are also observed throughout the anomeric region. The nucleobases captured in the aromatic region of the same HSQC spectrum for Tegsedi and inotersen samples show similar but not identical fingerprints (Fig. 5B and Supplementary Fig. S17). Taken together, these data suggest that the differences in the overall PS diastereomer distribution propagate to the sugar moieties and to a lesser extent to the nucleobases.
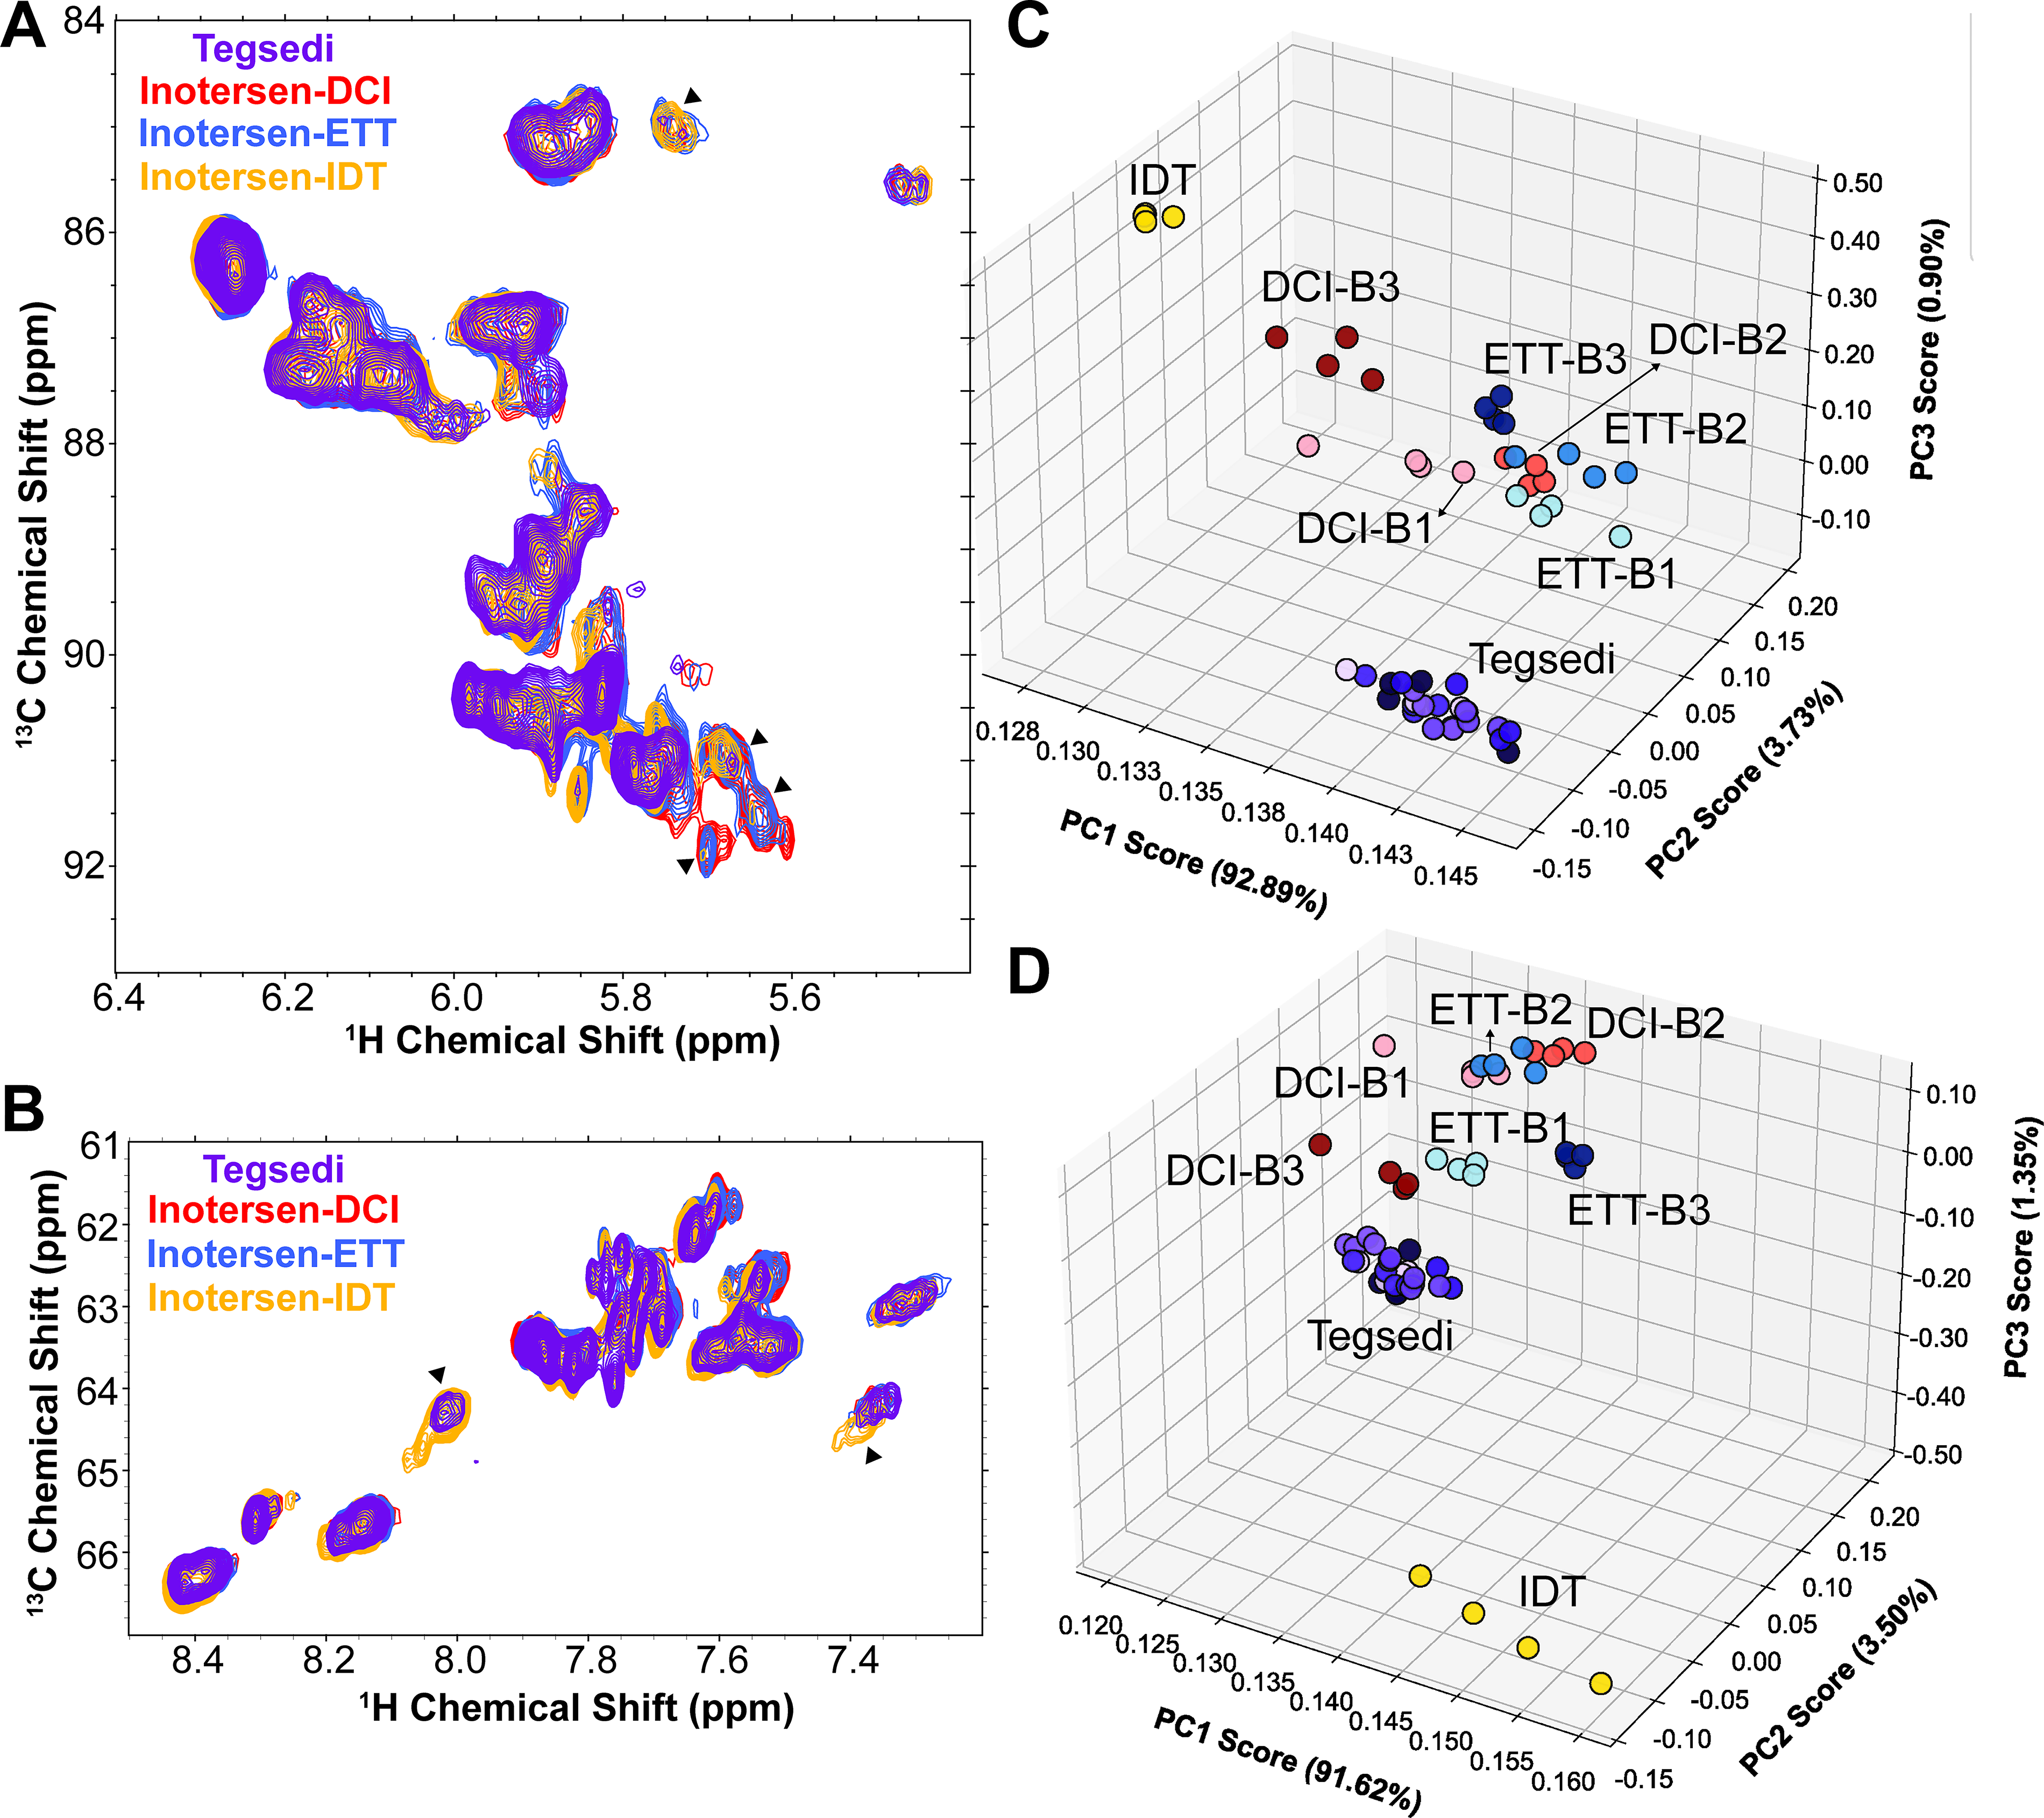
2D 1H, 13C NMR characterization of inotersen batches. 2D 1H, 13C HSQC spectral overlays of inotersen single-strand samples showing the
To extract detailed spectral features from the 2D 1H,13C spectra, PCA was performed. Four NMR experimental replicates were collected for each sample and batch. Consistent with 31P NMR data, the anomeric and aromatic regions of the spectra revealed that Tegsedi and inotersen-IDT are well separated from inotersen-DCI and inotersen-ETT (Fig. 5C, D), highlighting dissimilarities between these samples. Inotersen-DCI and -ETT samples and batches cluster closer together. To evaluate whether the 5′ and 3′ MOE flanks are affected similarly by the PS diastereomer distribution, PCA was performed on the MOE methylene and methyl region of the HSQC spectra (Supplementary Fig. S18). As expected, the MOE groups sense PS diastereomer distribution to a lesser extent; nevertheless, the results from the PCA are in qualitative agreement with the anomeric and aromatic regions, suggesting that all three probes—sugar, sugar substituents, and nucleobases—are reporting on the PS diastereomer distribution. Spectral loading plots from PCA results of the anomeric region afforded a PC2 and PC3 spectral loading signature with both positive and negative intensities across most cross peaks (Supplementary Fig. S19). As the 2D spectra were not mean centered before PCA, PC1 functions akin to the average spectrum across the entire spectral series. Overall, 2D 1H,13C NMR data are consistent with 31P NMR data but may have lower sensitivity to differences in the overall PS diastereomer distribution.
Discussion
PSs are widely utilized in the field of oligonucleotide therapeutics. 5 As they introduce a chiral center in the phosphate backbone, they produce a complex mixture of diastereomers. A widely used strategy for controlling the stereochemistry of PS linkages in drug manufacturing is based on the choice of activator. These activators introduce a slight bias for Rp versus Sp or vice versa.26,30 In practice, a standard 20-mer oligonucleotide could theoretically have a mixture of over 500,000 molecules (2 19 ), each defined by a different configuration of sulfur at each PS linkage. Thus, a PS-containing oligonucleotide contains molecules that are highly similar but not identical. Probing similarities/dissimilarities between PS-containing oligonucleotides is therefore analytically challenging. While no analytical technique can characterize the population of each of the 500,000 molecules, this study presents a thorough investigation of fingerprinting PS-containing oligonucleotide drugs using multiple analytical techniques and highlights the high sensitivity of NMR spectra to changes in overall PS diastereomer distribution, while also providing the first 2D 1H,13C fingerprint of an ASO containing an appreciable number of commonly utilized chemical modifications.
Our analysis revealed that commonly utilized techniques, such as UV thermal denaturation and CD spectroscopy, show limited sensitivity to changes in overall PS diastereomer distribution (Fig. 1). In contrast, information-rich datasets such as 1D 31P NMR (Fig. 3) and 2D 1H,13C NMR (Fig. 5) show a higher sensitivity to PS diastereomer distribution and can robustly distinguish PS oligonucleotides synthesized using different activators, as is evidenced by agreement between backbone, sugar, nucleobase, and MOE NMR probes. Differences that could not be distinguished using univariate metrics such as area under the Rp 31P NMR curve (Fig. 3B) can instead be revealed via multivariate methods such as PCA (Figs. 3C and 5C, D). Furthermore, PCA-derived clustering metrics using silhouette values and Mahalanobis distance57,58 established batch-to-batch consistency in Tegsedi and inotersen-DCI batches, whereas inotersen-ETT samples displayed variation among batches (Fig. 4), possibly due to a change in the batch of the ETT activator. These similarity assessments could be accomplished without the need for NMR assignments, which can be challenging to obtain for these diastereomeric mixtures. In future applications, when 31P assignments can be made using stereopure oligonucleotides, the spectral features revealed by PCA can be used to pinpoint the individual PS linkages responsible for batch variations, aiding the manufacturing process.
Comparison of PS-duplexes with PO-duplexes revealed peak broadening for both exchangeable (Fig. 2C) and nonexchangeable (Supplementary Fig. S15) protons, likely due to discrete yet degenerate chemical shifts for the PS diastereomers. It cannot be ruled out that some peak broadening may be due to intermediate exchange on the NMR timescale. Preliminary NMR data at 40°C suggest that contributions from chemical exchange are small (data not shown); a systemic study is planned to rule out this possibility. It is, however, remarkable to note that the impact of PS diastereomers extends to the conformation/dynamics of sugar (Fig. 5A) and nucleobase (Fig. 5B) moieties as well as to the base-pairing partner on the other strand (Fig. 2C). Furthermore, statistical analysis of 2D 1H,13C probes on the sugar and nucleobases complements and strengthens 1D 31P NMR results. The loading plot signatures of the anomeric region, with PC2 and PC3 affording both positive and negative intensities across most cross peaks, could suggest a change in molecular dynamics, although preliminary 1D temperature studies suggested minimal changes in linewidth (data not shown). Among other possibilities, another interpretation could indicate that each 2D 1H,13C cross peak encompasses the stereoisomer distribution, with each stereoisomer having nearly degenerate yet discreet chemical shifts. A more detailed follow-up investigation will sort out this conundrum.
While 31P NMR has been applied to study PS diastereomer distribution in oligonucleotide therapeutics,26,36,55 the observation that Rp-favoring and Sp-favoring activators both result in similar spectral profiles has not been fully understood. For the current series of PS-modified oligonucleotides, only 28% Rp abundance was observed for inotersen-ETT, whereas literature suggested that the ETT should afford a stereoisomer distribution with Rp as the major product. 26 Although the systematic investigation of this unexpected observation is beyond the scope of this article, our data provide circumstantial evidence to allow some speculation as to the origin of this apparent discrepancy. In the 31P spectral series, all constructs contained a similar intense 31P signature at approximately 55.4 ppm, including the 5-mer construct (Fig. 3A, D). As solid-phase synthesis of oligonucleotides proceeds from 3′ to 5′, the observation of a similar signal in the 5-mer may suggest a similar diastereomer distribution at the 3′ end of the molecule. Attempts to further characterize the 5-mer by 2D NMR methods afforded signals in the slow and intermediate exchange regime, precluding in-depth analysis (data not shown). However, the discrepancy between the expected and observed diastereomer distributions obtained with DCI and ETT activators could suggest that stereochemical outcomes may not arise from independent, constant probabilities at each coupling step, as widely assumed. Instead, these activators may impose a stereochemical bias in which the configuration at a given linkage depends on the stereochemistry of the preceding linkage. This hypothesis is beyond the scope of the current article and will require further in-depth investigation.
Conclusions
In conclusion, this study provides a thorough evaluation of multiple analytical techniques for characterization of PS-containing oligonucleotide therapeutics and provides unique insights into activator-based PS stereochemistry control. The chemometric analyses of the NMR spectra underscored that the complexity of the stereoisomer distribution is not properly captured by the univariate metric of 31P spectral integration. Rather, the established multivariate tool of PCA was not only sensitive to changes in stereoisomer distribution, but the loading plots also provided a spectral signature of the changes in this distribution. Furthermore, the first 2D 1H,13C NMR fingerprints of a PS-modified ASO underscored the long-ranging effects of the PS diastereomer distribution on the sugar and nucleobase moieties. By placing the findings of this study in the context of prior studies, we shed light on the inherent complexity of these stereochemical mixtures as well as the utility and limitations of information-rich techniques such as NMR for their characterization.
Our findings underscore the complexity of PS stereochemistry generation driven by activators and highlight the need for rigorous quality control of synthesis reagents—particularly activators—as well as synthesis protocols. The analytical techniques presented herein differed in their sensitivity to subtle variations in stereochemical distribution, which may influence the efficacy and safety of PS-containing therapeutics. Because assessments of structural similarity are inherently method-dependent, we anticipate that this work will encourage the incorporation of NMR into discovery and analytical pipelines to ensure consistent stereochemical distributions from the earliest stages of development.
Footnotes
Acknowledgments
The authors thank Michael Cummings of University of Maryland College Park, and Christina Bergonzo of the National Institute of Standards and Technology (NIST) for helpful discussions. They also thank Curt Meuse of NIST for technical advice for CD experimental design.
Disclaimer
Certain commercial equipment, instruments, or materials are identified in this article to specify the experimental procedure adequately. Such identification is not intended to imply recommendation or endorsement by the NIST, nor is it intended to imply that the equipment, instruments, or materials identified are necessarily the best available for the purpose.
Author Disclosure Statement
No competing financial interests exist.
Funding Information
This publication was supported by the Food and Drug Administration (FDA) of the US Department of Health and Human Services (HHS) as part of a financial assistance award, U01FD007651, totaling $599,491, with 20% funded by the FDA/HHS and $125,000 amount, and 80% funded by non-FDA/HHS source(s). The contents are those of the author(s) and do not necessarily represent the official views of nor an endorsement by the FDA/HHS or the US Government. The authors acknowledge the University of Maryland School of Pharmacy Mass Spectrometry Center (SOP1841-IQB2014). The authors additionally acknowledge support from the NIST Biomanufacturing Program.
Supplemental Material
References
Supplementary Material
Please find the following supplemental material available below.
For Open Access articles published under a Creative Commons License, all supplemental material carries the same license as the article it is associated with.
For non-Open Access articles published, all supplemental material carries a non-exclusive license, and permission requests for re-use of supplemental material or any part of supplemental material shall be sent directly to the copyright owner as specified in the copyright notice associated with the article.