
Abstract
Objective:
This study aimed to evaluate the location-specific and time-sensitive trajectories of pressure injuries (PrIs) stages using real-world electronic health record (EHR) datasets.
Approach:
Using a dataset of 29,475 patients with records of PrIs documented from 2015 to 2023, we developed four PrI patient sub-cohorts with common PrI locations, including coccyx, buttocks, sacrum and heel. We estimated transition intensities between three PrI states: stage 1, stage 2, and a severe stage in each group. Stages and transition paths were derived from domain knowledge provided by clinical experts and The National PrI Advisory Panel (NPIAP) guidelines.
Results:
The trajectory analysis suggested that stage 2 serves as a “gateway state” in all four locations, meaning that once a PrI reaches stage 2, the likelihood of transiting to severe stages increases significantly. The commonly used Braden Scale and its sub-components are more likely to be associated with transitions from stage 2 to severe stages, suggesting that manual risk assessment tools are suboptimal for predicting early-stage PrI transitions. Further, we observed race-dependent variations across injury location groups.
Innovation:
To our knowledge, this is the first study to introduce multi-state trajectory analysis in PrI research. Our model can investigate PrI status in a dynamic manner, which fills an important gap in the field.
Conclusion:
Our findings underscore the lack of time-sensitive information in existing PrI risk assessment tools, revealing a critical gap in their ability to capture the dynamic nature of PrI progression. Clinical decision support using time sensitive data is needed for delivering personalized, timely, and effective PrI prevention.
Keywords
Wenyu Song, PhD, MBI

INTRODUCTION
Pressure injuries (PrIs) are common, painful, and expensive adverse events that are associated with negative patient outcomes and a mortality rate of 11.6%. 1 It is estimated that 2.5 million patients per year are affected by PrI (AHRQ). 2 Although the prevalence of early-stage hospital acquired PrIs declined in recent years, severe PrIs remain a challenging healthcare issue. 3 In real-world practice, nurses routinely conduct PrI risk assessment using assessment tools where nursing observations are manually recorded and are often not linked with timely and appropriate interventions tailored to dynamic patient status. Access to clinical decision support (CDS) tools at the bedside to facilitate and validate PrI assessment has been identified as a key gap in evidence-based PrI practices. 4 PrI prevention remains a significant issue for the quality of patient care in healthcare systems worldwide.5–9
The National Pressure Injury Advisory Panel (NPIAP) defines PrI as “localized damage to the skin and underlying soft tissue usually over a bony prominence or related to a medical or other device.” 10 PrIs can present with various clinical manifestations corresponding to different stages, representing degrees of injury severity. The current NPIAP’s staging system includes six categories ranging from non-blanchable erythema and intact skin (stage 1) to full thickness wounds (stage 4), suspected deep tissue injury (sDTI), and unstageable and mucosal.11,12 Clinically, patients can progress from early-stage injuries (e.g., stage 1 or 2) to more severe injury stages (e.g., stage 4) over time. According to NPIAP guidelines, PrI staging is not reversible; once an injury is classified at a particular stage, that designation remains throughout the healing process, even as the wound improves. In depth knowledge of the dynamic transition pattern of PrI stages (i.e., stage transition trajectory) can provide important information to inform PrI CDS to improve risk assessment, evaluation, and corresponding intervention strategies. However, commonly used assessment tools (e.g., The Braden scale 13 ) are not designed to capture this type of information. Previous machine learning predictive studies typically used cross-sectional data, failing to account for the dynamic changes in PrI stage and location, which results in predications that do not accurately reflect a patient’s real time clinical condition. Currently, little is known about the underlying mechanism of PrI stage transitions and to our knowledge, there are no CDS tools to help identify dynamic PrI staging patterns that could inform preventative clinical practices.
In this study, we utilized Markov multi-state modeling 14 to evaluate time-sensitive PrI staging transition trajectories in four common PrI locations based on real-world electronic health record (EHR) datasets.
METHODS
Data source
We utilized clinical databases within the Mass General Brigham (MGB) Healthcare system, a centralized clinical data warehouse from multiple Harvard-affiliated hospitals, including academic medical centers, specialty, and community hospitals. For the current study, clinical data from five MGB hospitals were included. Available data items include patient demographics, diagnoses, inpatient and outpatient encounter information, and provider data.
Cohort development and subgrouping processes
We extracted PrI records from nursing documentation flowsheets. Both PrI anatomical locations and staging values with the date of injury occurrence were obtained. We developed an initial cohort for patients ages 18 and above and with at least two records of PrI documented from May, 2015 to January, 2023.
Based on expert opinion, patients were divided into four sub-groups according to the most common PrI anatomical locations in our study cohort: coccyx, buttocks, sacrum, and heel. Within each PrI location group, we further divided patients into 3 staging groups, including stage 1, 2, and severe stage (including stages 3, 4, or unstageable) based on NPIAP definition and clinical expert suggestions. Based on expert opinion, stage 1 and stage 2 were defined as early-stage PrI and other stages were defined as severe PrI. Due to the complex underlying mechanism of deep tissue injury and its multi-way transition pathways, 15 we did not include DTI in the main model after consulting with wound care experts. However, we did perform a secondary analysis looking at DTI progression thresholds (see subsection Statistical analysis).
Newer patient cohort for validation
For model validation, we developed another patient cohort from February, 2023 to June, 2024 using the same criteria. We extracted PrI stage records, patient demographic factors, and Braden scales with definition described above.
Statistical analysis
Comparative analysis among location groups
Due to non-normal distribution of dataset, Kruskal–Wallis test (the nonparametric equivalent of the one-way ANOVA) was applied to compare population median age at the time of PrI diagnosis. Dunn’s test was then conducted for pair-wise group comparison. A p value less than 0.05 was considered the statistically significant threshold.
Multi-state trajectory model development and feature cleaning processes
We used a Markov multi-state probabilistic model 16 to estimate transition intensities between multiple states. The analysis uses maximum-likelihood estimation. Transition intensity represents the instantaneous rate of transitions from one state to another state, indicating the likelihood of stage transitions for patients with PrI. States were defined using PrI stages and transition paths were changes in PrI stages derived from rules based on domain knowledge provided by clinical experts and NPIAP PrI clinical practice guidelines. 11 Also, consistent with the NPIAP guidelines, PrI staging is not considered a reversible process. Once a PrI is classified at a particular stage, particularly stages 2 through 4, it retains that designation for the duration of the healing process, even as the wound improves. For example, a stage 3 injury that is healing is not reclassified as a stage 2 or stage 1; rather, it is documented as a “healing stage 3.”
With these standards, we defined multiple rules for the data cleaning steps and stage transitions based on NPIAP guidelines and expert opinion, 12 including: (1) Stage from a single day was used as an individual data point. If there are records of more than one stage during the same day, we used the higher stage; (2) Patients with at least two stage records from distinct time points were selected for the study cohort; (3) The time interval between two consecutive stage records was less or equal to 90 days; (4) All patients start from stage 1 and then progress to other stages or maintain at the same stage, so stage 1 was defined as “entry state”; (5) Based on the NPIAP guidelines, three transitions are allowed: stage 1 to 2, 1 to severe stage or 2 to severe stage. The reverse transitions (e.g., stage 2 to 1) are not allowed; and (6) To explore transition patterns between early stages and deep tissue injury, we extracted DTI records from our study cohort and developed an muti-state trajectory model: stage1 transit to stage 2, stage 1 transit to DTI and stage 2 transit to DTI.
Covariate analysis-impact of Braden Scale and its components
We estimated impacts of Braden Scale and its six sub-components as time-varying covariates to all transitions between PrI stages. We obtained Braden Scale records for our study cohort during the study period. We processed these records using a similar pipeline described above and linked the Braden Scale assessment closest in time to the one stage record per patient by matching encounter information. We also processed each sub-component of the Braden Scale, including sensory perception, moisture, activity, mobility, nutrition, and friction and shear, and linked these components to the stage records. We converted the Braden Scale and all sub-component into binary variables (low risk and high risk) and incorporated them into the stage trajectory model. Transition intensities between PrI states were estimated and hazard ratios (HRs) and 95% confidence Intervals (Cis) were calculated to evaluate the change in probability of transitions for each covariate. Hazard ratios were calculated by exponentiating the estimated covariate effects on the log-transition intensities of a multi-state model. We also evaluated associations between PrI stages and the Braden Scale and all sub-component using Spearman’s rank correlation coefficient, a nonparametric measure of rank correlation. Both ρ and p values were calculated.
We estimated the impact of age, sex, and race. We converted these factors into binary variables and included them in the model. We codified race factor as binary variable: White or non-White. We were not able to further categorize non-White population due to small sample size.
Data preprocessing and model development was conducted using R (version 3.6.3). Multi-state model was developed using R package MSM (version 1.7.1).
RESULTS
Baseline characteristics of the initial study cohort
We developed a cohort of 29,475 patients aged 65 or above with at least two records of PrI documented from May 2015 to January 2023 from five MGB hospitals. Patients were divided into four groups according to PrI anatomical locations, which include coccyx, buttocks, sacrum, and heel. The mean age of the total cohort was 70.7 years old. There were 79.5% white patients, while African American patients were 9.0%. Females accounted for 43.6% of the total study cohort (Supplementary Table S1).
Distribution of pressure injury anatomical locations and stages
Within each PrI location group, we further divided patients into five PrI staging groups, including stage 1, 2, 3, 4, and unstageable PrI (Fig. 1). We extracted PrI records from the structured field of EHR database. The location of the injury was from the data field of “Injury Description.” The stage information was from “Measure Value.” The stages were evaluated by both hospital floor nurses and wound specialist nurses.
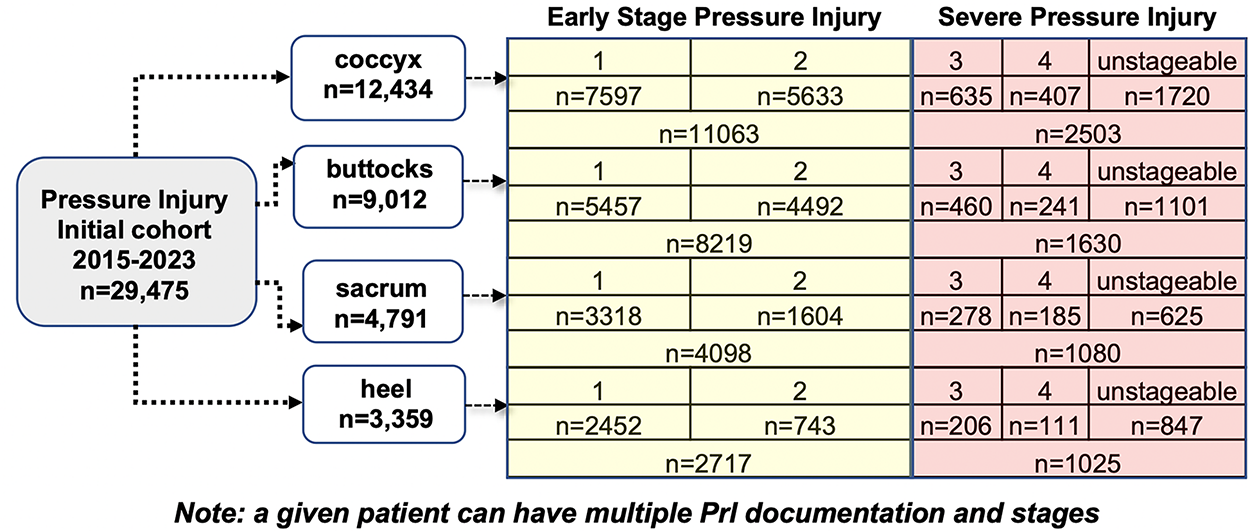
Summary of anatomical locations and all stage groups in EHR dataset. HER, electronic health record.
We performed comparative analysis among these groups and several patterns were identified: (1) Patients with PrIs in heel location had a lower prevalence (n = 3,359), but a higher percentage of severe PrIs (30.5%), as compared with other locations (18.1% to 22.5%); (2) There was a significant difference in median age among different injury location groups (adjusted p value less than 0.001); (3) The median age of Black or African American patients when a PrI was first documented was significantly lower than both White and Asian identities (adjusted p value less than 0.001) (Supplementary Table S2 and Fig. S1).
Patient-level trajectory model and dynamic transition patterns for pressure injury stages
Following data cleaning steps described in the section Methods, we obtained 1,342, 1,085, 612, and 435 patients with longitudinal stage records for locations of coccyx, buttocks, sacrum, and heel groups, respectively. Both inpatient and outpatient encounters were extracted and included patients had at least two PrI records at distinct time points. These patients were used for trajectory model development (model design pipeline summarized in Fig. 2A). We defined a transition as a change from one stage to the distinct following stage and calculated transition frequencies in all four location groups. The length of the follow-up period from the point of transition was restricted to 90 days for each patient. In total, there were 419 transitions in the coccyx group. In the other three groups, the total transition numbers were: 302 (buttocks), 142 (sacrum), and 77 (heel) (Fig. 3). The transition between stages 1 and 2 were the most frequent in all groups. The median of period of transition between stages was 1 day (IQR = 0, 14). We further estimated transition intensities between stages (Table 1). We observed patterns as follows: (1) In all four locations, patients in stage 1 were more likely to transition to stage 2 than to transition to severe stages (stage 3, 4, or unstageable); (2) In all four locations, patients in stage 2 were more likely to transition to severe stages. The likelihood of this transition was higher than patients transitioning from stage 1 to stage 2; and (3) There were location-dependent variations for transition patterns. We also estimated transition intensities by including Braden Scale and its 6 components in the model and observed similar pattern (Supplementary Table S3).
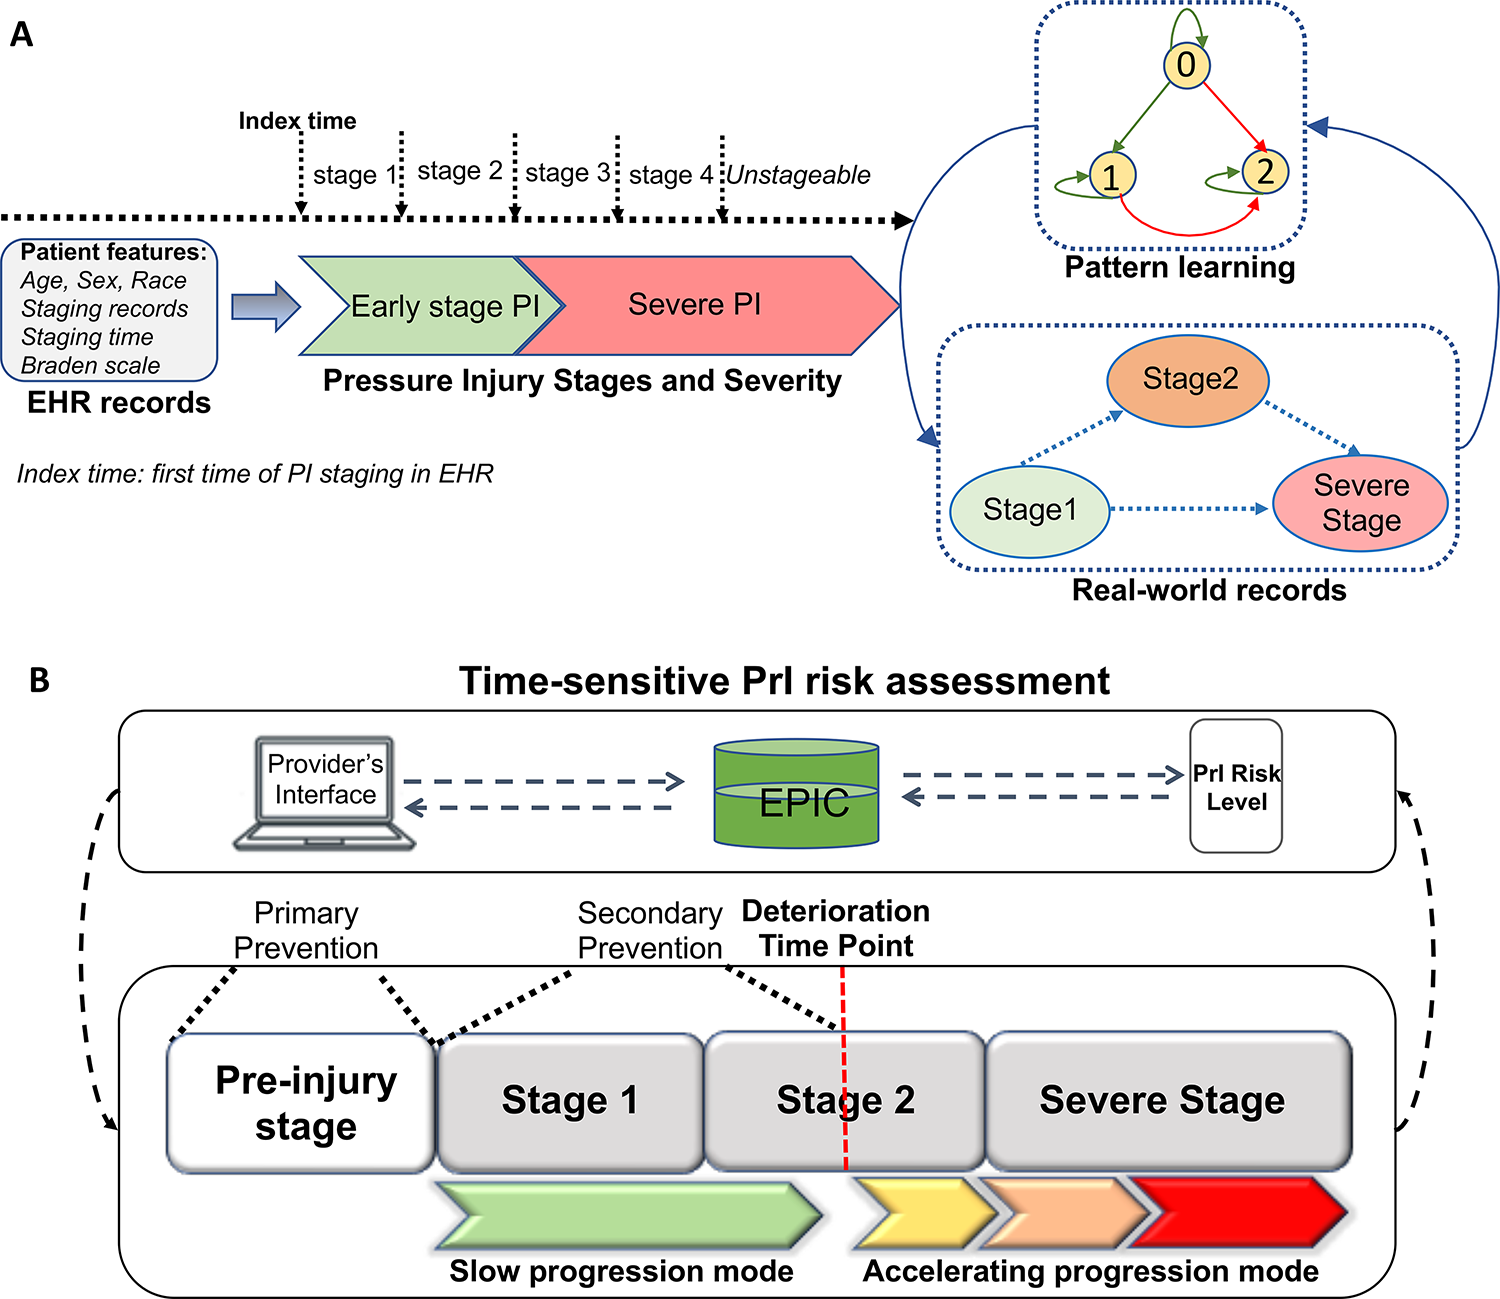
Trajectory model development pipeline and integration mock-up for clinical workflows.
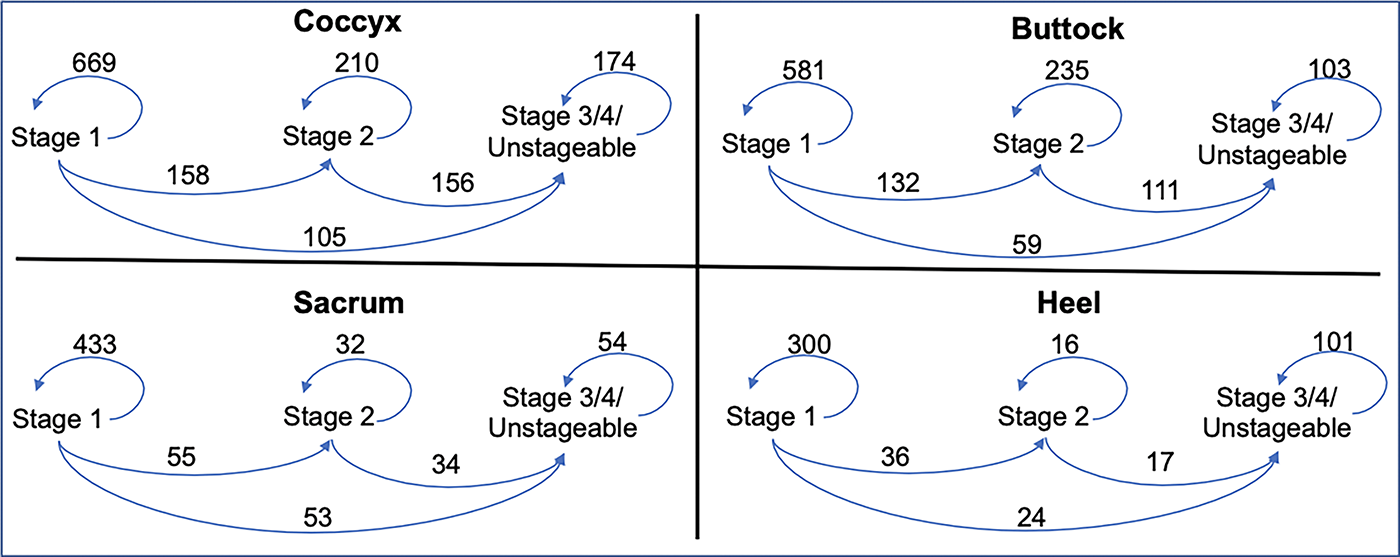
Observed transition frequencies between PrI stages. PrI, pressure injury.
Estimated transition intensities between PrI stages
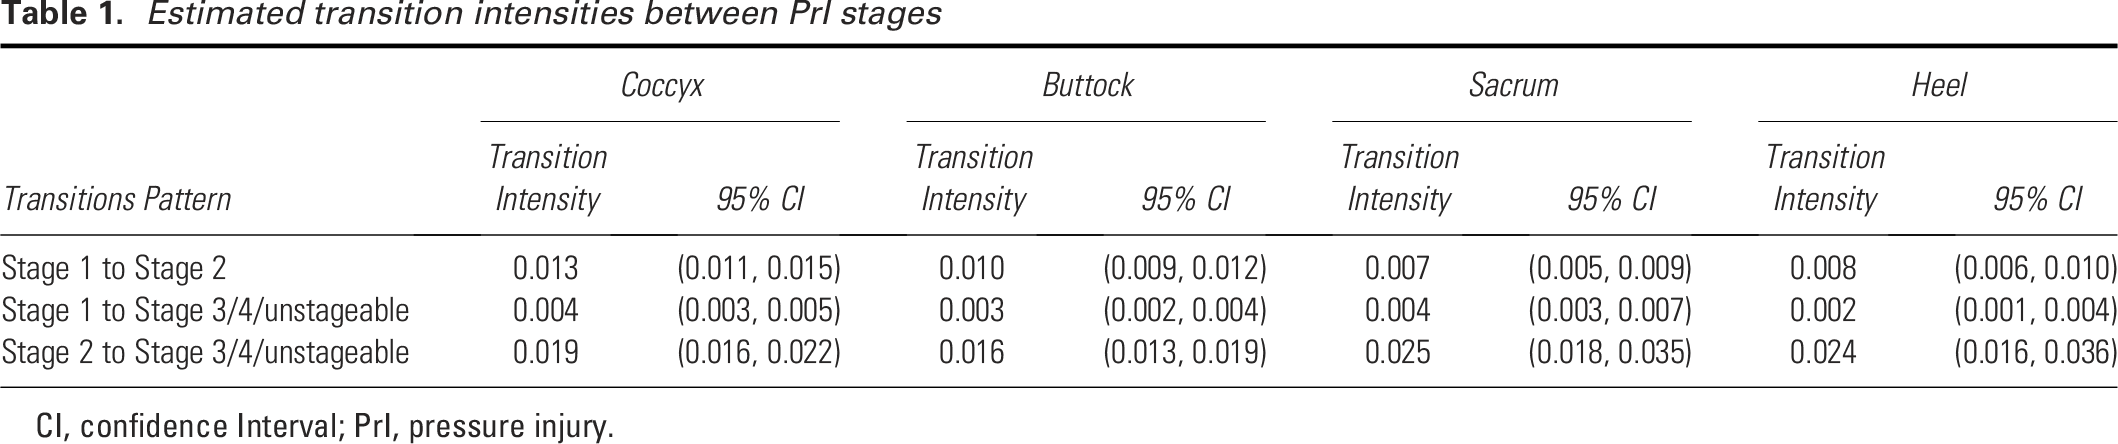
CI, confidence Interval; PrI, pressure injury.
Impact of Braden scale and demographic factors on pressure injury stage transitions
We estimated the association of the Braden Scale and its six components as covariates on stage transitions. As summarized in Table 2, a low-risk Braden Scale score was significantly associated with less likelihood of transitions from stage 2 to severe stages (OR: 0.609, 95% CI: 0.413–0.901) in Buttocks group and from stage 1 to severe stages (OR: 0.222, 95% CI: 0.065–0.753) in Sacrum group. Several significant associations were identified in sub-components, including activity, moisture, friction and shear with transitions from stage 2 to severe stages. All significant associations were identified for transitions to severe stages, but not for the transition between stages 1 to stage 2. We also evaluated associations of stages as static measures with the Braden Scale and its six components. A general significant association pattern was observed (Supplementary Table S4).
Summary of impacts of Braden Scale and Sub-components on PrI transitions
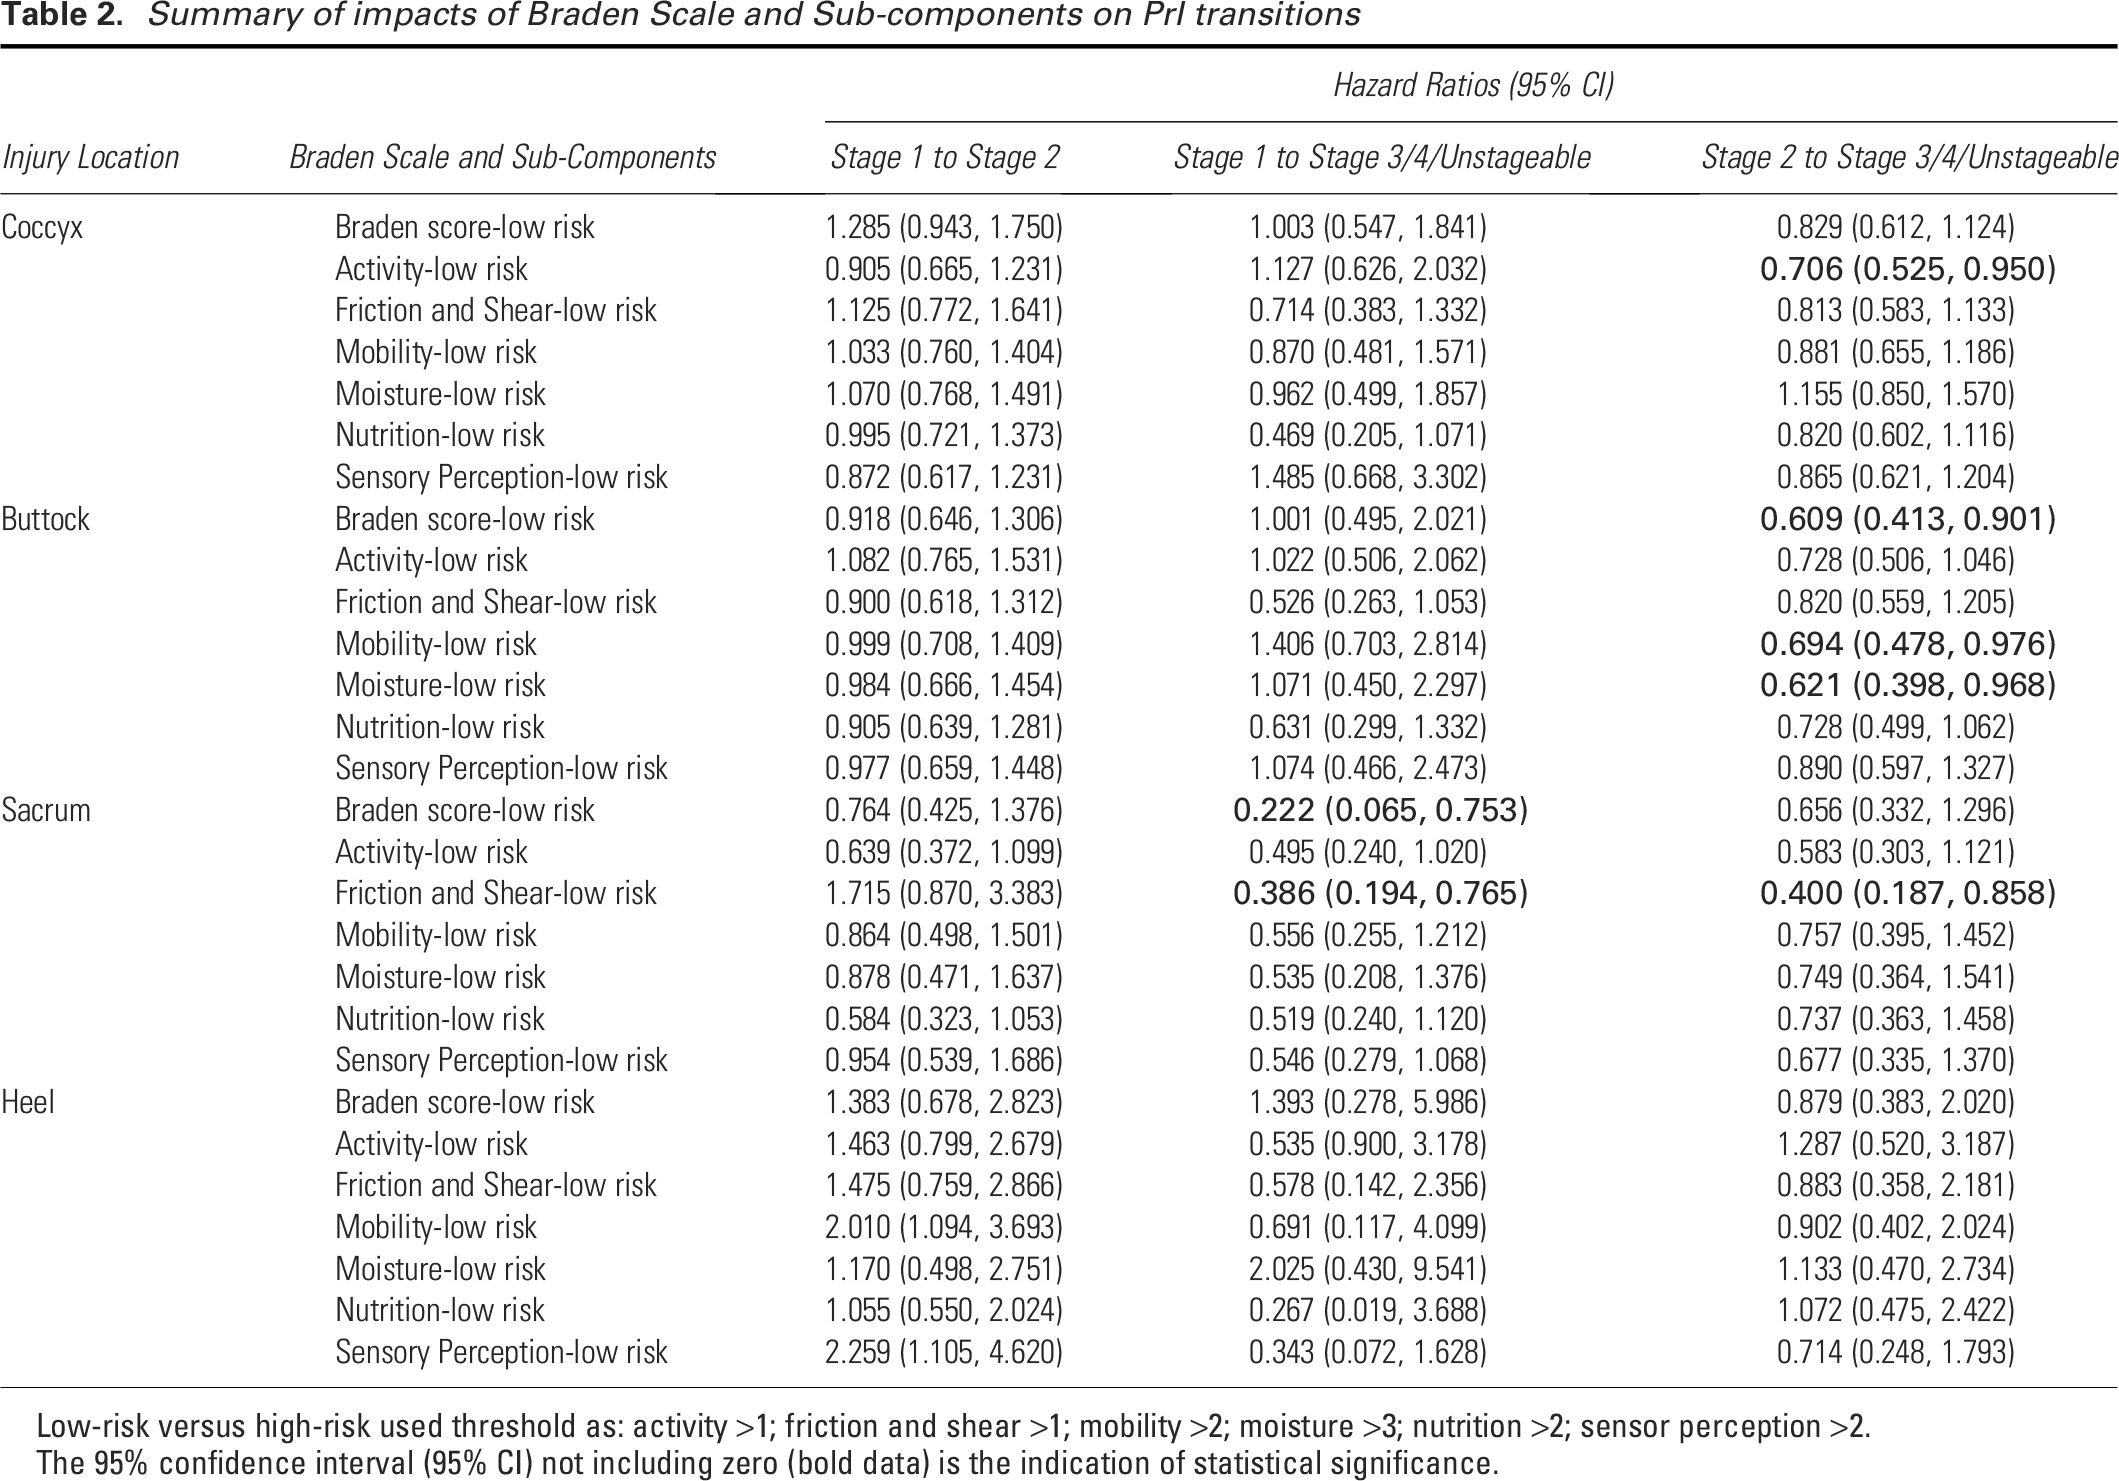
Low-risk versus high-risk used threshold as: activity >1; friction and shear >1; mobility >2; moisture >3; nutrition >2; sensor perception >2.
The 95% confidence interval (95% CI) not including zero (bold data) is the indication of statistical significance.
In addition, we did not identify significant associations between age or sex with stage transitions, while we observed a significant association between race-White and stage transition (stage 1 to 3) in coccyx and sacrum groups (OR: 0.522, 95% CI: 0.275–0.992; OR: 0.395, 95% CI: 0.196–0.798) (Supplementary Table S5).
Pattern validation in more recent patient cohort
We developed a smaller patient cohort from February 2023 to June 2024. With the same processing steps, we obtained 400, 428, and 322 patients for locations of coccyx, buttocks, and sacrum groups, respectively. The heel injury group was not developed due to too few injury records. We observed similar transition intensity in all three injury groups, as we observed in main dataset (Supplementary Table S6). In addition, low-risk Braden Scale score was significantly associated with less likelihood of transitions from stage 2 to severe stages (OR: 0.185, 95% CI: 0.035–0.987) in this dataset (Supplementary Table S7).
Transition pattern for deep tissue injury
For trajectory model including stage 1, 2, and DTI across 4 injury groups, a higher transition intensity was observed between stage 2 and DTI but only in heel injury group, suggesting a different transition underlying mechanism for DTI (Supplementary Table S8).
DISCUSSION
We developed and validated a novel multi-state trajectory model for PrI stage transitions using a multi-hospital dataset. Among our findings, we identified an interesting pattern indicating that stage 2 serves as a “gateway state” during the stage trajectory from an early to a severe stage PrI. These results suggest that CDS is needed to identify patients at risk for PrI and patients with stage 1 PrIs, as there is a potential progression threshold at stage 2. The transition intensity derived from the trajectory model is crucial to helping clinicians take timely actions to prevent stage 1 PrIs (primary prevention) and to prevent worsening of the patient condition of patients with early-stage PrIs (secondary prevention). Upon reaching a stage 2 PrI, patient status will switch from a slow to an accelerating progression mode, and prevention of severe PrI is more difficult. Identifying this switch point in real-time practice and integrating stage trajectory-derived patient PrI risk score into CDS may be critical for informing interventions in a timely fashion (Fig. 2B). However, the current manual risk assessment method using the Braden Scale and other heuristic tools is lacking due to the cross-sectional nature of its measurements.17–20 We estimated the association of the Braden Scale and its six components as covariates on stage transitions and found no significant associations for the transition between stages 1 to stage 2, demonstrating its ineffectiveness for early-stage prevention. We also observed a limited contribution of Braden Scale and its sub-components to transition pattern estimation, although these measures are generally significantly associated with stages if we do not consider transition information. Our findings suggest that new generation PrI risk assessment CDS using time sensitive data is needed for delivering personalized, timely, and effective PrI prevention.
We also explored the transition patterns of deep tissue injury. Interestingly, we did not observe a “gateway” effect of stage 2 across injury location groups as we did for severe injury stage. Unlike other severe PrI stages, DTI can transfer to or be transferred into by all other stages. These one-to-multiple transition patterns may represent a distinct underlying mechanism that is different than the one-direction transitions patterns we modeled in the current study. A better understanding of DTI definition will be needed to further examine its dynamic trajectory patterns. Furthermore, the current stage system may mask intra-stage variability in general. A continuous or semi-continuous measure of PrI status will serve as a better evaluation PrI severity, but this would require the advances of PrI measurement tool.
We observed PrI location and race-dependent variations in our analyses. For example, a high percentage of severe PrIs in the heel location can be attributed to vulnerability of the heel as a high-risk anatomical location in addition to medical comorbidities leading to hypoperfusion. 30 Furthermore, we found that race may impact the age distribution of patients with PrI. Specifically, in our cohort, darker pigmented patients developed PrI at an earlier age, supporting the need for further investigation into why PrIs in the darker skin toned patients are occurring at an earlier age and related disparities. Moreover, race as a covariate could impact stage transitions. These results suggest the importance of more specific subgroup analysis for future PrI research.
The first step in prevention is PrI risk assessment, which serves as the foundation for prevention. A commonly used PrI risk assessment tool, the Braden Scale, 13 uses six patient-level indexes to rate the risk for PrIs, including sensory perception, moisture, activity, mobility, nutrition, and friction and shear. 21 However, the Braden Scale has limitations that emphasize the need for a more data driven approach. The derivation of the Braden Scale indexes was based on literature review and expert consensus whereby experts agreed on factors and associated weights to be included in the final model to estimate prognostic strength for PrI incidence. 22 However, the Braden Scale and other commonly used PrI risk assessment tools were developed without the support of advanced statistical methods. These tools are generally based on nurses’ personal judgement and have limited predictive ability. Multiple studies have demonstrated the relatively poor prediction accuracy of the Braden Scale and its lack of impact on PrI prevention.23–25
An important part of trajectory analysis is identifying covariates which are associated with certain transitions and quantifying their impacts. As noted above, we conducted an analysis to evaluate the Braden Scale, 13 for its performance in stage trajectory settings. Since the Braden Scale score is the sum of 6 subscales reflecting nursing observations of the patient condition. We evaluated the 6 subscales individually and found that all significant associations were related to transitions to severe stages: stage 1 to severe or stage 2 to severe. This implies that the Braden Scale and its sub-components are suboptimal for predicting early-stage PrI transitions. As we have identified stage 2 as a key gateway stage, the relative weaker prediction power of the Braden Scale for transition from stage 1 to stage 2 might limit its value for supporting early PrI prevention. The trajectory model we developed showed the advantages of capturing useful time-dependent information among stage transitions, further highlighting the need for data-driven CDS. There is also variation among the 6 sub-components for their associations with transitions. For example, no significant associations were found for nutrition and friction and shear in any transitions, raising questions and concerns about the prediction abilities of these sub-components. 31
Another important flaw of the current PrI risk assessment system is the missingness of temporal information. PrI is a dynamic and evolving condition, with patient status constantly changing. Some changes can happen within hours or days. The NPIAP staging system has been widely used to describe PrI severity, but no information is available about how and when patients transition from one stage to another. While the NPIAP staging system may have limitations, it is the currently accepted staging system and the base for PrI clinical guidelines. It is also the standard by which nurses currently document PrIs in many organizations so we did leverage this standard in our work. However, limitations of the NPIAP staging system underscores the need for development of a data-drive based CDS. Using an oversimplified ‘static’ approach to describe a complex ‘dynamic’ process can lead to slow and delayed responses for treatment. An important relevant clinical fact is that all PrIs start as early-stage injury and can quickly develop into more severe injury in some patient populations. Once reaching a severe stage, many patients do not fully recover. 26 Missing the treatable and reversable time window when PrIs are still at an early stage can create challenges for clinical decision-making, leaving few actionable options. Next-generation PrI risk assessment CDS tools that address these limitations and better reflects patients’ dynamic status in real-time are urgently needed. Access to CDS tools in the EHR was identified among the three largest gaps preventing evidence-based PrI practices and thus perpetuating the problem of preventable PrIs and associated outcomes. 4
Several recent studies utilized trajectory modeling to learn the progression pattern of chronic disease conditions and showed promising results related to cancer, diabetes, and heart failure.27–29 Trajectory models can learn probabilistic trends between defined disease states over time and its output provides some key measurements, such as transition intensity, to statistically quantify the likelihood of transition from one state to another. Using this method for PrI patients, the model output will inform providers of the critical time point of patient’s transition to more severe stages, so providers can proactively treat patients to prevent these transitions. To our knowledge, this technique has not been applied to PrI risk assessment and prevention. We obtained a large patient cohort with PrI records from five hospitals during an 8-year period. This provides an opportunity to obtain sufficient patients with different injury locations and stages to investigate location-specific PrI occurrence and stage transition patterns. As the next step, we will develop time-sensitive PrI assessment application utilizing stage transition information. We will further validate the developed tool in other health care systems.
Limitations
This study has several limitations. First, the study cohort was derived from a single health care system-Mass General Brigham, which might not fully reflect patterns in other institutions. But our study cohort was based on EHR records from 5 independent hospitals, suggesting a decent generalizability of our model. We will further validate our model in other healthcare systems in future studies. Second, several rules were made during the feature cleaning pipeline for trajectory modeling. These rules were guided by experts and we believe they represent our best understanding based on domain knowledge. Third, our models used NPIAP stages to define states, which is the commonly used standard. The true state may include more than just 5 stages, meaning each stage could represent multiple states, even as a continuous status. A more granular staging system is needed for developing a more accurate trajectory model. Using data-driven approaches over time may inform a more granular staging system. This has not been well studied and will be important to inform the next generation of PrI CDS. Fourth, patients’ medical history (e.g., chronic diseases) could affect transition patterns. We were not able to include these variables in the current trajectory model due to the large amount of diagnosis needed. We will investigate the impact of these variables in future studies. Fifth, we were not able to measure inter-assessor reliability of stage data in the current study, which requires better understanding of stage definitions. We will further evaluate reliability of staging with the advances of stage measurement in the field.
CONCLUSION
In this study, we developed a novel multi-state trajectory model to analyze and quantify PrI stage transition patterns using EHR data from multiple hospitals. Our results highlight the lack of important time-sensitive information in current PrI risk assessment tools. Dynamic PrI risk screening CDS is urgently needed to facilitate personalized, timely, and effective prevention.
AUTHORS’ CONTRIBUTIONS
P.C.D. and W.S. initiated the study and designed the project. W.S., M.-J.K., L.L., V.K.B., M.S., and G.L. conducted data analysis. P.C.D., D.W.B., T.M., P.W., S.C., L.Z., S.L., D.F., L.M., W.G.-F., B.M., D.L.C., S.C., L.G., and J.M. provided important clinical and technique opinions. P.C.D. and D.W.B. were involved in study supervision. All the authors have participated in the article development and are accountable for integrity of this work.
Footnotes
ACKNOWLEDGMENTS AND FUNDING SOURCES
This study was funded by CRICO. The funder had no role in the design and conduct of the study; collection, management, analysis, and interpretation of the data; preparation, review, or approval of the article; or decision to submit the article for publication.
ETHICS APPROVAL
This project was reviewed and approved by the Mass General Brigham Human Subjects Committee.
DATA SHARING STATEMENT
The datasets generated during the current study are not publicly available due to hospital IRB regulation and patient privacy.
AUTHOR DISCLOSURE AND GHOSTWRITING
The authors have no conflicts of interest to declare. The content of this article was thoroughly written by the authors listed. No ghostwriters were used to write this article.
ABOUT THE AUTHORS
Supplemental Material
Abbreviations and Acronyms
References
Supplementary Material
Please find the following supplemental material available below.
For Open Access articles published under a Creative Commons License, all supplemental material carries the same license as the article it is associated with.
For non-Open Access articles published, all supplemental material carries a non-exclusive license, and permission requests for re-use of supplemental material or any part of supplemental material shall be sent directly to the copyright owner as specified in the copyright notice associated with the article.