
Abstract
Objective:
The expected increase in age-related health care costs over the coming decades underscores the need to characterize the effects of biological aging in our cells and tissues. Our objective is to use in vivo multiphoton microscopy (MPM) to find endogenous biomarkers of skin aging.
Approach:
MPM was performed on the skin of 2- and 21-month-old mice to measure the autofluorescence of metabolic cofactors, nicotinamide adenine dinucleotide (NADH) and flavin adenine dinucleotide (FAD), and second-harmonic generation signal from collagen. A suite of quantitative biomarkers with sensitivity to age-related changes in bioenergetic demands, mitochondrial organization, and collagen composition and organization was evaluated using these optical sources of contrast.
Results:
An optical redox ratio of FAD/(NADH + FAD) autofluorescence, NADH fluorescence lifetime imaging, and mitochondrial fractal dimension measurements indicated that aged keratinocytes have more fragmented mitochondria that undergo less catabolism of carbon substrates. Analysis of the dermal regions indicated that aged collagen has more nonenzymatic cross-links and has a more fragmented organization.
Innovation:
This study identifies a suite of biomarkers from label-free MPM sensitive to intrinsic aging and provides the first in vivo demonstration of sensitivity to age-dependent metabolic changes in skin through multiple independent optical parameters.
Conclusion:
Our results demonstrate that surrogate markers of metabolic function, mitochondrial organization, collagen cross-linking, and fiber organization are sensitive to a loss of homeostasis with advanced age and may be used in future studies to longitudinally assess the progression of aging.
Kyle P. Quinn, PhD

INTRODUCTION
Advanced age poses the highest risk factor for chronic diseases and is related to approximately 100,000 daily deaths worldwide. 1 Aging will increasingly burden the health care industry as the worldwide proportion of the population over the age of 60 years is expected to grow from 11% to 22% by 2050. 1 Over the last few decades, progress has been made in prolonging lifespan, but extending the time without chronic diseases, that is, the health span, has been more challenging. 2 Dysfunction in mitochondria has been tied to aging and cell senescence for over a half century now.3,4 This dysfunction leads to elevated oxidative stress, DNA damage, and impaired autophagy and mitophagy.5,6 Furthermore, glucose and its metabolites react with proteins over time, leading to an accumulation of advanced glycation end products (AGEs), which can alter the structure and function of proteins and lead to changes in the organization and remodeling of the extracellular matrix (ECM) with advanced age.7,8 Collectively, it is well understood that mitochondria and cellular metabolism play a key role in aging, but we have yet to fully elucidate these relationships due to a lack of quantitative biomarkers sensitive to the hallmarks of aging.
Multiphoton microscopy (MPM) is a nondestructive high-resolution imaging technique that is well-suited to study aging as it can allow for the visualization of both mitochondria and ECM in 3D tissues.9–12 Relying on short laser pulses of near-infrared light, there are several advantages to MPM over standard fluorescence microscopy, particularly for in vivo applications, such as intrinsic depth sectioning, deeper light penetration, and minimal photodamage. MPM has been used extensively to image the endogenous fluorescence of reduced nicotinamide adenine dinucleotide (NADH) and flavin adenine dinucleotide (FAD) through two-photon excited fluorescence (TPEF).9,13 NADH and FAD are electron carriers that are essential to cell metabolism, and because NADH only fluoresces in its reduced form while FAD only fluoresces in its oxidized form, metabolic activity can be measured through an optical redox ratio of FAD/(NADH + FAD) autofluorescence intensities.9–11,13–16 This optical redox ratio has been shown to be sensitive to the relative balance of oxidative phosphorylation to the catabolism of carbon substrates, which fluctuates depending on the energetic demand of cells.9–11,13–16 Hypoxia, proliferation, and differentiation have been linked to a decrease in the redox ratio as NADH levels increase to facilitate glucose catabolism and the biosynthesis of new macromolecules.10,11,15,16 NADH autofluorescence can also be quantified with fluorescence lifetime imaging microscopy (FLIM), which measures the time between excitation and emission. This intensity-independent approach to assess metabolism has sensitivity to the fraction of free or protein-bound NADH.13,17 As with the optical redox ratio, studies suggest that the fraction of bound NADH will often decrease during hypoxia and increased biosynthesis.10,11,15 Our group recently used NADH and FAD autofluorescence, as well as NADH FLIM, to longitudinally monitor the skin wound healing of aged mice and to elucidate the role of keratinocyte metabolism 11 ; however, no study has assessed whether keratinocyte metabolism in intact skin changes with age. We expect that quantifying age-related changes in metabolism from intact skin can assist in understanding the biology of aging, predicting wound healing and other health outcomes, and providing personalized care.18,19
In addition to measuring cellular metabolism, high-resolution label-free MPM can be used to quantify cell and tissue organization. Mitochondrial structure can also be visualized using NADH autofluorescence. Mitochondria, like many biological systems, have been demonstrated to organize in scale-invariant patterns, described as fractals. A number of studies have used NADH autofluorescence to measure mitochondrial organization through fractal dimension (FD) analysis.15,20–24 Mitochondrial FD is sensitive to changes in fusion-fission dynamics, and our group found that mitochondrial FD changed in cancer cells that were resistant to radiation. 21 Collagen organization can also be measured during label-free MPM through second-harmonic generation (SHG). SHG is a nonlinear scattering event that is rather specific to fibrillar collagen in most biological systems due to its noncentrosymmetric structure. 25 It has been demonstrated that the collagen SHG signal is weaker when fibrils are less densely packed and morphologically disordered. 26 The density and alignment of collagen fibers can also be evaluated from SHG imaging, which has been shown to change with both mechanical loading and age in skin.12,27–32 In addition, autofluorescence from AGEs in collagen can be assessed through TPEF imaging.33,34 Our group recently demonstrated that excised aged skin exhibits less fiber alignment and increased nonenzymatic cross-link autofluorescence, which was associated with lower skin stiffness. 12 However, to our knowledge, the effect of aging on these MPM-based biomarkers of dermal collagen structure and composition has not been evaluated in vivo.
CLINICAL PROBLEM ADDRESSED
Skin aging is associated with greater fragility and increased susceptibility to disease, injury, and poor healing. 11 Traditional laboratory techniques to study skin aging at the microscale, such as histology and immunohistochemistry, are destructive as they require biopsies. 35 Although there are other noninvasive imaging techniques that are well-suited to image skin at different resolutions, such as ultrasound imaging, optical coherence tomography (OCT), and reflectance confocal microscopy (RCM), these methods lack molecular specificity. OCT has demonstrated utility in observing skin cancer 36 and the vascularization of skin wounds, 37 but it lacks subcellular resolution and is not sensitive to biochemical changes in cells. 38 RCM has sufficient resolution to visualize subcellular structures and collagen fibers, and it has been used to monitor inflammatory skin diseases. 39 However, like OCT, RCM also lacks any molecular specificity and has inferior depth penetration into skin compared with MPM.38,40 Label-free MPM uniquely provides high-resolution imaging capable of measuring mitochondrial structure and function in the epithelium, while also providing highly specific information related to collagen organization.
The goal of this study was to evaluate the effects of advanced age simultaneously on keratinocyte metabolism and dermal collagen structure using in vivo MPM. We hypothesized that in vivo label-free MPM can provide a suite of noninvasive quantitative biomarkers with sensitivity to age-related changes in bioenergetic demands, mitochondrial organization, and collagen composition and organization (Fig. 1). Studying the progressive effects of aging on skin metabolism and structure may provide valuable information that could aid in the innovation of treatments for skin health and antiaging. Furthermore, because skin has a variety of cell types and structural components that can be affected by age, noninvasive MPM monitoring may provide a window into overall health and bioenergetics.8,41–43
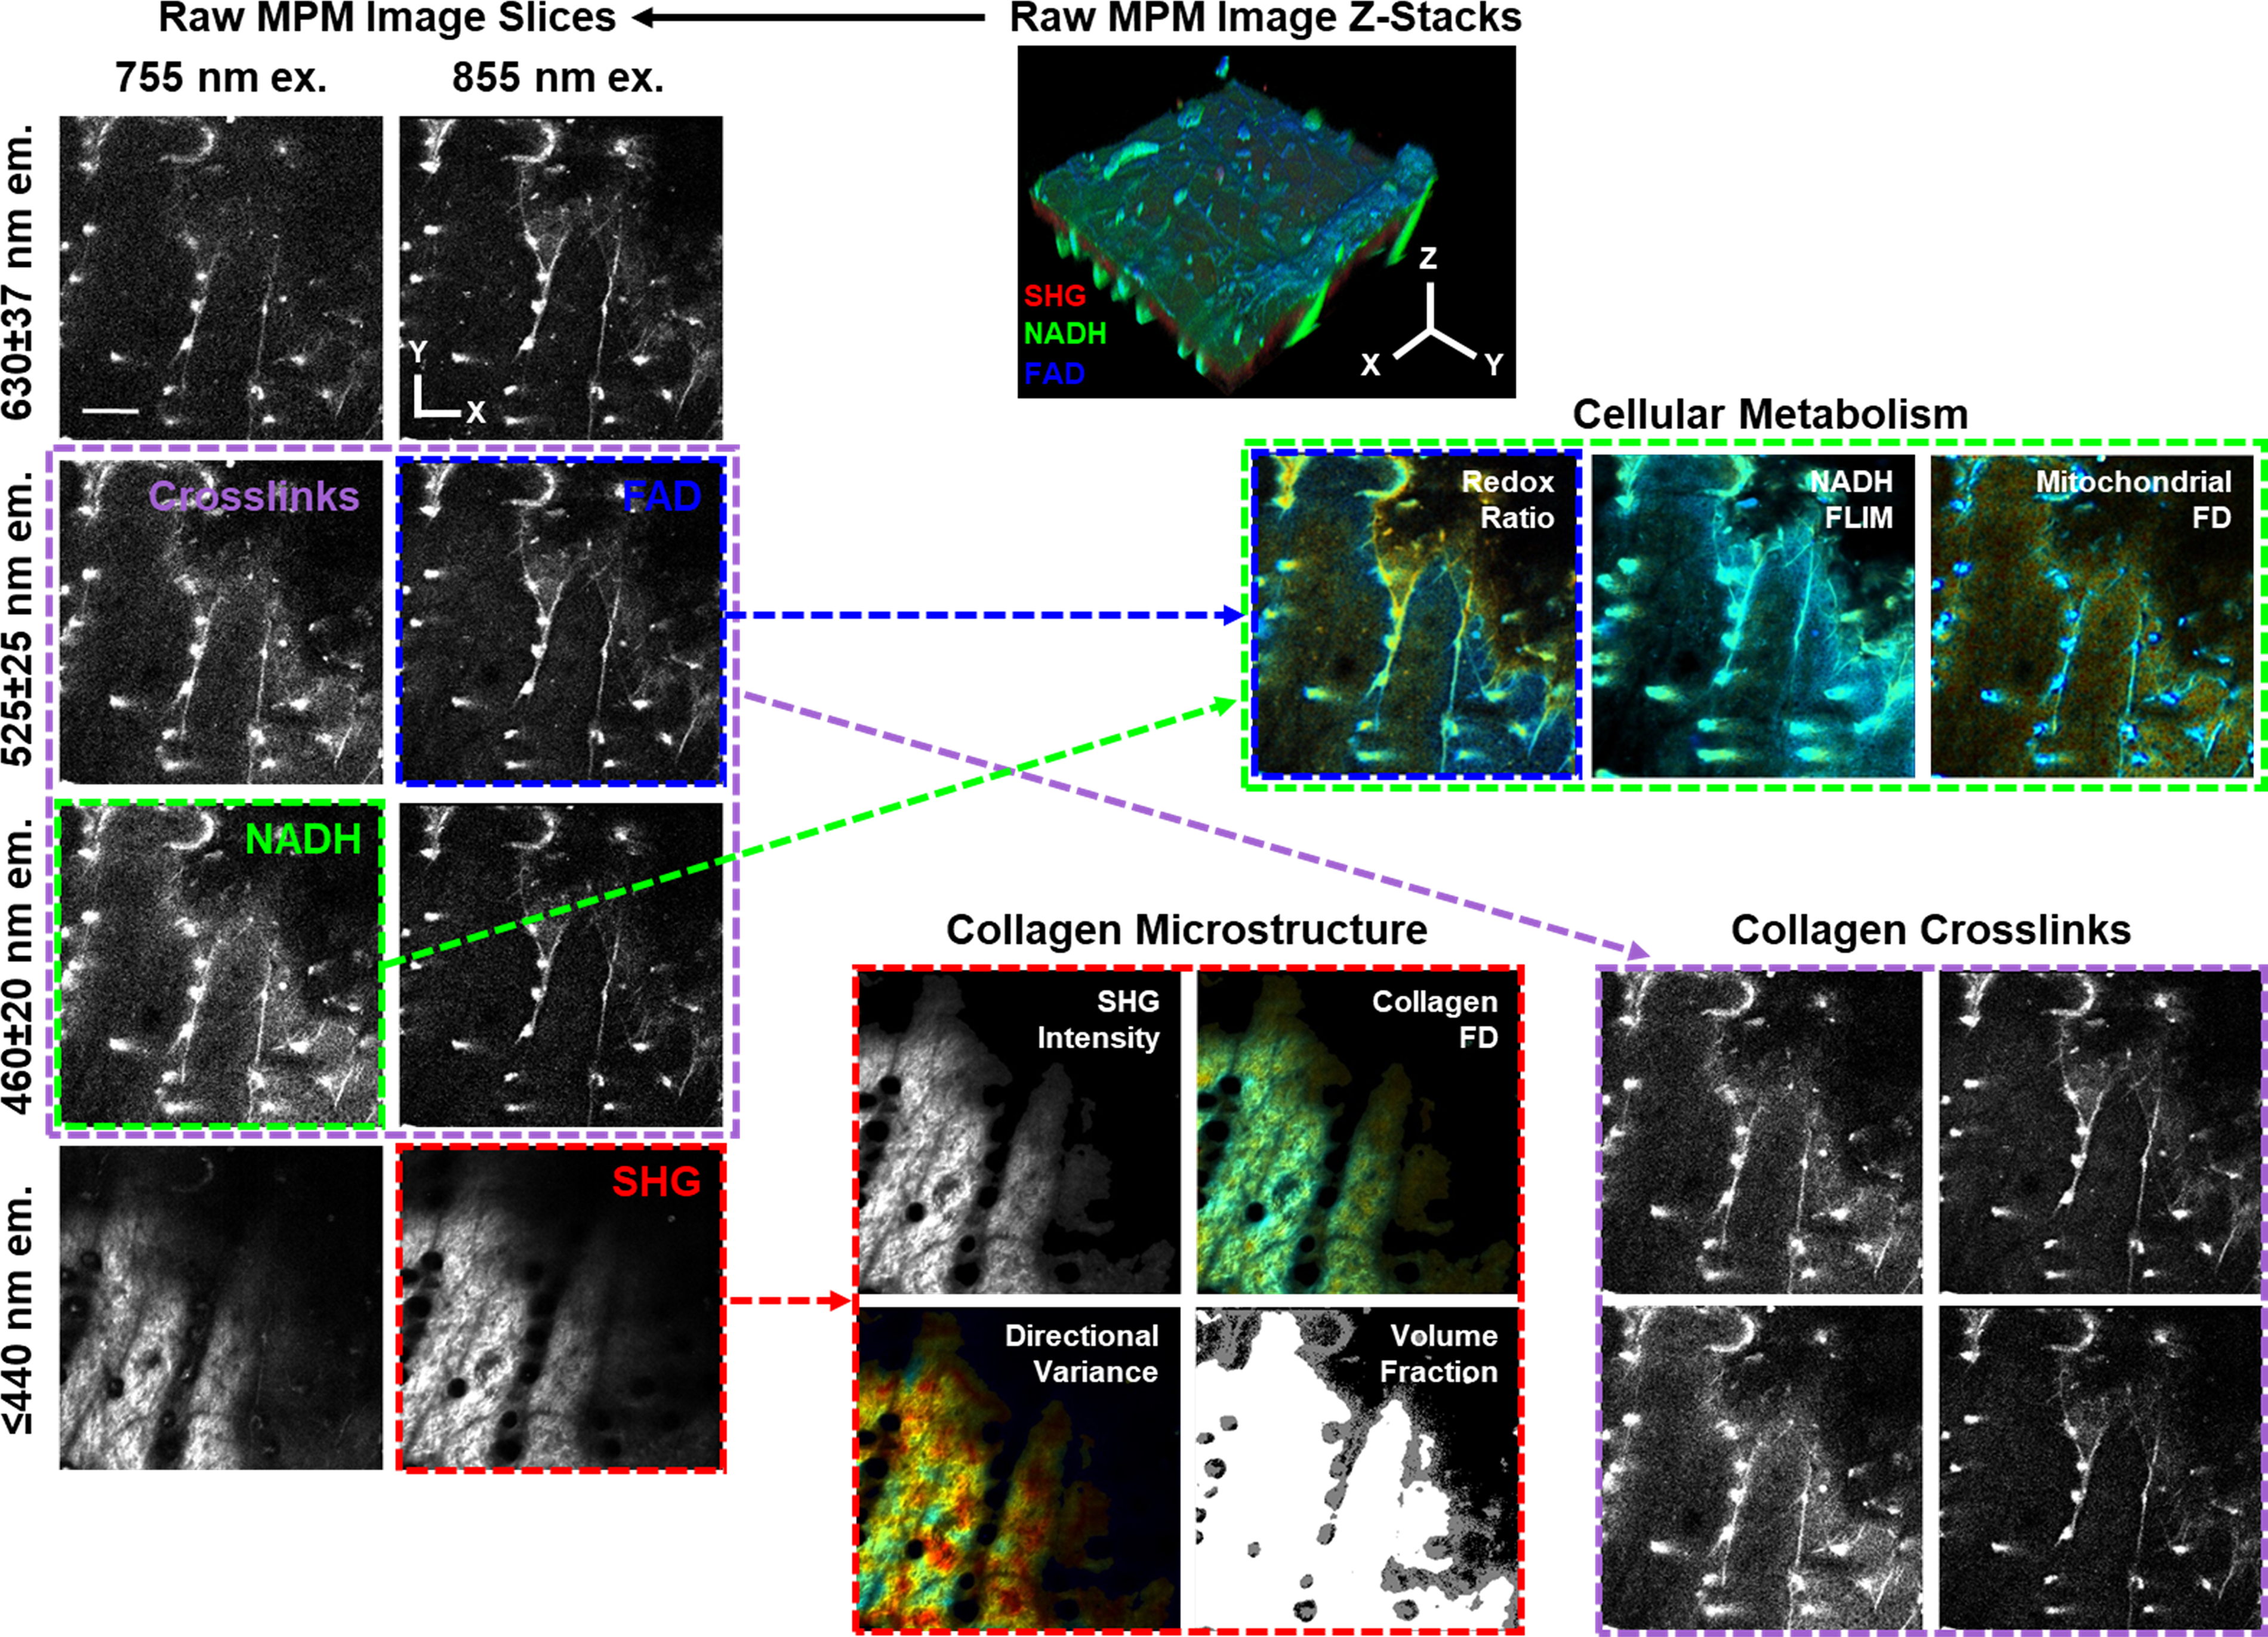
Workflow diagram demonstrating the multiphoton microscopy images that were collected from the skin and how specific excitation and emission channels were used for the analysis of different metabolic and structural outcomes. Scale bar represents 100 µm.
MATERIALS AND METHODS
Animal model of aged skin
Animal procedures were approved under University of Arkansas IACUC Protocol 20059 and were conducted in accordance with the ARRIVE (Animal Research: Reporting of In Vivo Experiments) guidelines. For the duration of the study, animals were housed in the same location and were given the same diet to control for environmental differences. C57BL/6J mice of 2 months (JAX; n = 4; two male and two female) and 21 months (NIA aged colony; n = 7; two male and five female) of age were compared in this study to represent a comparison of skin during adolescence and advanced age. The hair on the head of each mouse was removed using a depilatory agent, Nair, 24 h prior to imaging. To mitigate any effects associated with this depilatory agent, we exposed the skin to Nair for less than 2 min and did not observe any signs of damage or erythema. We did not vary anatomical location of imaging beyond the top of the head in this study. Mice were anesthetized with 3–5% isoflurane for induction and 1–3% for maintenance to immobilize them during imaging.
In vivo MPM
In vivo MPM imaging was performed using a Bruker Ultima Investigator laser scanning microscope (Middleton, Wisconsin) and Ti:Sapphire laser (Spectra-Physics, Santa Clara, California; InsightX3). The mouse head was stabilized and TPEF and SHG images were collected using a 20×, 1.0 NA water-immersion objective (Olympus, Tokyo, Japan) and four GaAsP photomultiplier tubes (Hamamatsu, Shizuoka, Japan; H10770PA-40) with emission filters at ≤440 nm (IDEX Health & Science, West Henrietta, New York; Semrock FFO1-440/SP-25), 460 ± 20 nm (Chroma, Bellows Falls, Vermont; ET460/40m-2p), 525 ± 25 nm (Chroma, Bellows Falls, Vermont; ET525/50m-20), and 630 ± 37 nm (Chroma, Bellows Falls, Vermont; ET630/75m-2p). Imaging was performed at both 755 nm and 855 nm excitation wavelengths to optically isolate NADH (755 nm excitation [ex.]; 460 nm emission [em.]) and FAD (855 nm ex.; 525 nm em.). Collagen SHG signal was collected at 855 nm ex. with the ultraviolet detector (≤430 nm em.), while all other detectors collected collagen cross-link autofluorescence. 44 To ensure the SHG intensity was not polarization angle-dependent, the laser was circularly polarized using an achromatic quarter-wave plate (Thorlabs, Newton, New Jersey; AQWP05M0-980 Ø1/2). Image z-stacks (512 × 512 pixels; 584 × 584 µm; 13-bit depth) were acquired at three random locations on the head of each mouse spanning depths of 100–250 µm with 2–5 µm z-steps, allowing imaging of both epidermis and dermis. To minimize motion artifacts caused by breathing during data collection, 50 sequential z-stacks were acquired for each location with a piezo objective scanner and 8 kHz galvo-resonant scan mirror system to maximize acquisition speed (∼70 ms per image; 3.5 s per stack). In addition, NADH FLIM images at 755 nm excitation and 460 nm emission were acquired at the midpoint of every stack using time-correlated single photon counting hardware (Becker-Hickl GmbH, Berlin, Germany; SPC-150) with an integration period of 120 s. This integration time was chosen with the goal of collecting at least 5,000 photons in order to accurately differentiate between free and protein-bound NADH. 45 The thin geometry of the mouse epidermis, undulations in the dermal-epidermal junction, and the curvature of the cranium ensured that optical cross-sections of the epidermis were present within FLIM images at the midpoint of each stack. Incident laser power never exceeded 75 mW at any depth. When image acquisition was finalized, mice were removed from anesthesia and allowed to recover until alert and responsive.
Image processing of 3D stacks
TPEF images were processed to remove motion artifacts and generate a high-contrast image stack as described previously.10,11 Using Fourier-based cross-correlation of all 50 image stacks, individual image slices were either registered or eliminated. Registered images were averaged at their corresponding depths to develop a final high-resolution stack. On average, 13.8 ± 2.9% of the frames were eliminated for every stack. Fluorescein calibrations based on laser power and detector gain were used to normalize image intensity as in prior studies.10–12 Final normalized image stacks of all acquisition channels (755 nm ex. at 430, 460, 525, and 630 nm em.; 855 nm ex. at 430, 460, 525, and 630 nm em.) were registered together using 3D cross-correlation of the FAD autofluorescence channel (855 nm ex./525 nm em.) and NADH autofluorescence channel (755 nm ex./460 nm em.). All other channels collected at 855 nm excitation underwent the same shift as the FAD channel to create sets and spatially aligned, high-contrast intensity stacks of skin. These registered and normalized intensity images across four emission wavelengths and two excitation wavelengths were then used for all subsequent metabolic and microstructural analysis (Fig. 1).
Generation of masks used to quantify age-related metabolic and structural changes to skin
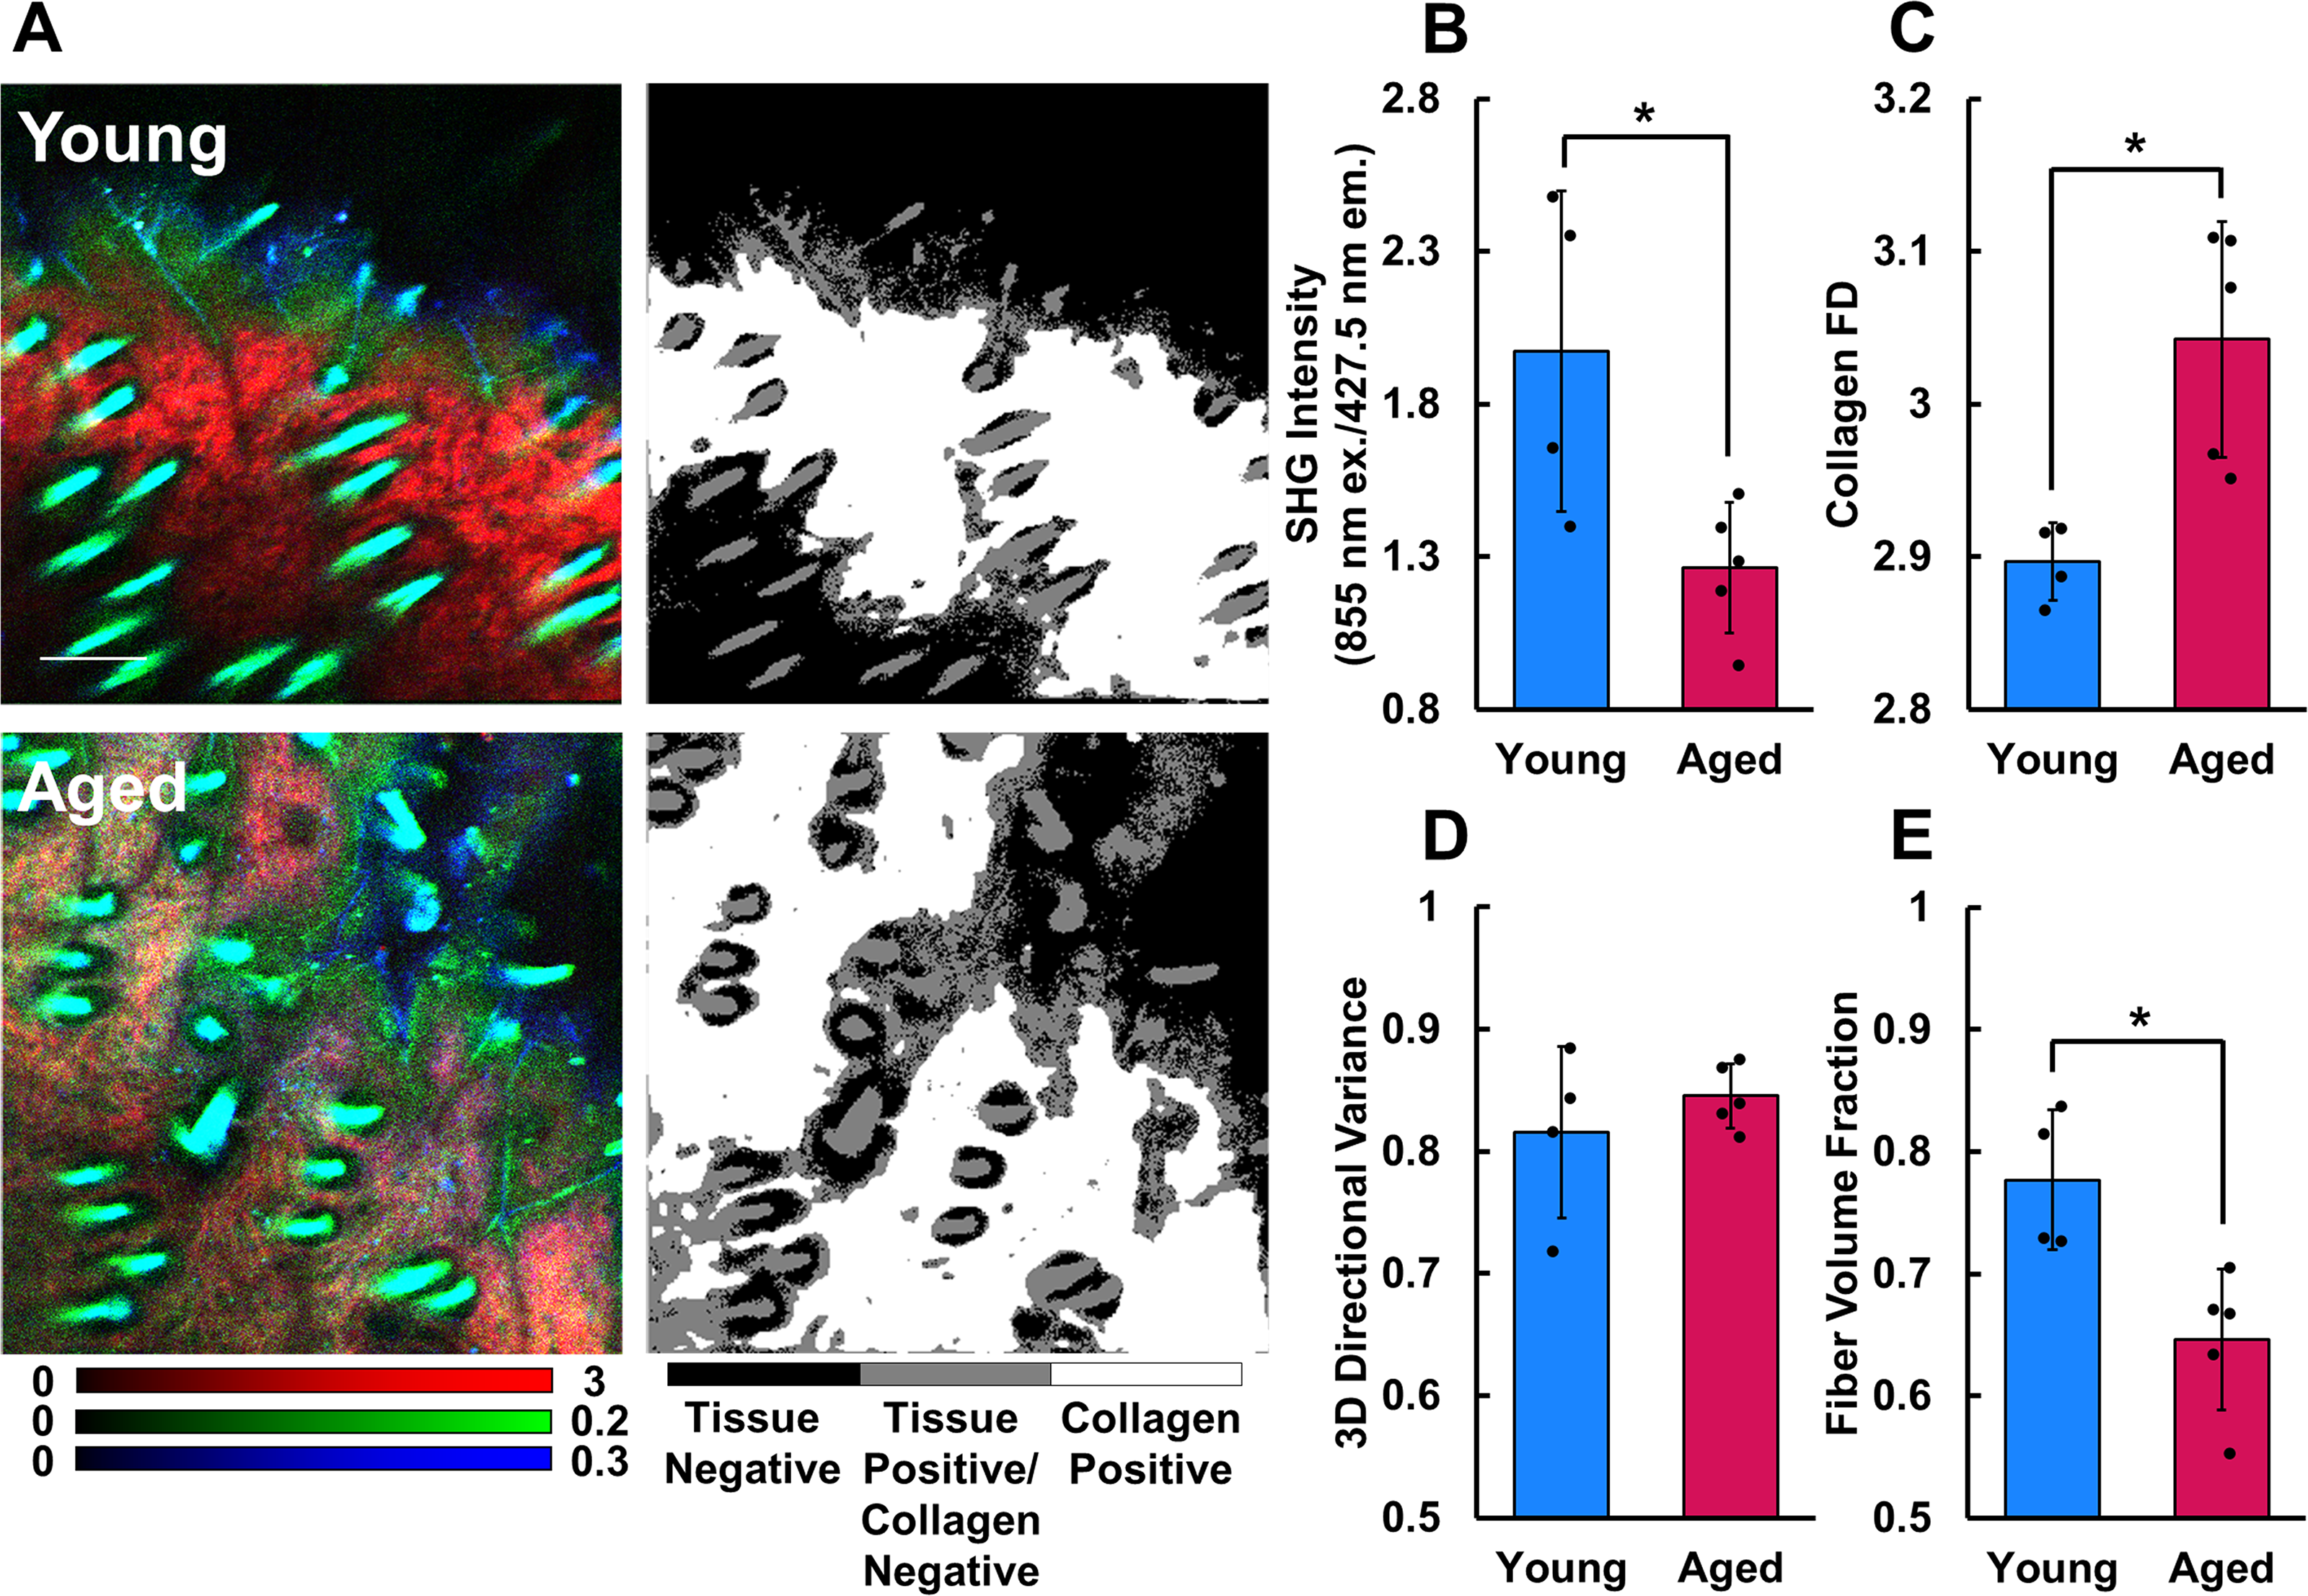
The epidermis and dermis were delineated for accurate measurement of optical biomarkers of aged tissue. The optical redox ratio and mitochondrial FD of keratinocytes were obtained by first manually segmenting the epidermal region from five slices within the processed z-stacks (8/51, 18/51, 25/51, 33/51, 43/51) (Fig. 2A). The epidermis was defined as the region between the dermal SHG signal and the stratum corneum exhibiting a strong keratin autofluorescence signal (Supplementary Fig. S1). While segmenting the epithelium, the autofluorescence of hair shafts and follicles was avoided by ∼5 pixels (Fig. 2A). Similarly, the region containing live keratinocytes within the epidermis was manually segmented in NADH FLIM images (Supplementary Fig. S1). For quantitative measurements of dermal collagen, a collagen-specific mask within the first 100 µm from the tissue surface was created to eliminate regions with reduced SHG and TPEF intensity due to light scattering. To achieve this, first, a tissue-positive mask was created using an intensity threshold of 0.8 on the summed normalized intensity from all channels. The shallowest depth that contained >5% of tissue-positive pixels was marked for each stack. Then, progressing deeper into the stack, the depth containing the first tissue-positive pixel at each x–y location was noted. A 3D tissue-positive mask was created that spanned a 100 µm depth from the first positive pixel at each x–y location (Fig. 5A). To identify regions containing collagen fibers, a collagen-positive mask was generated where pixels exceeded a normalized SHG intensity threshold of 0.63 (Fig. 5A). To ensure these regions did not contain any hair shaft autofluorescence, pixel locations within the summed TPEF channels that surpassed a normalized intensity threshold of 1.065 were removed from the collagen-positive mask. Pixels contained within both the tissue-positive mask and collagen-positive mask were used for subsequent dermal analysis.
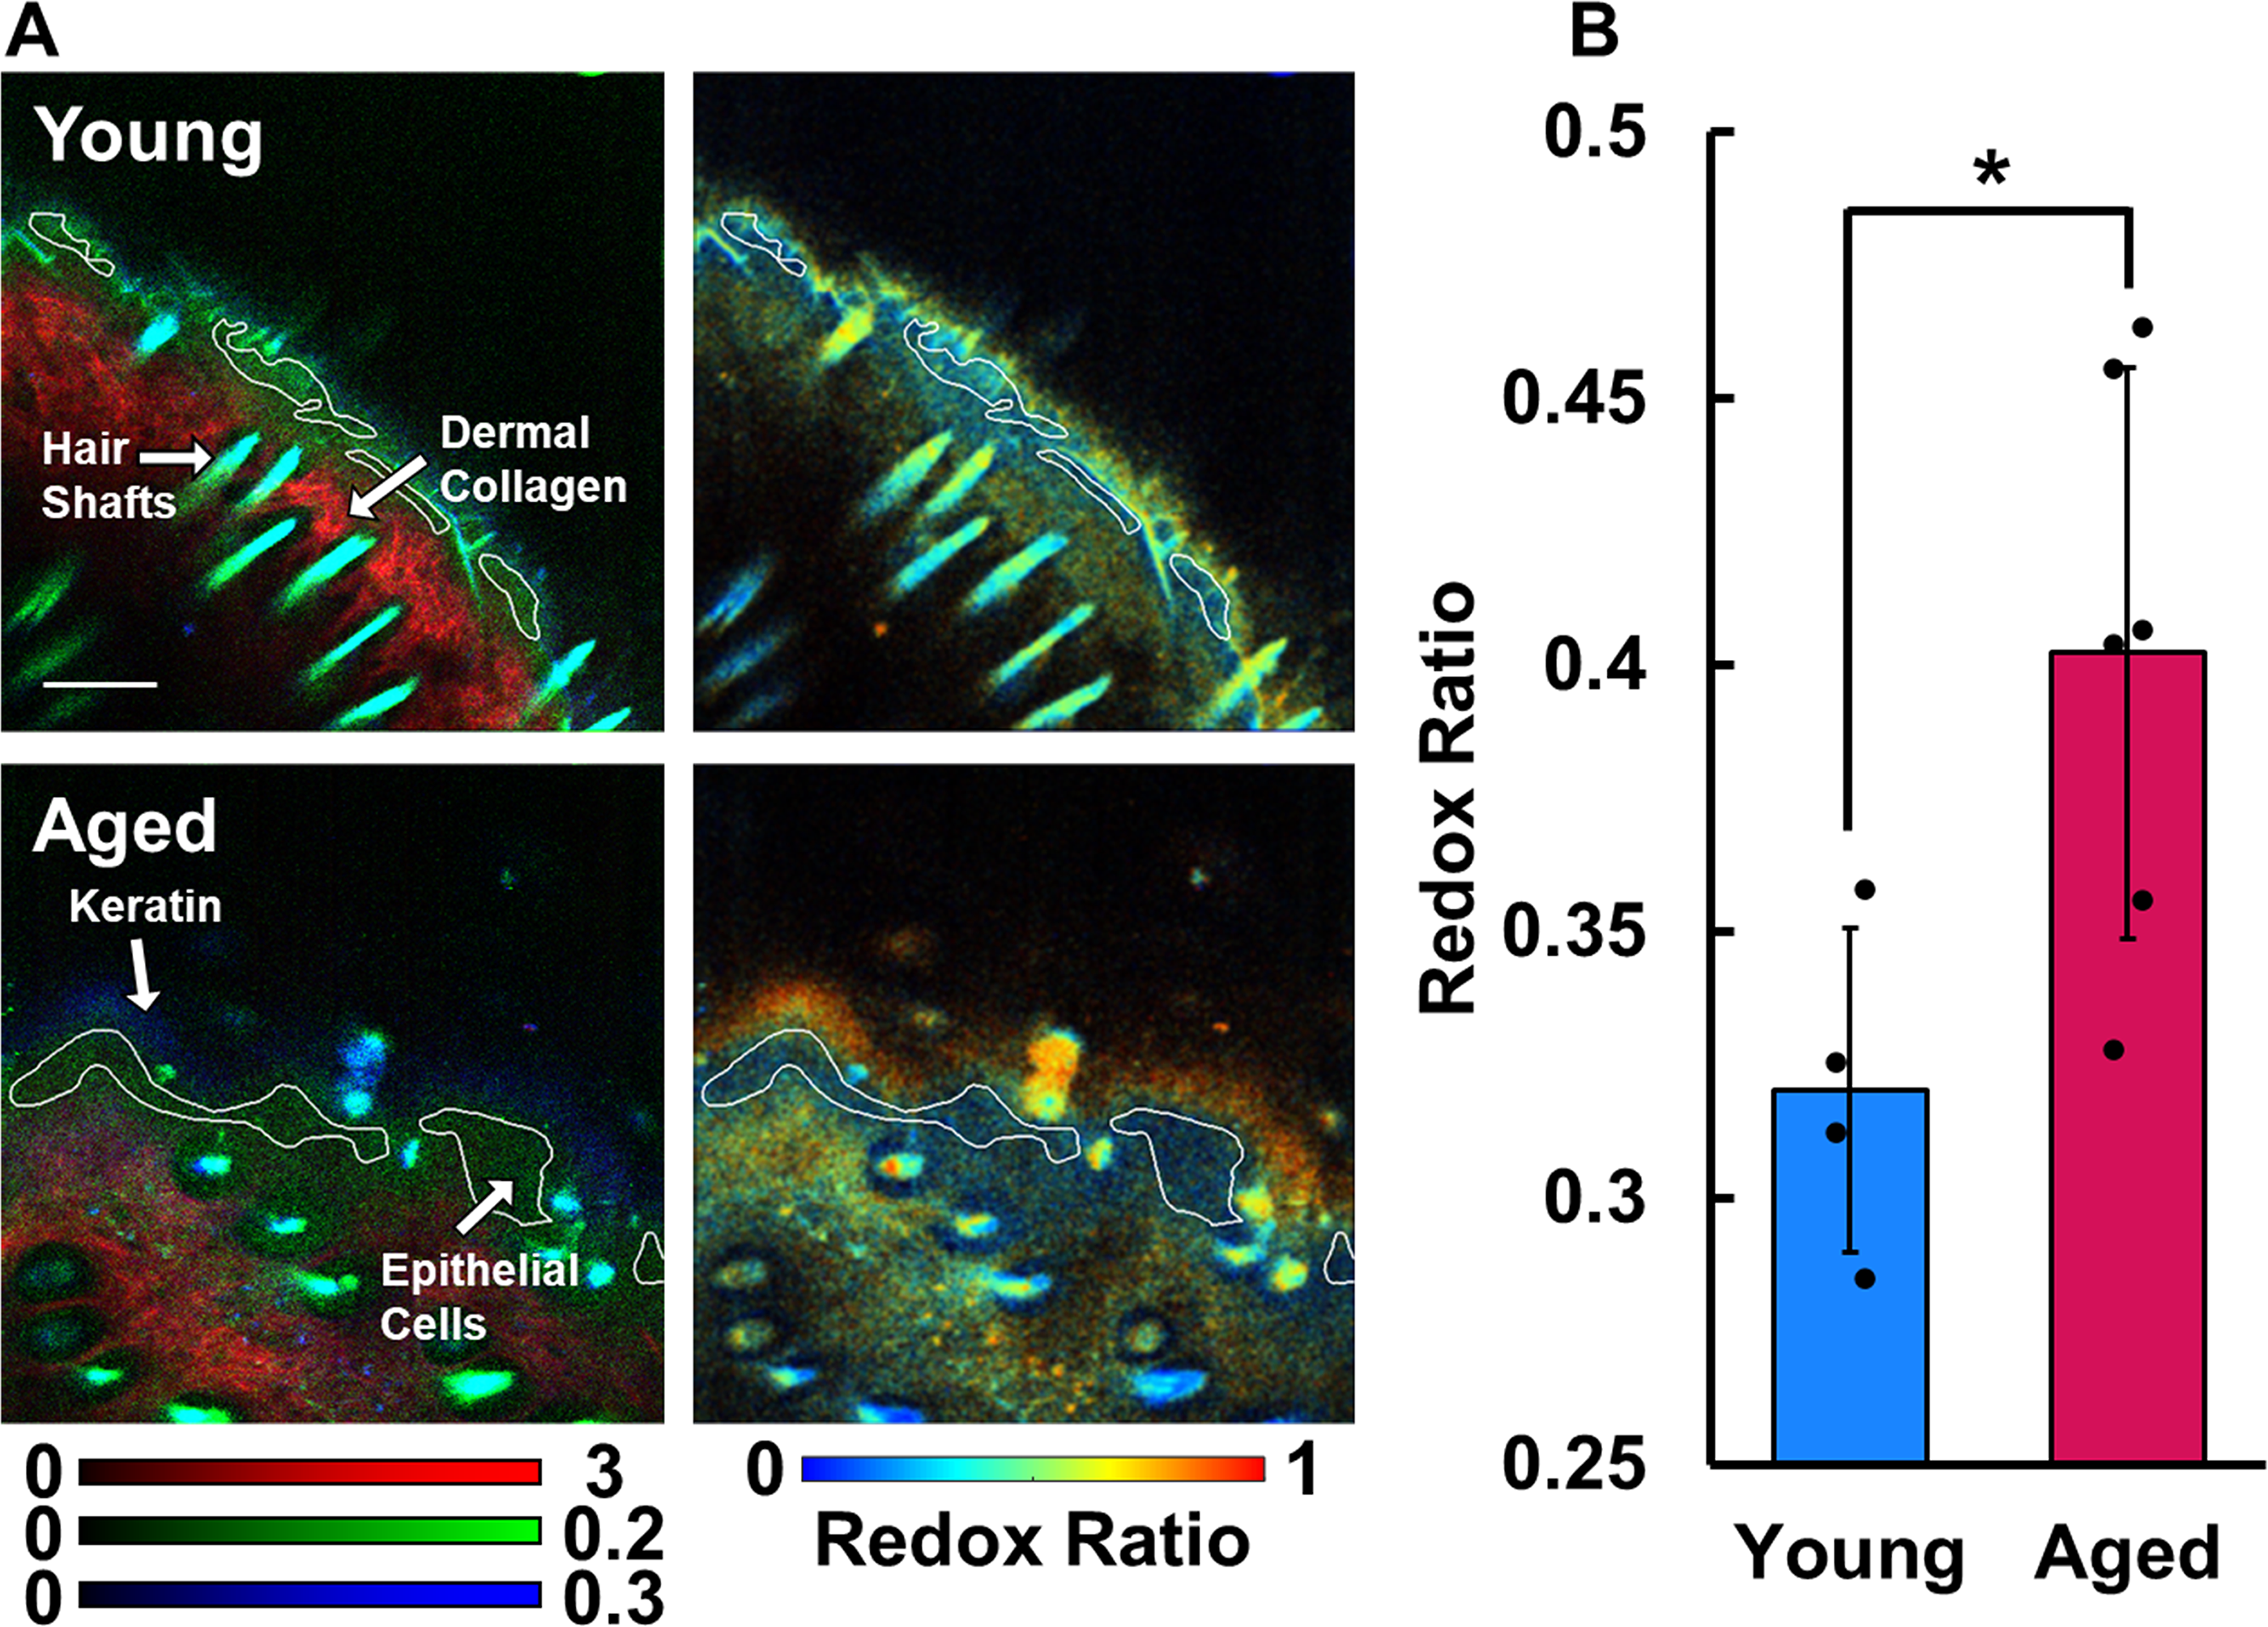
The skin atop the head of young and aged mice was imaged using MPM.
Analysis of NADH and FAD autofluorescence in the epithelium
The epithelial redox ratio was calculated similarly to previous studies.10,11 Using fluorescein normalized channels that isolated NADH and FAD autofluorescence from the epidermis, an optical redox ratio of FAD/(NADH + FAD) was computed on a pixel-by-pixel basis, with higher values typically interpreted as being associated with more oxidative phosphorylation relative to the catabolism of carbon substrates through glycolysis and the tricarboxylic acid (TCA) cycle. The redox ratio was averaged across every pixel within the epithelial mask in each of the five slices segmented within the z-stack, and the five slices were averaged to yield an average optical redox ratio from each z-stack. Due to the small number of cell layers within the epidermis of mouse skin, we did not consider the redox ratio as a function of depth.
46
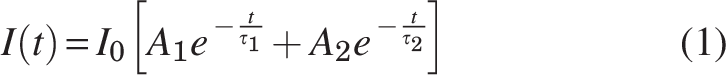
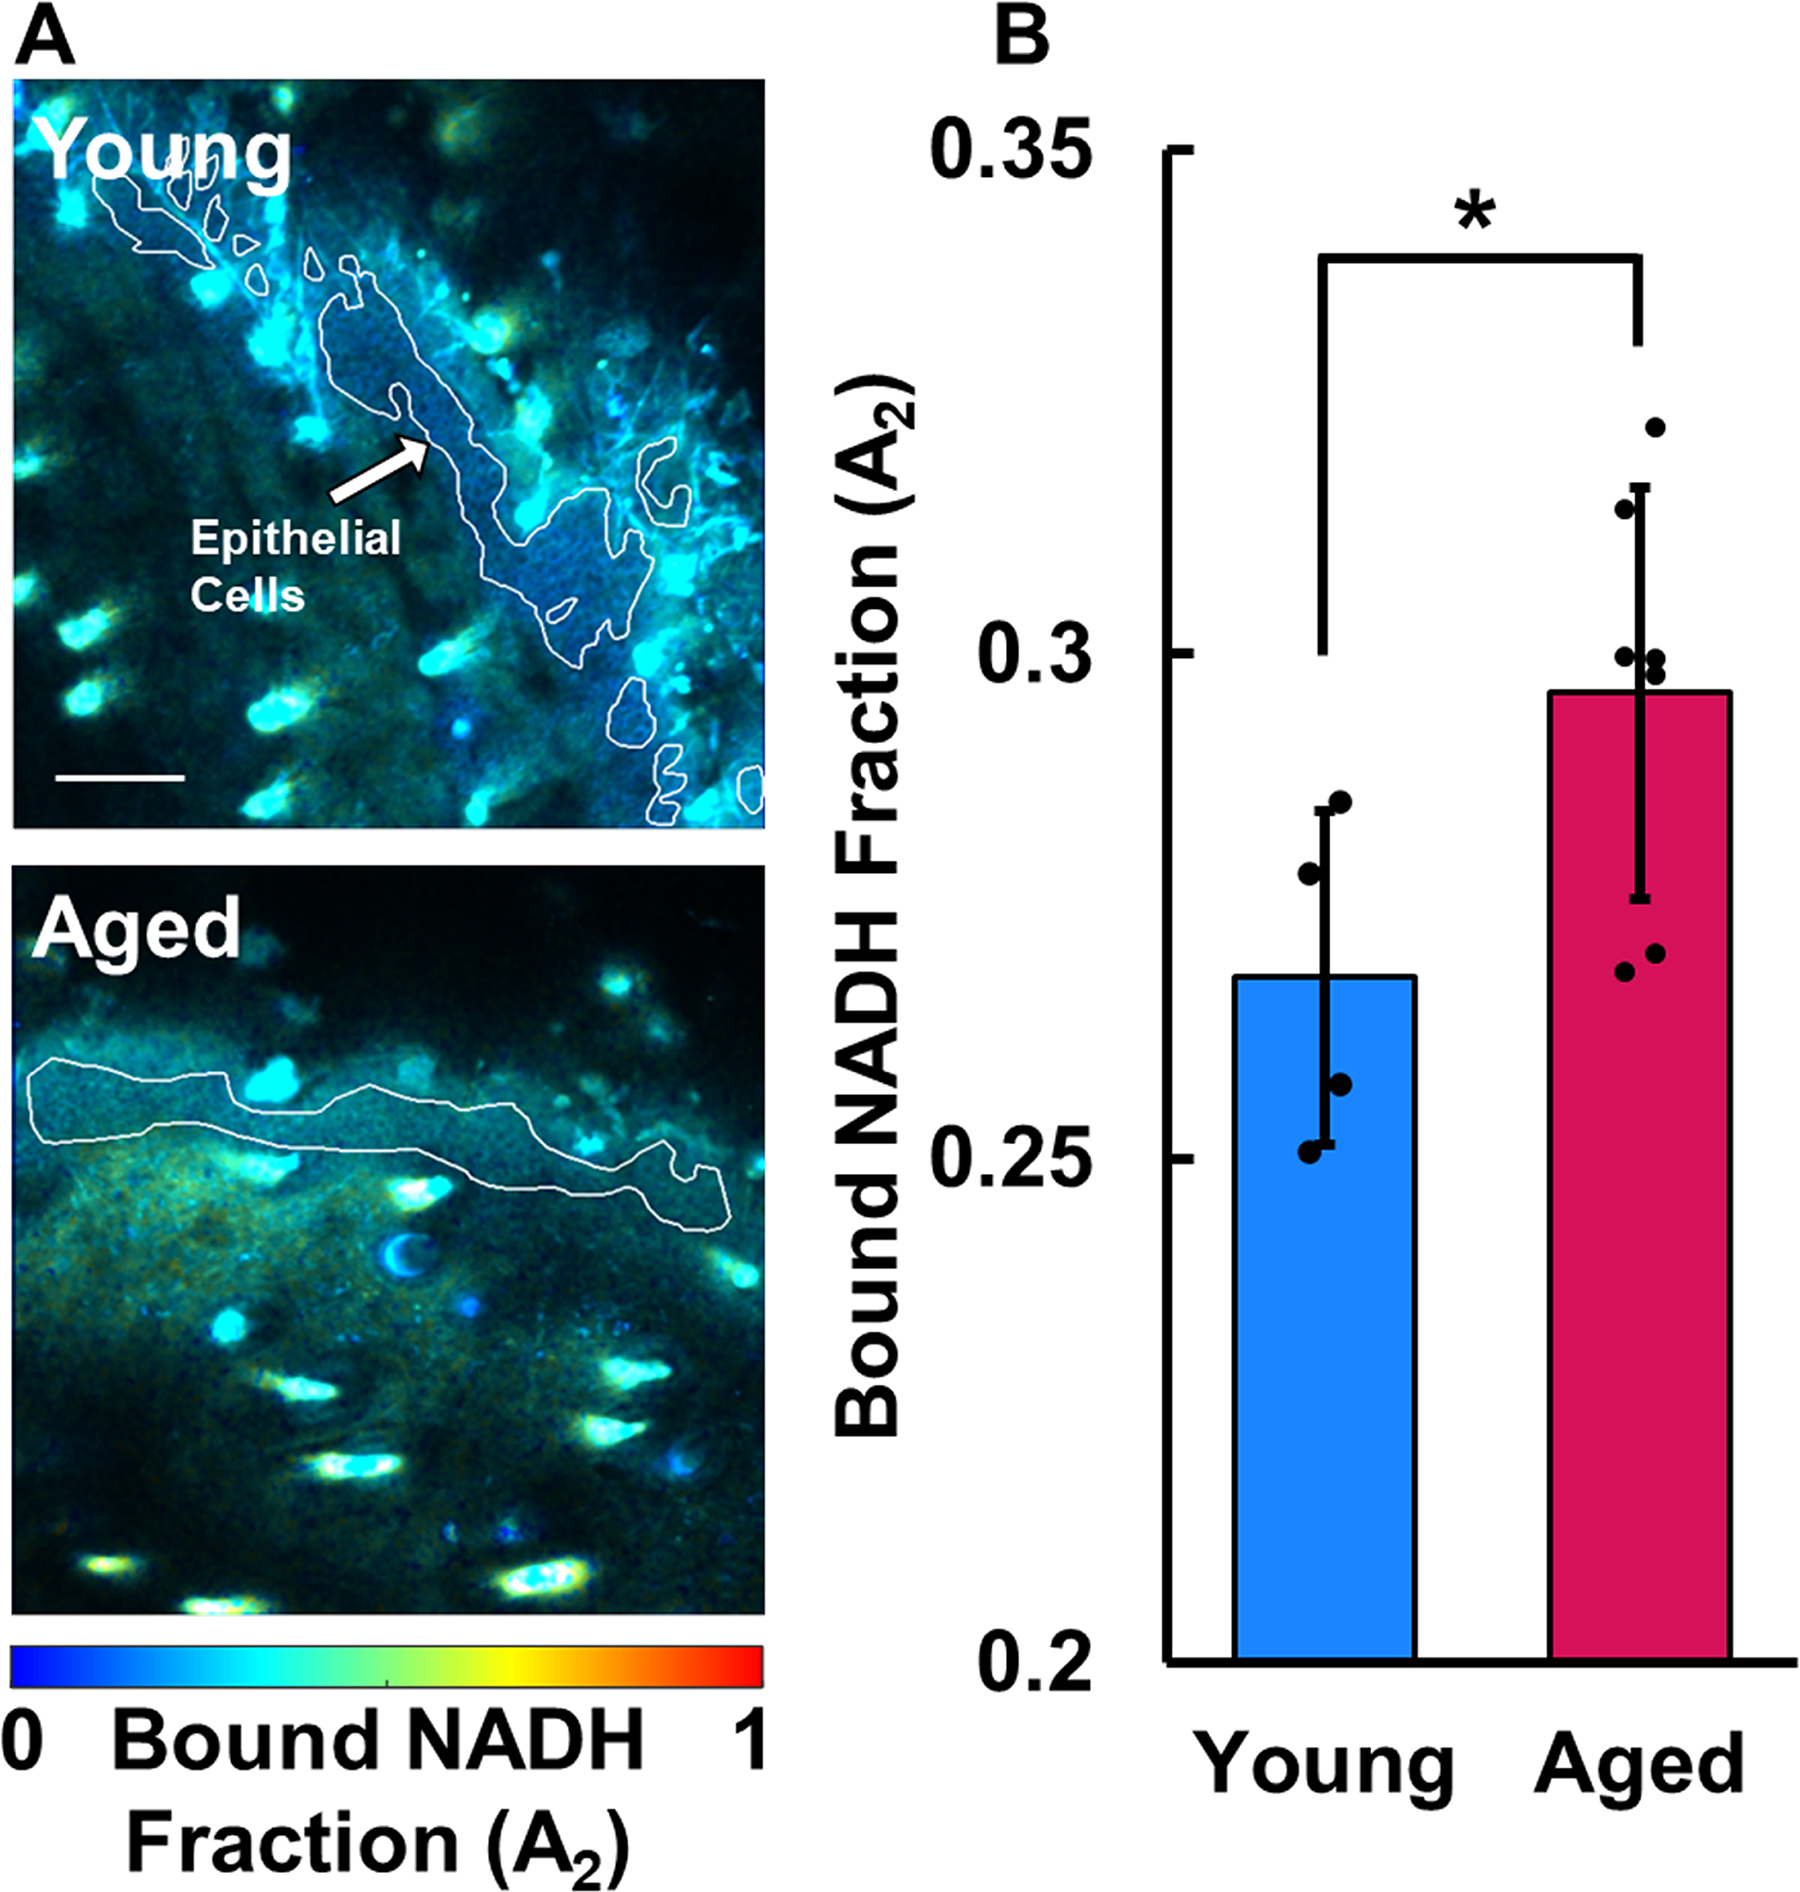
FLIM images were analyzed using SPCImage v8.0 (Becker & Hickl GmbH, Berlin, Germany). An instrument response function was measured with SHG from urea crystals and used to deconvolve the measured FLIM decay curves. Prior to fitting, the pixels were spatially binned to ensure that at least 10,000 photons contributed to the decay curves at each pixel location. A biexponential decay model (Equation 1) was fit to the decay curve to determine the proportion of free (A1) and protein-bound (A2) NADH, and the fluorescence lifetime of free (τ1) and protein-bound (τ2) NADH:
Pixels within the mask of the epidermis that had atypical fits measured by χ2 <0.5 or χ2 >1.5 were removed from analysis. The average bound NADH fraction (A2) was computed within the epithelial mask of each FLIM image. Similar to the optical redox ratio, higher fractions of bound NADH indicate greater utilization of oxidative phosphorylation relative to glycolysis and catabolism of carbon substrates through the TCA cycle.
Mitochondrial FD analysis of young and aged skin epithelium
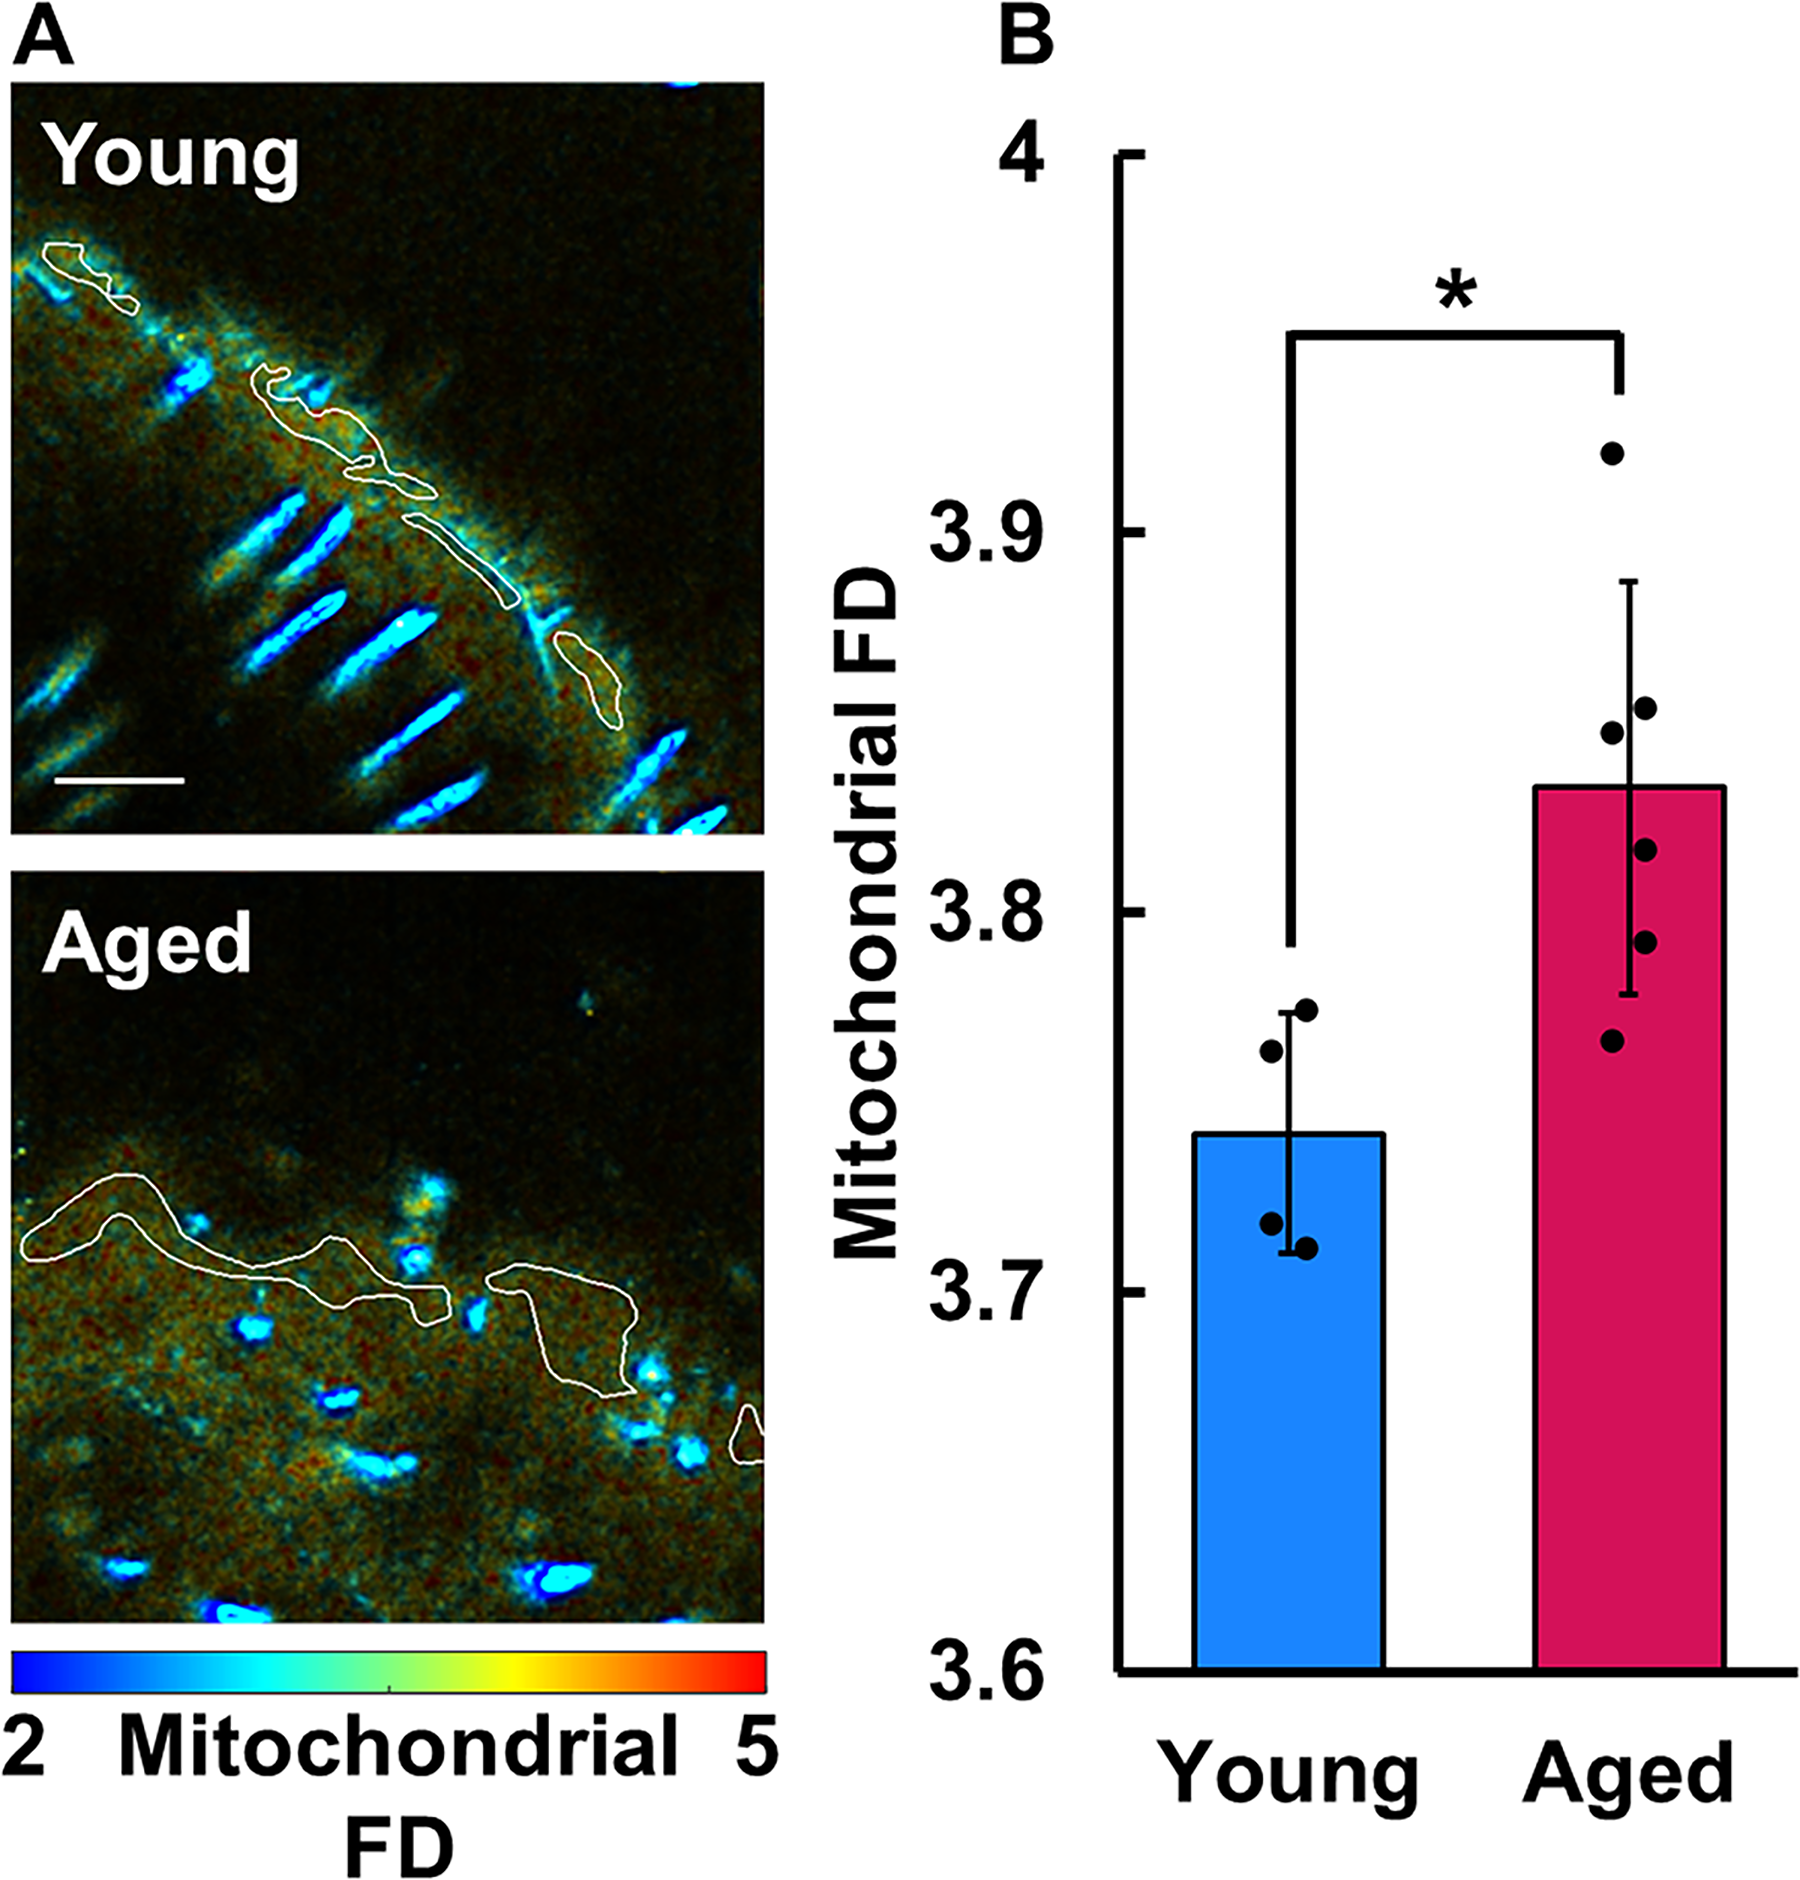
Mitochondrial organization of aged and young keratinocytes was measured through FD analysis using a previously published modified blanket method.
21
FD was measured at each pixel location in the NADH images based on the pattern within a 5-pixel radius. By treating the NADH intensity image as a topographical map, surface area (SA) was computed as the images were progressively downsampled to large pixel sizes.
21
The mitochondrial FD can be obtained from the exponent (β) derived from the power law relationship between the SA and pixel size (Equation 2):
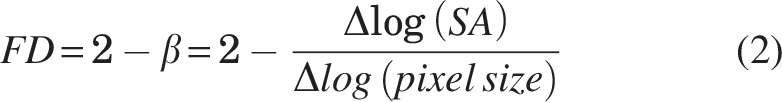
Larger FD values are indicative of a more random image intensity pattern (i.e., approaching white noise), while lower FD values indicate more clustered mitochondrial organization. The average FD was obtained from the same epidermal regions that were used to determine the optical redox ratio for each z-stack.
Analysis of young and aged dermal collagen
The volumetric fraction of collagen fibers within the dermis was calculated by measuring the ratio of collagen-positive to tissue-positive pixels in each z-stack. The organization of dermal collagen fibers was evaluated by computing the FD of collagen SHG intensity patterns following the same method described for mitochondrial FD in the epithelium. The radius over which FD was computed at each pixel was increased to 15 to account for the larger size of the dermal collagen network compared with mitochondria within individual cells. Average collagen FD was computed from the pixels contained within both the tissue-positive mask and collagen-positive mask of each z-stack. To assess fiber alignment, the 3D directional variance of the collagen fibers was quantified from SHG images as described previously.27,28 Higher directional variance values indicate more random fiber orientations, while values that approach 0 indicate perfect alignment of local fiber orientations. These measurements were averaged from within the same collagen-positive pixels used for collagen FD analysis from each stack. The collagen-positive mask (Fig. 5A) was applied to intensity images from each emission channel to compute average SHG or TPEF intensity within the collagen regions. Average SHG intensity at 855 nm and TPEF intensity from four channels known to collect nonenzymatic cross-link autofluorescence (755 nm ex./460 nm and 525 nm em.; 855 nm ex./460 nm and 525 nm em.) were all quantified from the z-stacks.
Statistical analysis
Changes in the optical metrics were analyzed using a nested analysis of variance (ANOVA) model with age as a fixed effect to determine significant differences. The ANOVA model considered z-stack locations as nested within each mouse, which was considered a random effect. Statistical significance was defined when p < 0.05, which is denoted by asterisks in the figures. Statistical tests were performed using JMP Pro 15 (Carry, NC). Bar graphs in figures represent group means, and error bars represent standard deviations.
Electronic laboratory notebook
An electronic laboratory notebook was not used.
RESULTS
Aged keratinocytes have less free NADH and a more fragmented mitochondrial network
The overlaid in vivo TPEF and SHG images revealed a variety of skin features including the stratum corneum, live keratinocytes, dermal collagen, hair follicles, and shafts, providing sufficient context for segmentation of the epithelium and other regions for analysis (Figs. 2A and 3A). The keratinocytes in aged skin (0.402 ± 0.054) exhibited an average optical redox ratio significantly higher (Fig. 2B; p = 0.0296) than those of young skin (0.320 ± 0.030), suggesting that aged keratinocytes had less flux through the TCA cycle than young keratinocytes. In addition, the bound NADH fraction (A2) of keratinocytes of aged mice (0.296 ± 0.020) was significantly higher (p = 0.0261; Fig. 3B) than that of young mice (0.268 ± 0.017), also indicating less free NADH and a reduction in catabolism of carbon substrates. The lifetime of the free (τ1 = 595 ± 35 ps) and bound (τ2 = 3,751 ± 148 ps) NADH lifetime species was consistent with typical ranges.10,11,47 Aged keratinocytes were found to have a mitochondrial FD (3.833 ± 0.054) that was significantly greater (Fig. 4B; p = 0.0187) than those in young skin (3.742 ± 0.032), suggesting that the mitochondria in aged keratinocytes have a more fragmented organization than their younger counterparts.
Aged dermis exhibited a more fragmented collagen fiber network
The SHG intensity (Fig. 5B) of collagen from aged skin (1.264 ± 0.215) was significantly lower (p = 0.0310) than that of young skin (1.973 ± 0.526), and the collagen FD (Fig. 5C) of aged skin (3.042 ± 0.077) was significantly greater (p = 0.0096) when compared with young skin (2.897 ± 0.025). These results suggest that aging causes collagen fibrils and fibers to become more randomly organized. The 3D directional variance (Fig. 5D) of collagen fibers in aged skin (0.845 ± 0.026) was slightly greater than that of young skin (0.816 ± 0.070), but not significantly different (p = 0.5627). The volumetric fraction of collagen-positive pixels (Fig. 5E) was significantly lower (p = 0.0186) in aged skin (0.646 ± 0.058) compared with that of young mouse skin (0.777 ± 0.057), suggesting a reduction in dermal collagen content with age.
Dermal collagen of aged mice exhibited greater nonenzymatic cross-link fluorescence
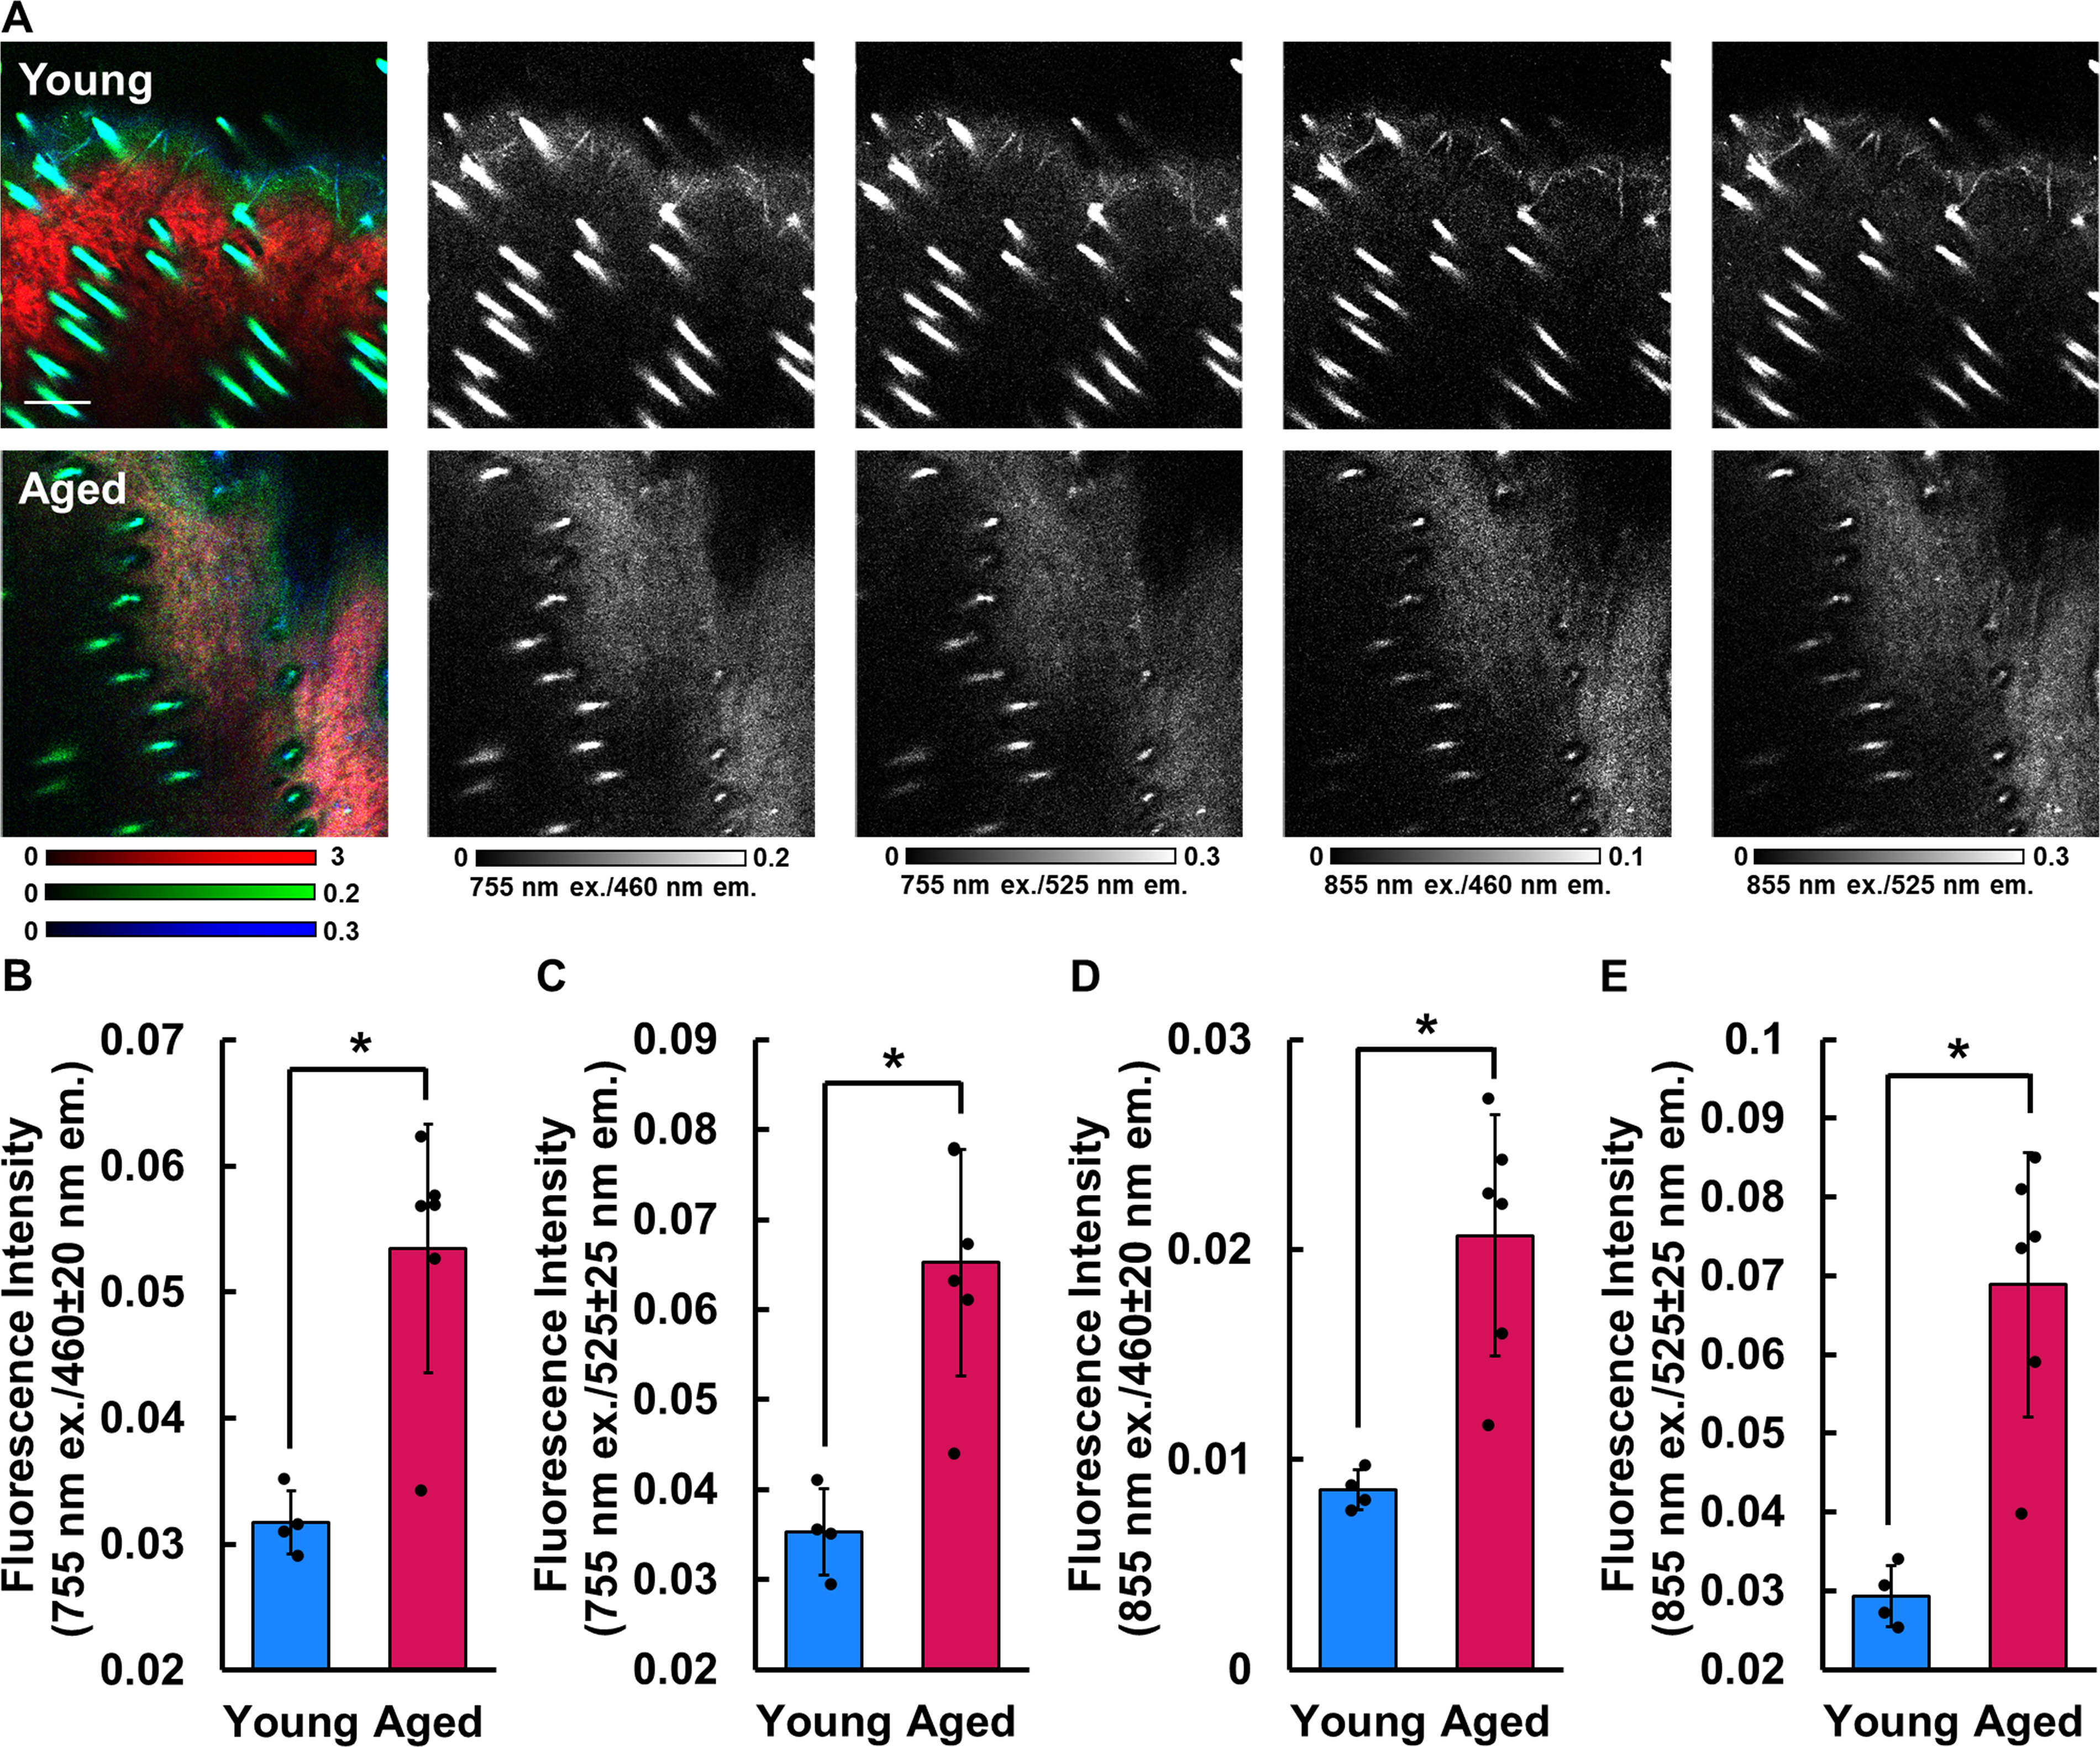
The dermal collagen of aged mouse skin had a greater autofluorescence intensity (p ≤ 0.0046) at all emission wavelengths regardless of the excitation wavelength used (Fig. 6B–E). At 755 nm excitation wavelength, the young group emitted fluorescence intensities of 0.032 ± 0.003 and 0.035 ± 0.005 in the blue (460 nm; Fig. 6B) and green (525 nm; Fig. 6C) emission channels, respectively, while the collagen autofluorescence intensity of the aged group was 0.053 ± 0.010 and 0.065 ± 0.013 for the same channels. Significant differences were found between age groups in both the blue (p = 0.0046) and the green (p = 0.0027) emission channels using 755 nm excitation. At an excitation wavelength of 855 nm, the young group emitted fluorescence intensities of 0.009 ± 0.001 and 0.029 ± 0.004 at the blue (Fig. 6D) and green (Fig. 6E) channels, respectively, and the aged group exhibited fluorescence intensities of 0.021 ± 0.006 and 0.069 ± 0.017 from the same emission channels. Similar to the differences with 755 nm excitation, significant differences were detected in the blue (p = 0.0040) and the green (p = 0.0023) emission channels using 855 nm. These findings of increased collagen fluorescence with advanced age across a broad emission spectrum indicate that aged dermal collagen contains a higher content of nonenzymatic cross-links, and this fluorescence has been typically attributed to AGEs.12,33,44,48–50
DISCUSSION
A progressive decline in metabolic function and altered structural organization are hallmarks of the aging process and developing noninvasive methods capable of quantifying multiple age-related changes is essential to understanding the progression of biological aging. 51 Our study demonstrates that noninvasive in vivo MPM is sensitive to multiple functional and structural changes associated with intrinsic aging. Few studies report in vivo optical redox ratios and NADH fluorescence lifetimes, given the abundance of cellular and structural components that can naturally fluoresce and limitations in imaging depth due to light scattering. However, we were able to isolate the epithelial layer of the skin and measure multiple changes in keratinocyte mitochondria. Spectral (Fig. 2), lifetime (Fig. 3), and spatial (Fig. 4) changes to keratinocyte NADH autofluorescence were found, suggesting age-related impaired metabolic activity. Structural (Fig. 5) and spectral (Fig. 6) changes were also found in the ECM of aged dermis, which suggest a more fragmented collagen fiber network due to the accumulation of nonenzymatic cross-linking. Previous work from our group provided the initial groundwork for the current study and demonstrated that keratinocytes at the edge of healing excisional wounds in aged mice have higher redox ratios and bound NADH fractions than young mice. 11 That prior study confirmed that these age-related metabolic differences were associated with reduced proliferative capacity in aged keratinocytes. 11 While keratinocytes are highly proliferative at the edge of the wound, 52 it was unclear whether age-related changes in keratinocyte metabolism would be generalizable to intact, uninjured skin. The current study revealed that age-related differences in metabolic function were indeed detectable in uninjured skin, as well as structural changes to both the keratinocyte mitochondria and the dermal collagen network below.
The keratinocytes from aged mice exhibited a significantly higher optical redox ratio (Fig. 2) and greater bound fraction of NADH (Fig. 3) than those from young mice, indicating that keratinocytes in aged individuals have less free NADH available. The reduction in free NADH with age may be associated with either a reduction in electron-producing reactions involved in glycolysis and the TCA cycle or an increase in electron transport chain (ETC) activity and adenosine triphosphate (ATP) production. Our prior study of skin wound metabolism in aged mice 11 and other studies involving cancer metabolism22,23,53–55 suggest that glucose and pyruvate catabolism typically drive changes in the NADH autofluorescence of epithelia. In those studies, an increased need for carbon to support macromolecule biosynthesis in proliferative epithelial cells has been thought to increase free NADH levels. Our study suggests a sensitivity to reduced macromolecule biosynthesis as cell proliferation rates slow with advanced age, which is further supported by the thinner epidermis and reduced turnover rate and protective capacity of the keratinocytes observed in aged skin.42,56,57 However, we should note that some previous studies suggest an increase in glycolysis over oxidative phosphorylation associated with aging,58–60 which is thought to be a compensatory response to the decreased ETC efficiency that comes from accumulated oxidative damage. While decreased ETC efficiency and lower mitochondrial membrane potential as a result of ETC defects will result in reduced mitochondrial ATP production,61,62 it may also increase NADH oxidation (and drive the levels of free NADH down) as part of a compensatory response to restore the membrane potential. Perhaps most importantly, the precise timing of the gradual decrease in proliferation, accumulation of ETC defects, and putative compensatory responses in the mitochondria and cytosol during aging is not well understood. Relative increases or decreases in metabolic activity attributed to aging are likely to be dependent on the timepoints being compared. Having demonstrated a sensitivity to age-related differences in cellular metabolism through noninvasive in vivo measurements, our technology is uniquely well-suited to conduct longitudinal assessments throughout the lifespan of individual animals to address this gap in knowledge in the future.
In vivo, metabolic imaging studies do not often measure FD, in part because this measurement is susceptible to errors due to motion artifacts. However, in this study, we succeeded in restricting the movement of the imaging location and corrected for the remaining motion artifacts during postacquisition processing. The mitochondrial FD of aged keratinocytes was significantly higher than that of young keratinocytes (Fig. 4B), suggesting that aged keratinocytes have more fragmented mitochondria that produce more random NADH image patterns similar to white noise. The increased mitochondrial fragmentation with age suggests altered fusion-fission dynamics and an overall lower utilization of the mitochondria. 63 Previous studies have found that proliferative cancer cells, which preferentially rely on glycolysis over oxidative phosphorylation, exhibit less mitochondrial network fragmentation.20–22 Compared with these previous cancer studies, we found aging produces the opposite trends in our metabolic and structural measurements of mitochondria (Figs. 2–4), further suggesting our optical sensitivity to aging is associated with a decrease in proliferation. Although the reported metabolic outcomes are all independent measurements, the optical redox ratio, bound NADH fraction, and mitochondrial FD collectively suggest that aged keratinocytes catabolize fewer carbon substrates and may serve as optical biomarkers of age-related metabolic changes. The underlying mechanism(s) driving our optical sensitivity may be related to a combination of known aging hallmarks that could influence mitochondria, including inflammation, oxidative stress, and sensescence. 64 Future mechanistic studies are needed to address all factors that contribute to why keratinocyte metabolism changes with age.
In addition to changes in mitochondrial structure and function, we found MPM could be used to identify various changes in collagen organization. The aged mouse dermis exhibited significantly lower SHG intensity (Fig. 5B), which suggests smaller diameter collagen fibrils/fibers and/or less dense, more disorganized collagen fibril packing within collagen fibers.26,65 These SHG intensity changes are also consistent with a shift from collagen I to III with age, but there are conflicting results regarding the effect of aging on the ratio of collagen I to III.66–68 In addition to SHG intensity measurements, we found a significantly greater collagen SHG FD in aged skin (Fig. 5C), which also indicates smaller, more fragmented collagen fiber organization. There was a trend toward aged skin exhibiting reduced alignment of collagen fibers as measured by an increase in directional variance (Fig. 5D), but significant differences were not found. Studies have had conflicting results regarding the effect of intrinsic aging on collagen alignment, which may be related to variable anatomical location among studies.12,69–71 The fiber volume fraction of aged skin was also significantly lower than that of young skin (Fig. 5E), suggesting a decrease in collagen turnover rate with age that is in agreement with previous reports. 70 Reduced collagen turnover and collagen fragmentation may be due to an imbalance in dermal fibroblast MMP expression and collagen deposition with aging. 72 The significant increase in TPEF intensity detected across the different excitation and emission wavelengths in aged dermis (Fig. 6B–E) suggests that aged skin contains a greater number of nonenzymatic cross-links within collagen than young skin. This is consistent with previous ex vivo skin studies from our group. 12 The putative collagen AGEs measured by TPEF (Fig. 6) may affect the ability of collagen to form fibrils, 73 leading to the reduced SHG intensity, reduced fiber density, and increased FD observed by SHG (Fig. 5).
Given that it has been reported that aged human skin exhibits reduced glycolytic flux due to reduced proliferation, 74 a more disorganized collagen fiber network, 75 and a greater presence of AGEs, 49 it is expected that the findings of this mouse study will translate to human skin. MPM has been adapted for human measurements in a clinical setting by multiple groups interested in measuring NADH autofluorescence and collagen SHG. The CE-certified MPTflex (Jenlab GmbH, Jena, Germany) has been used to observe increases in NADH autofluorescence intensity and changes in FD of keratinocytes in response to arterial occlusion in human skin,23,76 as well as to determine the effect of dermatitis on NADH fluorescence lifetime. 77 There are also continued efforts to refine and enhance MPM hardware for clinical settings as evidenced by recent work developing the fast, large area multiphoton exoscope 78 and the Food and Drug Administration-cleared VIO system developed by Enspectra Health. 79 In MPM studies involving human skin, it was important to consider the presence of melanin, which can be spatially isolated through image thresholding methods and removed from further analysis of the NADH intensity. 23 When adapting our studies of aging to humans, we will also need to consider any depth-dependent changes in epithelial metabolism due to keratinocyte differentiation or oxygen tension. Moreover, the MPTflex can be used to collect collagen SHG and elastin autofluorescence,80,81 and future work with human subjects could be used to assess changes in ECM composition with aging.80,81 Relative changes in elastin and collagen composition with age were not evaluated in the current study because mice have significantly less elastin in their skin compared with humans. 30
To our knowledge, this is the first evaluation of the effect of intrinsic aging on skin microstructure and metabolism through in vivo label-free MPM. As lifespan and chronic illnesses continue to increase, the need for improved tools to noninvasively and objectively measure the progression of aging will become increasingly critical. Up to this point, label-free MPM has primarily been focused on measuring cancer-induced changes in metabolism, showing a sensitivity to increases in NADH autofluorescence relative to FAD.14,22,53–55,82 This study demonstrates MPM also has sensitivity to decreases in NADH autofluorescence and reduced keratinocyte proliferation associated with advanced age, which is consistent with previous work performed on epithelia responding to injury and disease.10,11,53,82 Changes in collagen organization and collagen cross-link autofluorescence have been reported in various tissues as well and are consistent with our interpretation of findings.12,26,33,44,70 Through quantitative analysis of TPEF and SHG, surrogate markers of cell metabolism, mitochondrial organization, collagen fibril packing, fiber density, fiber network organization, and nonenzymatic cross-link density were all assessed and found to differ between the skin of adolescent and aged mice. Future studies will focus on longitudinal assessments to identify the onset and dynamics of metabolic and microstructural changes with increasing age. Furthermore, how these optical metrics are sensitive to the interactions of age with a broad range of biological and environmental factors such as sex, hyperglycemia, skin barrier function, inflammation, anatomical site, and diet need be understood prior to any clinical translation of the technology to monitor human aging. Clinical translation will also be dependent on fully automating image analysis. We have previously developed convolutional neural networks to automatically segment features of skin wounds, 83 and refinement of these networks with data from the current study is expected to enable accurate segmentation of intact skin for fully automated image analysis in future aging studies. Collectively, our results suggest that label-free MPM can provide a suite of optical biomarkers to characterize biochemical, compositional, and microstructural changes associated with multiple hallmarks of aging (Table 1).
Summary of optical biomarkers collected through in vivo multiphoton microscopy of young and aged mice
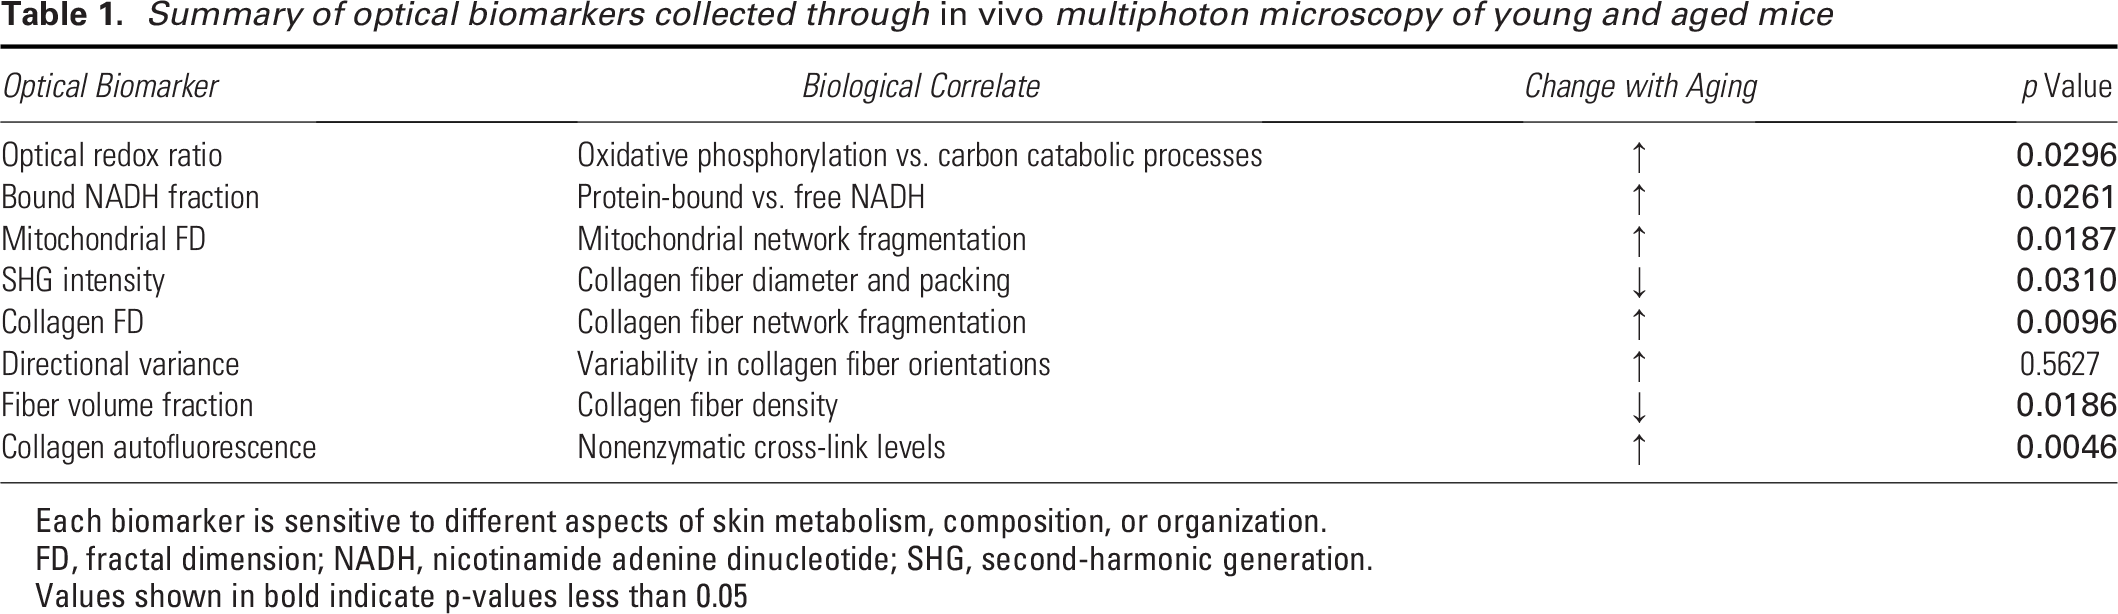
Each biomarker is sensitive to different aspects of skin metabolism, composition, or organization.
FD, fractal dimension; NADH, nicotinamide adenine dinucleotide; SHG, second-harmonic generation.
Values shown in bold indicate p-values less than 0.05
Innovation
For the last 25 years, several optical imaging and spectroscopy devices have been developed with sensitivity to skin health and repair processes. More recently, in vivo label-free MPM of skin has been explored for cancer detection by measuring NADH and FAD autofluorescence, but this technology may have broader applications. Herein, we demonstrate that in vivo MPM can provide noninvasive quantitative biomarkers of skin aging. Using the endogenous fluorescence of NADH and FAD in keratinocytes and the SHG signal from collagen, we demonstrate that age-related changes in the metabolic activity and ECM organization of skin can be assessed noninvasively.
Footnotes
ACKNOWLEDGEMENTS AND FUNDING SOURCES
The authors would like to thank Ragan Edison for her contributions in analyzing optical outcomes in the early stages of the study during her time as part of the University of Arkansas’ Research Experience for Undergraduates (REU) program. This work was generously supported by the Arkansas Biosciences Institute; the National Institute of Biomedical Imaging and Bioengineering (Grant/Award Number R01EB031032); the National Institute of General Medical Sciences (Grant/Award Number P20GM139768); the National Institute on Aging (Grant/Award Number R01AG056560); and the National Science Foundation (Grant/Award Number 1846853).
AUTHOR DISCLOSURE AND GHOSTWRITING
M.R.R., A.E.W., and K.P.Q. declare no conflicting financial interests. The content of this article was expressly written by the authors listed. No ghostwriters were used to write this article.
ABOUT THE AUTHORS
Supplemental Material
Abbreviations and Acronyms
References
Supplementary Material
Please find the following supplemental material available below.
For Open Access articles published under a Creative Commons License, all supplemental material carries the same license as the article it is associated with.
For non-Open Access articles published, all supplemental material carries a non-exclusive license, and permission requests for re-use of supplemental material or any part of supplemental material shall be sent directly to the copyright owner as specified in the copyright notice associated with the article.