



Abstract
This article examines the impacts of the Youth Transition Demonstration, an initiative of the Social Security Administration (SSA) to improve employment outcomes for youth with disabilities. Based on a random assignment design, the analysis uses data from a 1-year follow-up survey and SSA administrative records for 5,203 youth in six research sites to estimate demonstration effects. Three of the six demonstration projects had positive impacts on the rate at which youth were employed during the year after they entered the evaluation. Those impacts were concentrated in sites where the projects provided more hours of services, counterfactual services were weak, and the target population of youth had more severe disabilities.
The transition to adulthood for youth with disabilities can be especially difficult. Besides the host of issues facing all youth at this age, young people with disabilities face unique challenges related to health, social isolation, service needs, the potential loss of benefits, and lack of access to supports (Osgood, Foster, & Courtney, 2010). These challenges complicate their planning for future education and work, often leading to poor education and employment outcomes, dependence on public programs, and a possible lifetime of poverty (Davies, Rupp, & Wittenburg, 2009).
Findings from early demonstration programs have indicated the need for developing customized supports to meet the specific needs of youth with disabilities. Of particular note is the Transitional Employment Training Demonstration (TETD) funded by the Social Security Administration (SSA), which provided employment supports to Supplemental Security Income (SSI) recipients with intellectual disabilities, ages 18 to 40 years, in 13 communities. Decker and Thornton (1995) found that TETD increased cumulative earnings over the 6 years following program entry by 72%, with larger impacts in sites that customized the delivery of supports in comparison with those that employed standardized approaches. More recently, Ivry and Doolittle (2003) found that the mixed results from studies of programs for youth with disabilities can be explained largely by the underenrollment of key subgroups of young people, inconsistent participation among enrollees, and high rates of attrition. Similar to the TETD findings, their results underscore the importance of matching employment supports to meet the specific needs of youth rather than providing standardized supports.
Several more recent studies have pointed to additional factors that improve employment outcomes for youth with disabilities. There is growing evidence that work experience during the secondary school years is a key predictor of postschool employment success (Carter, Austin, & Trainor, 2012; Gold, Fabian, & Luecking, 2013; Test et al., 2009). Furthermore, expectations and support by the families of youth are linked to positive employment outcomes (Carter et al., 2012; Simonsen & Neubert, 2013), as is the provision of services to enhance youth self-determination (Wehmeyer, Field, & Thoma, 2012). Summarizing findings from a review of 22 studies, Test and colleagues (2009) identified inclusion in at least some general education classes and participation in vocational education as effective strategies for improving postschool employment outcomes for youth with disabilities.
Recognizing the importance of helping young people with disabilities achieve their full economic potential, SSA developed the Youth Transition Demonstration (YTD) initiative (Fraker & Rangarajan, 2009). Focusing on youth aged 14 to 25 years who were either receiving SSI or Social Security Disability Insurance (SSDI) benefits or were at a high risk of receiving them in the future, SSA invested considerable resources in developing, implementing, and evaluating promising strategies to help youth with disabilities become as self-sufficient as possible. YTD projects in 10 sites around the country offered services designed to lift the barriers facing these youth as they transitioned to adulthood. YTD also included SSA waivers of certain disability program rules, which delayed the loss of benefits due to negative disability redeterminations and made paid employment more rewarding. This article documents the types and intensity of services provided by the YTD projects and assesses their impacts on outcomes for youth during the year after they entered the projects.
Method
Intervention Components
The YTD program model (summarized in Rangarajan et al., 2009) was based on promising lessons in what works in promoting successful transitions for youth with disabilities. In addition to the research cited above, the development of the model drew upon two major studies that synthesized promising practices in promoting employment and independent living outcomes for transition-age youth with disabilities. The first was conducted by the National Alliance for Secondary Education and Transition (NASET). With input from more than 30 national advocacy groups, professional organizations, and education associations, NASET conducted a thorough review of research on what youth need to succeed as they transition from secondary education. Using this research synthesis, NASET produced a set of standards and quality indicators for identifying critical needs for all youth, including those with disabilities (NASET, 2005).
Building on the NASET framework, the National Collaborative on Workforce and Disability for Youth (NCWD/Y) conducted its own extensive review of research, demonstration projects, and recognized effective practices. From this review, it developed a practical tool, Guideposts for Success (NCWD/Y, 2009), to help practitioners and policymakers conceptualize optimum service delivery for youth with disabilities. Guideposts features nearly the same components highlighted by NASET but slightly reconstituted: school-based preparatory experiences, career preparation and work-based experiences, youth development and leadership, connecting activities, and family involvement and supports. Thus, Guideposts offers a framework for organizing approaches to achieving the desired transition outcomes of employment and career paths for youth with disabilities. The components identified in Guideposts represent important influences on the ability of youth to reach the key transition objectives: a job and a clear career path.
The YTD program model included many of the components identified in Guideposts, although these were customized to better meet the needs of the YTD target population (Luecking & Wittenburg, 2009). Foremost among the components were individualized work-based experiences. These included worksite tours, volunteer work, subsidized jobs, and most notably, competitive paid employment in integrated settings, where people with disabilities work alongside nondisabled individuals. A youth empowerment component enabled youth to acquire the skills and knowledge they needed to chart their own courses and advocate for themselves. YTD fostered empowerment by engaging youth in intensive planning that focused on education, employment, health care, and independent living. Family supports included family-focused training, support for parent networking, and the provision of transition-related information. YTD also facilitated system linkages, or the connections with service providers that youth may need to access health care, education programs, transportation, and accommodations and assistive technologies for education and employment. SSA’s waivers for YTD—and the benefits counseling that youth and parents needed to understand the waivers—were also central to the model.
Another noteworthy feature of YTD was intensive technical assistance provided to projects. TransCen, Inc., a leading organization in the design and implementation of employment programs for youth with disabilities, delivered technical assistance focused on helping project staff to conduct job development with employers and match youth with appropriate jobs.
Study Design
The YTD evaluation, which is being conducted in 6 of the 10 demonstration sites, is based on a randomized controlled trial (RCT) design under which youth with disabilities who had agreed to be in the study were randomly assigned to either a treatment or control group. The treatment group was eligible for both the SSA waivers and YTD services, whereas the control group followed standard SSA program rules and could only access the non-YTD services available in their communities. Because of random assignment, the two groups were expected to be equivalent at the beginning of the study; consequently, any observed differences in their outcomes could be attributed to YTD. The evaluation is tracking employment, earnings, benefits, and other outcomes for the youth for 3 years. It is using impact analysis—that is, the comparison of outcomes between the treatment and control groups—to assess whether the demonstration helped youth secure paid employment and reduce their dependency on SSI and SSDI. The evaluation also includes a study of the implementation of YTD. Evaluation activities are ongoing as of this writing, with an anticipated public release of a final report on the evaluation in 2015.
Random assignment worked as expected, in that the treatment and control groups in each site had statistically equivalent baseline characteristics. We conducted chi-square tests and t tests for treatment–control differences in approximately 50 baseline characteristics per site. In no site did the number of statistically significant differences (p < .05) exceed what would have been expected simply on the basis of random chance.
Research Questions
This research findings reported in this article address the following two questions:
The first question is addressed through an implementation analysis based on data on services delivered to youth who were participating in the YTD projects, as recorded in the project management information systems. The second question is addressed through an impact analysis based on the data for youth who had been randomly assigned to the evaluation’s treatment or control groups. Those data were obtained from SSA administrative records and a follow-up survey.
Study Sites
YTD projects were established and entered into the RCT evaluation in two distinct phases. In September 2003, SSA executed cooperative agreements with seven organizations to operate YTD projects in California, Colorado, Iowa, Maryland, Mississippi, and New York (one in Bronx County and another in Erie County). Two years later, SSA selected a team of researchers and transition program specialists headed by Mathematica Policy Research (Mathematica) to assist the agency in refining the program model, to provide technical assistance to the projects on implementing the model, and to conduct the RCT evaluation. Members of the team visited the seven projects to observe the delivery of services and interview staff. Based on an assessment of the quality of services and the willingness of staff to modify their interventions to include all components of the YTD program model, the team recommended that the projects in the Bronx, Colorado, and Erie County participate in the first phase of the evaluation. SSA accepted this recommendation, and youth began to enroll in the evaluation in Colorado and the Bronx in August 2006, and in Erie County in February 2007. The top panel of Table 1 lists these projects, along with their lead organizations and target populations, and shows the number of youth who were randomly assigned to the treatment and control groups. The table also shows, in parentheses, the number of treatment youth who accepted offers to participate in the projects. Services ended in fall 2009 in Colorado and Erie County and in spring 2010 in the Bronx.
Projects Participating in the YTD Evaluation.
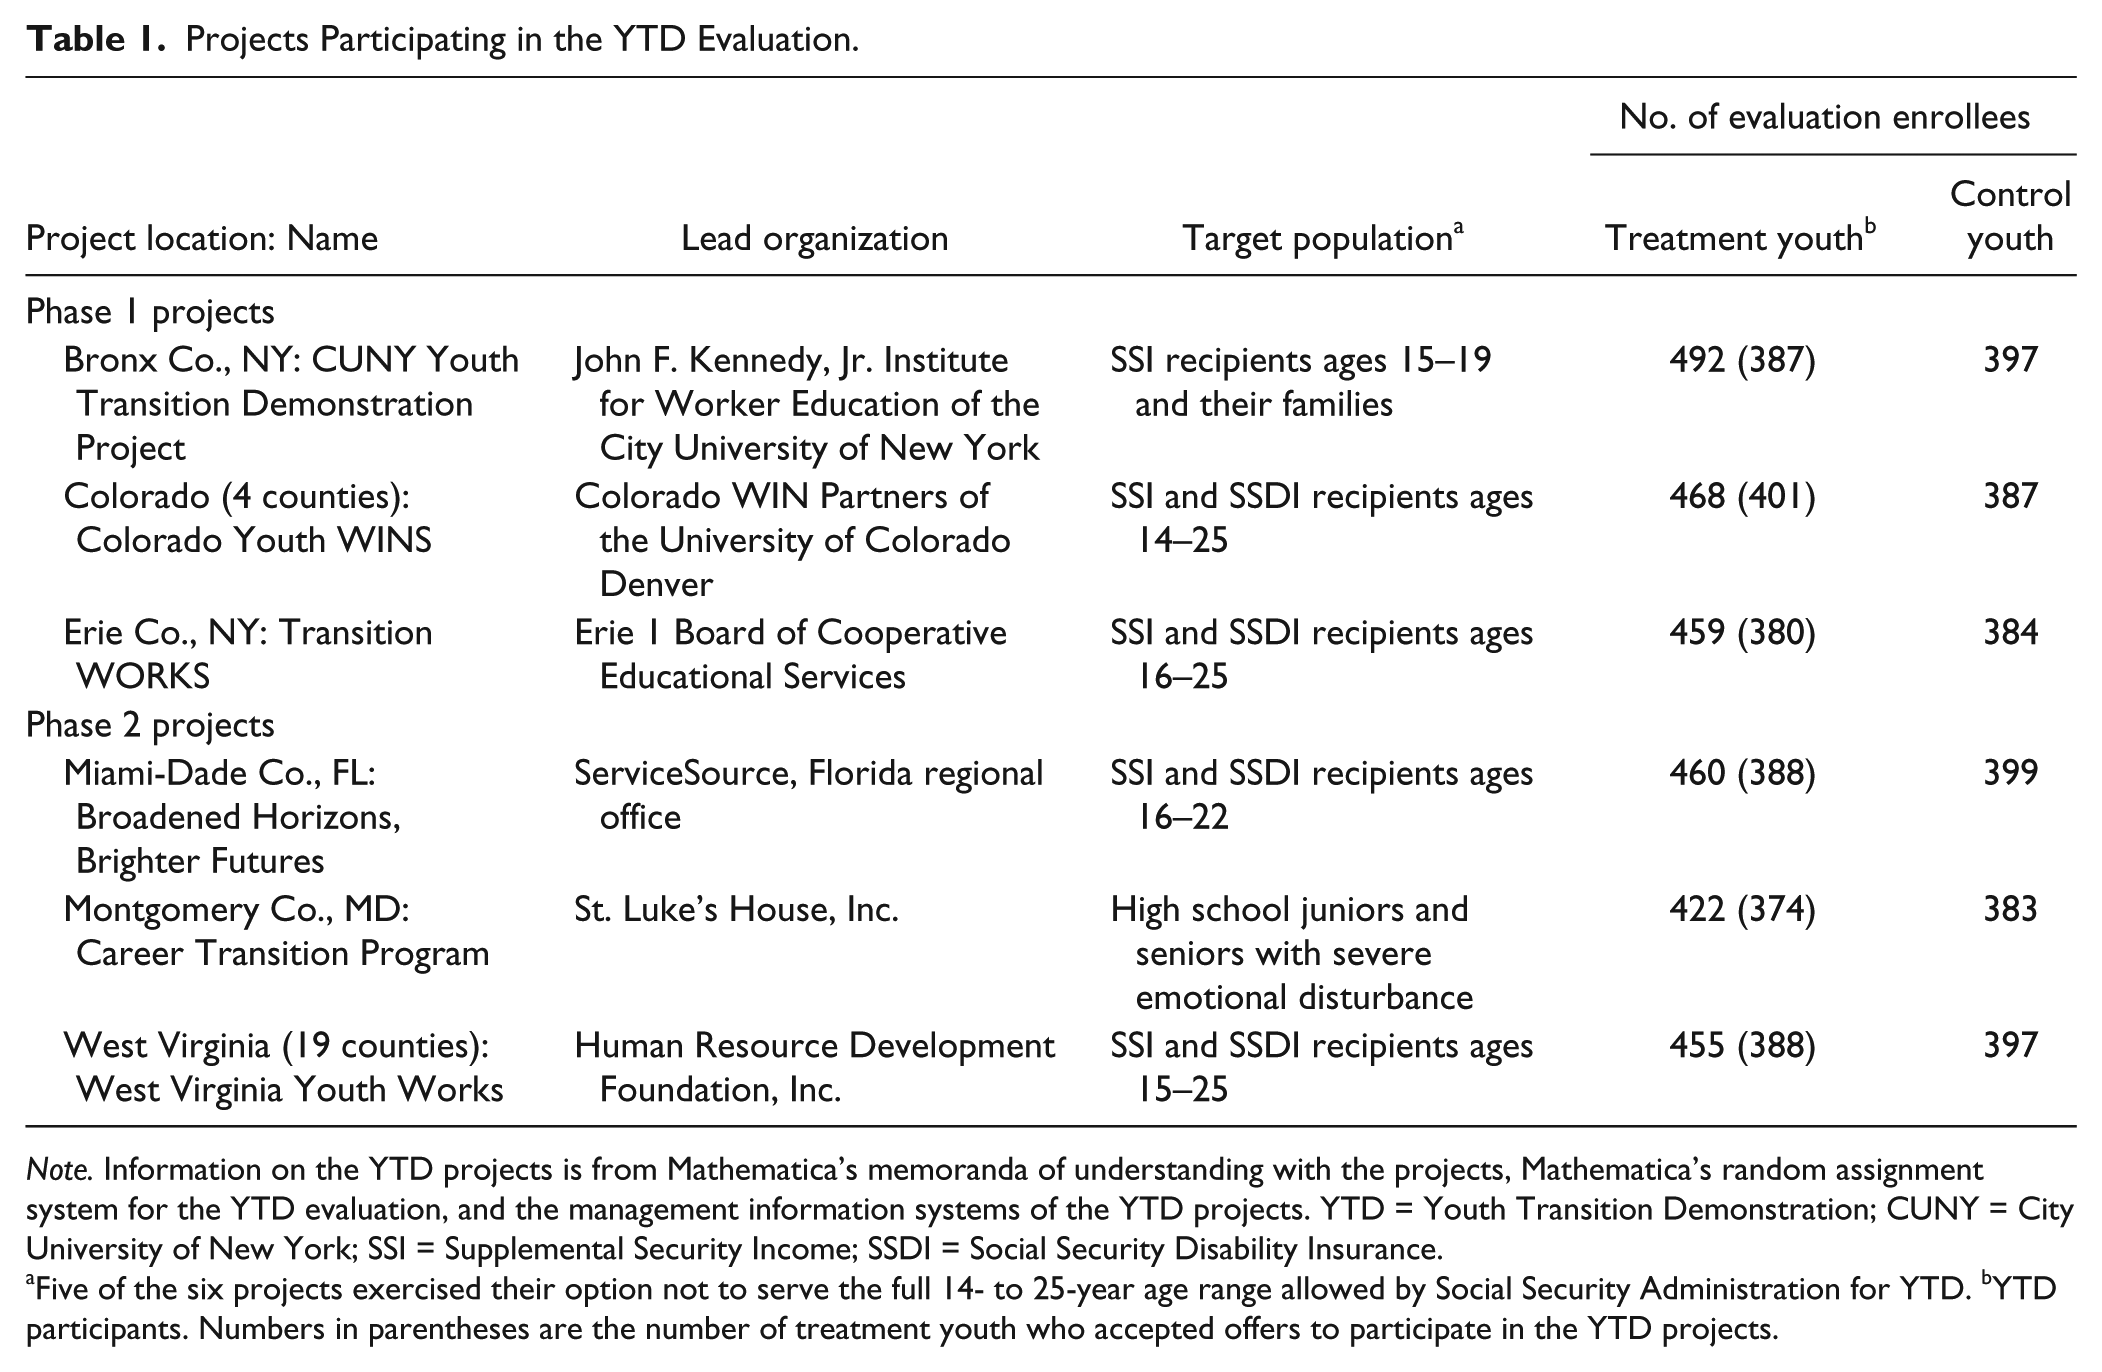
Note. Information on the YTD projects is from Mathematica’s memoranda of understanding with the projects, Mathematica’s random assignment system for the YTD evaluation, and the management information systems of the YTD projects. YTD = Youth Transition Demonstration; CUNY = City University of New York; SSI = Supplemental Security Income; SSDI = Social Security Disability Insurance.
Five of the six projects exercised their option not to serve the full 14- to 25-year age range allowed by Social Security Administration for YTD. bYTD participants. Numbers in parentheses are the number of treatment youth who accepted offers to participate in the YTD projects.
Three additional projects entered the evaluation in the second phase, as shown in the bottom panel of Table 1. Following the recommendations of the YTD evaluation team, SSA selected them from a group of five projects that were funded through the evaluation contract to deliver services on a pilot basis in 2007. The selection criteria included the number of youth recruited during the pilot year, the strength of services delivered, the degree of fidelity to the YTD program model, the availability and quality of alternative services, and the size of the target population. The projects selected for full implementation were located in Miami-Dade County, Florida; Montgomery County, Maryland; and 19 counties in West Virginia. Youth in these locations began to enroll in the evaluation in March 2008, and SSA-funded YTD services ended in March 2012. See Martinez et al. (2008) for detailed descriptions of all six YTD projects that participated in the RCT evaluation.
Enrollment of Youth
In all project sites except Montgomery County, enrollment in the evaluation was restricted to youth who were SSI or SSDI recipients. In these sites, survey interviewers at Mathematica reached out to youth on the disability rolls via letter and telephone to assess their interest in the study and to enroll those who were interested. A young person enrolled in the study by completing a baseline telephone survey and sending Mathematica a signed consent form affirming his or her decision to take part. A youth without a legal guardian (generally a youth aged 18 or older) could sign the consent form; otherwise, a signature by a legal guardian was required. After a young person enrolled, Mathematica used a computer algorithm to randomly assign him or her to a treatment or control group.
In Montgomery County, youth who were considered by the county’s public school system or mental health system to have a severe emotional disturbance or other significant mental illness, and were in their last 2 years of high school or had left school within the past year, were eligible to enroll in the evaluation. For youth who met these criteria, the project staff conducted the initial outreach, primarily through presentations to students in high school transition classes. Mathematica followed up with interested youth to complete the baseline survey and obtain written consent, after which the youth were randomly assigned to a treatment or control group.
On average, 850 youth enrolled in the evaluation per site, for a total of 5,103 enrollees. By design, Mathematica randomly assigned slightly more than half (54%) of them to treatment status. Project staff were responsible for reaching out to the treatment youth and offering them the opportunity to participate in the projects—a formal step in which the youth (or the parents or guardians of minor youth) signed project enrollment forms. Eighty-four percent of treatment youth completed this step and were classified as “YTD participants”; however, small percentages of participants were “no shows”; that is, they never made themselves available to receive YTD services. The no-show rate ranged from 0% at three sites to 4% at one site.
Data Sources
The YTD evaluation includes an analysis of the implementation of the individual projects and an analysis of their impacts on youth employment and other outcomes. The implementation analysis relied on quantitative data on the delivery of services from Efforts-to-Outcomes (ETO)©, the web-based management information system used by all of the projects, to glean important quantitative data on the delivery of services to YTD participants. Project staff entered into ETO each service they provided to a YTD participant and the amount of time involved. The data on services were supplemented with qualitative data on program implementation collected by the evaluation team during three visits to the projects over 2 years. Those visits included observation of program operations, interviews with project staff, and focus group discussions with participating youth and their parents.
The impact analysis is based on data from surveys of evaluation enrollees and from administrative records for SSA benefit programs. In addition to the baseline survey, Mathematica conducted telephone surveys 1 year and 3 years after enrollment; however, the 3-year survey data were not available in time for inclusion in the analyses reported here. The survey data include information on service receipt, employment and earnings, educational progress, attitudes and expectations, and other outcomes for evaluation enrollees. The administrative data include monthly amounts of disability benefits. Because 14% of the youth who enrolled in the evaluation were deceased, could not be located, or declined to participate in the 1-year follow-up survey, the impact estimates for outcomes measured through the survey are based on data for fewer cases than the counts of enrollees shown in Table 1. In contrast, impact estimates for benefit outcomes are based on administrative data for all of the evaluation enrollees, less the 0.6% who died during the year following random assignment.
Implementation Analysis Measures
ETO and our visits to the YTD projects yielded data on a broad range of measures pertaining to the implementation of the YTD projects. Here, we present findings from the analysis of four ETO-based measures of service receipt for treatment group youth who agreed to participate in the YTD projects. Two of the measures pertain to employment services, which included but were not limited to career exploration, soft-skills training, job search assistance, development of work experiences, job placement, job coaching, and postemployment follow-up. These two measures are whether a youth received employment services from a YTD project and the number of hours of those services. The other two measures are whether a youth received any services from a YTD project and the number of hours of those services.
Impact Analysis Measures
In specifying the outcome measures for the impact analysis, we were mindful of the statistical problem of “multiple comparisons” (Schochet, 2008). This problem arises when researchers estimate impacts on a large number of outcomes, such that at least a few of the estimates likely will be statistically significant by chance, even if no true impacts occurred. We addressed this problem by specifying, a priori in the evaluation’s design report (Rangarajan et al., 2009), five domains in which we expected well-implemented YTD projects to have impacts 1 year after random assignment. Within each domain, we identified a primary outcome to be tested. The primary outcomes were the basis for the tests of our main hypotheses. In addition, we examined a number of supplementary outcomes to help explain impacts on the primary outcomes. Even if we did not find a statistically significant impact on a primary outcome, we examined the related supplementary outcomes to enhance our understanding of the lack of impact on the primary outcome. Below, we present the five domains in which we anticipated that well-designed and well-implemented YTD projects would have impacts during the initial year following random assignment and describe the primary outcome examined in each domain. We also describe selected secondary outcomes.
Employment-promoting services
Through individualized employment-promoting services, the YTD projects were expected to improve youth’s employability and actual employment outcomes. The primary outcome in this domain is whether a youth received any of the following in the year after random assignment: career counseling, support in preparing a resume, job search assistance, job shadowing and apprenticeships, counseling on SSA benefits and work incentives, and other employment services. This measure differs in several respects from the measures of employment services for the implementation analysis. First, it is based on reports by the youth of the services they received, rather than on service data recorded in ETO by project staff. Second, the source of the services received was not restricted to the YTD projects. Third, this measure was obtained for both treatment and control group members; hence, it can be the basis for impact analysis.
Paid employment
The YTD projects sought to help youth find paid employment in the short term and put them on a path to consistent paid employment in the longer term. Hence, paid employment is an important domain for the evaluation. The primary outcome in this domain is whether a youth was ever employed in a paid job during the year following random assignment. In addition to being an outcome, paid employment in the year following random assignment is a measure of the receipt of services, as assistance in obtaining paid work experience was a core YTD service component. Total earning in the year following random assignment is an important supplementary outcome in this domain.
Educational progress
Although most of the YTD projects did not have an explicit goal of promoting educational progress, at a minimum they provided educational counseling and other education services to youth who sought to further their educations. The primary outcome in the domain of educational progress is a composite measure of enrollment in school at any time during the year following random assignment or completion of high school by the time of the 1-year follow-up survey.
Youth income
The YTD initiative was expected to improve youth income by increasing their earnings and offering waivers that permitted them to retain more of their benefits as their earnings increased. Thus, one of the important outcomes for examination is the total income received by youth from earnings and SSA disability benefits in the first year following random assignment. The total amount of disability benefits received during the year following random assignment is an important secondary outcome in this domain.
Attitudes and expectations
The YTD projects sought to promote independence and self-sufficiency among participants through identification of goals and person-centered planning. Thus, the projects were expected to improve outcomes related to youth’s attitudes and expectations. The primary outcome in this domain is whether youth agreed that their goals included working and earning enough to stop receiving disability benefits.
Data Analysis
All youth who enrolled in the evaluation and were assigned to treatment or control groups were included in the impact analysis of youth outcomes, contingent upon the availability of follow-up data, even treatment group members who declined to sign a project enrollment form or who signed a form but failed to show up for services. This was done to preserve the integrity of the RCT design, thus ensuring that any baseline differences between the treatment and control groups were due to chance. As a consequence of this broad inclusion rule, the analysis produced estimates of impacts on youth the projects intended to treat rather than on the youth they actually treated. But, because 84% of treatment group members were YTD participants and nearly all participants received YTD services, this distinction is of little empirical significance.
When well executed, random assignment ensures that a simple comparison between treatment and control cases of mean values of outcomes yields unbiased impact estimates; however, we used multivariate statistical models to increase the precision of our estimates. In addition, these models allowed us to control for chance differences in baseline characteristics between treatment and control group members that could be correlated with outcome measures. We estimated ordinary least squares regression models for continuous outcome measures and logistic regression models for binary outcomes. Below, we use the term regression models to refer generally to these models. The independent variables in the regression models were measures of age, race, gender, education, employment, expectations, family resources, and disability benefits from the evaluation’s baseline survey or SSA administrative records. The models also included as an independent variable an indicator of a youth’s research status, which took on a value of 0 if the youth had been assigned to a control group or 1 if assigned to a treatment group. The regression coefficient on this variable is the estimated impact of the YTD project on the outcome measure. As context for interpreting the impact estimate, we also report the mean value of the outcome measure for the treatment group.
For all outcomes based on the evaluation’s 1-year survey, we estimated regression models using weights to account for survey nonresponse. To calculate the weights, we used logistic models to estimate the propensity for an evaluation enrollee to respond to the survey as a function of baseline characteristics. The standard errors from the regression models reflect the variability associated with the weights.
Treatment group youth who signed (or whose parents signed) project enrollment forms were included in the implementation analysis of the receipt of services from the YTD projects. We used simple descriptive statistics to analyze the four measures of service receipt. We computed the proportion of youth who received employment services from the projects and the proportion who received any services of any type from the projects. For youth who received employment services or any services, we computed the average number of hours of those services.
Results
This section presents findings from our analyses of the receipt of YTD services and the impacts of the YTD projects on youth outcomes 1 year after random assignment. Before turning to those findings, we first present baseline statistics on youth who enrolled in the evaluation and were randomly assigned to a treatment group.
Baseline Characteristics
Table 2 presents baseline characteristics of treatment group members who responded to the 1-year follow-up survey, which was the source of most of the outcome measures for the impact analysis of youth outcomes. Due to space limitations, the table does not include control group members. However, as noted above, with just a few exceptions, the baseline characteristics of control group members were not significantly different from those of treatment group members.
Baseline Characteristics (Percentages) of Treatment Group Members From the Samples for Survey-Based Outcomes.

Note. Characteristics are from the YTD baseline survey and SSA records. SSI = Supplemental Security Income; SSDI = Social Security Disability Insurance; ADD = attention deficit disorder; YTD = Youth Transition Demonstration; SSA = Social Security Administration.
Based on SSA data. bBased on SSA data for SSI or SSDI recipients only. cStatistics on the primary disabling condition of treatment youth in Montgomery County are for the 20% of sample members who received SSI or SSDI. dNumbers of treatment cases are smaller than those shown in Table 1 because the samples for survey-based outcomes were restricted to youth who responded to the 1-year follow-up survey.
The characteristics of treatment group members varied across the evaluation sites, with a number of important differences between the Montgomery County and Bronx County sites and the other four sites. Montgomery County was the only site in which the YTD project did not exclusively target youth who were receiving SSI or SSDI recipients. In this site, only 20% of treatment group youth were receiving SSI or SSDI benefits when they enrolled in the evaluation, compared with 100% at the other sites. The lower share receiving benefits may help explain why a relatively high proportion of treatment youth in this site had worked for pay in the prior year (58% compared with 37% or lower at the other sites) and a higher proportion reported excellent health (27% compared with 23% or lower in the other sites). Because high school students and recent school leavers were the target population, the average age of treatment group members was lower in Montgomery County (18 years) than in most of the other sites (19 or 20 years). The YTD project in the Bronx also targeted students, resulting in treatment youth who were younger (an average age of 16 years) and more likely to be enrolled in school (94%) than in their counterparts in the other sites. The treatment youth in the Bronx also had somewhat lower socioeconomic status than in the other sites: Only 18% were living with both their parents when they enrolled in the evaluation (compared with 27% or higher in the other sites) and less than half of their mothers had graduated from high school (compared with 65% or higher for the other sites).
For some baseline characteristics, the similarities of treatment group youth across the sites are more notable than the differences. In all of the sites, more than half of treatment youth were male, reflecting the preponderance of males among youth disability beneficiaries nationwide: 66.5% of SSI recipients below 18 years of age in 2012 were male (SSA, 2013). In all of the sites, the proportion of treatment group youth with a physical primary disabling condition was relatively low (25% in Colorado, 18% or lower in the other sites) as was the proportion with a speech, hearing, or visual impairment (less than 14% in all of the sites). Also in all of the sites, a large share of treatment youth reported at baseline that they expected to live independently (66% or higher) and an even larger share expected to work for pay (74% in West Virginia, 88% or higher in the other sites).
Intensity of Project Services
Almost all treatment group youth who enrolled in the YTD projects received some services from those projects; however, the amount and focus of the services varied considerably from project to project. The amount of YTD services of any type received by participants in the Phase 1 projects was high in the Bronx (42.8 hrs, on average) but low in Colorado and Erie County (7.1 and 12.7 hrs, respectively), as shown in the top panel of Table 3. Only about half of the Colorado participants received employment services, such as assistance in preparing resumes and placement in paid jobs. Among the Phase 1 project participants who did receive employment services, the average number of hours of those services was 20.7 in the Bronx, but just 4.0 and 5.8, respectively, in Colorado and Erie County. These findings are based on information about services recorded in ETO by project staff.
Receipt of YTD Services by Study Participants.

Note. Treatment youth who formally enrolled in YTD projects were classified as YTD participants; however, this table shows that up to 4% of them did not receive any services. Data on services are from the management information systems of the YTD projects. YTD = Youth Transition Demonstration.
The denominator in the calculation of average hours of services per recipient is the number of participants who actually received “any services” or “employment services.” The average hours of services for all participants can be calculated by multiplying the average hours reported in the table by the rate of receipt.
TransCen’s technical assistance to the YTD projects had always emphasized employment services and the achievement of positive employment outcomes. Nevertheless, the findings from implementation analysis of the Phase 1 projects revealed a need to sharpen the focus of the technical assistance on services directly linked to paid employment and also to closely monitor both the delivery of those services and the outcomes for participants. Technical assistance for the Phase 2 projects was adjusted accordingly and yielded positive results in terms of the types and intensity of services, as shown in the bottom panel of Table 3. The intensity of YTD services of any type was consistently high for participants in these projects, averaging about 30 hrs. Virtually all participants received employment services, and the average number of hours received was higher than for participants in the Phase 1 projects in Colorado and Erie County: 13.9 hrs in Miami-Dade County, 10.2 hrs in Montgomery County, and 23.6 hrs in West Virginia.
Impacts on Youth Outcomes
All of the Phase 1 YTD projects had positive impacts on the receipt of employment-promoting services by youth with disabilities; however, with one notable exception, they had no impact on the evaluation’s other primary outcome measures during the year following random assignment. Approximately two thirds of the treatment group members in each of the Phase 1 sites reported in the 1-year follow-up survey that they had received employment-promoting services, such as job search assistance, from any source (see Table 4). In contrast, control group members were 12 to 16 percentage points less likely to report the receipt of such services. The treatment–control difference is statistically significant for each of the Phase 1 sites, t(727) = 4.50, p = .00 in the Bronx; t(708) = 3.34, p = .00 in Colorado; t(700) = 3.75, p = .00 in Erie County. This difference is the estimated impact of the YTD project on the receipt of services.
Impacts of YTD During the Year Following Random Assignment: Phase 1 Sites.

Note. Outcomes are from the YTD 1-year survey and SSA records. Data were weighted for survey nonresponse. Impact estimates and p values are from least squares regression models (continuous outcomes) and logistic regression models (binary outcomes). All dollar-denominated outcomes are measured in December 2008 dollars. YTD = Youth Transition Demonstration; SSA = Social Security Administration.
Based on SSA data. bBased on survey data.
p < .01.
The YTD project in the Bronx improved employment outcomes for youth, but the projects in Colorado and Erie County did not. During the year following random assignment, 31% of treatment group members in the Bronx were employed for pay at some time (see Table 4). This employment rate is a statistically significant, t(763) = 2.64, p = .00, 9 percentage points higher than that of the control group. The Bronx project primarily placed its participants in jobs through New York City’s Summer Youth Employment Program (SYEP), with their wages paid by either SYEP or the YTD project rather than by the employers (Fraker et al., 2011). Reflecting the low hourly wages and short duration of those jobs, the Bronx project did not have a statistically significant impact on earnings received during the year following random assignment. Although the employment rate for treatment group members was higher in Colorado and Erie County than in the Bronx, in neither of these sites did the YTD projects have statistically significant impacts on employment.
None of the Phase 1 projects had statistically significant impacts on the primary outcome measures in the remaining three outcome domains for the 1-year impact analysis. Specifically, they had no impacts on school enrollment or completion, combined earnings and benefits, or goals regarding future employment and benefit receipt.
Because the three YTD projects in the Phase 2 sites implemented services about 18 months later than the projects on the Phase 1 sites, they benefited from the refinements to the technical assistance provided by TransCen. This appears to have made a difference, as Table 5 shows that two of these projects, located in Miami-Dade County and West Virginia, had statistically significant impacts on the primary outcomes in the domains of paid employment and youth income.
Impacts of YTD During the Year Following Random Assignment: Phase 2 Sites.

Note. Outcomes are from the YTD 1-year survey and SSA records. Data were weighted for survey nonresponse. Impact estimates and p values are from least squares regression models (continuous outcomes) and logistic regression models (binary outcomes). All dollar-denominated outcomes are measured in December 2008 dollars. YTD = Youth Transition Demonstration; SSA = Social Security Administration.
Based on SSA data. bBased on survey data.
p < .10. **p < .05. ***p < .01.
Like their Phase 1 counterparts, all of the Phase 2 projects significantly increased the proportion of youth who reported the receipt of employment-promoting services. These impacts were especially large in Montgomery County, where we estimate that treatment group members were 22 percentage points more likely, t(597) = 5.45, p = .00, to have received employment-promoting services than control group members, and in West Virginia, where the estimated impact was 30 percentage points, t(691) = 7.78, p = .00. The latter finding is a reflection not only of the high intensity of services offered by the West Virginia YTD project but also of the scarcity of services available in that state for youth who did not have the opportunity to enroll in the YTD project. The Miami-Dade County YTD project increased the rate of receipt of employment-promoting services by an estimated 13 percentage points, t(671) = 3.33, p = .00, an impact comparable with those for the Phase 1 projects.
The Miami-Dade County and West Virginia projects had large and statistically significant impacts on paid employment, but the Montgomery County project did not. In Miami-Dade County, 23% of youth in the treatment group were employed for pay at some time during the year following random assignment, a rate that was 9 points higher than for their control group counterparts, t(707) = 3.32, p = .00. In West Virginia, 43% of treatment youth were employed for pay, reflecting an estimated impact of 19 percentage points, t(700) = 5.52, p = .00. In both these sites, earnings during the year following random assignment were also significantly higher for treatment youth than for control youth: t(709) = 1.83, p = .07 in Miami-Dade County; t(703) = 2.51, p = .01 in West Virginia. The estimated impacts on employment and earnings in both these sites represent increases of about 75% relative to outcomes for the control groups. Notwithstanding the Montgomery County project’s large impact on the receipt of employment-promoting services, it did not have statistically significant impacts on paid employment and earnings.
The Miami-Dade County and West Virginia projects also had positive impacts on youth income during the year following random assignment, reflecting the earnings impacts discussed above and positive impacts on SSI and SSDI benefits. The estimated impact on income was US$424 in Miami-Dade County, t(708) = 1.83, p = .07, and US$717 in West Virginia, t(702) = 3.22, p = .00. These represent increases of 7% and 10%, respectively, relative to the average incomes of control group members. The positive benefit impacts in Miami-Dade County and West Virginia of US$312, t(820) = 2.06, p = .04, and US$192, t(818) = 1.73, p = .08, respectively, were likely driven by SSA waivers for YTD, which insulated participants from reductions in benefits due to earnings and negative disability redeterminations. The Montgomery County project had no impacts on income or benefits.
None of the Phase 2 projects had statistically significant impacts on school enrollment or completion, or on goals regarding future employment and benefit receipt.
Discussion
Similar to findings from other recent studies of youth with significant disabilities (Carter et al., 2012; Simonsen & Neubert, 2013) and living with poverty (e.g., Gold et al., 2013), the findings from the YTD evaluation point to the value of employment-focused services for transition-age youth. However, the YTD findings further illuminate this issue in regard to the intensity of those services.
Although the YTD projects in all six of the study sites succeeded in increasing the likelihood that youth with disabilities received employment-promoting services, only three of the projects resulted in higher rates of paid employment during the year after youth were randomly assigned to treatment or control groups. Compared with projects that provided fewer hours of services, projects that provided more hours had larger impacts on employment outcomes. Of the four projects that provided the most hours of services, as shown in Table 3, three (the Bronx, Miami-Dade County, West Virginia) had statistically significant positive impacts on the likelihood that youth would find paying jobs, and two of these (Miami-Dade County, West Virginia) also had significant positive impacts on annual earnings. In contrast, the two projects that provided the fewest hours of services (Colorado, Erie County) had no impacts on these outcomes. The implication is that a high dose of services such as those in the YTD program model may be required to achieve positive employment results for youth with disabilities.
Three additional factors are important to highlight in regard to the projects in the Phase 2 study sites (Miami-Dade County, Montgomery County, West Virginia). First, TransCen, the technical assistance provider, encouraged project staff to make paid employment the proximate objective of virtually all services. Second, project staff members were given intensive training, including one-on-one mentoring in the field, in conducting job development with employers. Third, the evaluation team provided project managers with tools to monitor the hours of employment services delivered by their staff and the employment outcomes achieved by participants. These refinements resulted in a greater intensity of project services with a sharper focus on employment, especially in the Miami-Dade County and West Virginia sites. The evaluation findings for these sites clearly show that with a sharp focus on employment outcomes and support for project staff to pursue those outcomes, the employment and earnings of youth with disabilities can be improved, at least in the short term.
Limitations and Implications for Future Research
The strength of the interventions, as measured by service hours, was uneven across the YTD projects and thus intervention fidelity was variable, especially between the projects in the Phase 1 and Phase 2 sites. It is therefore difficult to draw broad inferences from the findings across the study sites. Furthermore, the projects in the Phase 2 sites received more intensive technical assistance in implementing employment-focused interventions. It is not known whether the projects in the Phase 1 sites would have generated more positive impacts with refocused technical assistance designed to improve employment-related services. The fidelity of interventions to their program models would be a useful area for examination in future research. Nevertheless, the samples in the study sites were large enough to provide more than ample statistical power for the within-site comparisons of the treatment and control groups to offer useful implications for in-the-field practice.
The lack of impacts on employment and earnings by the Montgomery County YTD project is notable, given that it provided a dose of services comparable with those provided by the three projects that generated statistically significant positive impacts. This may be explained by two factors: First, 80% of treatment group youth (and a comparable percentage of control group youth) in Montgomery County were not SSI or SSDI recipients; therefore, they may not have had consistently large barriers to employment, and second, the services available to control group members in that county were relatively strong. The implication of these factors is that many of the youth in this site who enrolled in the evaluation may not have needed help to find jobs, but those who did need help, even those in the control group, had access to relatively strong services; consequently, youth in both groups achieved high rates of employment.
Implications for Practice
These findings underscore the need for youth-serving entities to increase and redirect their efforts to focus on employment. Research not only supports the value of employment-focused interventions for youth with disabilities, it also has consistently shown that the longer individuals with disabilities remain out of the labor market, the greater the likelihood that they will never find work (Kraus, Frank, Dasinger, Sullivan, & Sinclair, 2001; Young, 2010). For youth on SSI, this has the added implication that dependency on public income support will be lifelong. Simply put, youth need to be exposed to work opportunities to have a reasonable expectation of being employed as adults. This means that schools will need to direct resources to include work opportunities in educational services; vocational rehabilitation agencies will need to work with schools and other partners to effectuate work opportunities for youth before, during, and after school exit; and employment service providers will need to intensify their services and sharpen their focus on employment outcomes.
An additional implication for practice is suggested by the fact that the YTD projects in the Phase 2 sites received more intensive technical assistance; that is, any increase in service intensity should be accompanied by enhancements to the capacity of practitioners to deliver outcome-focused services. In other words, training and opportunities to build practitioner skills in job development and assisting youth in job search should be integral components of professional development.
Conclusion
These early results from the YTD evaluation provide qualified support for interventions that expose transition-age youth with disabilities to competitive paid employment. This is an especially useful inference in that the employment outcomes for youth on SSI are very poor (Wittenburg & Loprest, 2007). In other words, in the presence of strong interventions that include substantial doses of services emphasizing employment, disability and poverty can be mitigated as deterrents to employment. Further research is required to determine the longer term effects of the YTD projects. The YTD evaluation team is collecting data covering 3 years after random assignment, which should provide more definitive evidence on whether the projects had positive impacts on employment and other key outcomes following the cessation of services.
Footnotes
Acknowledgements
We would like to thank Joyanne Cobb and Jeffrey Hemmeter of the Social Security Administration and Jamie Kendall of the U.S. Department of Health and Human Services for the guidance they provided to the Youth Transition Demonstration.
Authors’ Note
The opinions and interpretations presented in this article, as well as any errors, are those of the authors rather than the funder.
Declaration of Conflicting Interests
The author(s) declared no potential conflicts of interest with respect to the research, authorship, and/or publication of this article.
Funding
The author(s) disclosed receipt of the following financial support for the research, authorship, and/or publication of this article: The Social Security Administration provided funding for the Youth Transition Demonstration evaluation under contract number SS00-05-60084.