
Abstract
This study uses data from the National Longitudinal Transition Study–2 to examine the rates at which youth with emotional disturbances received services during and up to 8 years after high school. Parents’ efforts to obtain services, information sources accessed, problems encountered, and the perceived sufficiency of services to meet youths’ needs are described. Findings show a drop in receipt rates for several services in the first 2 years post high school, relative to those received during high school, and a continued decrease thereafter. An increase in the reported effort to obtain services accompanied this decline in receipt rates. Implications for transition planning to build a better bridge from high school to the adult service systems are discussed and aspects of a research agenda are outlined.
The life stage of emerging adulthood (Arnett & Tanner, 2006), typically considered ages 18 through 25 years, encompasses several critical transitions for all young adults. In fact, research suggests that more “life markers” occur during this life stage than any other (Grob, Krings, & Bangerter, 2001). Many young adults further their education or training in preparation for employment, and most enter the workforce and experience increasing, though often still limited, financial independence (Aud, KewalRamani, & Frohlich, 2011). Family relationships evolve as young adults increasingly center their social lives outside the family (Tanner, 2006). Parenting may also be a part of their lives (Martin et al., 2012).
Most young adults traverse this period relatively successfully, yet some “vulnerable populations” (Osgood, Foster, Flanagan, & Ruth, 2005a) struggle during the transition period due to limited skills; health or mental health challenges; unreliable or nonexistent familial support; involvement with drugs, alcohol, or the criminal justice system; and poverty (Osgood, Foster, Flanagan, & Ruth, 2005b). Youth with disabilities as a whole—and in particular youth with emotional disturbances (ED)—have multiple contributors to vulnerability in transition (Levine & Wagner, 2005). Although youth who receive special education services in the ED category share a label, they are a diverse group whose members often have a range of co-occurring disabilities. For example, parents of the nationally representative sample of high school–age youth with ED in the National Longitudinal Transition Study–2 (NLTS2) reported that 29.9% also had a learning disability and 63.1% had attention-deficit disorder (ADD)/attention-deficit/hyperactivity disorder (ADHD; Wagner et al., 2003). The range of medications youth were reported to take offers additional insight into the variety of emotional disabilities youth and their families were dealing with. Parents indicated that 45.6% of high school–age youth with ED took disability-related medications, including stimulants (28.8%), antidepressants (28.9%), mood stabilizers (12.5%), and antipsychotic (11.5%) and seizure medications (7.7%). Their disabilities often were evident in their poor social skills and in the frequency with which they were subject to disciplinary actions at school—72.9% of youth with ED ages 13 through 17 had been suspended or expelled from school, often more than once (Wagner et al., 2003).
In addition to the challenges posed by their disabilities, youth with ED also were more likely than both youth with disabilities as a whole and youth in the general population to be living in poverty (29.8% vs. 24.8% and 19.7%, respectively), to be living with a single parent (38.1% vs. 31.1% and 22.5%), and to have an unemployed head of household (24.0% vs. 17.0% and 8.5%; all comparisons significant at p < .01 and .001, respectively; Wagner et al., 2003). Although the low level of social and cultural capital associated with these aspects of socioeconomic status (SES) can be detrimental to youth with disabilities in shaping their transition experiences and navigating the adult service system (Trainor, 2008), recent research exploring the direct and indirect effects of SES on the outcomes of youth with disabilities (Wagner, Newman, & Javitz, 2014) demonstrated that “to a sizeable extent, the effect of SES was mediated by other factors” (p. 14), particularly the nature and severity of disability. Thus, these demographic factors may complicate but not detract from the important role of ED as a disability in shaping youth’s transition experiences.
Because of the multiple aspects of disability and poverty that many youth with ED and their families contend with, it may not be surprising that their post–high school outcomes have been described as “particularly troubling” (Wagner, 1995). NLTS2 data indicate that nationally 56% of out-of-school youth with ED had dropped out of high school (Wagner, 2005). When they had been out of high school up to 8 years, they were significantly less likely than youth in the general population and youth with disabilities as a whole to be employed. Six in 10 had at some point been arrested, of whom 27% had been arrested in the preceding 2 years (Newman et al., 2011).
Federal law requires that youth who qualify for special education services in high school receive a variety of supports, services, and accommodations to help them function successfully at school and prepare for a positive transition (Levine, Marder, & Wagner, 2004). Many, including 72.8% of high school students with ED, have continued needs for supports and/or services after high school documented in their transition plans, with the most commonly cited needs being postsecondary education accommodations (41.6%); vocational training, placement, or supports (38.7%); behavioral intervention (20.8%); mental health services (12.2%); and social work services (11.0%; Cameto, Levine, & Wagner, 2004). Despite this, transitioning from the supports and services accessed during high school to the adult service system has been described by parents whose children made that change as feeling like “dropping off a cliff” (Stewart, Law, Rosenbaum, & Willms, 2001, p. 13).
The adult service “system” is actually a tangle of multiple and complex medical, social, and vocational rehabilitation (VR) systems (Committee on Disability in America, 2007) that often are difficult to navigate by young adults with disabilities and family members (Revell & Miller, 2009). Those systems have multiple policy drivers (Joseph P. Kennedy Jr. Foundation, 2008) and funding streams (Whittenburg, Golden, & Fishman, 2002) that create a “patchwork of state and federal disability support programs [with] pervasive inefficiencies, including overlaps and gaps in services, misaligned incentives, and conflicting objectives” (Mann & Stapleton, 2012, p. 1). Studies have indicated that reductions in supports and services often accompany the transition from child to adult services (Vander Stoep, Davis, & Collins, 2000; Warger, 2003), and adult service systems are reportedly not well prepared to support the ongoing needs of young adults with disabilities (Ward, Mallett, Heslop, & Simons, 2003).
Despite these well-recognized potential perils in the transition from high school to post–high school life, little is known about how youth with ED nationally fare in that transition. The existing transition-related knowledge base tends to focus on one aspect of transition in isolation from others (Beresford, 2004; Stewart et al., 2012), for example, meeting financial support needs (Mann & Stapleton, 2012), making health care system transitions (Committee on Disability in America, 2007), or reaching employment goals (Carter & Lunsford, 2005). The knowledge base includes a large number of qualitative studies (Grigal, Neubert, Moon, & Graham, 2003) that focus largely on barriers or challenges faced in the transition (Betz, 2004; Young, 2007) but generally fail to cover the supports, services, and accommodations actually accessed by young adults with disabilities and their experiences in doing so (Beresford, 2004).
This context-specific and often anecdotal knowledge base about the service use and experiences of youth and young adults with ED is not a solid foundation on which to identify policy and practice changes that have the potential to improve their post–high school outcomes by improving access to and uptake of key services. This study aimed to establish that firm foundation by using nationally representative data from NLTS2 to address three research questions:
Method
Sample
NLTS2 included more than 11,000 students who were ages 13 to 16 years and receiving special education services in Grades 7 through 12 or in ungraded programs on December 1, 2000. Sampling involved first drawing a stratified random sample of school districts that served students in the eligible age range and then randomly selecting students from each district from each of the 12 special education disability categories. This sampling approach produces weighted population estimates that are nationally representative of students receiving special education services in the targeted age range and of students in each disability category. Full details of the study’s weighting strategy were previously published (Wagner, Kutash, Duchnowski, & Epstein, 2005).
The present study includes NLTS2 sample members who (a) were receiving special education services in the category of ED, (b) were attending general education secondary schools (i.e., not special schools serving only students with disabilities), and (c) had data on service receipt reported by parents at least once while they were in high school and at least once after they had left high school. The sample was restricted to students attending general education secondary schools to control for variations in service experiences that could result from school type rather than individual and family factors and because general education school students are the large majority of high school students with ED (74.0%; NLTS2, 2001b), making findings broadly generalizable. A total of 550 youth with ED met these criteria. (All sample sizes have been rounded to the nearest 10 in compliance with Institute of Education Sciences rules on reporting results of analyses of restricted-use data.)
The students represented in the analysis sample were 74% male. At the last data collection point when youth were in high school, their average age was 17.1; they were an average of 21.7 years old at the last data collection point for each sample member. Their racial/ethnic distribution was 62.2% White, 25.3% African American, 10.2% Hispanic, and 2.4% Mixed or Other races/ethnicities. More than half of youth (55.9%) had mothers with a high school education or less, and 39.7% lived in households with annual incomes in 2001 of US$25,000 or less. At the last data collection point, 58.9% of youth had left high school by graduating (as opposed to dropping out, “aging out” at 21, or receiving a certificate of completion). The study sample’s demographic characteristics closely mirrored those of the full-weighted NLTS2 sample of youth with ED: 77.1% male, 61.4% White, 25.0% African American, 10.2% Hispanic, 60.4% mothers with high school education or less, 35.2% with incomes less than US$25,000, demonstrating that the weighted subsample was nationally representative.
Data Sources
NLTS2 parent/guardian and youth interviews/surveys
Parent/guardian telephone interviews, conducted in English and Spanish using Computer-Assisted Telephone Interview (CATI) techniques, were attempted five times from 2001 through 2009 with all parents for whom working contact information was available. Interviews were also attempted with youth who were 18 years or older four times from 2003 through 2009. An abbreviated mail questionnaire was sent to parents and youth who could not be reached by phone. Response rates for the parent/youth interviews ranged from 81.9% at Wave 1 to 55.1% at Wave 5. Data in each wave were weighted to represent the full population of youth with disabilities and youth in each federal special education disability category.
School district rosters
Information about the primary disability category of NLTS2 sample members came from rosters of students receiving special education services under the auspices of participating school districts.
Service Use Measures
Service use variables draw on parent reports for the high school and post–high school years through Wave 4 data collection (2007). Wave 5 (2009) data collection substituted youth reports regarding services for parent reports because many youth no longer lived with parents and, thus, would be more accurate reporters of their own service use and related experiences than would parents. Parents of high school students were asked whether their son/daughter had received each of 19 services in the preceding year. A positive response was followed by a question asking whether that service had been provided by or through the student’s school or district and a question asking whether the student was receiving it currently. For each service, a dichotomous variable was created indicating whether respondents reported that a student had received the service from his or her school. Services received from other sources were not included in this study, because the focus was on identifying school-related issues with service receipt and perceived sufficiency and implications for school actions to address them. A similar approach was taken with parents of post–high school youth (through Wave 4) and youth themselves (Wave 5). Analyses for youth out of high school involved dichotomous variables indicating whether there was any evidence of receipt of each service at any time since leaving high school and whether the youth currently was receiving each service.
Analyses regarding service receipt during and after high school (see Table 1) compared reports of having received each service at any time during high school and at any time in the post–high school years covered by NLTS2. On average, students had been out of high school 4.5 years at their last data collection point. This strategy combined reports of service experiences across waves of data, thereby providing the broadest picture of service receipt available during the two time periods. Questions regarding service experiences (see Table 2) were asked in each wave about the services received currently or in the past 2 years if the service was not being received currently. Because experiences could have differed across waves, data could not be combined for the full high school period and the full post–high school period, as in Table 1. Thus, a single time point was chosen for describing in high school and the post–high school service experiences (i.e., the last report of service receipt in each period). Results regarding RQ3 reflect the intent to explore the trend in post–high school service receipt over time. This was accomplished by reporting findings for out-of-high school youth in 2-year time segments, consistent with the biannual NLTS2 data collection cycle and questions about service receipt in the past 2 years.
Service Receipt, by Time Period.

Note. Services received during high school were those said to have been provided from or through a student’s high school. The table does not include services received by fewer than 10% of youth with ED (e.g., audiology services, orientation/mobility training). HS = high school.
p < .05. **p < .01. ***p < .001 (compared with services received during high school).
Experiences in Accessing Services, by Time Period.
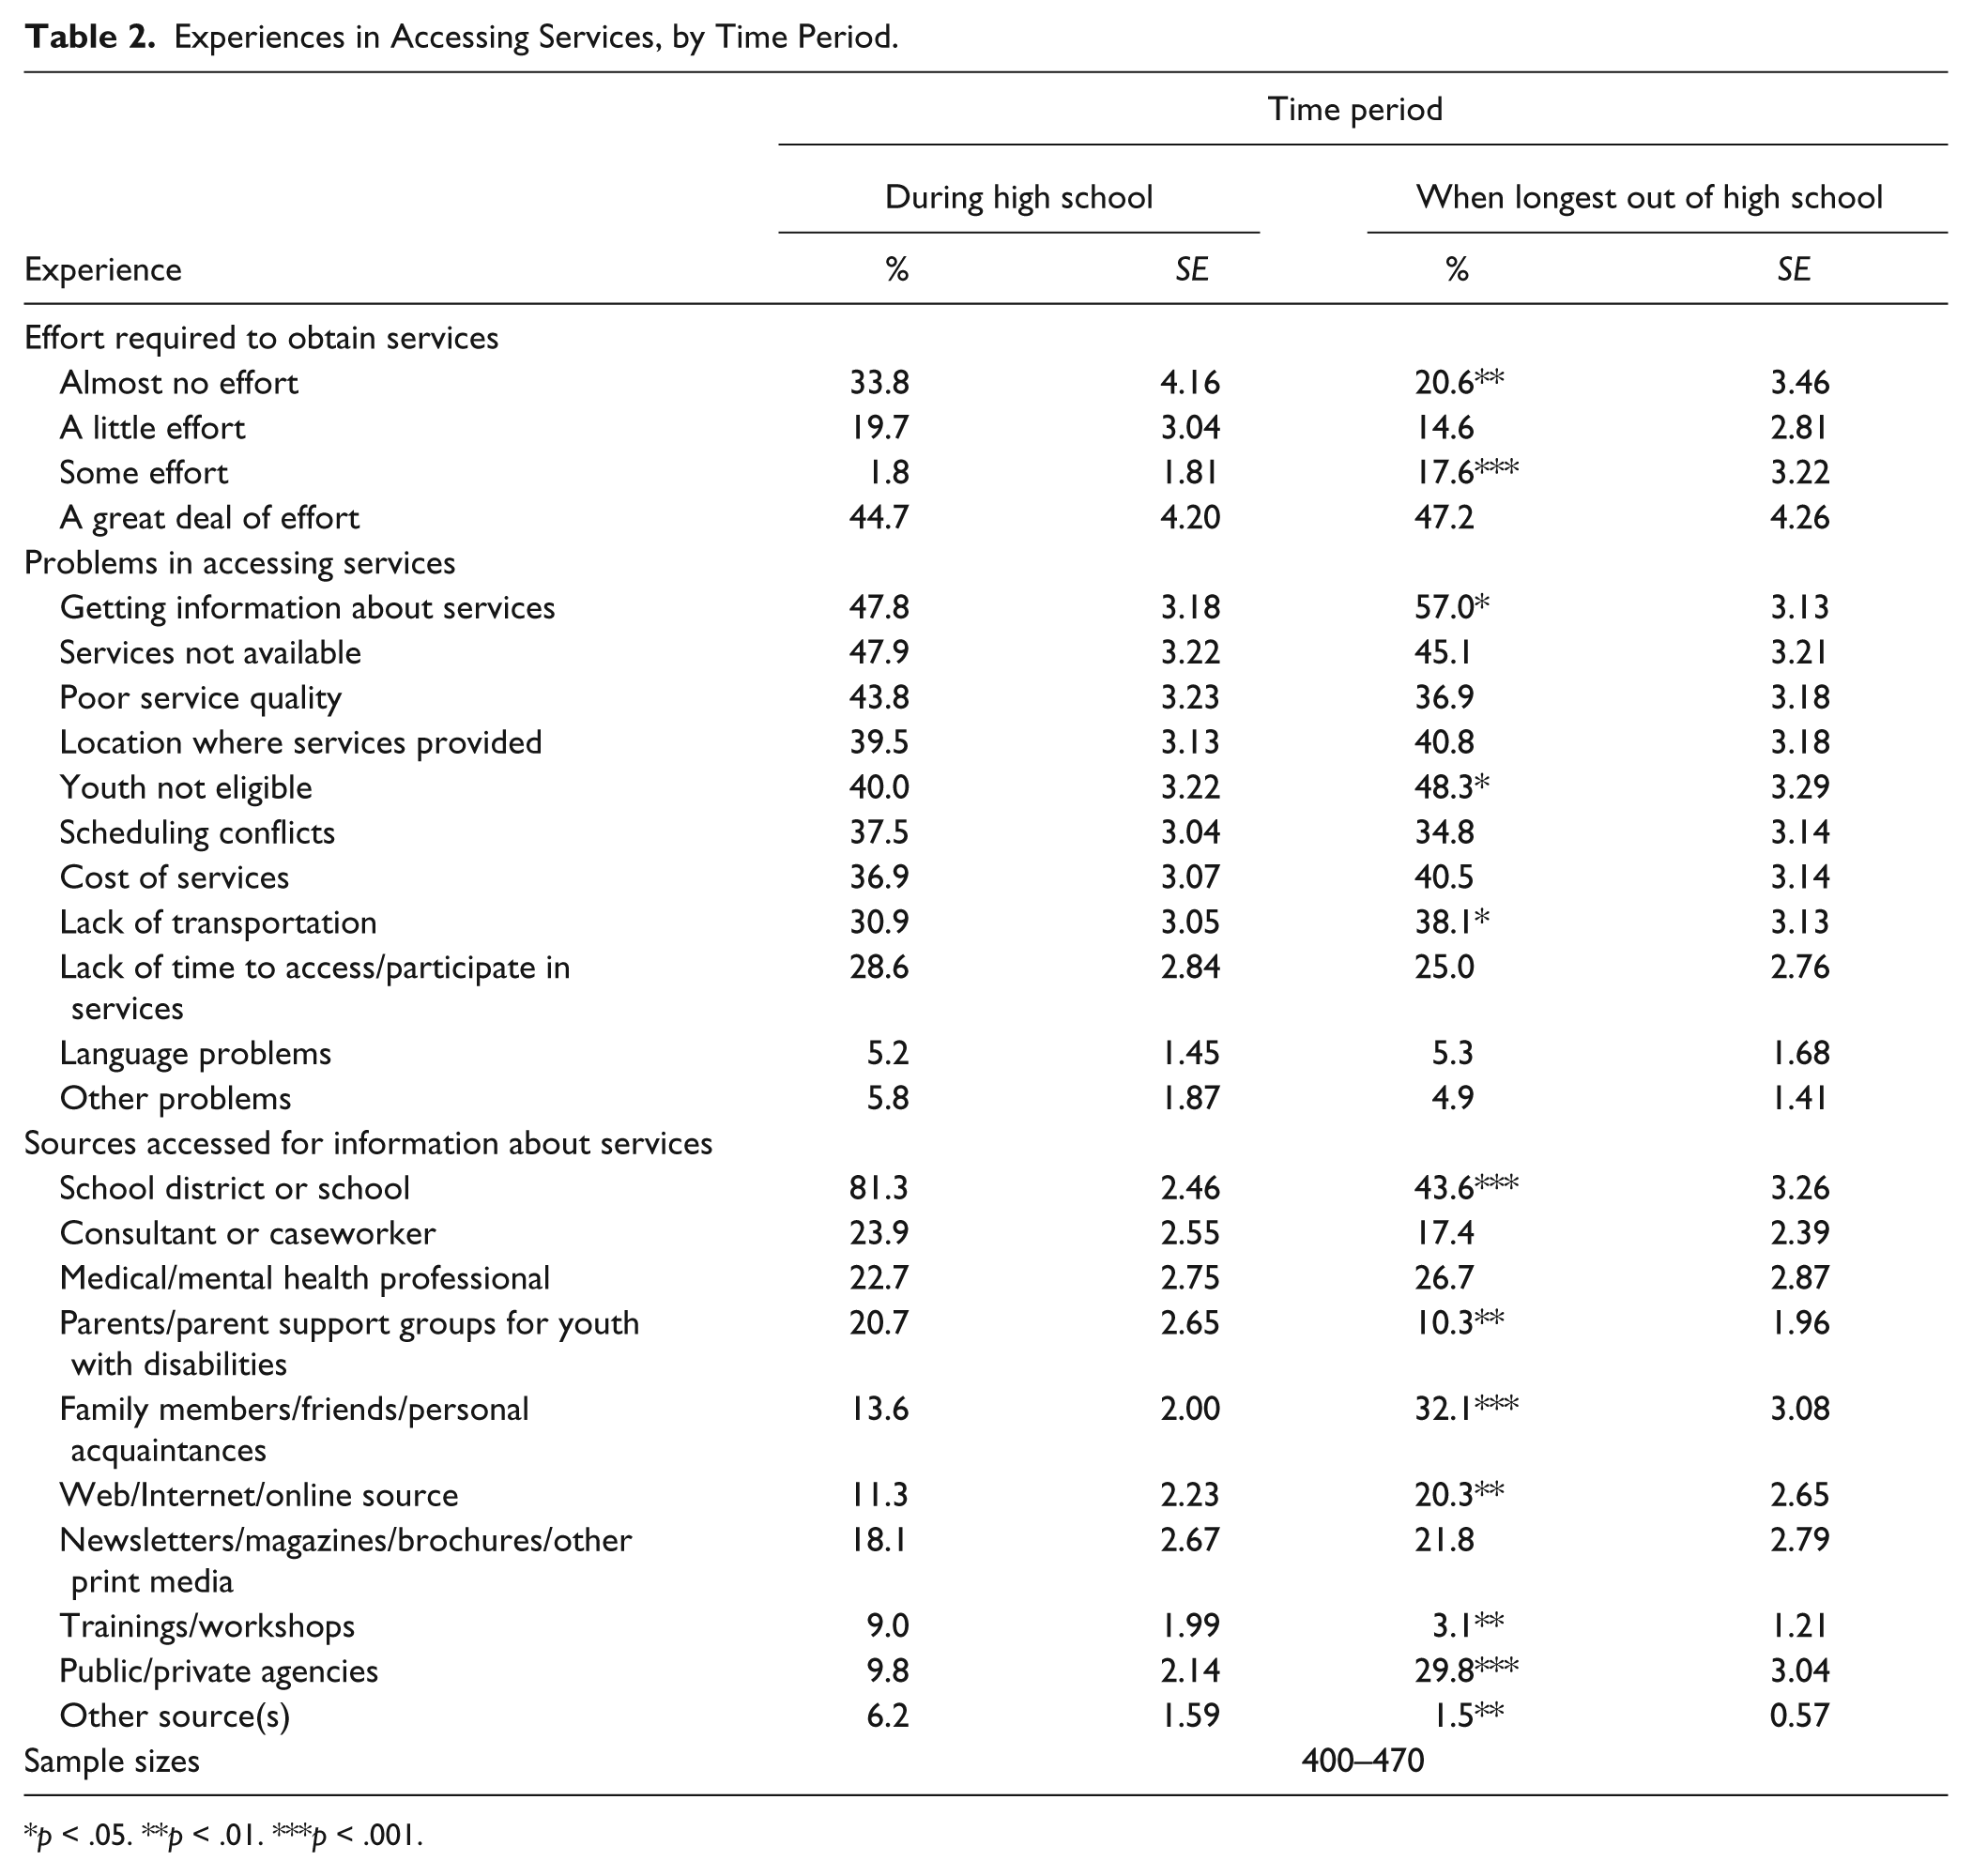
p < .05. **p < .01. ***p < .001.
The sum of positive responses to individual service items indicates the number of services received (i.e., service intensity) for each youth. In addition, parents and youth who indicated receipt of any kind of service also were asked whether they believed the services were “enough” (i.e., service sufficiency) and how much effort it had taken to acquire services (almost none, a little, some, a great deal). All respondents were asked where they learned about services (open-ended responses coded into 10 categories) and problems encountered in trying to get services (open-ended responses coded into 11 categories). Categories are listed in Table 2. Missing rates for analysis variables ranged from 7% to 17%. No missing data were imputed.
Data Analyses
All analyses were performed using SAS 9.2 (SAS Institute, Cary, NC). The SAS PROC SURVEY Taylor Series Linearization method was used to account for the complex sampling design and provide the exact estimate of the standard errors. A major strength of NLTS2 is that weights are available that make the sample representative of youth with disabilities nationally as a whole and in each primary disability category. All findings were weighted to represent the population of youth with ED in the NLTS2 age range using the weight for analyses requiring at least one post–high school wave of data (wt_anypyphs). The research questions were addressed with descriptive statistics and standard errors. Two-tailed F tests were used to identify significant differences.
Results
RQ1: Service Receipt Rates
There was a sizable decrease in receipt of several services in the post–high school years relative to the high school years (see Table 1). On average, parents reported that youth with ED received 2.6 services over their high school years and an average of 1.8 services after high school (p < .001). While in high school, 17.0% of students with ED were reported to have received none of the services included in the NLTS2 interview, compared with one third (33.8%) of post–high school youth (p < .001). Nonetheless, the two most commonly reported services received in high school were also the most commonly received after high school. Mental health services were reported to have been received by 43.2% of youth with ED from or through their high schools while enrolled, compared with 38.0% of youth up to 8 years after leaving high school. Similarly, 40.5% of high school students with ED reportedly received vocational services, as did 35.1% of post–high school youth. The most commonly received vocational services during high school were career skills assessment (provided to 58.3% of youth), career counseling (45.9%), instruction in looking for a job (38.7%), and job readiness training (35.6%). Frequently reported post–high school vocational services included training in job search skills (21.6%), compiling of interest inventories (16.1%), job skills training (15.7%), and unspecified vocational training (15.3%). State VR agencies, “other agencies,” and family members were the most commonly reported providers of vocational services to post–high school youth with ED (27.7%, 25.5%, and 22.7% of youth, respectively).
Case coordination was the third most commonly reported service provided to youth with ED from or through their high schools (35.2%), where school staff members often served in the case coordinator role (Levine et al., 2004). However, unlike mental health and vocational services, there was a significant decline in youth having a case coordinator after leaving high school, when 22.7% were reported to have had case coordination services at some time since high school (p < .01). Family members were reported to act as case coordinators for half of youth who were reported to have a coordinator; 44.1% of youth were reported to have a professional serve in that role, and someone from the youth’s high school was said to coordinate services for 7.1% of youth even after leaving high school.
Other significant differences between high school and post–high school service receipt rates included drops of 25.5 percentage points for help from an in-home or in-class aide (p < .001), 10.9 percentage points for disability-related transportation services (p < .001), and 12.1 percentage points for speech–language pathology services (p < .001). Interestingly, the significant reductions in receipt of these services were accompanied by an increase in parents’ reports of youth receiving “enough” services (62.7%–73.1%, p < .05).
RQ2: Experiences Accessing Services
NLTS2 data also indicate that the process of obtaining services changed when youth left high school (see Table 2). During high school, about one third of youth with ED (33.8%) had parents who reported that it took “almost no effort” for them to obtain services for their student, and 19.7% had parents who reported expending only “a little effort” to do so. Significantly fewer post–high school youth had parents who reported the need to expend “almost no effort” in accessing services (20.6%, p < .01). There was a commensurate significant increase in reports of needing to expend “some effort” to acquire services after high school (17.6% vs. 1.8%, p < .001). At both time points, however, expending “a great deal of effort” was the most common parental response during and after high school (44.7% and 47.2%, respectively).
The most common problem in accessing services that parents of youth both in and out of high school reported was getting information about service availability and eligibility requirements. A significantly higher percentage of post–high school youth had parents who reported that problem than did high school students (57.0% vs. 47.8%, p < .05). The post–high school years also saw higher rates of reported problems with youth not being eligible for services (48.3% vs. 40.0%) and not having transportation to get to service locations, commensurate with the drop in receipt of transportation services after high school (38.1% vs. 30.9%; p < .05 for both comparisons). The unavailability of needed services was reported as problematic for parents of 47.9% and 45.1% of high school students and post–high school youth, respectively, and the poor quality of available services was reported by parents of 43.8% and 36.9% of youth of the two groups. Four in 10 students in each group had parents who said that service location was problematic (39.5% and 40.8%).
The sources on which parents relied for information about services also changed over time. A large majority of high school students with ED (81.3%) had parents who reported relying on their school district or school for information about services. Even after students left high school, those were their most commonly reported sources of such information, although reliance on them decreased significantly (43.6%, p < .001). Relying for information on parents or parent groups for children with disabilities also declined over time (20.7% vs. 10.3%, p < .01), as did reliance on trainings or workshops (9.0% vs. 3.1%, p < .01) and “other sources” (6.2% vs. 1.5%, p < .01). In contrast, parents of post–high school youth were more likely than those of high school students to turn for information about services to family members, friends, or other personal acquaintances (32.1% vs. 13.6%, p < .001), online sources (20.3% vs. 11.3%, p < .01), and public or private agencies (29.8% vs. 9.8%, p < .001).
RQ3: Service Receipt and Sufficiency Changes by Years out of High School
The drop in services receipt rates after high school generally persisted over time (see Table 3). Although there was not a significant drop in the average number of services youth were receiving at the time of the interview (0.76 within 2 years of high school exit, 0.62 for 2 to 4 years post high school, and >4 years post high school), a sizable increase occurred in the proportion of youth who were reported to be receiving no services at all at those time points. Within 2 years of leaving high school, 64.8% of youth represented in NLTS2 reportedly were receiving none of the services investigated in this study, a rate that increased to 74.3% and 83.2% at the subsequent two time points (p < .05 and p < .001). The only significant change in the rate of receipt of a specific service was in having a case coordinator/case manager. More than one fifth (22.0%) of youth out of high school up to 2 years were reported to have one, compared with 13.8% and 8.8% of youth out of high school longer (p < .05 and p < .001).
Services Received at Time of Interview, by Years Out of High School.
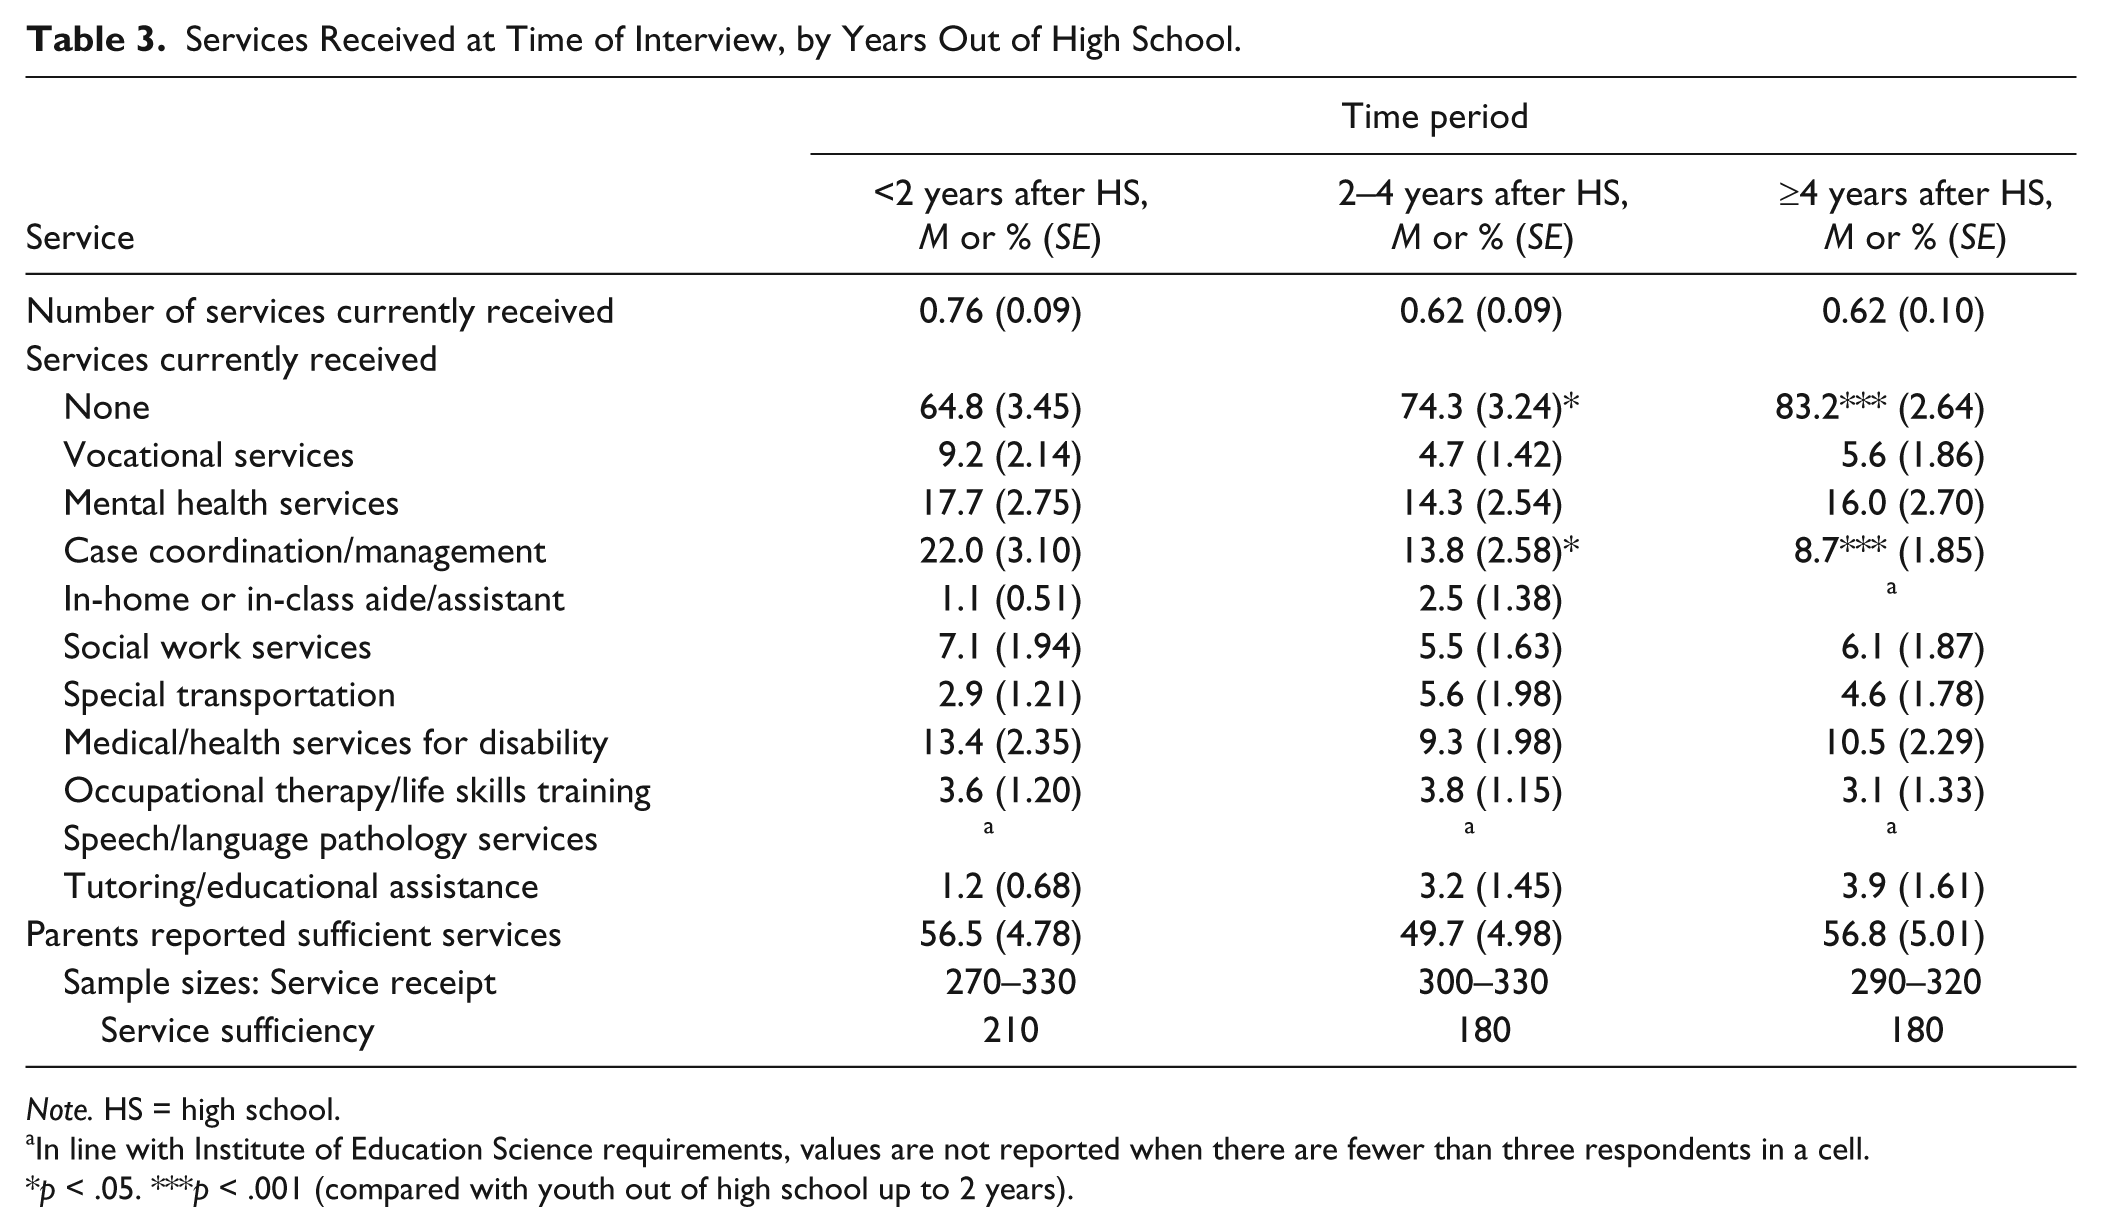
Note. HS = high school.
In line with Institute of Education Science requirements, values are not reported when there are fewer than three respondents in a cell.
p < .05. ***p < .001 (compared with youth out of high school up to 2 years).
Discussion
The metaphor of a “cliff” sometimes used to describe the drop-off in services when youth leave high school seems to exaggerate the level of decline revealed in NLTS2 analyses. Although the percentage of youth reported by parents to have received no services almost doubled from the high school to the post–high school years, two thirds of youth actually had received one or more services at some time during that time period. But the data suggest that their service receipt was sporadic—many fewer youth were receiving services at the various post–high school interview time points than had received them at all over that time period. In fact, the percentage of youth who were reported not to be receiving any services at all at the time of the interview increased from almost two thirds of youth whose parents were interviewed when they had been out of high school up to 2 years to more than 8 in 10 youth who had been out of high school more than 4 years.
Perhaps particularly worrisome are the rates of receipt of mental health services. More than two thirds of youth with ED had received such services during high school from their school or other sources (Levine et al., 2004); yet, only about 1 in 7 youth with ED was reported to be receiving mental health services at the time of the NLTS2 interview across the post–high school years. In fact, despite high schools providing mental health services to more than 43.2% of students with ED, the transition plans of only 12.2% of youth with ED cited mental health services as a post–high school service need, and contacts were made with mental health service providers for only 16.6% of students with ED as part of their transition planning (Cameto et al., 2004). Other NLTS2 analyses also demonstrated a significant drop in youth with ED taking prescription medications to control behavior, attention, or mood. Parents of 41.7% of high school students with ED reported in Wave 1 that youth were taking such medications (NLTS2, 2001a); 21.8% of youth were reported to be taking them in Wave 4 (p < .001; NLTS2, 2007), when virtually all youth with ED were out of high school.
The low rates of mental health treatment and declining rates of medication use for behavior-related issues raises a disturbing question. To what extent did youth who were eligible for special education services because of emotional disorders in high school have continuing mental health treatment needs that were increasingly going unmet in their early post–high school years? Also disturbing is the possibility that youth with ED themselves were contributing to the problem of declining accessing of services. NLTS2 data reveal that when youth with ED who were enrolled in postsecondary school were asked when their school became aware of their disability, 54.2% said they did not believe they had a disability (NLTS2, 2009). The lack of self-awareness and self-knowledge that enables youth with ED to deny the presence of their disability can be a powerful obstacle to accessing needed services and can limit them in achieving the positive post-school outcomes that are associated with self-determination (Wehmeyer & Palmer, 2003).
Also of concern is the relatively low rate of vocational education, training, or supports provided youth with ED after high school. The transition plans of students with ED indicated that 44.2% had a post–high school goal of attending a career or technical education (CTE) school or program and 57.8% had a goal of obtaining competitive employment (Cameto et al., 2004). In pursuit of these goals, 40% of students received vocational services and 9 in 10 took CTE courses while in high school (Newman et al., 2012). Yet, as part of the transition planning process, contacts were made with postsecondary CTE programs for only 23.4% of youth with ED. Contacts with employers or job placement agencies were made on behalf of 24.4% and 29.1% of youth with ED, respectively. Furthermore, fewer than 10% of them were receiving vocational services at the time of the several post–high school interviews, and other NLTS2 analyses demonstrate that only 7.4% were attending a postsecondary CTE school or program within 2 years of leaving high school (Wagner, Newman, Cameto, Garza, & Levine, 2005).
Study Strengths and Limitations
This is the first study to harness the power of national data to take a longitudinal perspective in analyzing the patterns of service receipt during and after high school of youth and young adults with ED. Furthermore, drawing on parent-provided data regarding their experiences in accessing services for their youth and young adult children with ED illuminates the challenges they faced and the opportunities for reducing barriers to service acquisition.
Although this study makes an important contribution to the literature, there are limitations to consider when interpreting these findings. First, the service receipt measures are limited in that they are dichotomous, no definitions of services were provided to parents, and no NLTS2 data were collected on the frequency or duration of services received. In addition, for services received while students were in high school, the study includes only those provided from or through a student’s school, which underestimates the full range and rates of services received (Levine et al., 2004). Second, the analyses rely on parent-reported data. Some parents may not have been clear on the actual provider/source of youth’s services, and it is unknown how well aware parents were regarding the need for services of their young adult child with ED. Finally, findings generalize only to those who received special education services within the primary disability category of ED; students with emotional or behavioral problems that were not receiving such services were not represented in NLTS2.
Implications and Conclusion
This study demonstrates a decline in overall service receipt when youth with ED left high school and ongoing unmet needs for services; across the three post–high school time periods studied, more than 40% of young adults with ED were reported to have unmet service needs. Vocational services—those most closely matched to the employment goals of the majority of youth with ED—and mental health services—those most closely matched to the nature of their disability—were provided from their high schools or other sources to majorities of youth while in high school but reached small fractions of youth after high school. One third of young adults with ED received no services at all in the post–high school period covered by NLTS2, with a lack of information on how to obtain services being a key obstacle reported by parents in their efforts to obtain services.
Implications for practice
These findings suggest that transition planning for high school students with ED needs to more actively involve and coordinate with representatives of adult service system organizations to build a better bridge from high school to those systems. The transition planning experienced by youth with ED rarely involved anyone besides school staff; state VR personnel participated in transition planning for 12% of these youth, and other service providers, including mental health professionals, participated in transition planning for only 18% of students (Cameto et al., 2004). Parents also need to be better informed about the adult service system; only one third were reported by school staff to have been given information on adult services as part of transition planning (Cameto et al., 2004). Parents also should be more actively recruited to participate in transition planning and to have a meaningful role in that process. Earlier NLTS2 analyses (Wagner & Davis, 2006) indicated that more than one third of parents of youth with ED reported wanting greater involvement in setting transition goals and planning for their student’s post–high school years than the planning process supported. In addition, one fourth of students with ED had parents who reported that the transition planning process was “not very” or “not at all helpful,” significantly more than parents of youth with other disabilities (Wagner & Davis, 2006).
Furthermore, students with ED need to be better prepared to advocate for themselves in the transition planning process. The Individuals with Disabilities Education Act, as reauthorized in 2004, requires that transition planning be “based on the individual child’s needs, taking into account the child’s strengths, preferences, and interests” (IDEA §300.43). However, less than two thirds of youth with ED had received instruction in how to participate in their transition planning, so that their needs, strengths, preferences, and interests could be expressed most effectively, and only 1 in 10 were reported to have taken a leadership role in that process (Cameto et al., 2004; Wagner & Davis, 2006). School staff reported that the transition plans of less than three fourths of youth with ED laid out a course of study that was linked to achieving their transition goals. Even when such a course of study was specified, school staff reported only about one third of youth with ED had a school program that was “very well suited” to achieving their goals (Wagner & Davis, 2006). Unfortunately, these transition planning experiences of youth with ED are not strikingly different from those of youth with disabilities as a whole (Cameto et al., 2004).
In a MacArthur Foundation–sponsored book on “the transition to adulthood for vulnerable populations” (Osgood et al., 2005a), populations that included youth with disabilities (Levine & Wagner, 2005), youth are described as being “on your own without a net.” In the case of youth and young adults with ED, the social costs of having no safety net are high. Relative to other youth, high rates of poverty (Marder, Levine, Wagner, & Cardoso, 2003), substance use (Yu, Huang, & Newman, 2008), criminal justice system involvement (Newman et al., 2011), unwed childbearing (Newman et al., 2011), and institutionalization (NLTS2, 2010) threaten the ability of these youth to be productive members of society. It would seem a good investment to ameliorate these vulnerabilities by strengthening the service net for them both during high school and in the years beyond.
Implications for research
Greater research attention to the service issues experienced by youth with ED and their families could well support that effort. Several avenues for further research await attention.
Transition planning
The experiences of youth with ED in the transition planning process highlight a lack of student preparation for and participation in it, weak links between high schools and community service agencies, and many youth and parents being poorly informed about post-school services, thus making them unable to negotiate those service systems. Researchers have identified a number of “best practices” in transition planning (Cobb & Alwell, 2008; Kohler & Field, 2003; Test et al., 2009; Walters, Zanghi, Ansell, Armstrong, & Sutter, 2011), yet in the transition arena, as in many other fields, implementation clearly lags behind identification. What are the disincentives or obstacles in schools and service systems that hinder more effective transition planning, and where are there instructive examples of schools/systems that have found a work-around? In this information age, why do so many parents report difficulty in finding the information they need to negotiate the adult service systems on behalf of their young adult children and how can they be helped to find what they need? Qualitative research addressing these kinds of questions could support more effective implementation of known best practices and expanded adoption of innovative, collaborative approaches to service system improvement.
Youth self-determination
An increasing body of research underscores the importance of youth learning the combination of skills, knowledge, and beliefs that define self-determination (Algozzine, Browder, Karvonen, Test, & Wood, 2001). The fundamental attributes of self-determination include, among others, self-awareness and self-knowledge (Wehmeyer, Shogren, Zager, Smith, & Simpson, 2010). The self-denial of disability shown in the previously cited NLTS2 data on the part of postsecondary students with ED is consistent with research that has shown youth with ED are less self-determined than their nondisabled peers (Carter, Lane, Pierson, & Glaeser, 2006). Intervention researchers could usefully focus on how to individualize self-determination instruction for students with ED to increase its effectiveness, a need identified by Algozzine and colleagues (2001) more than a decade ago.
Obstacles to accessing service
What contributes to youth and young adults with ED not seeking or not being able to access needed services? This question could be addressed comprehensively from a socioecological perspective, which incorporates both individual and environmental factors in understanding a social phenomenon (Bronfenbrenner, 1979, 1986). The characteristics and proclivities of youth themselves and the nature and severity of their disability; family composition, relationships, and resources; community health, functioning, policies, and resources; and state political, financial, and policy contexts could all be incorporated into community-specific analyses of service systems and the people who do and do not access them.
Impacts of unmet service needs
What are the effects on the post-school outcomes of youth and young adults with ED not seeking or not being able to access needed services? Further analyses of NLTS2 data could begin to address this question to the extent the data permit. A more in-depth and current perspective could come from a portfolio of more focused studies that combine qualitative “stories” of individual youth/young adults with larger scale surveys of appropriate samples of transitioning youth.
Fruitful pursuit of a broad range of studies addressing these and other questions would go far to illuminate the issues surrounding the experiences of youth and young adults with ED with services during and after high school and the personal and social costs of unmet service needs.
Footnotes
Authors’ Note
The content of this publication does not represent the views or policies of the funding agencies and there should be no assumption of federal government endorsement through a NIDRR- and SAMHSA-funded subgrant from the University of Massachusetts, Worcester. The content of this publication does not necessarily reflect the view or policies of the U.S. Department of Education, nor does mention of trade names, commercial products, or organizations imply endorsement by the U.S. government.
Declaration of Conflicting Interests
The author(s) declared no potential conflicts of interest with respect to the research, authorship, and/or publication of this article.
Funding
Partial funding for this study was provided by the National Center for Special Education Research, Institute of Education Sciences, U.S. Department of Education (grant number R324A100025) and by the National Institute of Disability and Rehabilitation Research, U.S. Department of Education, and the Center for Mental Health Services, Substance Abuse and Mental Health Services Administration, U.S. Department of Health and Human Services (NIDRR grant H133B090018).