
Abstract
Gender differences have been found in post-school outcomes of students with disabilities, yet these differences are rarely examined. To determine whether male and female high school students with disabilities scored differently in non-academic behaviors known to affect post-school education and employment measured by the Transition Assessment and Goal Generator, we analyzed scores provided by 1,537 high school students with disabilities, 836 family members, and 139 professionals from 30 states. Findings revealed no difference in full-scale scores on Professional or Student versions based on gender of the student. Family members’ overall scores for females were significantly higher, yet the difference was slight. Some differences were found at the construct level on all three versions. Construct differences and implications are discussed.
Preparing students with disabilities for life after high school has been a focus of numerous laws, regulations, and policies since the mid-1980s, which together enacted a transition education process to prepare students with disabilities for postsecondary education, employment, and, as needed, independent living (Neubert & Leconte, 2013). Transition education practices include using transition assessments to identify students’ strengths and needs to build annual transition goals within the transition planning section of students’ Individualized Education Programs (IEPs; Peterson et al., 2013). Yet, students with disabilities continue to lag behind their peers in post-school education and employment outcomes. Individuals with disabilities are twice as likely to be unemployed than their peers without disabilities (Hartnett et al., 2014).
Furthermore, post-school employment and further education discrepancies exist by gender. Erickson, Lee, and von Schrader (2013) found only 31.1% of women with disabilities between the ages of 21 and 64 in the United States were employed compared with 35.9% of men. Work experience proves important for both males and females and allows participants to gain a sense of responsibility, persistence, confidence in pursuing other jobs, and work ethic, yet females tend to experience longer periods of unemployment after high school (Lindstrom, Doren, & Miesch, 2011). Sanford et al. (2011) found 6 years after high school, 75% of males were employed versus 64% of females. Females also report a lack of female role models in the workplace (Ferri & Connor, 2010). Although males with disabilities are more often employed, they seem more willing to accept “the status quo,” as long as they have steady employment. Females tend to display higher levels of persistence and adaptability when faced with workplace and personal challenges (Lindstrom et al., 2011).
In higher education, only 31% of males and 22% of females disclose their disability to the institution. However, female students with disabilities are significantly more likely to graduate from college than their male peers (Pingry-O’Neill, Markward, & French, 2012). In addition, approximately 58% of males and 72% of females who enter higher education do not consider themselves to have a disability after high school (Newman et al., 2011). Powers, Hogansen, Geenen, Powers, and Gil-Kashiwabara (2008) found gender discrepancies still exist in desired post-school outcomes not only with chosen occupations, but with expectations of working at all. Females felt more pressure to have children at a younger age, and males felt more pressure to get a job and live independently.
Males and females have been reported to have some different in-school experiences. Females are less likely to complete vocational courses or participate in community work experiences while in high school (Wagner, Kutash, Duchnowski, Epstein, & Sumi, 2005). Both males and females often report a limited understanding of and involvement in their IEPs and later report the need for self-advocacy skills that could have been taught as part of the student’s involvement in the IEP process (Lindstrom, Harwick, Poppen, & Doren, 2012). When considering a support community, females often report and maintain higher levels of family support than males in post–high school planning (Lindstrom et al., 2011).
When analyzing skills and attributes, female students with disabilities often lack self-confidence, knowledge of their strengths, self-efficacy, have low outcome expectations, and focus more on limitations than strengths when compared with male counterparts (Hogansen, Powers, Geenen, Gil-Kashiwabara, & Powers, 2008; Noonan et al., 2004; Trainor, 2007). When considering self-awareness regarding one’s disability, research suggests women with disabilities are more likely to request accommodations in the workplace and are more likely to have the requests denied (Harlan & Robert, 1995, 1998; Hartnett et al., 2014). One of the reasons individuals with disabilities gave for denied accommodations included the employer not believing the condition was considered a disability, which could be a reflection of the individual’s ability to describe the disability to others (Hartnett et al., 2014). When examining interactions with others, females with disabilities are reportedly more critical of themselves than males, and this leads to deficits in communication and self-advocacy in educational and employment settings (Lindstrom et al., 2012). Females often have more narrow goals than their male counterparts and lack strong goal setting and attainment skills, which are often required for higher education and employment success (Lindstrom et al., 2012).
Often, the behaviors and experiences in which research has found gender differences are not explicitly taught in the school setting. Court decisions involving transition planning have stressed the importance of assessing and addressing non-academic deficits to prepare students with disabilities for life after high school. In a case brought against Dracut Public schools, the court ruled that academic skills alone do not ensure students with disabilities will be able to participate in post-school employment and education (Redacted v. Dracut Public Schools, 2009). Basic academic skills such as reading, spelling, and math calculation are evaluated by numerous rigorously designed academic assessments and annual transition goals are written based on the results (McConnell et al., 2013). It stands to reason, non-academic skills associated with post-school employment and education, that is, behavioral, social, communicative, functional, and operational skills, should also be identified and assessed through transition assessment.
The Individuals With Disabilities Education Act (2004) mandates the use of transition assessments to identify transition goals and determine needed transition services for students with IEPs age 16 and older. The purpose of transition assessment is to identify student strengths, needs, and preferences in relation to postsecondary education, employment, and as needed, independent living (Neubert & Leconte, 2013). Transition assessments can be both formal and informal, most are developed with little validity evidence, and even fewer consider the possibility of gender differences in scores (Martin, 2013).
Transition assessment is used to identify postsecondary and annual goals to assist students with disabilities to achieve post-school aspirations. Due to the current post-school and in-school outcome discrepancies among male and female individuals with disabilities, it is important transition assessment scores do not differ significantly based on gender. Thus, the purpose of this study was to determine whether male and female high school students with disabilities scored differently in levels of non-academic behaviors known to affect post-school education and employment identified by McConnell et al. (2013) and measured by the Transition Assessment and Goal Generator (TAGG; Martin, Hennessey, McConnell, Terry, & Willis, 2015a).
Method
This quantitative study explored gender differences in non-academic behaviors associated with post-school employment and education as measured by the Professional, Family, and Student TAGG scores, utilizing multivariate analysis of variance as an appropriate technique to test variation accounted for by independent variable(s) over multiple dependent variables with post hoc tests (Tabachnick & Fidell, 2007). Separate multivariate analyses of variance (MANOVAs) were performed on each TAGG version, with all scaled construct scores used separately as dependent variables.
Participants
Data included in this study came from a sample of 139 special educators who each assessed approximately 10 students with disabilities and the students’ family members, which equated to 1,537 assessments from students with disabilities, 836 assessments from family members, and 1,537 assessments from special educators who participated over three consecutive academic years. This 2,512-person sample came from 30 states. Inclusion criteria for participation in this study included education professionals who worked with transition-aged students with disabilities, their students whose post-school goals included competitive integrated employment or postsecondary education, and the parents of those students.
Recruitment
This study required a sample of transition knowledgeable special education teachers. We began recruitment by contacting transition professionals using email lists developed from state transition institutes and national conferences. The initial list included 9,502 emails of individuals who attended transition conferences across the country. Hundreds of email addresses were no longer valid. Two hundred and eighty-two (2.97%) educators responded to the invitation to participate in the study. We then mailed study materials to interested educators who had the responsibility of returning materials back to the research team. Of the 282 educators who indicated interest in participating and received study materials, 49% (n = 139) returned principal agreement letters, consent and assent forms for themselves, their students, and the students’ family members, transcripts, and completed TAGGs. Fifty-five teachers participated in more than one study year.
Settings
We collected data from educators, students, and family members across 120 schools in 30 states. Educators described the majority of the schools as public (95%), and others as private schools (<1%), and charter schools (4%). Each professional completed a TAGG for approximately 10 of his or her students.
Educator demographics
Most of the 139 participating professionals were female (n=131, 94%), and the average age of the educators at the time of the study was 45.4 years with a standard deviation of 10.4 years. Approximately 83% of professionals identified themselves as Caucasian (n = 115), 9% African American (n = 12), and 4% noted Native American (n = 6). The majority of professional participants identified themselves as special education teachers (n = 109). Over half of the participants had been teaching students with disabilities for over 10 years (55%, n = 77). Thirty-seven percent of professionals had been teaching students with disabilities 3 to 10 years (n = 52). See Table 1 for additional professional demographics.
Educator Participants (n = 139).
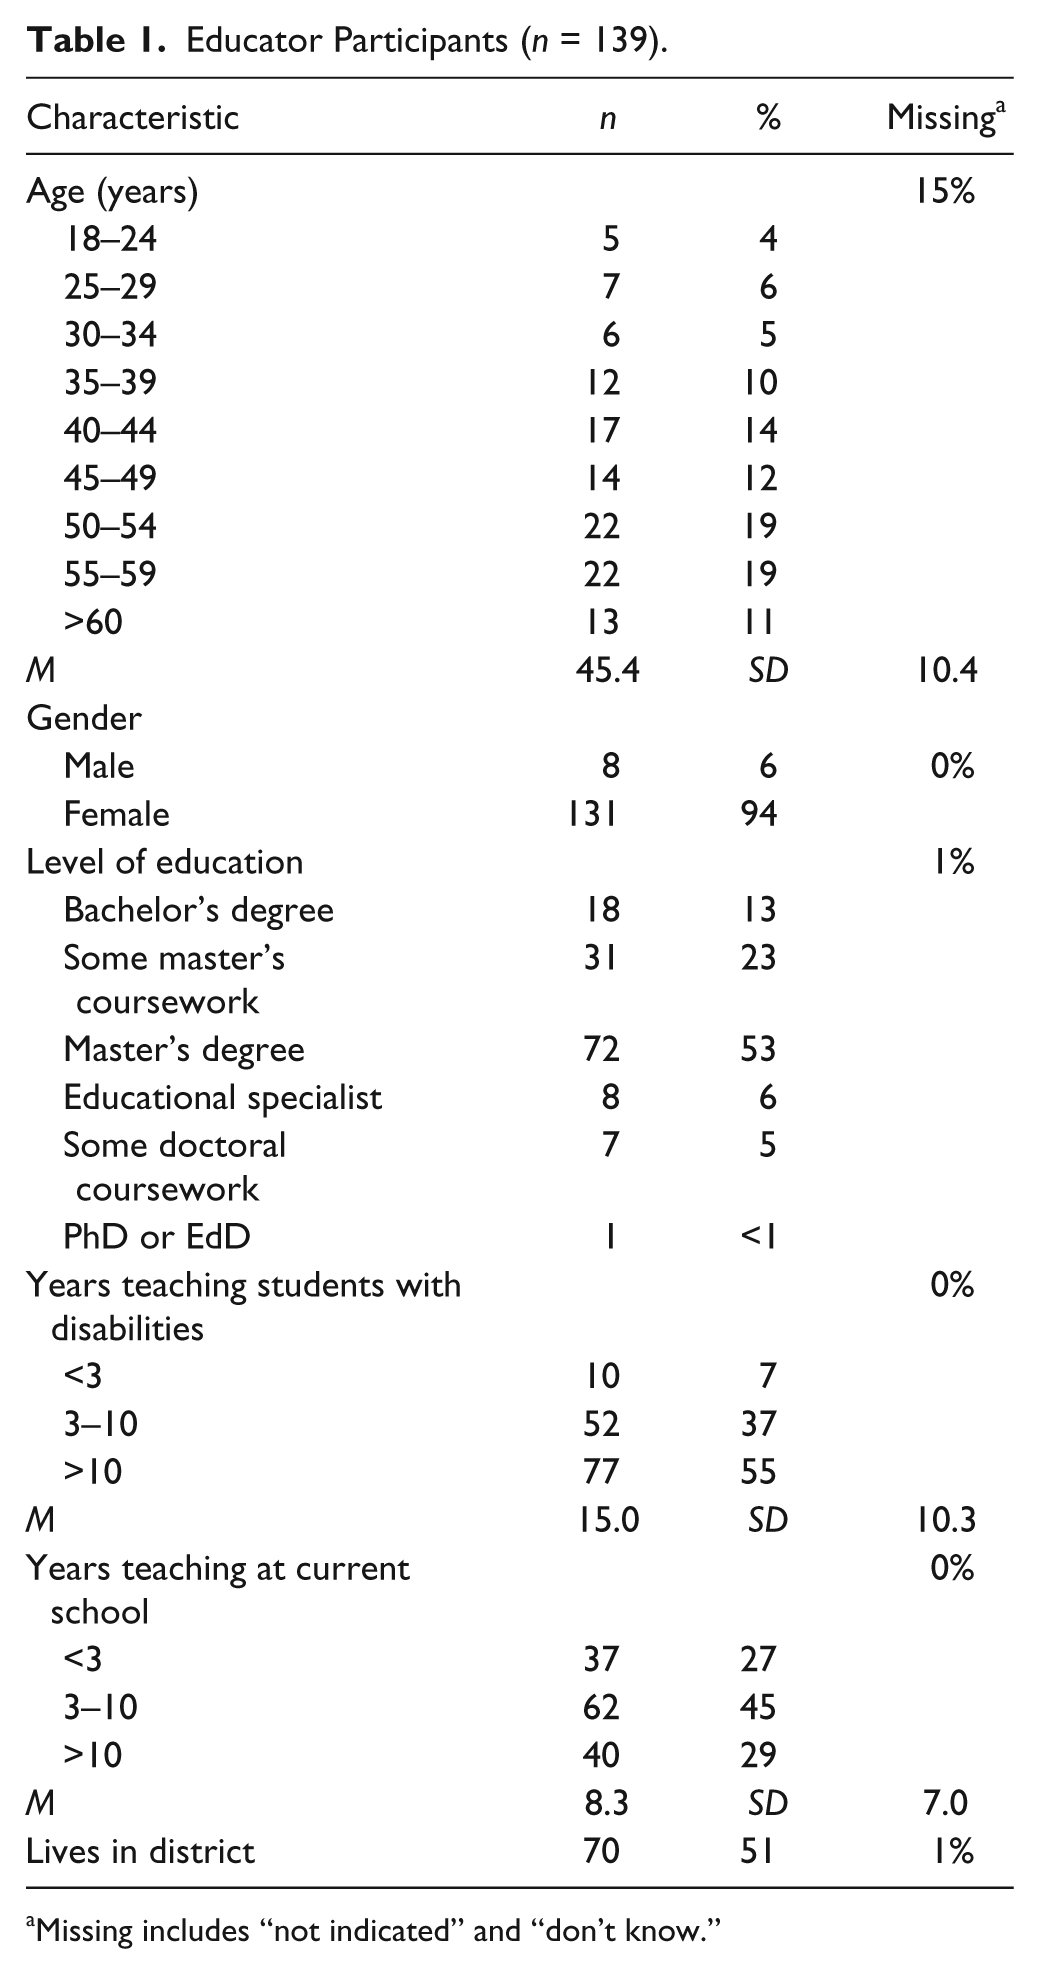
Missing includes “not indicated” and “don’t know.”
Family demographics
The average age of the family members who participated was 44 years (SD = 9.98). Out of the 836 participating family members, 614 (77%) were mothers, 103 (12%) were fathers, and 40 (5%) were grandparents. Nearly 96% (n = 802) of family members indicated English as the primary language at home. About 87% (n = 726) of the family members had a high school diploma or higher degree. Approximately 7% (n = 62) of family members reported receiving help to complete the forms. Table 2 presents more family member demographics.
Family Participants (n = 836).
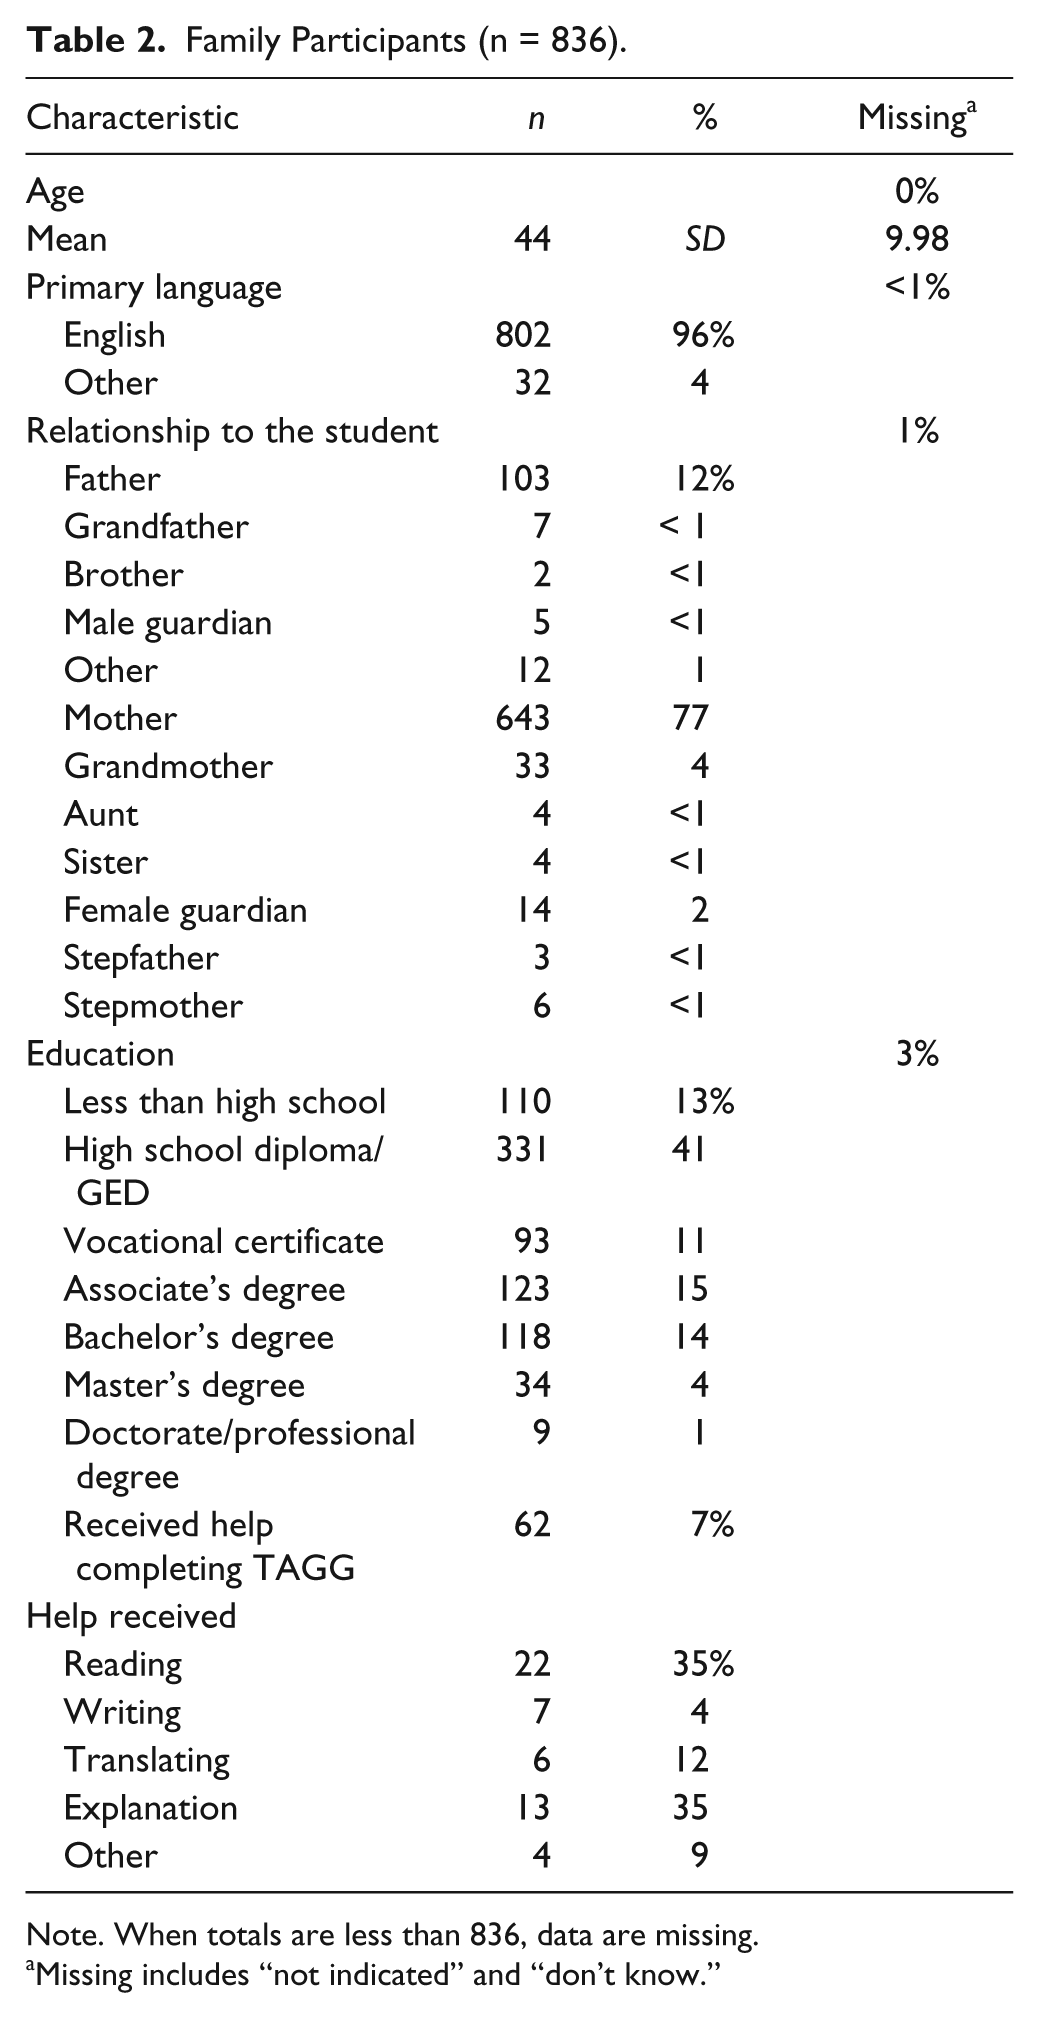
Note. When totals are less than 836, data are missing.
Missing includes “not indicated” and “don’t know.”
Student demographics
The 1,537 high school students (58% males and 41% females) who participated in this study had an average age of 17.4 years (SD = 1.83). The majority of the students (853 students, 57%) were students with specific learning disability, followed by 207 (14%) students with other health impairment. About 54% (n = 868) received free or reduced lunch. Table 3 presents additional student characteristics.
Student Participants (n = 1,537).
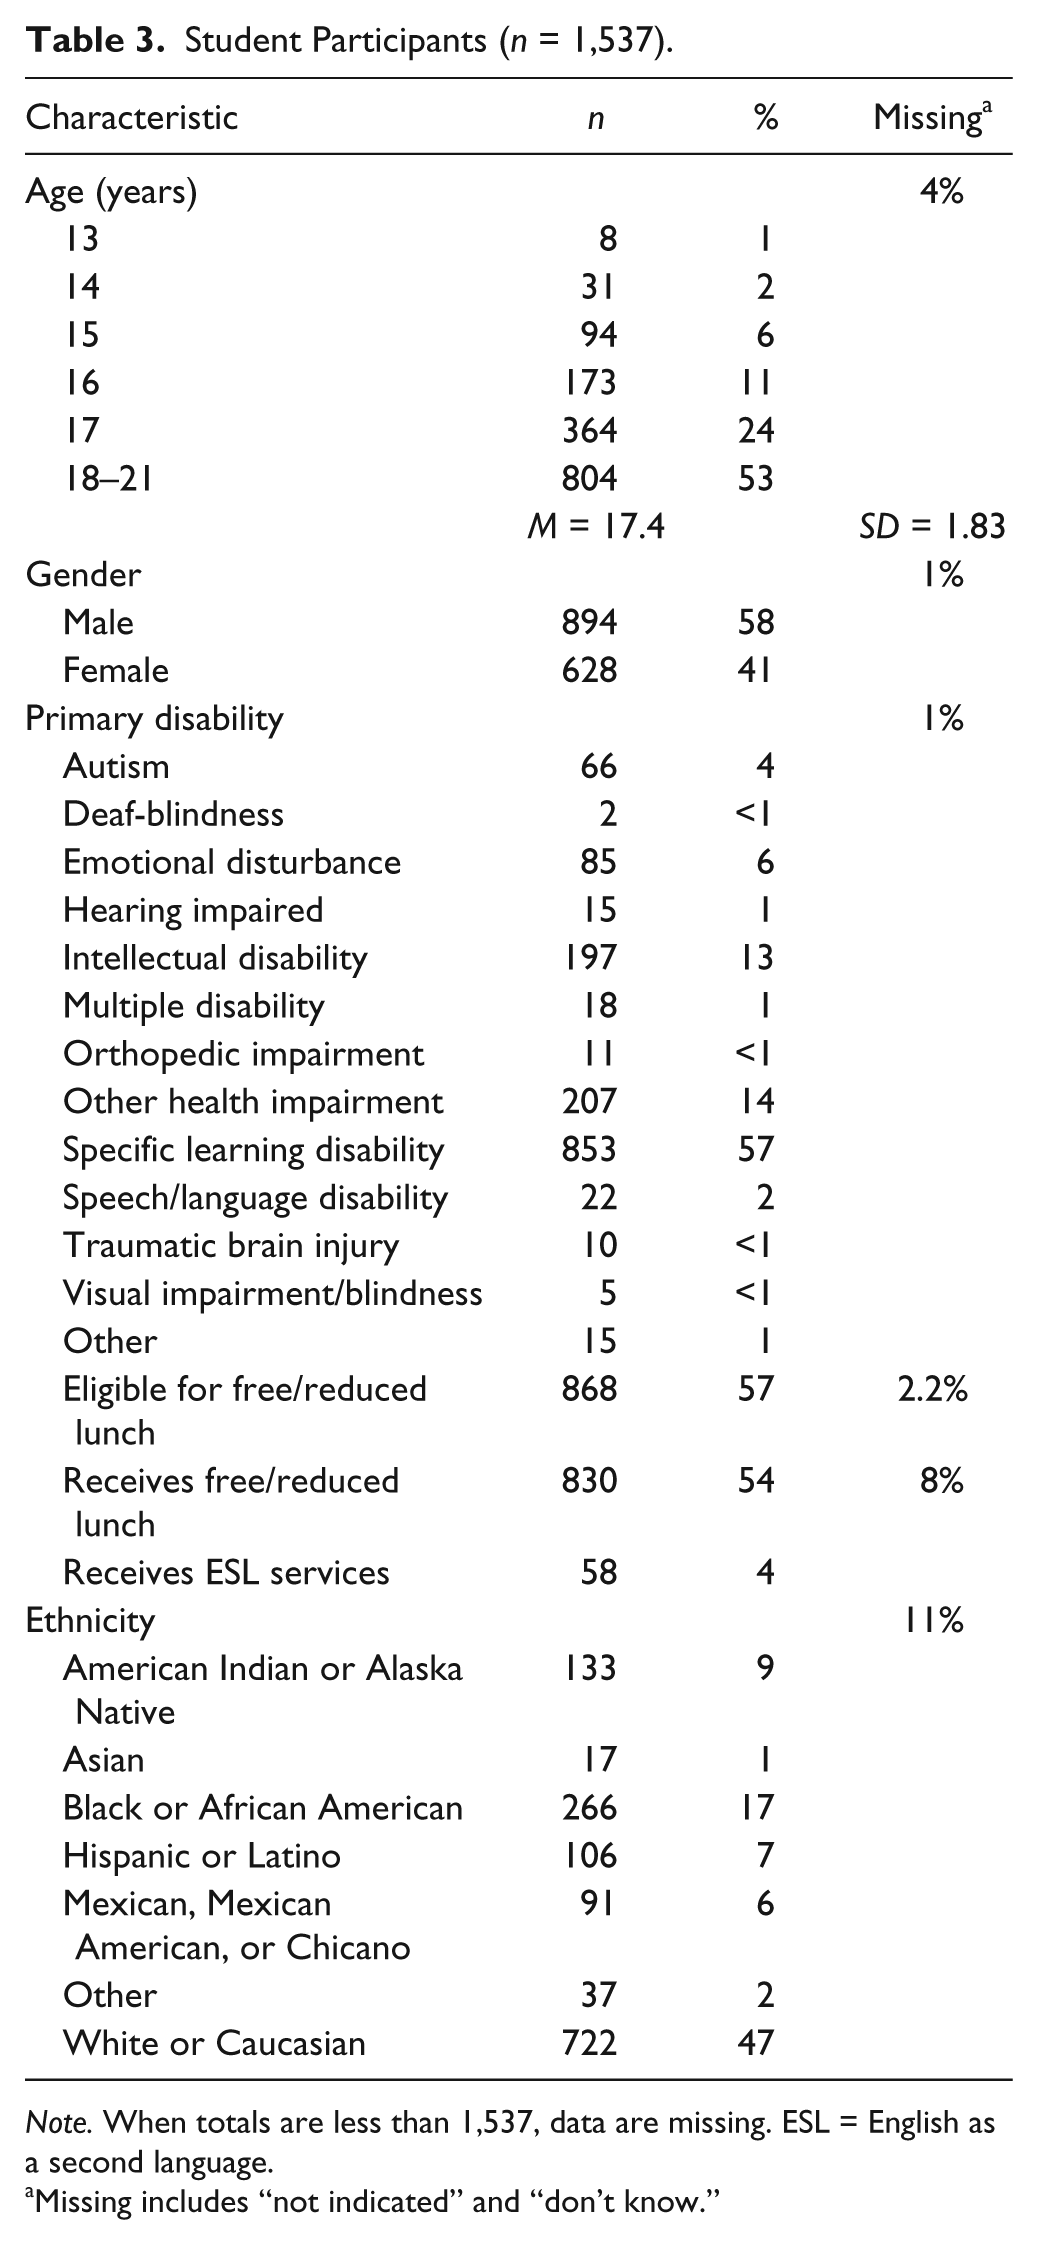
Note. When totals are less than 1,537, data are missing. ESL = English as a second language.
Missing includes “not indicated” and “don’t know.”
Instrumentation
To improve the efficacy of transition planning, McConnell et al. (2013) identified from the research literature non-academic behaviors associated with postsecondary education and employment of former students with disabilities. Martin et al. (2015a) used these constructs to develop a new transition assessment titled the Transition Assessment and Goal Generator to provide IEP teams usable results to establish meaningful annual transition goals based on non-academic behaviors associated with post-school further education and employment. The TAGG measures eight non-academic areas: (a) Strengths and Limitations, (b) Disability Awareness, (c) Persistence, (d) Interacting with Others, (e) Goal Setting and Attainment, (f) Employment, (g) Involvement in the IEP, and (h) Support Community. Martin, Hennessey, McConnell, Terry, and Willis (2015b), through an iterative process, developed the items, rating scales, and instructions for the Professional, Student, and Family TAGG versions. Across numerous drafts, the items were written, revised, and then re-written. Rating scales and administration instructions were developed, and then revised, resulting in a 34-item assessment.
Professionals and family members rated student behavior on a scale from 1 to 5 to score the 31 Likert-type items; three items required yes/no responses. A score of 1 represented the student rarely engaged in the behavior or experience, and 5 represented often engaging in the behavior or experience. Students rated the 31 Likert-type items on a 1 to 3 scale (rarely, sometimes, and often, respectively). Flesch–Kincaid reading levels for the three versions are as follows: (a) TAGG Professional, 10.4 grade level; (b) TAGG Family, 5.7 grade level; and (c) TAGG Student version, 4.8 grade level.
Reliability
The TAGG research team conducted a test–retest measure of stability of total TAGG scores approximately 14 weeks apart, which yielded significant (p < .01) large correlations of .80, .70, and .70 for 102 professional, 92 family, and 102 student TAGG scores, respectively. TAGG versions proved to have a high internal reliability with Cronbach’s alpha results ranging from α = .89 to α = .95. Significant medium-sized correlations (p < .01) indicated sound agreement among raters. Pearson product–moment correlation coefficients were examined for each version. Professional–Family yielded correlation coefficients of .38, Professional–Student .37, and Family–Student .31 (Martin et al., 2015b).
Validity
The TAGG research team will continue to collect validity evidence, and thus far, validity evidence consists of test content, response processes, internal structure, and relations with other variables. To determine test content, developers conducted an in-depth literature review of indicators of post-school education and employment identified by transition and assessment experts, which provided the basis for assessment items. To gather evidence of response processes, developers collected comments and questions from test takers across 20 administrations of the TAGG in four states and used this feedback to make TAGG revisions.
To examine internal structure, developers conducted and replicated exploratory and confirmatory factor analyses (Martin et al., 2015b). This decreased the number of items from 75 to 34 and the number of constructs from 10 to 8. The model fit was adequate across all three TAGG versions (TAGG-P, χ2 = 1,043.62, df = 499; root mean square error of approximation (RMSEA) = .058, comparative fit index [CFI] = .92, Tucker–Lewis index [TLI] = .91, and root mean square residual [RMSR] = .0597; TAGG-F, χ2 = 862.74, df = 499; RMSEA = .0570, CFI = .91, TLI = .90, and RMSR = .058; TAGG-S, χ2 = 819.00, df = 505; RMSEA = .0466, CFI = .89, TLI = .88, and RMSR = .064). The TAGG team conducted two replication studies using multi-group confirmatory factor analyses. These analyses established adequate model fit for all three versions of the TAGG (Replication 1, TAGG-P, χ2 = 2,863.49, df = 1,021, RMSEA = .072, CFI = .88, TLI = .88, RMSR = .065; TAGG-F, χ2 = 1,995.76, df = 1,087, RMSEA = .0579, CFI = .89, TLI = .89, RMSR = .0679; TAGG-S, χ2 = 1,879.42, df = 1,028, RMSEA = .0490, CFI = .87, TLI = .86, RMSR = .0762; Replication 2, TAGG-P, χ2 = 3,419.9186, df = 1,087, RMSEA = .06, CFI = .91, TLI = .91, RMSR = 0.06; TAGG-F, χ2 = 4,042.4445, df = 1,086, RMSEA = .07, CFI = .87, TLI = .82, RMSR = 0.061; TAGG-S, χ2 = 2,371.0163, df = 1,094, RMSEA = .04, CFI = .88, TLI = .88, RMSR = .058). The developers confirmed the adequacy of response patterns for subscales using item response theory.
To examine relations to other variables, developers established discriminant validity evidence by investigating the relations between TAGG scores and socioeconomic status (Martin et al., 2015b), and student grade point average and percent of time students receive instruction in general education (McConnell, Martin, & Hennessey, 2015). These studies reported virtually no relations among these variables.
Procedures
Completion of demographic forms
Participating educators completed a Professional Demographic form providing basic information, including highest education level, position, certifications, and other similar questions. Participating educators also completed a Student Demographic form for each of their students involved in the study to ensure gathering of accurate educational information. This information included students’ gender, age, grade, ethnicity or race, the students’ schedule, disability category, and other similar data. Family members completed demographic forms identifying factors such as age, ethnicity, and work status.
Administration of the TAGG-P
Educators completed a TAGG-P on each of their participating students. On average, each educator completed a TAGG-P on approximately 10 of his or her students.
Administration of the TAGG-S
Participating educators administered the TAGG-S individually or in groups and provided needed accommodations and support. Before students began answering the TAGG questions, educators explained the purpose of the assessment and the directions for completion. Students were encouraged to think for a moment before answering each item and to ask questions at any time.
Administration of the TAGG-F
Family members were instructed to reflect on their child’s behavior and experiences over the last year to respond to items. Participating educators facilitated completion of the Family TAGG by answering questions and collecting responses. Most family members completed the Family TAGG at home with only a few completing it at school. Family members were encouraged by their child’s teacher to ask for support as needed as they completed the TAGG-F.
Dependent and Independent Variables
In the current study, gender is the independent variable, and the TAGG total scores and domain scores are considered the dependent variables.
Statistical Analysis Tests
We used MANOVA to explore simultaneously the influence of two or more groups (males and females) on several dependent variables, such as the three TAGG versions, or the domains of each version (Stevens, 2002; Tabachnick & Fidell, 2007). Stevens (2002) recommended the use of MANOVA for these types of questions to (a) avoid the inflation on the overall type I error that could result from using multiple univariate tests, (b) incorporate correlations within the test statistics, (c) detect any overall statistically significant differences in some cases where no significant differences on the level of individual variables occur, and (d) detect any statistically significant differences on the level of individual variables when the overall effect shows no statistically significant difference due to canceling out effect.
Results
To investigate the extent significant differences in TAGG construct scores exist as a result of gender, we conducted a series of MANOVAs. We used separate MANOVAs on each version of the TAGG with all summed scaled construct scores used separately as dependent variables. Data for Years 1, 2, and 3 were compiled. Descriptive statistics (i.e., means and standard deviations) for each scaled construct score for each version of the TAGG are provided in Table 4. Guidelines set forth by Cohen (1988) were used to determine effect size represented by eta squared and partial eta squared (.01 = small, .06 = moderate, and .14 = large).
Descriptive Statistics: Gender and TAGG scores.
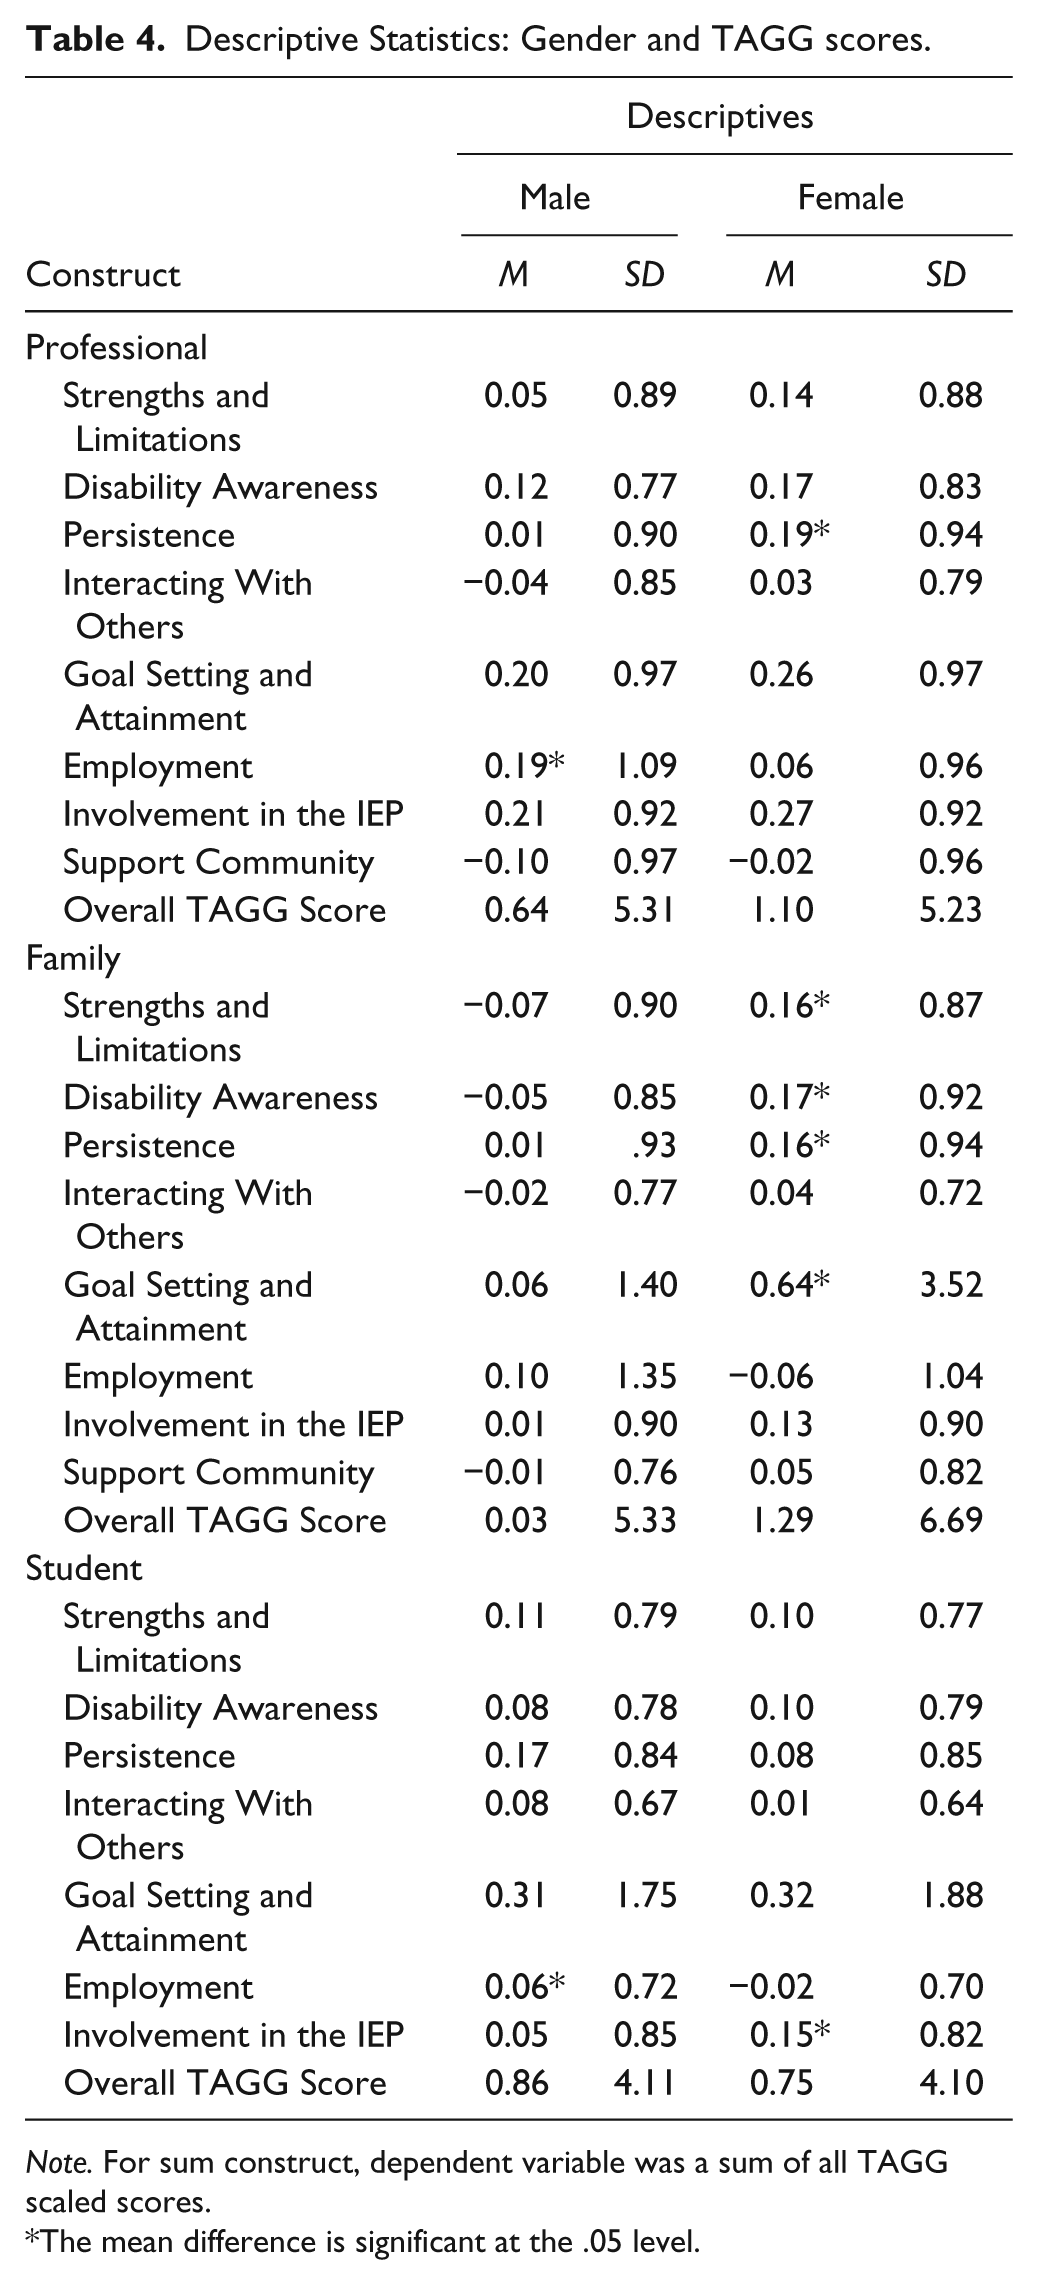
Note. For sum construct, dependent variable was a sum of all TAGG scaled scores.
The mean difference is significant at the .05 level.
Gender Influence on Overall TAGG Scores
For the overall TAGG summed scores, we observed non-significant mean differences on the TAGG-P, F(1, 1493) = 2.748, p = .098, partial η2 = .002, power = .381, and TAGG-S, F(1, 1438) = .240, p = .624, partial η2 = .000, power = .078. However, univariate ANOVA results indicated significant mean differences between groups on the TAGG-F, F(1, 804) = 8.801, p = .003, partial η2 = .011, power = .842. Analysis of pairwise comparisons indicated family members scored males slightly lower (−1.257, p = .003) than females.
Gender Influence on TAGG Professional Scores
We tested omnibus MANOVA effects to test the null hypothesis (H0: µ1 = µ2) that both gender groups are equal with regard to TAGG construct scores. As depicted in Table 5, results of the investigation using data obtained on the TAGG-P indicated significant multivariate effect for two construct scores (Hotelling’s trace = .023), F(8, 1486) = 4.288, p = .000, partial η2 = .023, power = .996. Results indicated significant differences (η2 = .009, and η2 = .004) in professional ratings on the Persistence (male M = 0.01, SD = 0.90; female M = 0.19, SD = 0.94) and Employment (male M = 0.19, SD = 1.09; female M = 0.06, SD = 0.96) constructs, meaning educators scored females slightly higher than males in the area of Persistence and males higher than females in the area of Employment. Pairwise comparisons for all TAGG versions are described in Table 5 to illustrate group mean differences. Table 6 presents the results of follow-up univariate analysis at the construct level.
Pairwise Comparisons Across TAGG Versions.
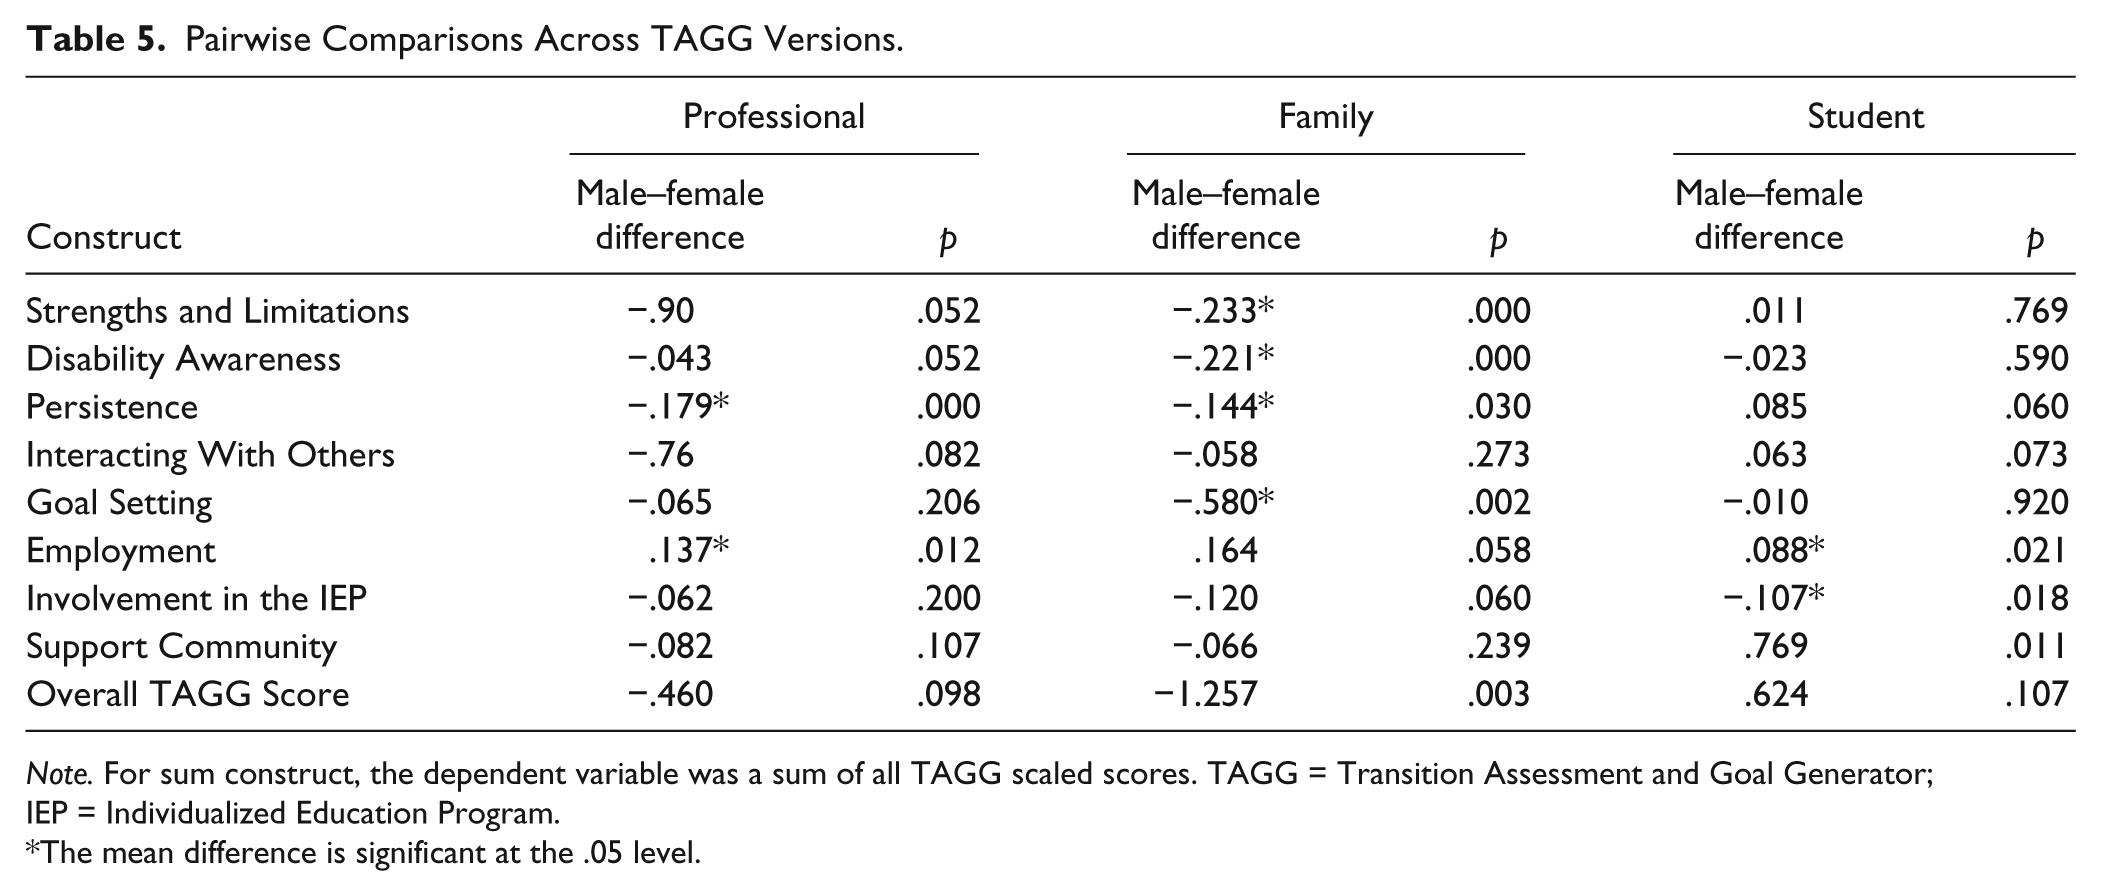
Note. For sum construct, the dependent variable was a sum of all TAGG scaled scores. TAGG = Transition Assessment and Goal Generator; IEP = Individualized Education Program.
The mean difference is significant at the .05 level.
Univariate Tests by Gender and TAGG Version Scores.
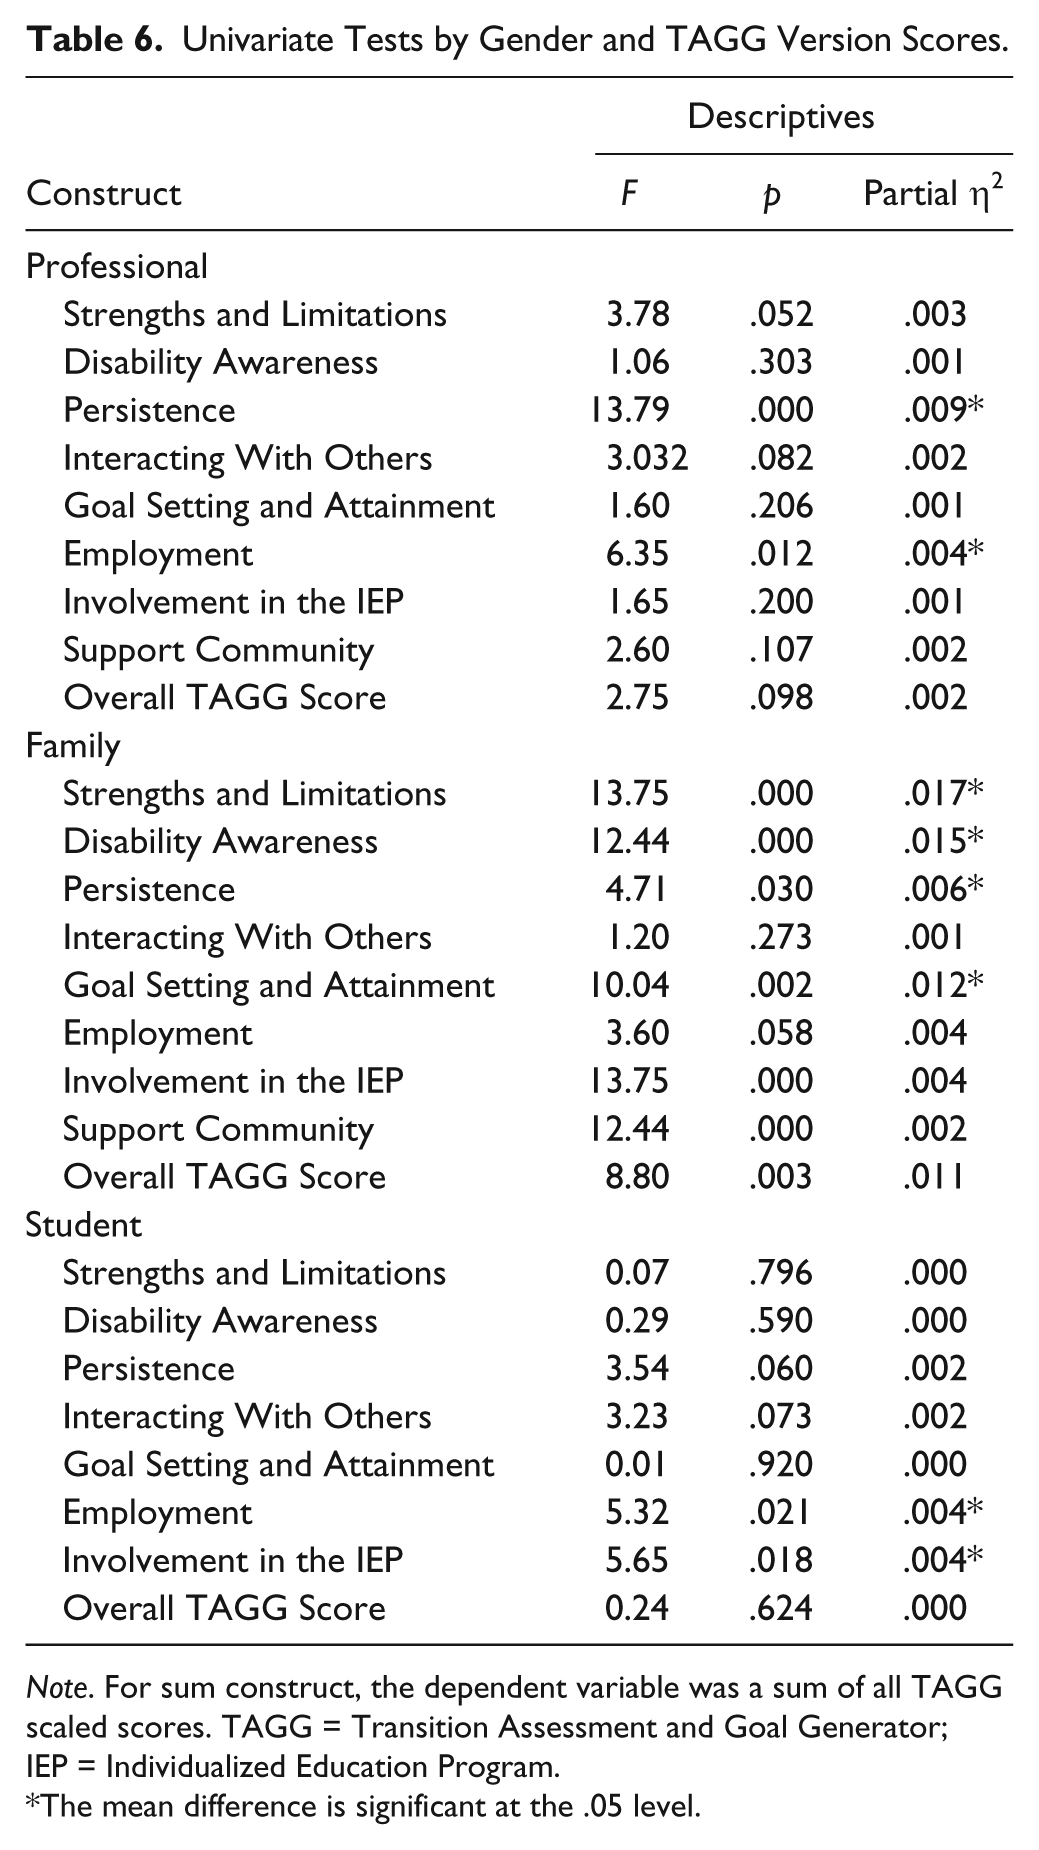
Note. For sum construct, the dependent variable was a sum of all TAGG scaled scores. TAGG = Transition Assessment and Goal Generator; IEP = Individualized Education Program.
The mean difference is significant at the .05 level.
Gender Influence on TAGG Family Scores
Results of the investigation using data obtained on the TAGG-F showed a significant multivariate effect for construct scores (Hotelling’s trace = .041), F(8, 797) = 4.089, p = .00, partial η2 = .039, power = .994. An investigation of the follow-up univariate tests for each of the eight constructs of the TAGG-F can be found in Table 6. Results of the follow-up investigations showed significant differences in the ratings family members provided for the Strengths and Limitations (male M = −0.07, SD = 0.90; female M = 0.16, SD = 0.87; η2 = .017), Disability Awareness (male M = −0.05, SD = 0.85; female M = 0.17, SD = 0.92; η2 = .015), Persistence (male M = −0.01, SD = 0.93; female M = 0.16, SD = 0.42; η2 = .006), and Goal Setting and Attainment (male M = −0.05, SD = 0.85; female M = 0.17, SD = 0.92; η2 = .012) constructs, meaning family members scored females slightly higher than males in these four constructs.
Gender Influence on TAGG Student Scores
Significant multivariate effects were also found when an investigation of data obtained from the TAGG-S was completed (Hotelling’s trace = .041), F(7, 1432) = 2.883, p = .01, partial η2 = .014, power = .929. Table 6 presents an investigation of the follow-up univariate tests for the seven TAGG-S constructs, due to Strengths and Limitations and Support Community combining into one construct for the student version (Martin et al., 2015b). Results of the follow-up investigations showed significant differences in student ratings for the Employment (male M = 0.06, SD = 0.72; female M = −0.02, SD = 0.70) and Involvement in IEP (male M = 0.05, SD = 0.85; female M = 0.15, SD = 0.82) constructs, meaning female students scored themselves slightly higher in the area of Involvement in the IEP and males scored themselves slightly higher in the area of Employment.
Summary of Results
The multivariate analysis of variance revealed no overall influence of students’ gender on TAGG full-scale scores for the Professional and Student versions. Family members rated females slightly higher than males, yet the difference did reach significance. All effect sizes for construct differences on each version were very small. Professionals rated males slightly higher than females in the area of Employment and females slightly higher than males in the area of Persistence. Family members rated female Strengths and Limitations, Disability Awareness, Persistence, and Goal Setting scores slightly higher than males. Student scores revealed males scored themselves higher than females in Employment and females rated themselves higher than males in Involvement in the IEP.
Discussion
The purpose of this study was to explore the gender differences in scores when measuring non-academic skills associated with post-school employment and education using the TAGG (Martin et al., 2015a) scores provided by professionals, family members, and students. Results from this study extend the knowledge concerning differences between males and females and the transition planning process.
Summary of Major Findings
Influence of gender on TAGG scores
After reviewing commonly used transition assessments, we found few explored gender differences in assessment scores, for example, Transition-to-Work Inventory (Liptak, 2012). In this study, no significant differences were found on overall TAGG scores provided by educators or students. Only extremely small gender differences were found in the overall family TAGG scores showing males were scored slightly lower than females. At the construct level, these slight differences were observed in four areas: (a) Strengths and Limitations, (b) Disability Awareness, (c) Persistence, and (d) Goal Setting and Attainment. This could be attributed to the findings of Lindstrom et al. (2011), who found females as being more likely to involve family members in discussions of post-school plans.
Professionals and students scored males and females similarly with a few exceptions. Both professionals and students rated males higher in the Employment construct. This is consistent with Wagner et al. (2005) and Sanford et al. (2011) reporting males are more likely to be employed and complete vocational training in high school. Other literature also supports gender as a significant factor of employment and hours worked per week with males working more hours per week (Fabian, 2007; Newman, Wagner, Cameto, & Knokey, 2009).
The few disagreements among TAGG scores that do occur among the perspectives of professionals, family members, and students provide an opportunity for further discussions between the three parties to reach a better understanding of expected transition outcomes and to generate more accurate annual transition goals.
Professionals scored females slightly higher in the area of Persistence, which is consistent with Lindstrom et al.’s (2011) findings suggesting females have higher levels of persistence than males. Females rated themselves slightly higher than males in the area of student Involvement in the IEP. There is currently no literature examining this difference; however, the importance of student involvement in the IEP on post-school outcomes has been well documented (McConnell et al., 2013; Test et al., 2004; Test et al., 2009).
Implications for Practice
Findings from this study suggest multiple implications for practice. First, educators and family members should consider gender differences in transition planning and ensure gender fairness in the transition assessments used to create students’ transition plans. The IEP teams can utilize this information when planning students’ annual transition goals and activities. Knowing that female students tend to score higher in areas such as disability awareness, persistence, and goal setting, educators can find ways to ensure males are also learning these valuable skills and are not expected to be satisfied with the status quo.
Second, consensus for planning transition goals can be reached by discussing disagreements in TAGG profile results across versions. These goals could assist to alleviate the gender differences found in post-school outcomes by students being taught skills or having opportunities for experiences that are afforded to both genders. Males tended to score higher than females in the area of employment. Powers et al. (2008) also found males were more often expected to obtain employment. Using the suggested TAGG goals, both females and males who score low in the area of employment will be given suggested goals that could lead to the same expectation of employment. Parents, educators, and students may not realize the differences in expectations for these non-academic areas until discussions are had.
Future Research
A follow-up study is needed to determine if explicit teaching and attainment of skills and experiences determined as needs by TAGG construct scores will actually improve post-school outcomes of both males and females. A qualitative study would also provide a deeper and richer description of why differences occur in these areas.
Validation is a dynamic and continuous process. Additional transition assessments should be examined to determine whether gender bias occurs. More validation studies are needed to accumulate evidence of different aspects of validity to support the validity of all transition assessments, including the TAGG. Translating the TAGG to other languages and conducting construct validation studies across cultures is an area for future research. Test fairness should also be examined on other variables, including disability category and socioeconomic status.
Gender differences continue to exist in society and having a disability further complicates these issues. Lindstrom et al. (2012) called for an expansion of our field’s understanding of unique needs and barriers related to gender and transition outcomes, including interventions and programs, and yet the starting point for most transition planning—transition assessment—rarely examines gender fairness in test content. Neubert and Leconte (2013) are often cited when categorizing transition assessments into “formal” or “informal.” In their description, only formal assessments are required to provide technical manuals reporting reliability, validity, reading level, and directions for administration. Informal assessments do not require this scrutiny; however, these un-normed observation sheets and checklists could contain gender bias and be used in unintended manners. To ensure test fairness and methodically improve post-school outcomes for all students, transition assessment developers and users should be held to quality assurance guidelines such as those set forth in the Standards for Educational and Psychological Testing (American Educational Research Association [AERA], American Psychological Association [APA], & National Council on Measurement in Education [NCME], 2014).
Footnotes
Acknowledgements
We gratefully acknowledge the participating teachers, families, and students for their time and ongoing support, and Donna Willis for her invaluable edits.
Declaration of Conflicting Interests
The author(s) declared no potential conflicts of interest with respect to the research, authorship, and/or publication of this article.
Funding
The author(s) disclosed receipt of the following financial support for the research, authorship, and/or publication of this article: This research was supported by a grant from the Institute of Education Sciences, National Center for Special Education Research (Grant Award No. R324A100246).