



Abstract
Identifying student strengths is central to transition planning. However, school personnel use few assessments that operationalize behavioral and emotional strengths, and the psychometric functioning of those measures have not been established with transition-age students. In this two-part study, we used a national sample of transition-age students to examine validity evidence for scores from the Behavioral and Emotional Rating Scale-3: Teacher Rating Scale (BERS-3 TRS). Study 1 evaluated the internal structure and test score reliability of the scores for 275 students with exceptionalities. Study II used a sample of 566 students to examine differences in scores between students with and without exceptionalities. Findings from these studies represent evidence for the validity and interpretation of scores for transition-age students with exceptionalities.
Keywords
Academic and non-academic (i.e., social emotional, mental health, self-determination, transition skills) assessments are critical tools for education professionals to use to make informed decisions about school-age children with and without exceptionalities. Professionals use assessments that demonstrate adequate psychometric properties to collect valid and reliable screening or diagnostic data to inform student placement in programs to support academic, behavioral, and social emotional success. Historically, these assessments have been designed to identify areas of deficits, problems, or pathologies, so that professionals can provide appropriate intervention to support student growth (Epstein, 2000). Yet, the reliance on using a deficit-oriented assessment approach excludes opportunities for professionals to have a wholistic picture of their students (e.g., Chatzinikolaou, 2015; Climie & Henley, 2016). To this end, there have been efforts made toward measuring the emotional and behavioral strengths and assets of students. The movement to measure student strengths has been referred to as strength-based assessment which has been defined as the measurement of those emotional and behavioral skills, competencies, and characteristics that create a sense of personal accomplishment; contribute to satisfying relationships with family members, peers, and adults; enhance one’s ability to deal with adversity and stress; and promote one’s personal, social, and academic development. (Epstein, 2004, p. 4)
Identifying assets and planning for a student’s future based on their strengths is a core feature of transition assessment and transition planning found within the Individuals with Disabilities Education Improvement Act (IDEA, 2004). Transition assessment is considered an iterative and ongoing process in which data are collected from multiple informants (i.e., teachers, students, caregivers) through a variety of informal and formal assessments to know the student specifically related to their strengths, preferences, interest, and needs (Morningstar & Liss, 2008; Sitlington, 1996). While student and caregiver perspectives are highly informative, teachers serve a critical role within the transition planning process. Teachers are often logical raters of student behavior due to their extensive interactions and relationships with students in a structured environment (Kellam, 1990; Merrell, 2001). Large meta-analyses have demonstrated that teacher ratings have similar convergence with student and caregiver ratings (Achenbach et al., 1987; De Los Reyes et al., 2015) indicating that teacher ratings represent perspectives that are both shared with other raters and unique to teachers given their role in schools (De Los Reyes, 2013). While student and caregiver perspectives are particularly useful when rating internalizing constructs (e.g., intrapersonal skills, anxiety, etc.) or behavioral functioning in home and community settings, teacher perspectives are unique because they provide information on behavioral functioning in highly structured, rule-based environments that may align more closely with post-secondary work settings. Because of the uniqueness of teacher perspectives, their ratings tend to be predictive of, and perhaps causally related to, future student success (Pas & Bradshaw, 2014). Taken together, evidence suggests that teacher ratings are valid, useful, and important perspectives when evaluating student behavioral and emotional functioning.
Both informal and formal teacher-rated assessments are used frequently in transition planning. Informal assessments allow transition specialists and school personnel to collect data in a variety of formats (e.g., interviews, observations, surveys) to help identify students’ interests and preferences to guide transition planning (Thoma & Tamura, 2013). These assessments can be used with more flexibility to integrate cultural adaptations for a student or to modify the test format for a student with more significant disabilities. There are a considerable number of informal assessments available for teachers to use or adapt for their own individualized classroom or transition planning needs. The significant availability and flexibility of administration are often strengths of utilizing informal assessments. Formal norm-referenced assessments are less widely available, yet are important because they provide test results that are valid and reliable and allow school personnel to compare a student’s scores to a larger target population (e.g., high school students with and without exceptionalities; Thoma & Tamura, 2013). There is a need for more formal assessments to support transition planning, as data can be used to (a) identify areas of need for targeting instruction or support services and (b) evaluate student growth through annual or semi-annual progress monitoring.
Specifically, IDEA (2004) requires the use of assessment data to inform postsecondary and annual Individualized Education Program (IEP) goals and that assessments be a significant part of the transition planning process (Rowe et al., 2015; Sitlington & Payne, 2004). The planning process can be enhanced when assessment data include the skills and strengths of a student that are needed to be successful in postschool settings (Neubert & Leconte, 2013). In addition, using a strength-based approach can have positive indirect effects, such as building positive relationships between families and school personnel during transition planning by sharing and focusing on strength-based assessment data (Jimerson et al., 2004; Tsang et al., 2012). Other advantages to strength-based assessment include engaging students in a positive way in receiving services, identifying for the student, parents, and professionals what is going well in a student’s life, reminding professionals of the competencies that can form the basis of future growth, helping professionals and families plan for the future, and documenting the competencies that the student has mastered (Epstein, 2004).
However, several challenges persist regarding the use of transition assessments. First, transition assessments have typically focused on identifying skills that need improvement to guide transition planning. There continues to be a need for an intentional approach to identify strengths that can support skill development and transition planning for young people to obtain their desired quality of life (Trainor et al., 2020). Second, there is a need for assessments that are developmentally appropriate for transition-age students and have validity evidence supporting the integration of test scores (Carter et al., 2009; Hennessey et al., 2018; IDEA, 2004). Currently, there are a limited number of validated transition assessments available for use. Third, there is inconsistent use and often lack of use of norm-referenced, standardized instruments (Morningstar & Clavenna-Deane, 2018) to develop goals as part of a student’s IEP or Individualized Transition Program (ITP) (Greene, 2018; Prince et al., 2014). This is further amplified by the lack of special educator training on using informal or formal transition assessments in developing ITPs (Greene, 2018). Fourth, many transition assessments lack formal methods to collect data from multiple respondents, which is suggested for more accurate and contextually responsive transition planning (Carter et al., 2009; Trainor et al., 2020).
While the legislation is clear about the importance and role of transition assessment in writing IEPs and ITPs (Greene, 2018; Mazzotti et al., 2009), there is a need for strength-based formal assessments that yield valid and reliable scores for students with exceptionalities and that meet the needs of educators to support student success. Furthermore, while current formal transition assessments, such as the Transition Planning Inventory (Patton & Clark, 2014), Transition Assessment and Goal Generator (Hennessey et al., 2018; Martin et al., 2015), and the Student Transition Questionnaire (Collier et al., 2016) target student transition-related skills (strengths and areas of need), there are fewer assessments that have been developed to include a focus on students’ interpersonal and intrapersonal behavioral, social, and emotional strengths that can be directly applied to transition planning. Jimerson et al. (2004) stated that identifying youth strengths are just as important as weaknesses in understanding how an individual will succeed across different life domains. This is exemplified in a newly validated college and career readiness progress monitoring measure which examines multiple student domains (e.g., academic engagement, interpersonal engagement, career development; Lombardi et al., 2022). However, Lombardi et al. (2022) also identified that it was not until recently that interpersonal skills were captured in assessments of college and career readiness, and the construct is still a critical feature in transition planning (Kohler et al., 2016). In addition, using a strength-based assessment approach aligns with professional organizations’ mandates (e.g., the Division of Career Development and Transition) and with requirements set by government agencies for including students’ strengths in annual and post-secondary goals within IEPs, ITPs, and other treatment plans.
Behavioral and Emotional Rating Scale
Over the past few decades, several instruments have been developed specifically to assess behavioral and emotional strengths (e.g., LeBuffe et al., 2018). One of the most widely used strength-based instruments is the Behavioral and Emotional Rating Scale (BERS; Epstein et al., 2022), which is a norm-referenced, standardized assessment that measures the behavioral and emotional strengths of school-age children. The BERS was first normed in 1996 to 1997 (Epstein & Sharma, 1998) and re-normed in 2017 to 2020 (Epstein et al., 2022). The BERS system collects data from teachers (Teacher Rating Scale [TRS]), parents (Parent Rating Scale [PRS]), and students (Youth Rating Scale [YRS]) to identify the strengths, competencies, assets, and resources of a student. The different forms of the test have the same 52 items, with slight wording changes to reflect the respondent (i.e., teacher, parent, or student). Each item is rated on a scale of 0 to 3 (0 = not at all like the child; 1 = not much like the child; 2 = like the child; and 3 = very much like the child). The BERS yields five subscale scores and a total strength index. The five subscales are: (a) Interpersonal Strengths (15 items), which assesses a child’s ability to interact with others in social situations; (b) Family Involvement (10 items), which measures a child’s participation and relations with the family; (c) Intrapersonal Strengths (11 items), which assesses how a child perceives their competence and accomplishments; (d) School Functioning (nine items), which measures a child’s performance in school and classroom tasks; and (e) Affective Strengths (seven items), which assesses a child’s ability to give and receive affect. In the current study, only data on the TRS are reported, as YRS and PRS data on transition-age students with and without exceptionalities were insufficient.
In general, validity refers to the extent to which theory and empirical evidence support the interpretation of test scores for a particular purpose. In this case, BERS-3 TRS scores could be used to: (a) promote parental or student engagement in the transition planning process, (b) target goals for a transition plan, (c) identify strengths upon which to build other skill sets that will position a student for success in post-secondary activities (e.g., college or employment), and (d) document progress as an outcome of targeted or specialized services or supports. For each individual use of the BERS-3 TRS scores, different types of validity evidence would be relevant; however, in the most fundamental way, validity evidence based on test content, internal structure (i.e., factor structure or latent structure), and relation to other variables (e.g., differentiation between students with and without exceptionalities) are the most immediately relevant for establishing the test’s appropriateness for use with transition-age students with exceptionalities.
Numerous studies have documented the psychometric quality of the BERS TRS scores for school-age children. Adequate evidence of validity based on test content has been reported previously for the BERS-1 (Epstein et al., 2000), BERS-2 (Duppong Hurley et al., 2014; Lambert et al., 2015), and recently for the BERS-3 (see Epstein et al., 2022) with diverse samples of children, including transition-age students with exceptionalities. Evidence of validity based on internal structure of the test, which serves as a “basis and rationale for arriving at the composite [scores]” (American Educational Research Association, American Psychological Association, National Council on Measurement in Education, & Joint Committee on Standards for Educational and Psychological Testing, 2014, p. 27) and is a prerequisite for assessing test score reliability (Slaney & Maraun, 2008), has been documented for younger students with and without exceptionalities, but has not yet been reported for transition-age students with exceptionalities. Validity evidence based on the relation to other variables (i.e., construct-identification validity, group differentiation), such as the exceptional status of a student, has also been reported for a diverse population of students across several independent studies (e.g., Lambert et al., 2015; Lambert et al., 2021), but has yet to be documented for transition-age students with exceptionalities.
Purpose of the Study
Even though research on the BERS TRS is extensive and suggests acceptable psychometric properties across diverse populations of school-age children with and without exceptionalities, there is a lack of evidence supporting (a) the hypothesized internal structure, (b) test score reliability, and (c) construct validity of the TRS test scores with a transition-age group of students. Because the BERS TRS measures students’ emotional and behavioral strengths, and students with high-incidence exceptionalities (e.g., emotional disturbance [ED], learning disabilities) tend to demonstrate lower levels of strengths compared to peers without exceptionalities (Epstein et al., 2022; Lambert et al., 2021), we hypothesized that scores should also differentiate between transition-age students with and without exceptionalities. If the test scores of these two student groups differed significantly, and in the expected direction, this would provide further evidence supporting validity and interpretation of the scores. Thus, the purpose of these two studies were to: (a) conduct a confirmatory factor analysis (CFA) with transition-age students to examine the internal structure of the BERS TRS scores and compute measures of test score reliability based on the CFA results, and (b) compare the BERS TRS test scores of transition-age students with exceptionalities to their peers without exceptionalities.
Study I: Internal Structure and Test Score Reliability
Method
Participants
Participants were 275 high school students with school-identified educational exceptionalities and an active IEP at the time of data collection. Demographic data for students with exceptionalities are reported in Table 1. Students ranged in age from 15 to 18 years with a mean age of 16.31 (SD = 1.07). Slightly over 70% of the sample was male (n = 194). In terms of race and ethnicity, teachers identified 62.5% of students as White/non-Hispanic (n = 172), 22.9% as Black/non-Hispanic (n = 63), 7.6% as Hispanic (n = 21), 4.4% as multiracial (n = 12), and 2.5% as American Indian (n = 7). In terms of exceptionality categories, which were not mutually exclusive, participants represented students with ED (n = 122), other health impairment (n = 93), specific learning exceptionalities (n = 60), intellectual exceptionalities (n = 29), autism (n = 23), orthopedic impairment (n = 9), speech or language disorder (n = 8), deaf or hard of hearing (n = 2), visual impairment (n = 1), and traumatic brain injury (n = 1). Nearly 42% of participants received free or reduced lunch (n = 114), which was collected as a proxy for family socioeconomic status (SES); however, these data were missing for 24% of participants (n = 66). Sixty-four percent of participants (n = 176) were in fully inclusive educational settings for the entire school day, while 11.3% of participants (n = 31) spent at least half of the school day in special education classrooms.
Participant Demographics for Study of the Behavioral and Emotional Rating Scale-3: Teacher Rating Scale.

Categories were not mutually exclusive.
Just under 67% of students (n = 184) were rated by a female teacher. Over 86% of students (n = 237) were rated by a White teacher and 8.7% were rated by a Black teacher (n = 24); however, these data were missing for 2.9% of students (n = 8). Note that data on teacher ethnicity were not collected as part of this study. Teachers who completed the ratings represented a range of teaching experience from first-year teachers to individuals who had been teaching for 42 years. The mean teaching experience was 11.45 years (SD = 9.35).
Data collection
Data were drawn from the normative study for the BERS-3 project (Epstein et al., 2022). Before data were collected, three university Internal Review Boards approved recruitment and data collection protocols. Data were collected from Fall 2015 through Spring 2018 as part of the re-norming of the BERS-3 in the following manner: first, the authors of the BERS-3 contacted local school district administrators and university professionals across the four U.S. geographic regions (Northeast, Midwest, South, and West) to identify teachers who might volunteer to participate in data collection. Teachers were contacted by one of the authors either by email, mail, or telephone, and asked to participate in the norming process. Teachers who agreed to participate were asked to complete the instrument on all of their students, or to select an unbiased sample of their students using a simple procedure. Specifically, raters were given the following instructions to ensure an unbiased selection process: First, decide how many students you wish to rate using the TRS. Then, start at the top or bottom of your class roster and rate every student. Do not skip any student unless you have known this student for less than two months. Stop selecting and rating students when you have reached the number of students you wished to rate.
Data analysis
The data used were the item-level responses for each of the 52 individual items from five subscales of the BERS TRS. Mplus v8.6 software (Muthén & Muthén, 2021) was used to fit a CFA model to item-level responses to evaluate the hypothesized correlated five-factor structure of the test data (Epstein et al., 2022). Because items were rated on a 4-point scale, ratings were treated as categorical indicators and the weighted least squares with mean and variance (WLSMV) adjustment estimator was used. Mplus syntax for the CFA modeling is provided in supplemental materials.
Goodness-of-fit for the models was evaluated primarily based on approximate fit indexes (AFIs): comparative fit index (CFI), Tucker–Lewis index (TLI) squared root mean residual (SRMR), and root mean-squared error of approximation (RMSEA). CFI and TLI are incremental measures of fit, and represent the degree of improvement over the worst-fitting model. Both are scaled from 0 to 1, with values closer to 1 indicating better fit. SRMR and RMSEA are absolute measures of fit and represent model misfit. SRMR represents the average residual between the observed and model-implied correlations, while RMSEA indicates the average residual per degree of freedom. Both measures are reported on a scale of 0 to 1. Models with CFI and TLI values greater than .95 (Browne & Cudeck, 1993), and SRMR and RMSEA values less than .08 (Hu & Bentler, 1999) were considered to represent adequate fit to the data. In addition to examining the RMSEA point estimate, the 90% confidence interval was also used to examine misfit, with an upper limit lower than 0.08 suggesting adequate fit. The chi-square statistic for the model was also reported, but chi-square tends to be an overly strict test of fit and often suggests rejection of plausible models, which is why some researchers advocate interpreting the “relative” or “normed” chi-square statistic, which is a ratio of chi-square by the degrees of freedom (χ2/df) (Ullman, 2001; Wheaton et al., 1977). There are no widely acceptable thresholds for interpreting the relative chi-square statistic, but Ullman (2001) suggested that values ≤ 2 indicate acceptable fit. Missing data were minimal (< 0.01% of item responses), so a pairwise-present approach to handling missing data was used, which is default in Mplus when estimating models with WLSMV.
Test score reliability was estimated using coefficient omega (McDonald, 1978, 1999), a CFA-based measure of reliability. Similar to the often-reported coefficient alpha (i.e., Cronbach’s alpha), coefficient omega measures the precision with which the BERS TRS composite scores represent the underlying level of a student’s behavioral and emotional strengths (i.e., the proportion of the sum score variance that can be attributed to the target construct [true score]). Unlike coefficient alpha, coefficient omega does not rely on the assumption of tau-equivalence (i.e., equal factor loadings for all items), which is rarely approximated when using tests in applied settings. Instead, coefficient omega uses observed factor loadings to compute test score reliability. Reliability estimates ≥ .80 are generally considered acceptable (Nunnally, 1978).
Results
The correlated five-factor model fit the data acceptably well according to the relative chi-square, CFI, SRMR, and RMSEA indexes (χ2(1,265) = 2,495, χ2/df = 1.97, CFI = .950, TLI = .951, SRMR = .066, RMSEA = .076 [.073, .079]). All fully standardized factor loadings were large (≥ .60) with one exception noted below, statistically significant, and positive in direction. Standardized factor loadings are provided in Table S1 in the online supplemental materials. The five factors were moderately to highly inter-correlated with correlations amongst the latent factors ranging from .60 (School Functioning and Family Involvement) to .91 (Intrapersonal Strengths and Affective Strengths) (see Table 2). Coefficient omega was estimated for each subscale score based on the factor loadings from the CFA model. Reliability estimates ranged from .94 (school functioning) to .98 (interpersonal strengths) indicating acceptable reliability (i.e., precision) for each of the BERS TRS scores.
Inter-Correlations Between Latent Factors.
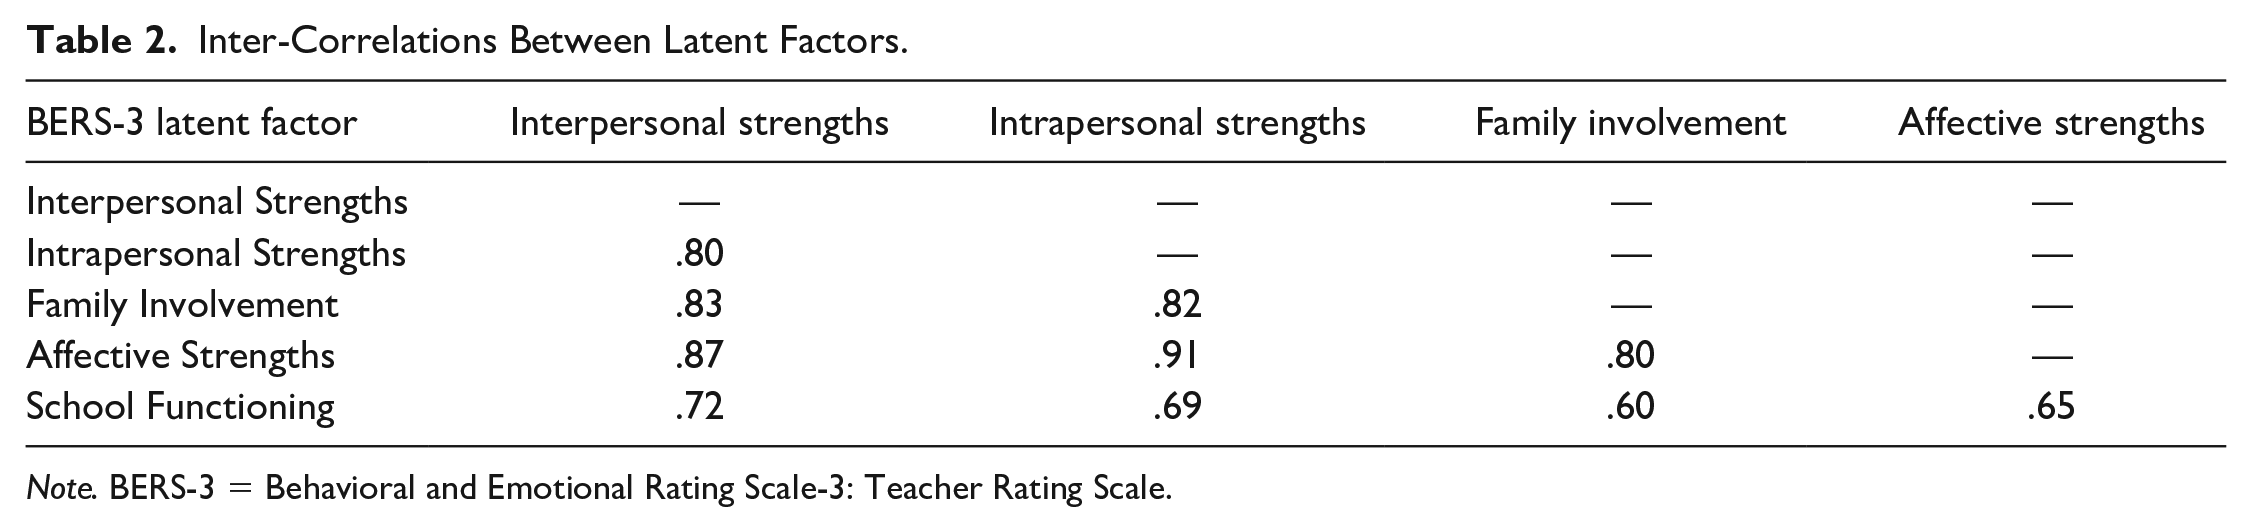
Note. BERS-3 = Behavioral and Emotional Rating Scale-3: Teacher Rating Scale.
While the overall model fit was acceptable, as was the reliability for each of the BERS TRS scores, there was one localized source of misfit in the CFA related to Item 41 (reads at or above grade level). This item is specified to load onto the school functioning factor; however, the item also demonstrated substantial correlations (i.e., structure coefficients) with the other four latent factors, indicating that responses to this item were related to all the behavioral and emotional strengths of a student.
Study II: Differences Between Students With and Without Exceptionalities
Method
Participants
Participants were 566 high school students: 275 students with school-identified educational exceptionalities (who were described in Study I) and 291 students without exceptionalities. Because the sample of students with exceptionalities was described in Study I, this section focuses on the characteristics of students without exceptionalities. Participant demographics are reported in Table 1. Students without exceptionalities ranged in age from 15 to 18 years, with a mean age of 16.40 (SD = 1.05). Just slightly over half of students were male (n = 146). In terms of race and ethnicity, teachers identified 66.0% of students as White/non-Hispanic (n = 192), 12.0% as Black/non-Hispanic (n = 35), 11.0% as Hispanic (n = 32), 4.8% as multiracial (n = 14), 4.1% as American Indian (n = 12), and 2.1% as Asian/Pacific Islander (n = 6). Nearly one-quarter of participants received free or reduced lunch (n = 71); however, these data were missing for 13.7% of participants (n = 40). Just over 73% of students (n = 213) were rated by a female teacher. Over 91% of students (n = 265) were rated by a White teacher, 3.4% were rated by a Black teacher (n = 10), and 3.8% were rated by a multiracial teacher (n = 11). Teachers who completed the ratings represented a range of teaching experience, from first-year teachers to individuals who had been teaching for 42 years. The mean teaching experience was 13.84 years (SD = 9.83).
Data collection and analysis
Data collection procedures were identical to Study I. The main focus on the analysis was to evaluate the extent to which BERS TRS subscale scores differed between high school students with exceptionalities and peers without exceptionalities. To this end, STATA v17 (StataCorp, 2021) was used to analyze data within a multivariate multiple regression framework, where the five BERS TRS subscale scores were the dependent variables. Predictors in the models included dummy-coded variables representing contrasts between students with exceptionalities and peers without exceptionalities, student gender, student age, and student race and ethnicity. Student gender, age, race, and ethnicity were included as control variables to account for differences in demographics between the two samples of students. Because the distributions of BERS TRS subscale scores (and residuals) were non-normal, the standard errors for model parameters were computed using non-parametric bootstrapping based on 1,000 bootstrapped replications. A total of five comparisons were interpreted in this study (one comparison per subscale score). To account for multiple comparisons and to maintain a nominal Type I error rate of .05 across the entire set of comparisons, we adopted a conservative per-test significance level of .01. STATA syntax for the multivariate multiple regression modeling is provided in the online supplemental materials.
Hedges’ g effect sizes were computed for each comparison between the samples. Hedges’ g statistics represent the mean difference between two groups in standard deviations units while accounting for the upward bias of the mean difference attributed to sampling variation (Hedges & Olkin, 1985). Hedges’ g estimates were computed using the model-adjusted means from the regression analysis (controlling for gender, age, race, and ethnicity) and the unadjusted variances as recommended by What Works Clearinghouse (U.S. Department of Education, National Center for Education Evaluation and Regional Assistance, Institute of Education Sciences, 2014). We characterized each effect size estimate according to Cohen’s suggested ranges for standardized mean differences (Cohen, 1988); therefore, g values ranging 0.00 to 0.19 were designated as trivial, 0.20 to 0.49 were small, 0.50 to 0.79 were medium, and ≥ 0.80 were large.
Results
The unadjusted means and standard deviations for each group of students are reported in Table 3. When not accounting for covariates, students with exceptionalities demonstrated substantially lower scores on each of the five BERS TRS subscales compared to peers without exceptionalities. Results from the multivariate regression models examined these differences while accounting for differences in student gender, age, race, and ethnicity. Students with exceptionalities scored significantly lower on all five BERS TRS subscales compared to students without exceptionalities: Interpersonal Strengths (b = –2.08, p < .0001, g = –0.68), Intrapersonal Strengths (b = –2.20, p < .0001, g = –0.72), Family Involvement (b = –1.91, p < .0001, g = –0.59), Affective Strengths (b = -1.82, p < .0001, g = –0.57), and School Functioning (b = –2.36, p < .0001, g = –0.81). Effect sizes were medium to large in magnitude, ranging from –0.57 to –0.81.
Unadjusted Means and Standard Deviations by Group.

Note. BERS-3 = Behavioral and Emotional Rating Scale-3: Teacher Rating Scale.
Discussion
Previous research has documented that test scores from the BERS-3 TRS meet acceptable standards for reliability (e.g., test–retest, interrater) and validity (e.g., test content, relation to other variables, etc.; see Epstein, 2004; Epstein et al., 2022; Lambert et al., 2021) for younger students with and without exceptionalities. Furthermore, these studies have documented validity evidence for BERS-3 TRS scores based on internal structure and have demonstrated that the test scores are comparable across race, ethnicity, age, and gender (Epstein et al., 2022). The purpose of the present study was to extend research on the BERS-3 TRS by examining psychometric properties of scores for transition-age students with exceptionalities. Overall, the findings documented acceptable levels of validity evidence for this population of students. Specifically, the findings of this investigation provide empirical support for the validity of the hypothesized five-factor internal structure of the BERS-3 TRS scores. The five-factor model fit the data acceptably well across numerous goodness-of-fit indexes; however, the high correlations between some of the subscales (e.g., Intrapersonal Strengths and Affective Strengths) raise questions about the distinctiveness of these factors and the utility of interpreting these factors as independent dimensions of behavioral and emotional strengths of transition-age students with exceptionalities. The CFA model also demonstrated that test score reliability estimates for the test scores were above .90, which indicates acceptable levels of precision. In addition, construct validity of the test scores was further established, as scores for students without exceptionalities were significantly lower than scores for students with exceptionalities, as hypothesized, and these differences were moderate to large in magnitude. The present findings together with previous research on the BERS-3 TRS provide support for the validity of the test scores.
In addition, with recent calls (e.g., Trainor et al., 2020; Yeager et al., 2021) for strength-based approaches to transition assessment and planning, these findings suggest that the BERS-3 TRS would be an acceptable assessment for educators to use to identify behavioral and emotional strengths and support transition planning. The five subscales (a) Interpersonal Strengths, (b) Family Involvement, (c) Intrapersonal Strengths, (d) School Functioning, and (e) Affective Strength are all critical in understanding each student wholistically. By assessing a student’s strengths in these categories and comparing their strengths to others within a local context, special educators have an ability to plan for instructional and alternative learning opportunities in school to support student growth (Yeager et al., 2021). For example, transition assessment is suggested to occur at least annually but is preferred to be ongoing throughout the year (Mazzotti et al., 2009; Morningstar & Liss, 2008). Information gathered with the BERS TRS can be used to help individualize a course of academic study or a set of vocational activities (a strong predictor of postschool success; Test et al., 2009) that is aligned with student interests and strengths. From the test scores, teachers and students can select specific high school activities that utilize their strengths and help achieve their post-school goals (e.g., vocational education or service-learning opportunities).
Assessment data collected from the BERS-3 TRS can also support transition preparation for postschool settings, such as employment and postsecondary education, by identifying not only a student’s individual assets, but also contextual resources that will help them succeed. For instance, by assessing a student’s interpersonal strengths with assessment items such as accepts criticism, respects rights of others, uses appropriate language, teachers can communicate to agency support providers how well a student would do in potential job placements that focus on customer service. Another example might include assessing family involvement with items like demonstrates a sense of belonging to family, participates in community activities, and trusts a significant person with his or her life, teachers can gain insights into the relational assets the student can draw upon for help with finding employment within the community, or gaining advice in collegiate programs or certificates that align with cultural and individual values. By focusing on strengths, school teams, families, and community agencies can develop goals that are congruent with mandates set forth by IDEA (2004), and that, more importantly, align with a student’s postschool desires.
Limitations
Several study limitations must be noted. First, the students included were not randomly selected. Random selection was not feasible for the large national data sets required to norm the BERS-3. Instead, individual school personnel were contacted by the test developers and asked to participate by providing student data. The sample included educators who agreed to participate and completed the BERS-3 TRS on the students that they taught. Other teachers were asked to volunteer but were not able or declined to volunteer. It is possible that responses from the nonparticipating educators might have systematically differed from those educators who choose to participate, which may have introduced bias to the data or limited the generalizability of the findings.
A second limitation is that the data collected as part of the BERS-3 norming processes did not include a way to account for the nested structure of the ratings (i.e., multiple students rated by the same teacher). Because of the manner in which the ratings were completed and the IRB data collection requirements, it was not possible to link students to the educator who provided the rating. As a result, it was not possible to account for the hierarchical structure of the data and the potential bias that could be introduced by underestimating standard errors and not modeling teacher effects.
Third, although demographic characteristics, such as age, gender, and race/ethnicity were used as control variables in Study II, other potential variables might have affected the results. For example, the analyses did not account for each student’s SES, or the measured proxy of free or reduced lunch. Evidence indicates that students with exceptionalities, particularly students with ED, tend to be raised in lower SES families and communities (e.g., Cholewa et al., 2018). Our data on free or reduced-price lunch also suggest a difference between students with and without exceptionalities; however, these data were missing for a significant proportion of students, which limited our ability to include free or reduced lunch as a control variable in Study II. A related limitation was that minimal data were collected on the demographic background of the teachers and other school personnel who provided the data. Also of note, the limited representation of culturally and linguistically diverse teachers within the current sample may contribute some bias to our findings or limit the generalizability of the findings. Future researchers should try to collect a more diverse sample of teachers and comprehensive demographic and professional information on the respondents including gender, age, ethnicity, race, terminal degree, and years working in the field and evaluate how this information may be related to their ratings. Because data were not collected on the specific employment role of the respondents (e.g., general education teachers, special education teachers, social worker, etc.), it is possible that ratings may have been influenced by their professional role within the school setting.
Research Implications
The current study provides initial evidence of the validity and reliability of the test scores from the BERS-3 TRS for transition-age students with exceptionalities. However, there exist clear directions for future study. First, researchers need to replicate the current study using test scores from the BERS-3 PRS and YRS to provide evidence of validity and reliability with transition-age students with exceptionalities. Parents of transition-age students are often frustrated with transition assessment, planning, and implementation processes, and much of this frustration stems from communication issues (Francis et al., 2019). The BERS-3 PRS, with its focus on student’s strengths, assets, competencies, and resources, may facilitate communication and lead to a more productive parent–educator collaboration. Similar research establishing the psychometric functioning of scores from the BERS-3 YRS with transition-age students may assist in getting greater “buy-in” from students during the transition process. Validity and reliability studies of the BERS-3 PRS and YRS need to be conducted with transition-age students before school personnel can confidently use these measures as part of the transition planning process.
Second, several professionals have advocated for the use of strength-based assessments during transition planning (Trainor et al., 2020; Yeager et al., 2021). Further research is needed to identify how strength-based assessment instruments would be selected and how assessment data from multiple stakeholders would be used in transition planning. For example, does sharing typical transition assessment data versus strength-based assessment data with families impact their involvement in the transition planning process and family–school relationships? Francis et al. (2019) reported the importance of teachers caring and wanting to see students succeed. These researchers suggest that focusing on strengths, and not on missteps or problems, is a strategy that teachers and schools could use to support parent involvement and collaboration. Moreover, it may be that a strength-based approach enhances student transition outcomes. Future researchers need to investigate student transition outcomes when using strength-based assessment and person-centered approaches versus traditional transition processes.
Third, because of the high correlations between BERS-3 TRS subscales scores, questions remain about the distinctiveness of the subscale scores with this population of students. Future research should examine the incremental validity of the subscale scores in respect to predicting important student outcomes to better understand the utility of each of the subscale scores. If additional research was to demonstrate a lack of incremental validity for the different subscales, then the developers of the test might consider shortening the assessment or reducing the number of subscale scores.
Fourth, researchers should also examine the social validity (i.e., teacher perceptions of feasibility, acceptability, and usability) of transition assessments for their students with exceptionalities. If there are barriers that exist to administering the BERS-3 TRS, or other strength-based transition assessments, it would be important to understand what those are and how to address them. Assessments with high levels of social validity are more likely to be used effectively and have greater consumer satisfaction (Donovan & Nickerson, 2007).
Practice Implications
This study affords a few practice implications. The valid and reliable test scores of the BERS TRS with transition-age students suggest several teaching, professional preparation, and service implications. For example, when used with other transition assessment data, BERS TRS test scores can assist parents, teachers, psychologists, and other professionals to identify important transition behaviors to be strengthened, to set goals for transition planning as stated within the IDEA (2004), and to build on current strengths. Indeed, BERS TRS information may be useful in case conceptualization and ultimately to lead to specific intervention goals. For instance, test scores on the Family Involvement subscale that measures a student’s status with their family may be used to enhance a student’s involvement or increase the support provided by a student’s family. Also, teacher preparation programs need to train teachers not to focus on deficits and problems, but to focus assessment more on present student strengths and on strategies to foster child strengths while working to bolster areas where children are not as strong.
Strength-based assessment appears to align with culturally responsive and sustaining practices (Paris, 2012). Culturally sustaining practice: requires that our pedagogies be more than responsive of or relevant to the cultural experiences and practices of young people—it requires that they support young people in sustaining the cultural and linguistic competence of their communities while simultaneously offering access to dominant cultural competence. (Paris, 2012, p. 95)
There is significant diversity within the student population served by special education programming, and transition planning must account for the intersectional identities and community contexts that can support student outcomes (Sinclair et al., 2018). By gathering data that are strength-based and viewed through an asset lens, educators may begin to see not only the strengths of the student but also the resources of the family and community that support the student and the student’s future (Love, 2019).
Transition planning is a collaborative effort in which the student, parent, school professionals, and community personnel identify the key components of the transition plan needed for each student (e.g., Francis et al., 2019). Individual transition plans provide a road map for the student to adjust to postschool life, including postsecondary employment, education, and independent living. There is an opportunity to shift transition planning to be strength-based by starting with assessments, such as the BERS TRS, that are designed to measure the strengths, competencies, assets, and resources of the student.
Supplemental Material
sj-docx-1-cde-10.1177_21651434221119794 – Supplemental material for Validity and Reliability Evidence for Use of the Teacher-Rated Behavioral and Emotional Rating Scale with Transition-Age Students
Supplemental material, sj-docx-1-cde-10.1177_21651434221119794 for Validity and Reliability Evidence for Use of the Teacher-Rated Behavioral and Emotional Rating Scale with Transition-Age Students by Matthew C. Lambert, James Sinclair, Jodie R. Martin and Michael H. Epstein in Career Development and Transition for Exceptional Individuals
Supplemental Material
sj-docx-2-cde-10.1177_21651434221119794 – Supplemental material for Validity and Reliability Evidence for Use of the Teacher-Rated Behavioral and Emotional Rating Scale with Transition-Age Students
Supplemental material, sj-docx-2-cde-10.1177_21651434221119794 for Validity and Reliability Evidence for Use of the Teacher-Rated Behavioral and Emotional Rating Scale with Transition-Age Students by Matthew C. Lambert, James Sinclair, Jodie R. Martin and Michael H. Epstein in Career Development and Transition for Exceptional Individuals
Supplemental Material
sj-docx-3-cde-10.1177_21651434221119794 – Supplemental material for Validity and Reliability Evidence for Use of the Teacher-Rated Behavioral and Emotional Rating Scale with Transition-Age Students
Supplemental material, sj-docx-3-cde-10.1177_21651434221119794 for Validity and Reliability Evidence for Use of the Teacher-Rated Behavioral and Emotional Rating Scale with Transition-Age Students by Matthew C. Lambert, James Sinclair, Jodie R. Martin and Michael H. Epstein in Career Development and Transition for Exceptional Individuals
Footnotes
Declaration of Conflicting Interests
The first and fourth authors are developers of the Behavioral and Emotional Rating Scale-3 and have a financial interest in sales of the assessment. The third author is employed by the publisher of the BERS-3 and, therefore, has an indirect financial interest in sales of the assessment.
Funding
The author(s) received no financial support for the research, authorship, and/or publication of this article.

Supplemental Material
Supplementary material for this article is available on the Career Development and Transition for Exceptional Individuals website with the online version of this article.
References
Supplementary Material
Please find the following supplemental material available below.
For Open Access articles published under a Creative Commons License, all supplemental material carries the same license as the article it is associated with.
For non-Open Access articles published, all supplemental material carries a non-exclusive license, and permission requests for re-use of supplemental material or any part of supplemental material shall be sent directly to the copyright owner as specified in the copyright notice associated with the article.
