



Abstract
The Australian sporting landscape is characterised by centralised broadcasting agreements that leave individual clubs at the mercy of league and broadcaster objectives in determining the nature and degree of their broadcast exposure. As a by-product, the potential exists for variances in television coverage between clubs that may result in significant economic disparity. This article endeavours to quantify this variance and discuss the related management implications of findings by analysing television ratings for a sample of 2,297 Australian Football League and National Rugby League fixtures played between 2007 and 2011. The article concludes that there is significant variance in the coverage provided and corresponding cumulative audience exposure of clubs within both leagues that was likely to impact sponsorship desirability and ability to engage fans. Notably, there was distinct favouritism shown towards those traditionally perceived as “powerhouse” clubs. The degree to which free-to-air broadcasts and finals matches deliver superior audience outcomes to subscription-only telecasts and regular season matches was also quantified.
Keywords
Introduction
The historic growth in the value of broadcast rights has been a central factor in the dramatic commercial growth of sport over the past three decades (Stewart, 2007). The continual rise in broadcast valuations has resulted in media rights becoming the core feature of the business model supporting professional sport (Foster, 2006). The benefits of broadcast revenue growth not only provide financial returns for the engaged stakeholders (Solberg & Gratton, 2013), the commercial funds are also often used by the relevant sports to reinforce their position within both national and global contexts (Rowe, 1999; Lynch & Frawley, 2013).
In Australia, the broadcasting of sport has grown dramatically since the introduction of black and white television in 1956. In the late 1950s, approximately 12 hours of sport was shown weekly on Australian free-to-air (FTA) television. Five decades later, this had increased to approximately 100 hours per week (Shilbury, Westerbeek, Quick, Funk, & Karg, 2014). Australia’s FTA television for much of its history consisted of five channels, that is, two publicly owned and three commercially managed networks. In 1995, pay television was introduced to the Australian market, with sport content as a key component in its establishment. This development created significant growth in rights fees for the major sporting codes, with the two pay networks, Foxtel and Optus, bidding aggressively for sport content (Fujak, 2012).
At the same time as the introduction of pay television, the Australian Government introduced tough anti-siphoning measures that protected the FTA networks and its consumers (Shilbury et al., 2014). The anti-siphoning legislation enshrined that key sport events such as the Australian Football League (AFL) and National Rugby League (NRL) Grand Finals, the Olympic Games, major tennis, and golf tournaments continued to be shown on FTA television (Nicholson, 2007). Despite such regulations, only a small number of sports today generate regular FTA coverage. The AFL and NRL remain the dominant football codes and still the only ones to receive weekly coverage of their competitions on Australian commercial FTA television (Rowe & Gilmour, 2009).
Achieving media and broadcast exposure has therefore been a critical factor in the commercial success or failure of individual clubs competing in professional sporting competitions and leagues (Turner & Shilbury, 2005). This is particularly the case in the Australian sports marketplace which is arguably among the most competitive in the world, with four distinct football codes vying for market share across a national population of approximately 23 million people (Shilbury & Kellett, 2010). In the Australian sports market, the football codes of Australian Rules Football, Rugby League, Rugby Union, and Association Football (Soccer) are administered, respectively, by the AFL, the NRL, the Australian Rugby Union, and the Football Federation of Australia. This article is focused on the two most prominent and financial successful leagues, the AFL and the NRL, both of which have recently signed billion dollar broadcast and media rights deals (Fujak & Frawley, 2013, 2016).
The express purpose of this article, given the background provided previously, is to extend prior research conducted by Turner and Shilbury (2005). The work of Turner and Shilbury (2005) attempted to identify and understand the factors that shaped the broadcast market in Australian professional sport. In doing so, their study also concentrated on the AFL and the NRL; however, their conclusions were based on interviews with senior managers and did not analyse any broadcast ratings data. This study significantly extends their research by drawing upon extensive broadcast ratings data collected over the years 2007–2011. The analysis of these quantitative data provides a strong extension to the prior research and advances the qualitative analysis and findings of Turner and Shilbury (2005). Specifically, the research is focused on three central areas: first, the cumulative audiences generated by individual AFL and NRL clubs, fixture types, and broadcast mediums; second, the relative rate of broadcast coverage on FTA television among AFL and NRL clubs; and third, television ratings’ performance between clubs in comparative markets and contexts.
To achieve the aforementioned aims, the article is presented in four sections. First, literature examining broadcast media evaluation is presented and discussed. Second, the research methodology is outlined. Third, the findings and data analysis are presented and discussed. Finally, the article is concluded with recommendations for future research.
Literature Review
A large portion of the research undertaken into understanding sport broadcasting over the past three decades has focused on how it is consumed by fans. For instance, a study conducted by Gantz and Wenner (1991) found that males were more likely to discuss the game with others, read about the game, tune into the telecast early, and have an alcoholic drink when watching sport on television when compared to females. In a later study, by the same authors, similar finding emerged including that male fans were more engaged when watching televised sport in comparison to female fans (Gantz, Wenner, Carrico, & Knorr, 1995). More recently, however, research by Tainsky, Kerwin, Xu, and Zhou (2014) found that viewership patterns of males and females contained more similarities than differences. The findings of Tainsky et al. build upon the earlier work of Borland and Macdonald (2003, p. 202) “by demonstrating that gender differences exist regarding a limited number of traditional determinants of demand (i.e. income, local market indicators) for in-game telecast viewership.”
This study rather than being focused directly on the consumption patterns of fans, at a micro level, is more concerned with the impact of decisions taken at the league level and the related consequences for broadcast ratings. From this perspective, there are two key elements that make the quantification of broadcast exposure in the Australian sport landscape particularly critical. First, both the AFL and NRL are characterised by centralised decision making, collective broadcasting agreements, and shared broadcast revenue (Stewart, Nicholson, & Dickson, 2005). Correspondingly, clubs forgo significant autonomy to maximise their own exposure and instead allow league management to act as its agent (Stewart, 2007). Yet, while work by Turner and Shilbury (2005) has demonstrated there to be a consensus between clubs, league, and broadcasters that centralised management is the best structure to manage AFL and NRL broadcast rights, clear conflicts have been observed in balancing broadcaster, league, and club needs. For example, Jakee, Kenneally, and Mitchell (2010) determined there to be asymmetries in the distribution of favourable playing slots among AFL clubs (in favour of “high-profile” teams) that was likely to cause significant intraclub financial variance. This financial inequity manifested both directly through gate receipts and indirectly through sponsorship attractiveness via television exposure (Jakee, Kenneally, & Mitchell, 2010). Notably, the findings presented by Jakee et al. relied on average television audiences in their calculations and only focused on the AFL, but this study provides a significant extension to their work by providing an amalgam of actual broadcast ratings across both the AFL and the NRL using data collected over a 5-year period.
The findings of Jakee et al. (2010) align to the themes identified earlier by Turner and Shilbury (2005) and then later by Turner (2012, p. 57) again, where it was observed that club managers “posited that the share of FTA and fixtured (timing of) games broadcast needs to be made more equitable across the competition.” Turner and Shilbury also observed that senior managers within the AFL and NRL clubs held a strong suspicion that the broadcasters of their codes had strong preferences towards certain teams that could not be overcome even through factors such as strong on-field performance. This finding is also similar to the strategic management policies identified by Fortunato (2001) who observed that the National Basketball Association (NBA), in conjunction with its broadcasters, formulated the NBA season to enable broadcasters to telecast the most popular games to meet the commercial needs of broadcasters. In a more recent study, Fujak and Frawley (2013) observed that the NRL’s seemingly passive approach to broadcast management resulted in the highly successful Melbourne Storm club receiving only 21% broadcast coverage on FTA television in its local market, 60% of which was on a delay of greater than 1½ hr.
A second reason why the quantification of broadcast exposure is critical relates to the aforementioned link between exposure and associated commercial rights such as sponsorship and merchandising. As noted by Turner and Shilbury (2005), the importance of securing maximum broadcast exposure is critical to clubs in two respects. First, broadcasts provide the medium by which clubs can engage with their existing fans as well as to continue to develop new ones. Second, AFL and NRL clubs have the autonomy to secure team sponsors for whom the club can deliver in-game exposure through stadium and jersey advertising (Fujak & Frawley, 2016). Critical to this research, and as discussed by Turner and Shilbury, the value of such sponsorships is largely dictated by the broadcast exposure clubs can provide their sponsors. This view is supported by Kelly and Whiteman’s (2010) qualitative case study of the Brisbane Broncos NRL club in which their major sponsor nominated team in-store appearances and total media exposure as the two key criteria by which sponsorship effectiveness was measured. The study also makes reference to the frequent appearance of the club in the prime Friday night broadcast time slot, which the authors suggest contributed to the Bronco’s lucrative sponsorship agreements. The financial value associated with securing premium broadcast coverage is also supported by Jakee et al. (2010, p. 59) who have noted: The price that commercial sponsors will pay for the placement of their logos varies directly with the number of potential consumers that are likely to see these advertisements; in other words, the price varies with television viewership. Thus, unlike the revenues from the league’s broadcasting contract, the sponsorship revenues are marginal in that they flow directly to a team and they depend directly upon the size of the expected television viewership for a given slot.
Therefore, in the Australian sport context, AFL and NRL club practitioners are placed in the unenviable position of competing for sponsorship revenue within one of the world’s most competitive sporting markets when one of the primary drivers of sponsorship revenue, broadcast exposure, is largely outside their direct control. The findings of Jakee et al. (2010) in fact suggest the potential for a self-fulfilling prophecy where high-profile clubs, such as those identified by Turner and Shilbury (2005), receive preferential broadcaster treatment. This in turn may result in superior attendance and sponsorship opportunities that self-perpetuate and reinforce the existing hierarchy of “rich” and “poor” clubs. Furthermore, as stated by Turner (2012, p. 57), “The broadcaster influence over scheduling was seen to have a direct bearing on club audience, membership and sponsorship outcomes. This situation creates a clear sense of injustice to the clubs when addressing issues surrounding sport broadcasting.”
Methodology
Study Background
The study was designed around a multiple case study approach. This research design was adopted in order to compare cases, that is, to consider what was unique and what was common across the selected cases (Bryman, 2008). In order to provide further context, a brief organisational overview of both the AFL and NRL is outlined subsequently.
The AFL is the governing organisation for sport known as Australian Rules football (also referred to as Aussie Rules). The sport was developed, in 1858, in the southern Australian city of Melbourne (Cashman, 2010). Having started as a sport primarily played in the southern and western states of Australia over the past three decades, the sport has expanded into the northern states with now an 18-team national competition played from March to the last week of September. The AFL is regarded as the most successful elite sport competition in Australia. This success has been based upon significant governance reform starting in the 1980s when the AFL moved from a delegate system to an independent commission in 1985 (Fujak & Frawley, 2013). The AFL has leveraged this governance reform through the establishment of a strategic vision to aggressively grow the game across the nation (Stewart et al., 2005). A central element in the reform of the AFL was the introduction of a salary cap and draft to ensure competitive balance (Stewart, 2007). Today the AFL generates the largest broadcast revenue in Australia, which is shared equally between the 18 clubs, and it also has the largest sponsorship portfolio of any of the football codes played in the nation (Stewart, 2007). The AFL employs more than 400 full-time staff, making it the biggest single-sport employer in the country, and earned Australian dollar (A$)446 million as revenue in 2013 (Australian Football League, 2014).
The NRL is the governing body, in Australia, for the sport of rugby league. The sport was established in Australia in 1907 after being developed in England in 1895 as a breakaway from rugby union (Cashman, 2010). The sport has been mainly played in the northern Australian states of New South Wales (NSW) and Queensland. The elite competition was expanded from a Sydney centric league in the 1980s and 1990s into a national competition that included teams from Melbourne, Adelaide, Perth, Brisbane, and North Queensland (Fujak & Frawley, 2013). However, as a result of a split between various stakeholders including competing television broadcasters, the national competition in the late 1990s was rationalised, with teams from Adelaide and Perth being removed. Today the NRL consists of 16 teams from NSW, Queensland, Canberra, Victoria, and New Zealand. The NRL is much smaller in terms of employees, in comparison to the AFL, with approximately 150 full-time employees. In 2012, the sport went through a major governance transformation with the establishment of an independent commission, similar to the AFL model (Fujak & Frawley, 2016). Partly as a result of this governance change and the sport’s ability to attract very large television ratings, the NRL recently negotiated its broadcast rights, securing a billion dollar deal ensuring the game’s prosperity for the medium term (Fujak & Frawley, 2016). Like the AFL, the NRL equally shares its broadcast revenues across the 16 clubs and has a salary cap.
The decision to examine both the AFL and NRL over the period nominated centred on several important considerations. First, as previously stated, these two codes represented the dominant share of the Australian football industry, being the only two national football codes to be televised on a weekly basis on FTA television during the time period under examination. Second, performance in terms of ratings and exposure is best measured in relative rather than absolute terms (Fujak, 2012). Therefore, the study of one football code without consideration of its main competitors would have been incomplete.
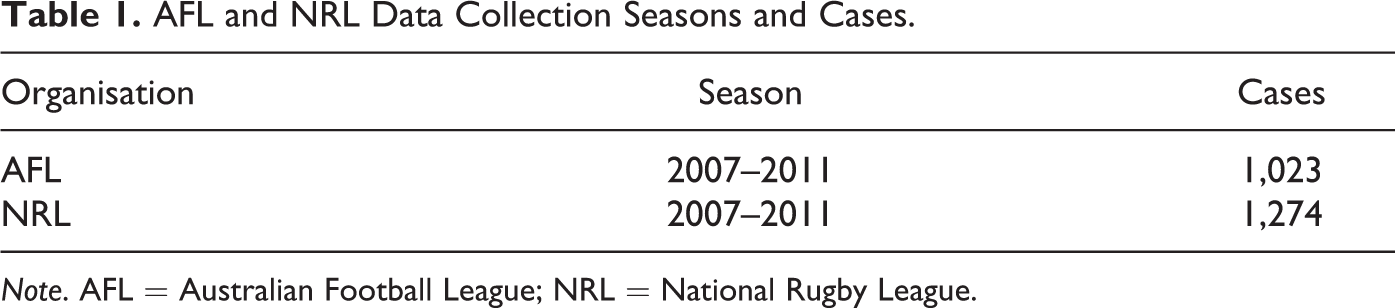
The tracking period of 2007–2011 was chosen due to both methodological and practical factors (see Table 1). The period 2007–2011 represented the entirety of the AFL’s most recently completed commercial broadcast agreement, while the NRL’s current broadcast contract commenced in 2007 and ended in 2012 (Austar, 2007). Prior to 2007, the broadcast environment for both the AFL and NRL was drastically different, impairing cross-code comparison and longitudinal analysis. Season 2007 witnessed an expansion in the NRL competition from 15 to 16 teams. This resulted in not only an additional game per standard round but also a dramatic change in scheduling, resulting in a different distribution of bye allocations and also a change in the standard weekly time slots in which fixtures were played (Fujak, 2012). Season 2007 also saw a dramatic change in AFL scheduling, with a move from incumbent rights holder Channel 9 to a joint bid by Channel 7 and Channel 10 which resulted in a greater distribution of coverage on FTA television (Fujak & Frawley, 2013, 2016).
AFL and NRL Data Collection Seasons and Cases.
Note. AFL = Australian Football League; NRL = National Rugby League.
Data Background
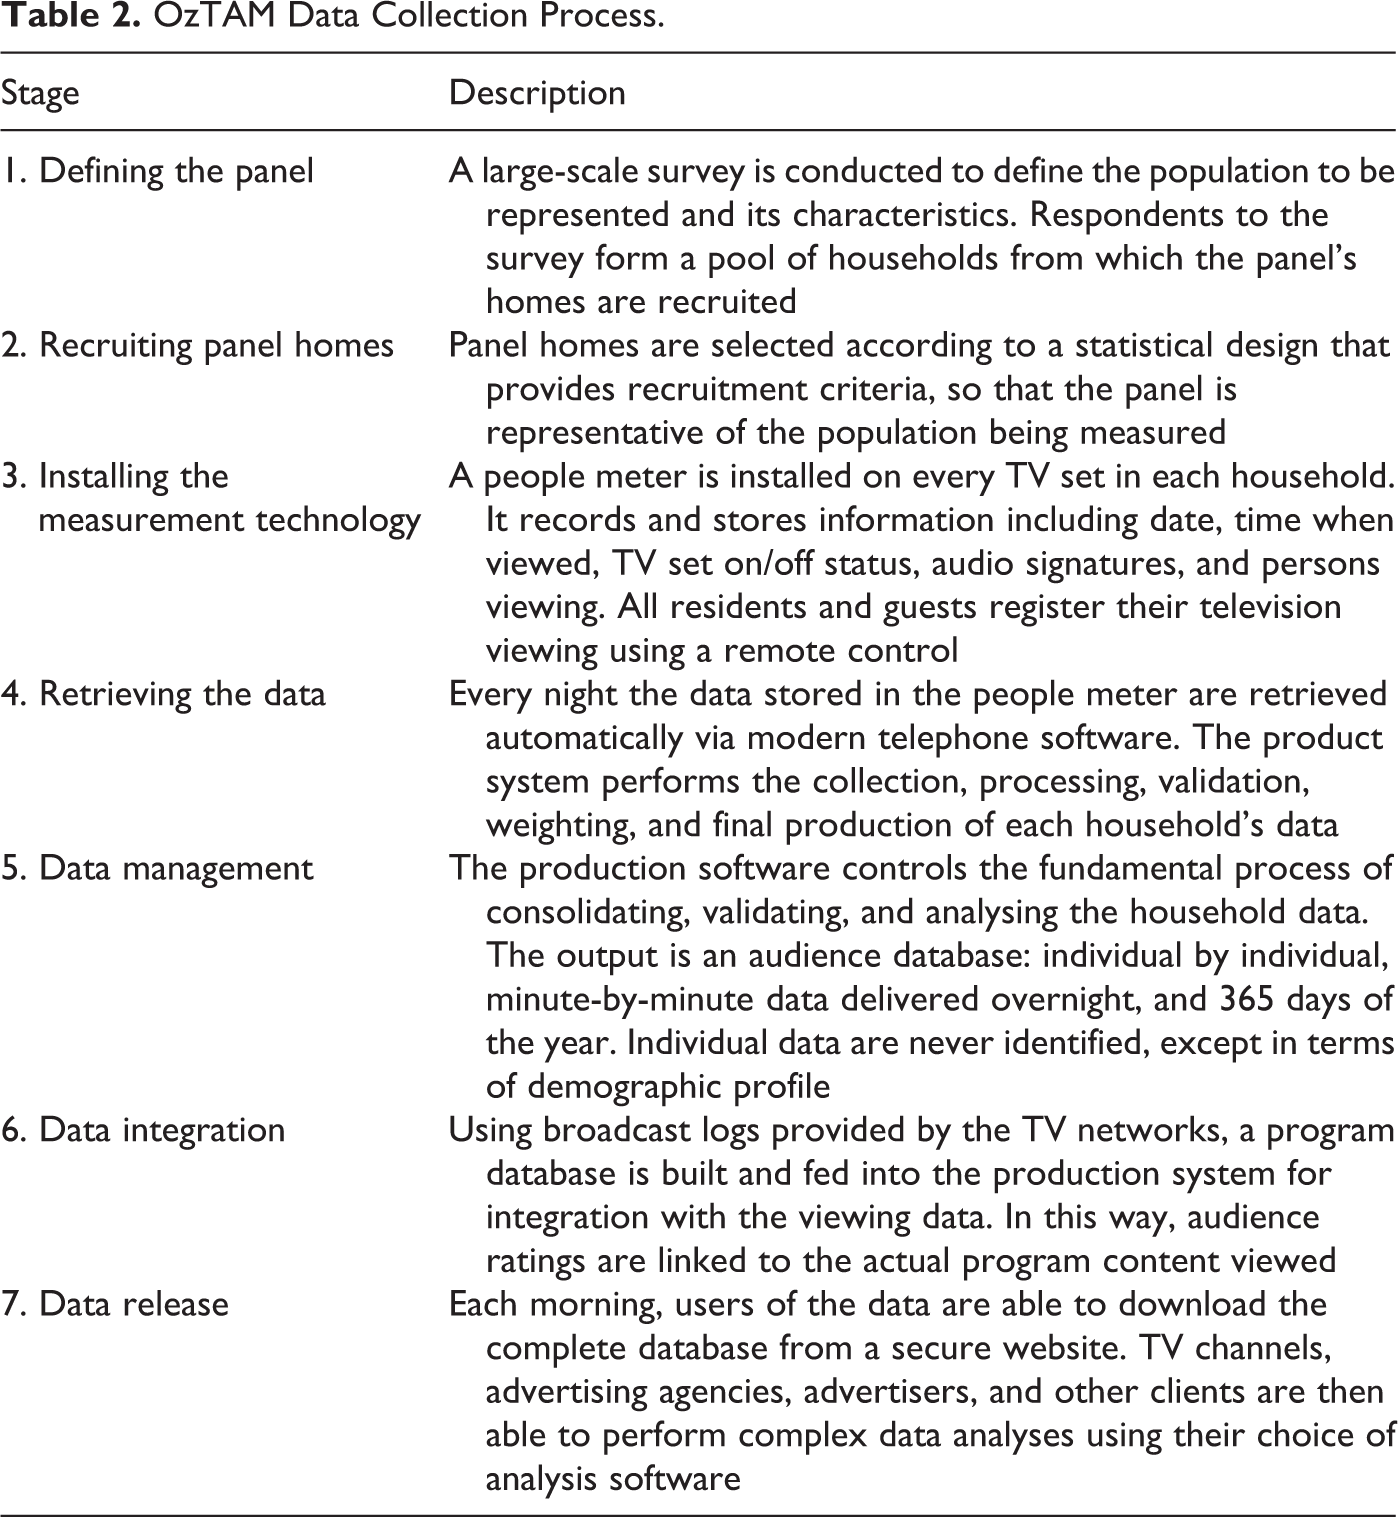
The study utilised data created by OzTAM and Regional TAM, the sole providers of television rating information in the Australian marketplace who each lay claim to being the medium by which television media is bought and sold. The rating collection process occurs in seven stages, namely defining the panel, recruiting panel homes, installing the measurement technology, retrieving the data, data management, data integration, and data release (Table 2).
OzTAM Data Collection Process.
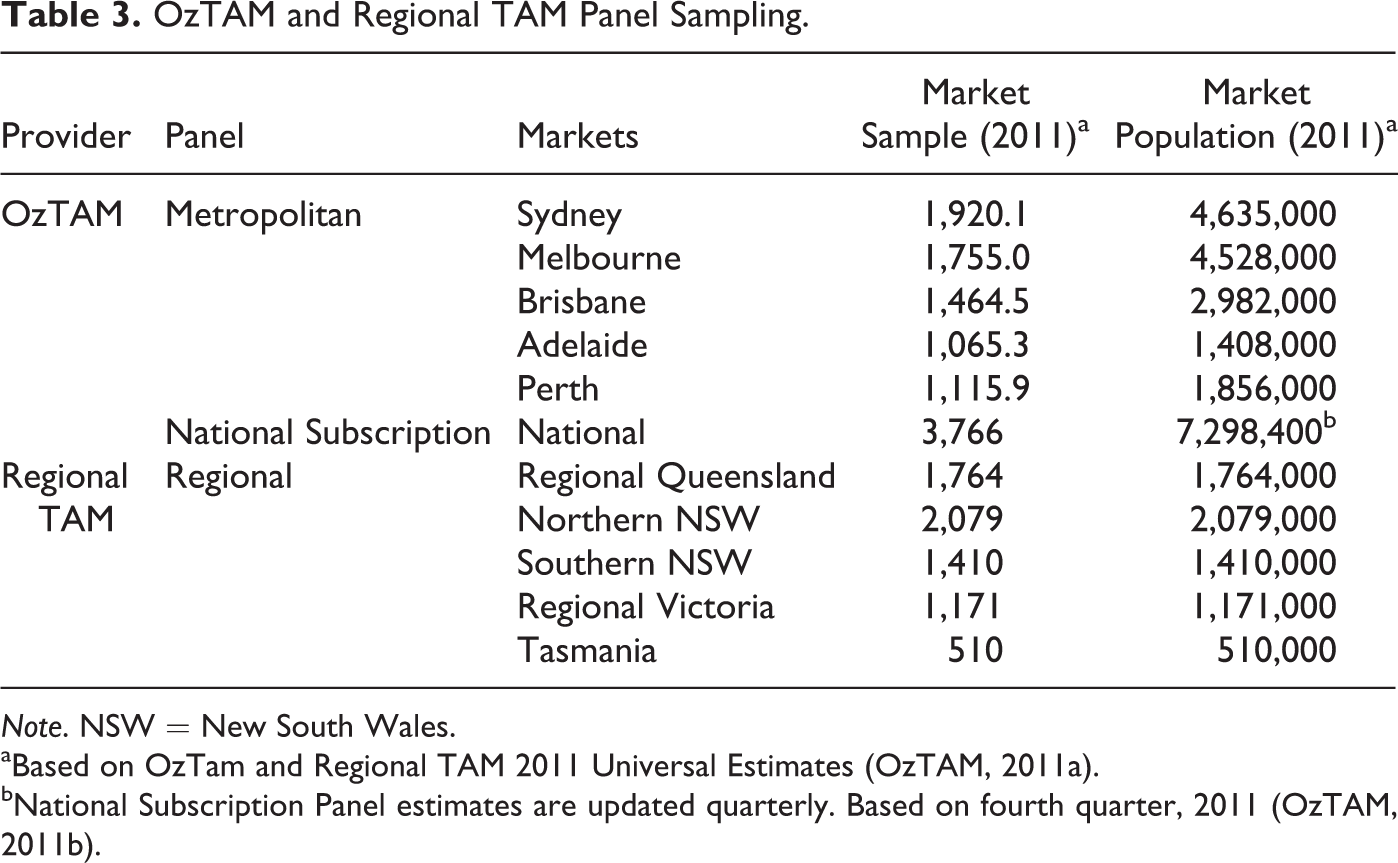
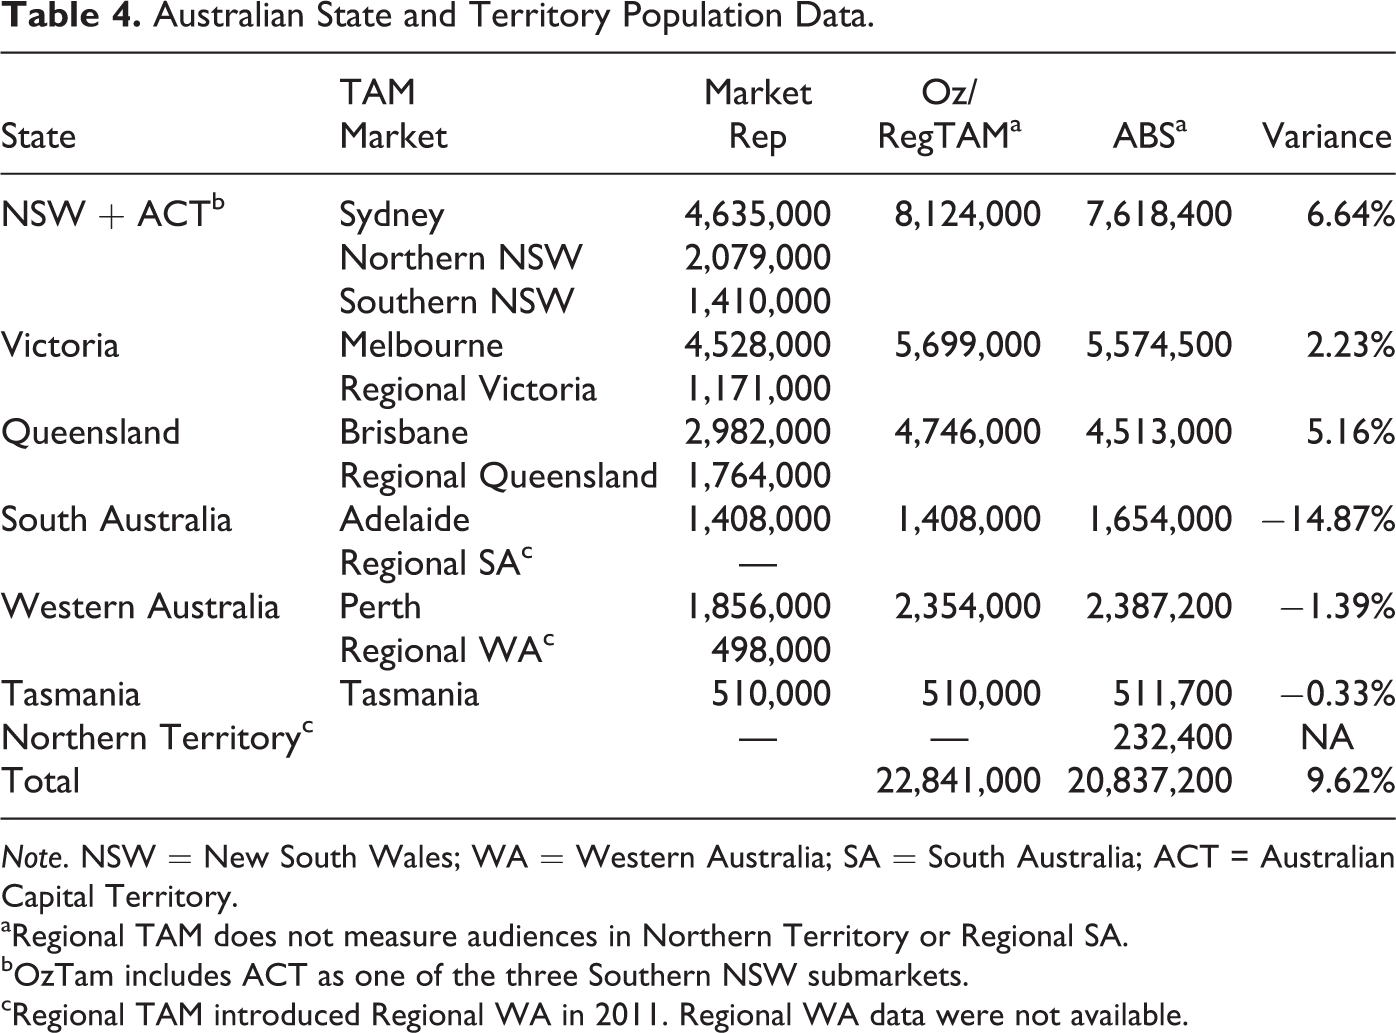
Collectively, OzTAM and Regional TAM utilise a sample size of over 5,000 households and 14,000 individuals within 10 regions (since increased to 11) across Australia (Table 3). This represents a superior per-capita sample size when compared to markets such as the United Kingdom, Italy, Indonesia, and Greece (Fujak, 2012). When combined, the measured markets of OzTAM and regional TAM represent the Australian national viewing audience. However, both research firms warn against amalgamating their data sets due to minor overlap in panel regions that is possible within both of their samples (Fujak & Frawley, 2013). A comparison of OzTAM and Regional TAM national population estimates and the Australian Bureau of Statistics estimates during the period of analysis is provided in Table 4.
OzTAM and Regional TAM Panel Sampling.
Note. NSW = New South Wales.
aBased on OzTam and Regional TAM 2011 Universal Estimates (OzTAM, 2011a). bNational Subscription Panel estimates are updated quarterly. Based on fourth quarter, 2011 (OzTAM, 2011b).
Australian State and Territory Population Data.
Note. NSW = New South Wales; WA = Western Australia; SA = South Australia; ACT = Australian Capital Territory. aRegional TAM does not measure audiences in Northern Territory or Regional SA. bOzTam includes ACT as one of the three Southern NSW submarkets. cRegional TAM introduced Regional WA in 2011. Regional WA data were not available.
It should be noted that the method of measuring television audiences remained largely consistent across tracking period with one exception. From December 27, 2009, OzTAM and Regional TAM changed the structure of their panels to reflect the increasing usage of personal video recording (PVR) and time-shift viewing among Australian television viewers. OzTAM (2010a, p. 2) defines time-shift viewing as the “viewing of television broadcast programming at a later time than the live (actual) broadcast time.” Time-shift viewing is achieved through devices such as Foxtel IQ and Tivo and was present in 25% of households at the time of the launch on January 1, 2010.
The move to incorporate time-shift viewing resulted in a 25% turnover in the makeup of the national sample to reflect homes with PVR functionality. While this had the potential to impact longitudinal comparability, both samples remained nationally representative via the ratings process described in Table 2. Additionally, research has illustrated sport and news content to be the least impacted by PVR viewing habits due to inherent viewer preference to watch these genres live (Barkhuus & Brown, 2009; Rudström, Sjölinder, & Nylander, 2009). The introduction of time-shift viewing has the potential to impact the sporting landscape, however, with viewership of popular leagues played overseas broadcast at late hours likely to be the main beneficiaries of this type of viewership measurement.
The data set is a collection of “average” audiences for each broadcast in each market in which the fixtures were telecast. The average audience is defined as the “average number of people in a target market who were watching a specific event or time band each minute, expressed in absolute figures for that demographic” (OzTAM, 2010b). For the purposes of the data set, the “specific event” is the match itself, ignoring any prematch or postmatch programmes. Additionally, the data included as part of the analysis consist of broadcast ratings arising from the first airing of matches only. While the data set excludes replays, matches shown on delay on FTA television but which happened to be the first airing of the match in a specific market are included. This was largely due to the regularity of occurrence in which matches were aired on a considerable delay from the time of match kickoff to broadcast on FTA. The length of this delay was measurable as part of the data set, but this analysis was outside the core discussion beyond further validating the central results and findings.
The data set contains information regarding the television viewership of a combined 2,297 AFL and NRL fixtures played between 2007 and 2011. In total, AFL and NRL premiership seasons represented 85% of all cases included in the study. Non-premiership fixtures, which include the AFL’s preseason competition, the NRL’s youth development competition for 20-year-olds, and senior representative matches, were more common in the NRL. These matches constituted 15% of fixtures broadcast on television. The AFL received much higher levels of FTA broadcast coverage than the NRL during the period. Considering regular season and finals matches, the AFL premiership was telecast in 5,307 broadcast slots from 9,370 opportunities (937 matches and 10 broadcast markets) during the period, equating to an FTA coverage rate of 57%. The NRL premiership FTA coverage equated to 39% during this period, which are derived from 3,938 broadcasts of the 10,050 opportunities (1,005 matches and 10 broadcast markets).
Data Analysis
The analysis was conducted utilising the SPSS statistical program. Beyond the interpretation of summary statistics, the primary inferential statistical technique utilised within the study was the between-subject one-way analysis of variance (ANOVA). The technique allowed for the discovery of differences between groups (being clubs or club groupings) on the basis of numerical, scale data (being television ratings and broadcast slots).
Given the assumptions of the ANOVA method apply equally to all analyses to follow, the conformity to underlying assumptions is discussed here with any deviation from such assumptions noted henceforth within the applicable analysis. First, the ANOVA method is underpinned by the assumption that groups are normally distributed on the dependant variable (Montgomery, 2013). However, as noted by Field (2013), the ANOVA method is relatively robust to violations of this assumption. Second, the ANOVA method is underpinned by an assumption of equal variances. To control for this, Levene’s test was analysed to ensure any divergence from equal variances was observed and treated accordingly. Finally, it must be noted that ANOVAs are susceptible when analysing groups with unequal sample sizes, which given the innate nature of the data is a feature of the data set. This vulnerability was mitigated through the use of Gabriel’s post hoc tests, which as Field notes is more appropriate than alternate techniques when dealing with unequal sample sizes.
It is also important to note the limitations of using quantitative television ratings data. As outlined by Ang (2006, p. 50–51), television ratings data and the technologies developed to collect it have a “reductionist” quality with “viewing behaviour defined as a simple, one-dimensional and purely mechanical act.” Furthermore, television ratings data are unable to provide in-depth analysis with regard to what is “remembered, loved, learned from (or) deeply anticipated” (Gitlin, 1985, p. 54). To understand the lived experiences behind the television ratings data, more qualitative approaches are required to be adopted by media researchers (Ang, 2006).
Results and Discussion
Cumulative Broadcast Ratings and Commercial Revenue
A significant variance was evident in the cumulative audiences recorded by each club within both the AFL and NRL. When considering all teams and coverage, including finals, the Collingwood Magpies (AFL) were the most watched football club in Australia over the study period, with a total of 127,122,814 viewers. This represented a 127% difference with the lowest watched AFL club, the North Melbourne Kangaroos, over the same period. Inspection of the 2011 annual reports for the Collingwood Magpies and North Melbourne Kangaroos illustrated that these clubs generated A$22,170,584 and A$8,782,975 in sponsorship revenue, respectively, during the 2011 season, equating to Collingwood generating 152% more sponsorship revenue than North Melbourne (Collingwood Football Club, 2011; North Melbourne Football Club, 2011). Notably, this sponsorship outperformance was closely connected to the variance in broadcast coverage, which during the tracking period (2007–2011) equated to 127% more broadcast exposure and specifically in the 2011 season, 210% more exposure.
This considerable discrepancy in sponsorship revenue had significant implications on the ability of clubs to invest in their operations, creating a disadvantage for clubs such as North Melbourne due to the asymmetric broadcast coverage. The Collingwood Magpies were able to invest an additional 4 million dollars into football operations during the 2011 season (A$19,412,167) as compared to North Melbourne (A$15,280,850). At the completion of the 2011 season, the Collingwood club held current assets (cash and other receivables readily converted to cash) worth approximately A$14 million as compared to North Melbourne who held only A$1.5 million (Collingwood Football Club, 2011; North Melbourne Football Club, 2011). It is therefore evident that inequality permeates across the league despite the league’s attempts to maintain competitive balance and equalisation (Jakee et al., 2010).
Within the NRL, the Brisbane Broncos recorded the greatest cumulative audience among all teams during the study period. Their cumulative audience of 111,983,391 represented a 191% difference with the lowest viewed NRL club, the Canberra Raiders. The Raiders held a cumulative audience of 38,564,537 during the study period (see Figure 1). Notably, while only featuring in 15 fixtures over the study period, the NRL representative games between the “State of Origin” teams NSW and Queensland drew a higher cumulative audience (49,807,464) than two NRL clubs: the Cronulla Sharks (43,944,027) and Canberra Raiders (38,546,537) despite being broadcast over 159 and 177 fixtures, respectively. These findings extend the research of Kelly and Whiteman (2010) who noted that broadcast exposure was a key driver in Brisbane’s successful relationship with its major sponsor, the telecommunications retailer known as “WOW.” Furthermore, reflecting the importance of broadcast exposure in sponsorship valuation, the Broncos sponsor (WOW) was the highest rated Australian football sponsor in 2008, generating A$7 million in media exposure, according to Kelly and Whiteman. This rating coincided with the Brisbane club also recording the largest cumulative audience for the year among all AFL and NRL clubs (23,483,602). Similar to their AFL counterparts, discrepancies were apparent within the NRL in terms of the levels of spending in football departments. The Brisbane Bronco’s invested nearly A$12 million into football operations during the 2011 calendar year, representing a A$4 million advantage when compared to the Cronulla Sharks (A$8,045,858) and Newcastle Knights (A$7,380,569). These two latter teams were among the clubs to receive the least amount of broadcast exposure (Brisbane Broncos Rugby League Club, 2011; Cronulla Sharks Rugby League Club, 2011; Newcastle Knights Rugby League Club, 2011).
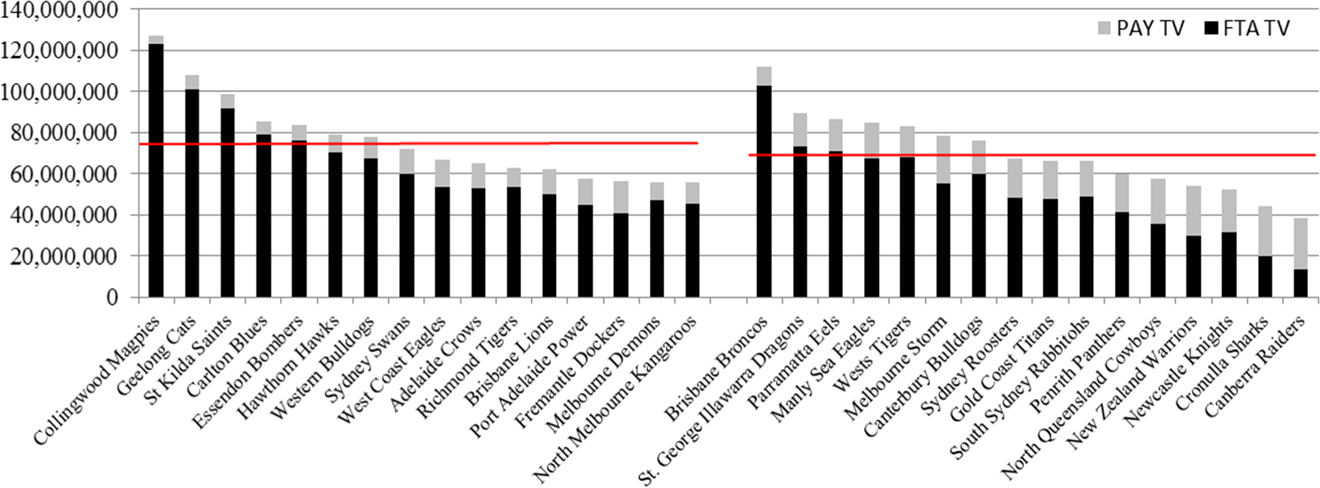
Cumulative AFL and NRL television ratings (including finals). Note. AFL = Australian Football League; NRL = National Rugby League.
On a regular season basis, a significant variance in broadcast coverage was also evident. The Brisbane Broncos (NRL) recorded the largest cumulative national viewing audience of 97,135,071 (see Figure 2). This was 196% greater than the Canberra Raiders (NRL) who recorded the smallest audience of both codes (32,775,865). Similarly, the Collingwood Magpies recorded the greatest regular season coverage in the AFL (88,894,209), while North Melbourne the lowest (47,362,668). During the five seasons of analysis, the mean cumulative viewership per AFL and NRL team was 61,340,504 (standard deviation [SD] of 10,979,308) and 58,815,224 (SD of 16,901,029), respectively. Most notable, however, was the greater level of intraclub coverage variance that was observed within the NRL competition. Standardising the variance between the competitions utilising the coefficient of variation (CV) in cumulative audiences, the NRL recorded a CV of 28.74% as compared with 17.90% in the AFL.
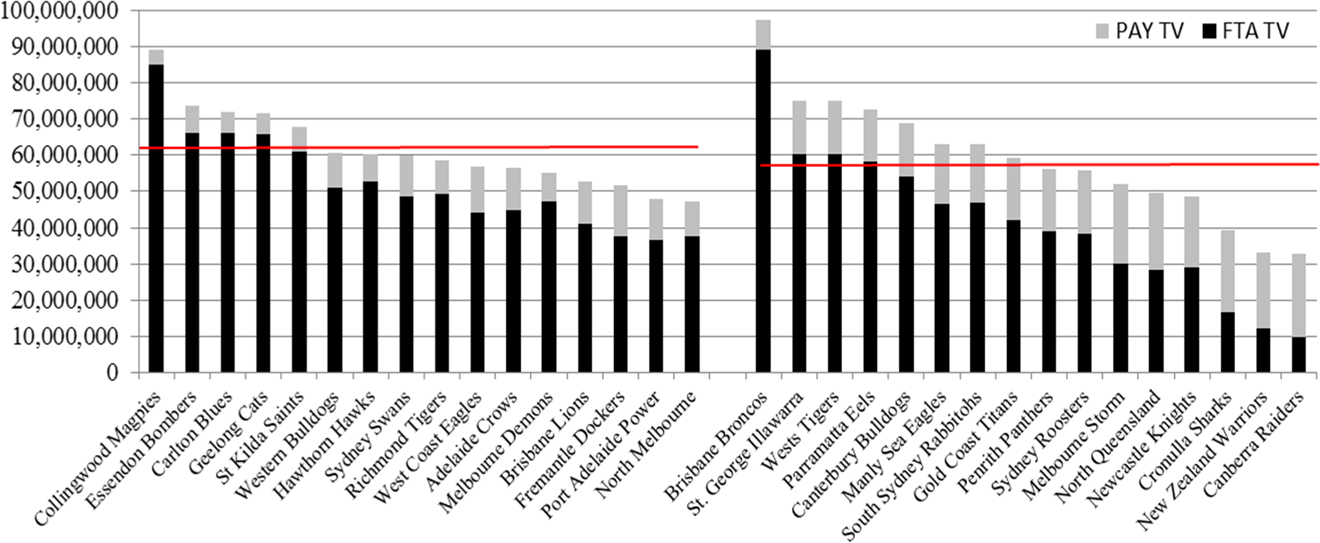
Cumulative AFL and NRL television ratings (excluding finals). Note. AFL = Australian Football League; NRL = National Rugby League.
Maximising FTA Presence
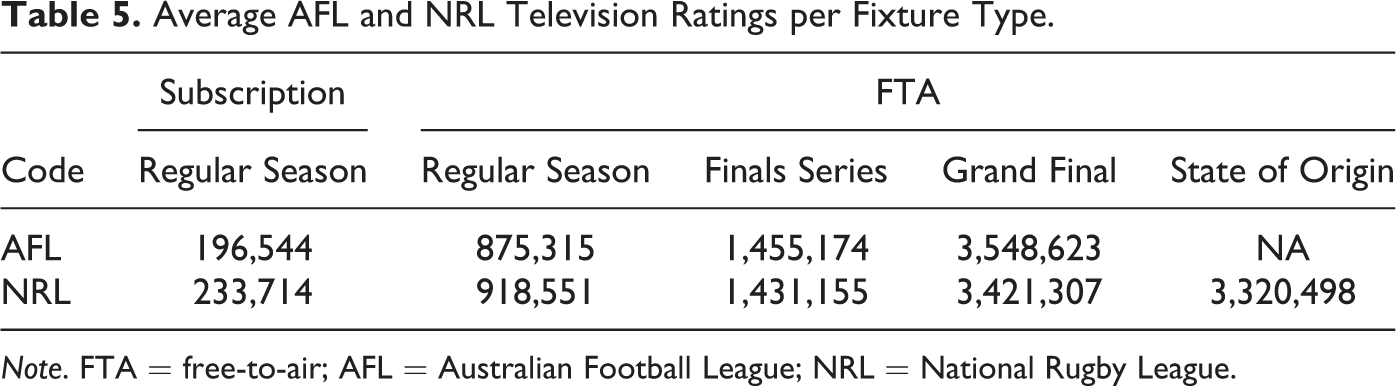
Of note in Figure 2 is the prominence of the relative contribution of audiences made by FTA as compared to subscription television (i.e., pay television broadcaster Fox Sports). At a code-wide level (including finals and non-premiership fixtures), FTA broadcasts represented 87% of cumulative AFL audiences and 76% of cumulative NRL audiences during the tracking period. The significant discrepancy in audience size for fixture telecasts on FTA as opposed to subscription television is depicted in Table 5. Given the simulcasting of matches and the potential for matches to be broadcast on FTA but not across every available market, comparison of audience sizes should be treated with some caution. Within the AFL, regular season fixtures telecast exclusively on subscription television (n = 154) generated an average audience of 196,544. In contrast, the combined average audience across all 10 FTA broadcast markets for regular season AFL games accumulated to a total of 875,315 viewers, an audience nearly 4½ times larger than its counterpart. A similar outcome occurred in the NRL, with regular season subscription only fixtures (n = 596) generating an average of 233,714 viewers as compared to 918,511 for the amalgamated average audience across the 10 FTA broadcast markets for all regular season matches.
Average AFL and NRL Television Ratings per Fixture Type.
Note. FTA = free-to-air; AFL = Australian Football League; NRL = National Rugby League.
This analysis of broadcast ratings extends the findings of Turner and Shilbury (2005), who in their qualitative study of the Australian football landscape, identified a resonating desire among NRL and AFL senior managers to maximise their clubs’ presence on FTA television. The source of this desire was the belief that FTA broadcasts offered the greatest medium to provide club exposure, which, through commercial sponsorship, among other ancillary benefits, would result in the maximisation of club revenue. Such findings also extend the research of Rowe and Gilmour’s (2009) in their analysis of Australian Soccer, in which they noted the near-exclusive presence of sport on subscription television as severely limiting Soccer’s reach and thus potential future commercial development. Their research suggests a potential 5-fold increase in Soccer audiences associated with FTA coverage, given the audience ratios associated with FTA versus subscription television coverage in both the AFL and NRL, as well as subscription television penetration rates identified during the period appears a fair estimate. The NRL audiences increased fourfold on FTA, while the AFL audiences increased fivefold in the aforementioned examples, with Soccer likely to fit in between this range, given the more national rather than regional-centric support exhibited towards AFL and NRL.
The importance of on-field success in achieving exposure through finals appearances is also clear. The average Grand Final audience within the AFL and NRL during the period was 3,548,623 and 3,320,498, while finals series matches (excluding Grand Finals) recorded averages of 1,455,174 and 1,431,155, respectively, over the study period. Of interest, given the Melbourne Storm’s success in appearing in nine finals matches and three Grand Finals, the club was able to generate a combined finals viewing audience of 25,086,270 (third overall). Given a cumulative FTA viewing audience of 55,191,128, during the period, 45% of the clubs FTA telecast exposure came from matches in which the broadcaster was obliged to telecast the fixture irrespective of the team. Therefore, only 55% of Melbourne Storm FTA viewership came from matches in which the broadcasters willingly selected them for telecast. In contrast, the Essendon Bombers from the AFL appeared in only two finals matches and their finals cumulative audience of 2,466,631 represented only 3% of their cumulative FTA coverage. The AFL’s Geelong Cats recorded the most finals appearances and highest finals ratings (30,907,639) that equated to 68% of the absolute total of the North Melbourne Kangaroos (AFL) cumulative FTA viewership.
The cumulative viewership attained by clubs alone however does not provide a complete insight into the broadcast exposure performance of individual clubs. Cumulative viewing audiences are a reflection of the aggregate amount of telecast opportunities provided. During the AFL regular season, the Collingwood Magpies held the highest rate of FTA broadcast coverage with 78.18% of matches broadcast and the Fremantle held the lowest (34.36%), while the league-wide average was 54.47% (Figure 3). In the NRL, the Brisbane Broncos received the greatest proportion of FTA match coverage (71.50%); Canberra Raiders received the smallest proportion (9.67%), while the league averaged 36.36%. It is therefore not surprising that a statistically significant ( p = .000) correlation exists between the level of broadcast exposure a club receives and their cumulative rating (Pearson correlation coefficient of .859). Also worth observing, the overall variance in intraclub FTA exposure between codes was considerably greater in the NRL, with the code holding a CV of 45.82%, more than twice that of the AFL (22.64%). This finding therefore extends Turner and Shilbury’s (2005) qualitative broadcast study, by quantifying through the ratings data that specific teams receive favourable television coverage. The results also support and extend similar findings made by Jakee et al. (2010) by quantifying audience figures that these authors were only able to estimate.
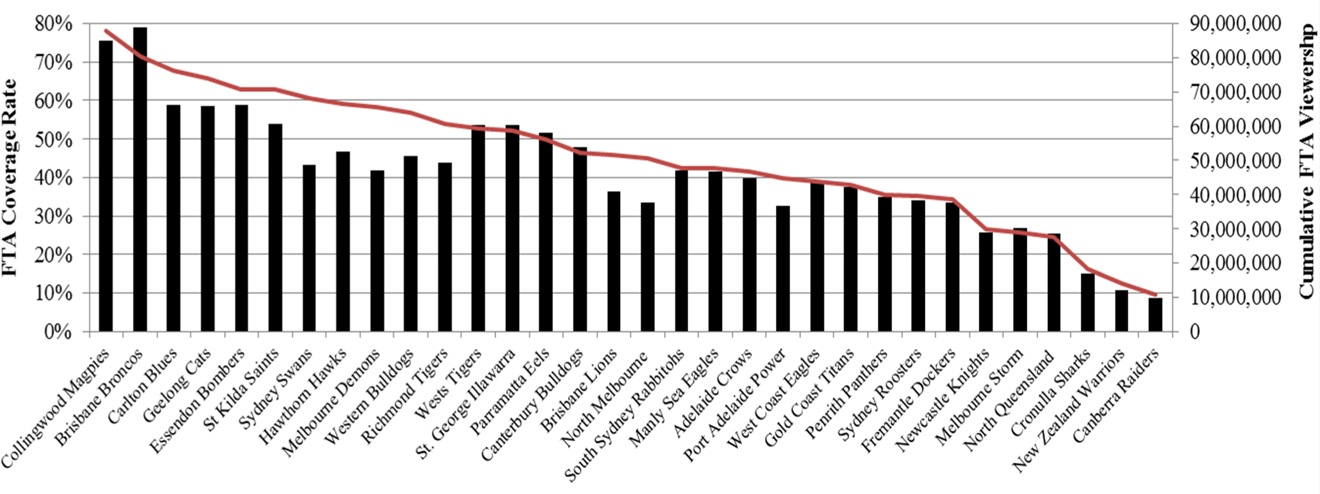
Cumulative free-to-air viewership versus proportion of coverage.
On-Field Performance and FTA Coverage
Club coverage did not appear to vary dramatically based on on-field performance (Figure 4). Several teams recorded levels of broadcast coverage over and above the league-wide average despite poorer than average team performance. The Carlton Blues and Essendon Bombers recorded the second and fourth highest levels of FTA coverage in the AFL, despite holding the 9th and 11th worst win–loss records, respectively. The Melbourne Demons recorded the eighth highest level of exposure, despite recording the second worst win percentage among all the AFL clubs. Similarly, the NRL’s most successful team, the Melbourne Storm, ranked 12th for FTA coverage, despite holding the highest win percentage in either football code. The Sydney-based Manly Sea Eagles, which held the highest win percentage among NSW-based NRL clubs, received less FTA coverage than five other Sydney-based clubs (Figure 4).
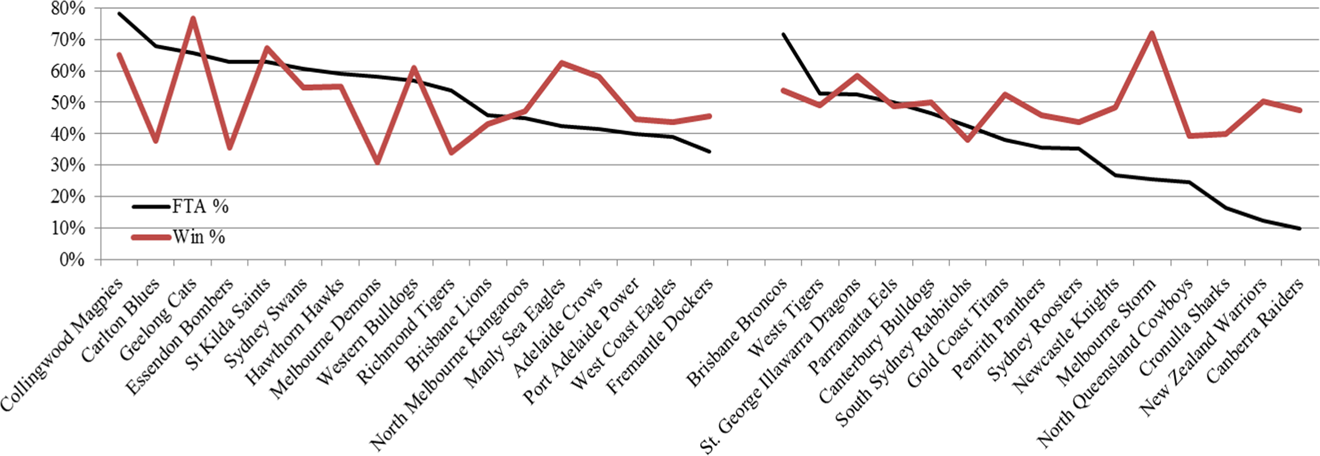
Proportion of win percentage versus free-to-air coverage.
Pearson’s correlation coefficient suggests that there is a statistically insignificant (r = .134, p = .235, n = 80) correlation between prior year on-field success rate and the propensity to receive FTA broadcast coverage in the NRL. In the case of the AFL, a statistically significant, but weak, relationship (r = .352, p = .001, n = 80) was discovered between prior year performance and current year broadcast coverage rates. In both leagues, therefore, there would appear to be little support that on-field performance has a strong impact on the propensity to receive FTA broadcast coverage. In a somewhat ironic twist, Turner’s (2012) research notes that clubs are in fact willing to accept team performance as a valid input in prioritising broadcast coverage between clubs. Rather, it is the prioritisation of specific club “brands” that were determined to cause consternation around the mechanisms of broadcast selection. Perhaps reflecting the existence of other more significant drivers in broadcast selection, the most notable intraseason fluctuation in coverage occurred for the St. George Illawarra Dragons where the tracking period can be demarcated by the signing of highly successful coach Wayne Bennett for seasons 2009–2011. During the pre-Bennett era (2007–2008), the club received an average 94 broadcast slots per season and held a 46% win record. During his 3-year reign as club coach (2009–2011), the team increased its win record to 67% and received an average 147 broadcast slots per season. This corresponded to a regular season increase in cumulative season audiences from 11,976,759 during the pre-Bennett era to 17,070,483 during his reign, a 5-million viewer increase in annual broadcast exposure.
Team Ratings’ Performance Within Individual Broadcast Markets
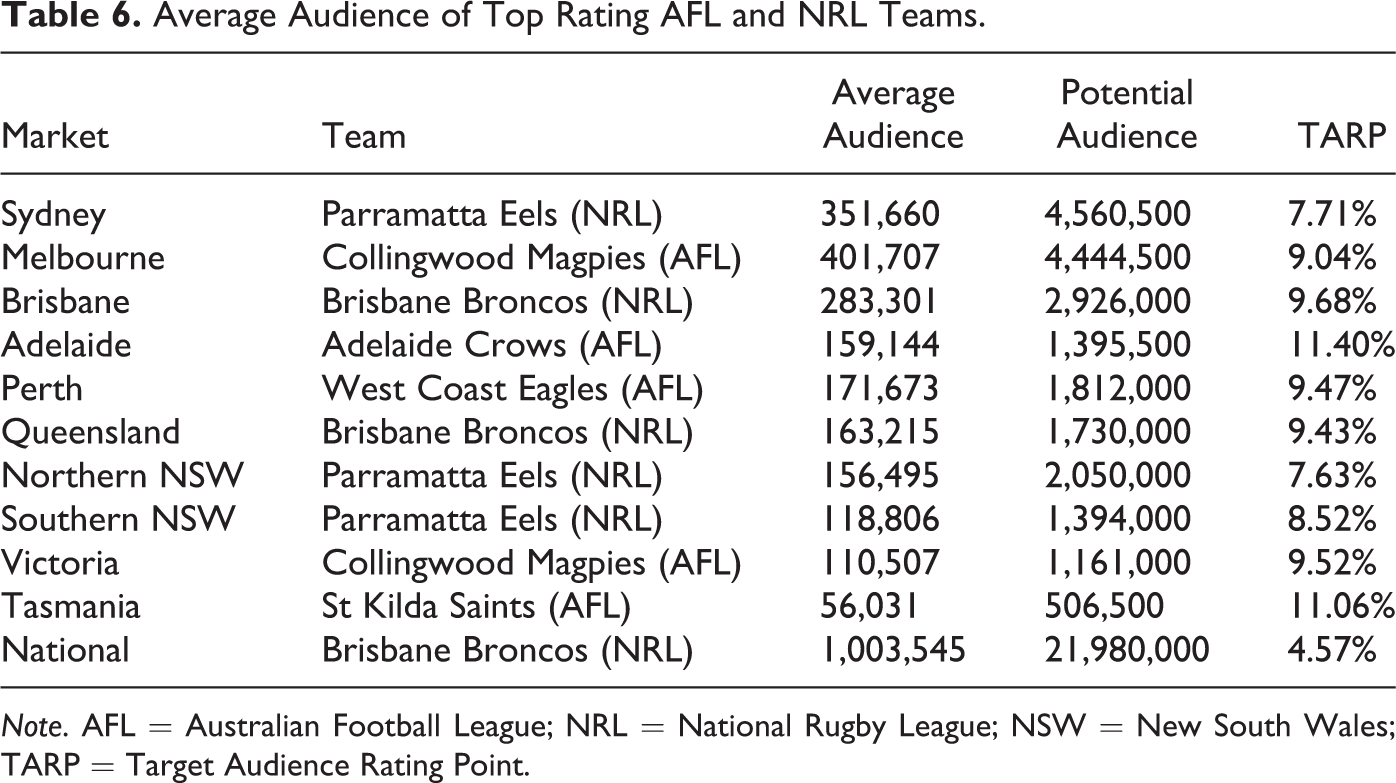
While clubs and the media sporadically criticise the machinations by which matches are selected for broadcast, one cannot begrudge media companies for acting with self-interest within the bounds of their contractual obligations. As noted by Miller (2010, p. 2), “audiences are the opium of television” and the function of broadcasting is to generate advertising revenue, which is best achieved through maximizing audiences. For advertising-supported programs on FTA television, Noll (2007) has stated that revenue is determined “by the size of the audience and its distribution across demographic categories” (2007, p. 404). Furthermore, a number of recent broadcast demand studies refer to the importance of understanding broadcast demand due not only to its growing contribution to league revenues but also to the incidence of unprofitable sports rights’ acquisitions for rights holders (Solberg, 2006). As such, audiences in specific local markets were tested to compare the performance of local teams as compared to nonlocal teams. Unsurprisingly, viewership patterns within each region remained largely loyal to “hometown” teams, staying true to regional boundaries. As outlined in Table 6, in all broadcast markets (excluding Tasmania, which has no “home” AFL or NRL team) the highest rating club was a “home team” to the local market and, unsurprisingly, was from the “heartland” sport of the region. The AFL club, the Collingwood Magpies, recorded the largest average audience in any single market, the only team in either code to average over 400,000 viewers in a single market, while the NRL club, the Brisbane Broncos, was the only club to record an average audience of over 1 million viewers when combining average viewership of each region.
Average Audience of Top Rating AFL and NRL Teams.
Note. AFL = Australian Football League; NRL = National Rugby League; NSW = New South Wales; TARP = Target Audience Rating Point.
Of note within Table 6 is a lack of viewership interest for several NRL teams within their home markets, resulting in the Parramatta Eels recording the highest average audience across all the three NSW broadcast markets. The NRL club, the Newcastle Knights, the sole NSW-based team located north of Sydney’s Northern peninsula, recorded an average audience of only 4% above the league average in Northern NSW, a broadcast market made up of only three subregions of which Newcastle is one (along with Northern Rivers and Tamworth/Taree). The Knight’s average audience of 145,930 placed it seventh behind six Sydney-based clubs. Similarly, the Canberra Raiders recorded a disappointing broadcast average in their home broadcast market of Southern NSW, which is made up of the subregions Canberra (including the towns of Orange, Dubbo, and Wagga) and Wollongong, despite being only one of the two teams to be located within the region (along with the St. George Illawarra Dragons). The Raiders were the only team located outside of Sydney and Melbourne to record a home market broadcast viewership below the league-wide average. Their average viewership of 105,126 in the Southern NSW broadcast market was 3.4% smaller than the league-wide average of 108,851, placing the club 10th within the league and behind all except one Sydney-based club.
Such is the strength of the Adelaide Crows in their local market that they recorded the largest home market average audience relative to population. This translated to an average of 11.40% of the Adelaide population viewing Adelaide Crows games per telecast. However, interest for local teams in the Adelaide market did not translate to fellow rival club, the Port Adelaide Power. There was a distinct gap between the two clubs in both attendance and television viewership, suggesting that Port Adelaide’s presence in the market was not particularly strong. In the Adelaide broadcast market, the Crows recorded an average television viewership of 159,144 compared to the Power’s 131,767, representing audiences of 33.04% and 10.15% above the league-wide average viewership, respectively. The Adelaide Crows also recorded a significantly higher crowd attendance during seasons 2007–2011, averaging 38,446 attendees per game, compared with Port Adelaide’s average of 24,157. This disparity of 59% was despite AFL scheduling their home games on alternating weekends, ensuring that the Adelaide market had the opportunity to attend a game every weekend of the regular season.
Comparison of team performance from a ratings perspective must be treated with caution. External factors such as broadcast time, day and medium have the ability to influence ratings over and above the influence of specific team involvement. Therefore, comparisons between teams must be done in as similar conditions as possible. Comparison of AFL teams in the Melbourne market was performed specifically among Melbourne teams within the Friday night time slot. The time slot was chosen due to the dominance of participation of Melbourne teams within this time slot as well as the overall size and telecast consistency of the slot. Melbourne teams represented 82% (182 of 222) of participants within the Friday night time slot that occurred 111 times across the regular season between 2007 and 2011.
A one-way ANOVA confirmed the existence of a statistically significant difference in the mean television rating between groups within the Friday night broadcast time slot, F = 3.653(9, 172), p = .000, ω2 = 0.3405. Gabriel’s post hoc tests determined a statistically significant mean difference (MD) in ratings to occur between the pairs of Collingwood Magpies and the Western Bulldogs (MD = 72,849, p = .008), St Kilda Saints (MD = 62,270, p = .022), and North Melbourne Kangaroos (MD = 87,487, p = .042). Perhaps in testament to the match selection strategy of the host broadcaster, the Collingwood Magpies recorded the highest rate of coverage (n = 28) and also generated the highest mean audience (M = 482,020, 95% CI [455,348, 508,691]). In contrast, the North Melbourne Kangaroos received the least coverage in the prime-time Friday night slot (n = 7) and also recorded the lowest mean audience (M = 394,533, 95% CI [342,230, 446,836]). A Pearson correlation comparing total coverage provided and average Melbourne television rating recorded in the Friday night time slot returned a correlation coefficient of .624, which just slightly did not attain statistical significance at the 5% level (p = .054). However, the nonparametric Spearman’s correlation utilising rank order returned a statistically significant (p = .046) correlation coefficient of .640. While the study has largely confirmed that there seems to be uneven broadcast coverage between clubs, confirmation that variance exists in the ratings “power” of individual clubs can be considered a mitigating factor against the complaints surrounding coverage distribution made by Melbourne AFL clubs in the Turner and Shilbury’s (2005) study.
A one-way ANOVA was also used to test broadcast ratings’ performance in the Sydney market. Analysis of the Sydney broadcast market specifically focused on the performance of Sydney NRL clubs within the Sunday afternoon FTA time slot. This time slot was selected, as it was the more statistical robust time slot. This was due to the larger sample of appearances (Sunday mean = 20.44 vs. Friday night mean = 14.33), smaller range in coverage (16 vs. 21), and more even dispersion of coverage within this time slot (median appearances = 21 vs. Friday night median = 14). Further, all Sunday broadcasts were telecast in the exact same manner (on a 1-hr delay, broadcast from 4 p.m. to 6 p.m. into the Sydney market) across the tracking period, whereas there was further variability in the Friday night time slot due to the distinction in live and delayed telecasts.
The analysis determined there to be no statistically significant difference in the average television rating recorded among each of the nine Sydney-based NRL clubs within the Sunday afternoon FTA time slot at the 5% significance level, F = 1.368(8, 175), p = .213, ω2 = 0.1255. Correspondingly, Gabriel’s post hoc tests showed no significant differences between any individual pairing of clubs. Despite their neighbouring proximity, the St. George-Illawarra Dragons recorded the highest mean audience (M = 311,190, 95% CI [283,416, 338,963]), while the Cronulla Sharks recorded the lowest mean audience (M = 268,654, 95% CI [248,628, 288,662]). Despite a lack of statistical significance, the difference in ratings between Sydney teams appears to have had a practical impact in terms of the selection preferences of the host broadcaster. For instance, while the Cronulla Sharks recorded an average viewership of only 9.8% below the group average in the time slot (297, 829), they received 50% less coverage in the time slot compared to the group mean. A Pearson correlation between team rank of total telecasts broadcast and rank of average rating returned a statistically significant result (p = .017) and strong correlation (.761).
Broadcast Coverage by Grouping
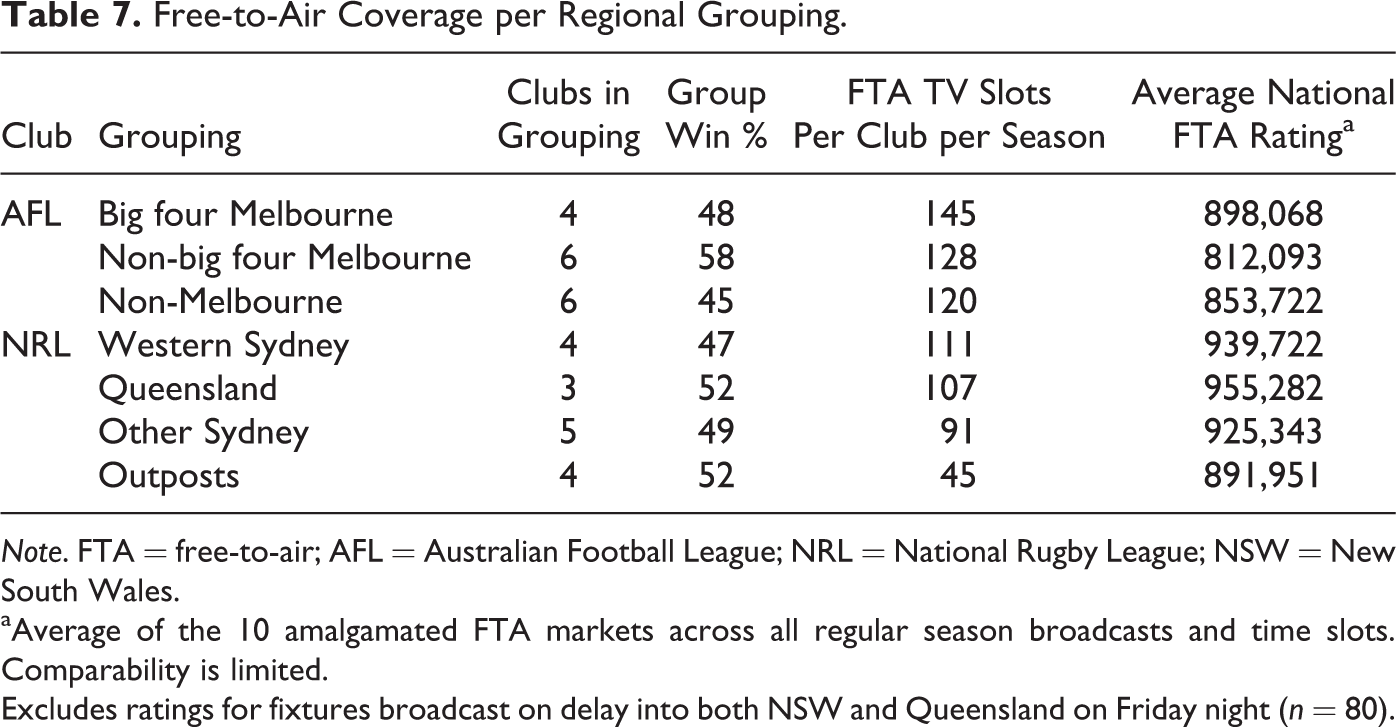
Differences in broadcast exposure occurred between distinct subsets within each competition (see Table 7). Despite holding the lowest collective win ratio (46.84%), the four Western Sydney NRL clubs held the highest average level of FTA broadcast, Parramatta, Canterbury, Penrith, and Wests receiving an average of 11.1 nationally telecasted matches each per season. In contrast, the four “outpost” NRL clubs, Melbourne, Canberra, New Zealand, and Newcastle, recorded the near highest collective win–loss ratio (52.06%), yet received the lowest level of FTA coverage among the groups, each averaging only 4.5 nationally broadcast matches per season. Comparison of the average national FTA audiences generated by each grouping illustrates that the degree of variance in FTA coverage is not matched by variances in the corresponding FTA ratings generated. This is particularly pertinent in delineating clubs within Sydney. Western Sydney clubs recorded a collective average audience that was 1.6% greater than their non-Western Sydney counterparts yet received 22% more broadcast coverage during the period.
Free-to-Air Coverage per Regional Grouping.
Note. FTA = free-to-air; AFL = Australian Football League; NRL = National Rugby League; NSW = New South Wales.
aAverage of the 10 amalgamated FTA markets across all regular season broadcasts and time slots. Comparability is limited. Excludes ratings for fixtures broadcast on delay into both NSW and Queensland on Friday night (n = 80).
Similar groupings were also tested within the AFL competition. AFL subgroups were created that included the “big four” Melbourne clubs (Carlton, Collingwood, Essendon, and Hawthorn) as distinct from the remaining Melbourne clubs and the interstate-based clubs as defined by Jakee et al. (2010). The “big four” Melbourne AFL clubs recorded the highest mean exposure rate (145 slots per club per season) as compared to “Other Victorian” clubs (128) and “Non-Victorian” clubs (120). The superior coverage rate of the big four Melbourne clubs was despite a period of modest success for the included teams, which resulted in the group holding a group win rate of 48%. In contrast, the tracking period constituted a time of considerable success among non-big four Victorian clubs, reflected in a 58% group win percentage, which did not translate into a dominant share of coverage. While the big four Melbourne clubs appeared to generate significantly stronger average FTA audiences (898,068), comparison of these ratings is limited due to the variability of time slots in which AFL was broadcast and the uneven distribution of these slots between clubs. However, as espoused by Turner and Shilbury (2005), the notion that “core clubs,” being Sydney NRL and Melbourne AFL clubs, receive favourable broadcast treatment and that the audience, rather than performance, was the key driver behind broadcaster match selections was supported by the broadcast ratings data.
Strategic Implications
The considerable broadcast inequality within the AFL and NRL appears to be at odds with each league’s central strategic tenets and their outwardly egalitarian rhetoric. Behind its rational in applying player salary restraints, the National Rugby League (2014) claims that, “If a few clubs are able to spend unlimited funds it will reduce the attraction of games to fans, sponsors and media partners due to an uneven competition”(p. 1). Along these lines of evenness, the AFL’s 2013 Annual Report (2014, p. 42) stated that, “The AFL has sought to develop as consistent and equitable schedule of matches as possible which, in concert with the AFL’s Strategic Plan, assists in growing the game, increases interest in the sport, connects with the community and continues to build the financial stability of the AFL competition.” Underpinning this approach are two principles, the first of which is to “develop, as close as is possible, a fixture which gives all clubs equal opportunities” and the second of which is “to maximise viewing audiences across our television broadcast partners and to ensure maximum exposure of the game nationally” (AFL, 2014, p. 42).
As previously observed by research of Jakee et al. (2010) on the AFL and extended by this study, to include both the AFL and the NRL, the findings demonstrate these two guiding principles seem fundamentally incongruent. Clubs within the AFL and NRL have been shown to hold varied television ratings “pulling power,” a consideration which is largely reflected in the preferences FTA broadcasters have exhibited in their match selections. Given their central objective to maximise ratings, broadcasters appear aware that specific clubs outperform others, resulting in a select few clubs receiving vastly superior coverage at the expense of others. Given such clubs as Collingwood (AFL) and Brisbane (NRL) receive approximately twice the coverage of other teams in their leagues, in time slots that also assist in increasing attendances and corporate support, it is evident that clubs do not receive equal opportunities in either league.
While both the AFL and NRL impose salary caps and distribute broadcast revenue equally (among other measures) in an attempt to ensure all clubs remain competitively balanced, it is evident that strategic challenges remain around equalising clubs off the field. This research posits that unequal exposure is a contributing factor to the disproportional generation of club revenue. A view supported by Turner (2012, p.57), “broadcaster influence over scheduling was seen to have a direct bearing on club audience, membership and sponsorship outcomes. This situation creates a clear sense of injustice to the clubs when addressing issues surrounding sport broadcasting.” Expanding on Turner’s sentiment, broadcaster influence by extension has the potential to impact overall competitive balance. Analysis of club financial reports illustrated there to be significant variance in the level of spending by football departments across each league. Indeed, in recent times, the AFL has begun investigating the implementation of a luxury tax system imposed on club profits and football spending to address such issues around inequality. Such a tax would be a first of its kind in the Australian sports context. While the NRL have yet to give any public indication surrounding similar initiatives, given the league is by far the more disproportional in its distribution of coverage, the league no doubt will closely observe the progress of its counterpart as well as considering international exemplars.
Conclusion
With an average annual viewership of 15 million viewers per season, it is clear that exposure through television broadcast not only is a central platform to engage with fans but also provides a critical incentive to attract potential sponsors to both AFL and NRL clubs. It is therefore with no great surprise that the allocation of television coverage is a topic of not only management discussion and posturing but also media conjecture and public discourse.
This study has extended the qualitative research of Turner and Shilbury (2005) through the measurement and analysis of AFL and NRL television ratings across the years 2007–2011. The research has also significantly extended the work of Jakee et al. (2010) by examining not only the AFL but also the NRL and by utilising a much larger and complete set of broadcast data. As a result of the quantitative analysis, the study examined the intraclub variance of broadcast exposure and found statistically significant discrepancies in the level of coverage afforded to individual AFL and NRL clubs. Notably, the research found little correlation between performance and exposure and instead determined there to be distinct groupings of clubs that received particularly favourable and unfavourable treatment. Analysis of specific time slots also discovered a statistically significant difference in team broadcast performance within the Melbourne AFL market while no such significance was observed within Sydney for NRL fixtures. Irrespective of statistical significance, however, in both leagues there appeared to be correlations between ratings’ performance and coverage received.
The study also confirmed a number of other important outcomes. The analysis demonstrated that Australian broadcast audiences (not unexpectedly) prefer watching their local home teams, although there were several notable exceptions. Additionally, the importance of FTA broadcasts was confirmed, with audiences 4 to 5 times the size of subscription television audiences. Finally, the enhanced exposure generated through reaching play-off matches was validated, with several clubs generating a significant proportion of their cumulative audiences through finals appearances.
Footnotes
Declaration of Conflicting Interests
The author(s) declared no potential conflicts of interest with respect to the research, authorship, and/or publication of this article.
Funding
The author(s) received no financial support for the research, authorship, and/or publication of this article.