
Abstract
Evolving media landscapes toward increasingly diverse and competitive environments in both traditional and new media requires producers regularly examine the quality of their productions. One growing line of research identifies the increasing presence and significance of statistics in sports media programming. This experiment measures the effect of statistics on enjoyment and perceived credibility by sport consumers while considering level of fanship, media source, and variations in placement within Instagram posts. Results uncover evidence that validates previous observations about statistics in media while contradicting others. Specifically, findings reveal that statistics enhance enjoyment and improve perceived credibility. Observations were consistent across fanship level. However, additional findings also suggest media source and placement of statistics influences both enjoyment and credibility as well. For both dependent variables, statistics in both the Instagram caption and image yielded significantly greater enjoyment and credibility than some other conditions including posts without statistics at all. The impact of these and other findings on sports media industry and scholarship, along with limitations and directions for future research, are discussed.
Sports media today offers consumers a variety of platforms to consume live events, analysis, talk shows, and documentaries while engaging with this material alongside other fans (Hwang & Lim, 2015) to access game-related information (Larkin & Fink, 2016; Winter et al., 2018) and even to connect with other athletes in social media (King, 2015; Smith & Sanderson, 2015). While ample research has examined variations in motivations of fans and their online interactions in these spheres (e.g., Hwang & Lim, 2015; Winter, et al., 2018), relatively little is known of the effects of common production elements utilized in these popular, growing arenas (Constine, 2018) and this at a time when traditional broadcast viewership continues to decline (Deitsch, 2018).
Though the ever-increasing diversity of content produced can be difficult to effectively analyze, one fruitful line of scholarly inquiry has explored statistics as a prevalent storytelling tool in sports media. Despite their rise in sports broadcasting (Hahn et al., 2018) and apparent likability in new media (Hahn, 2019), little is known about why some sports consumers care about these statistics. Given the importance of perceived credibility for media sources (e.g., Hovland & Weiss, 1951; Keene & Cummins, 2009), it stands to reason that such statistics may increase perceptions of objectivity or expertise in sports broadcasts. While some eye-tracking studies have explored on-screen placement issues in sports media (e.g., Cummins et al., 2016), little is known about effects of variations in placement of information in social media for sports.
In addition to potential impacts on credibility due to the presence and placement of statistics, sports consumers themselves may find such information gratifies needs for fantasy sports use (Farquhar & Meeds, 2007; Wohn et al., 2017), gambling (Woltman, 2014), or to tout their level of knowledge as a sports fan (Hahn & Cummins, 2018). In other words, statistics may serve both the producer and the consumer. Such statistics that offer contextual information in the form of rankings, percentages, comparisons, scores, or otherwise may therefore increase enjoyment for the fan and credibility attributed to the source. Still, given the scholarly attention to sports fanship, it is clear that variations exist in this audience, primarily in level of interest (e.g., Gantz & Wenner, 1995; Wann, 2002). It is therefore necessary to investigate how or if perceived credibility and consumer enjoyment may vary by such levels of sport fanship.
Therefore, the purpose of this study is to address these nascent research gaps in sports media research by following Hahn’s (2019) content analysis with an experiment to determine the effects of this common communication form in sports media, statistics, on consumer enjoyment and perceived credibility while accounting for level of fanship and placement of this information. This study deepens our understanding of this ubiquitous communication form in an increasingly popular platform with implications for media scholars and producers alike.
Literature Review
Sports media scholarship has begun to investigate the phenomenon of salient and rising presence of statistics in sports media (e.g., Hahn et al., 2018). Though this common communication form has been explored and considered elsewhere (e.g., Brosius & Bathelt, 1994; Koetsenruijter, 2011), its unique role and impact in sports media is underexplored. Research suggests two productive ways to begin to examine this phenomenon include examining the role these statistics have on fan enjoyment and perceived credibility.
Enjoyment of Sports Media
Hahn’s (2019) content analysis recognizes a clear association with the presence of statistics and the likability of posts suggesting a potential causal connection. Yet, while an empirical association was demonstrated along with the temporal priority of the independent variable (likes of posts came after content was produced), there was still no way to ensure the nonspurious nature of the relationship, a necessary component to identify these numbers as the cause of the superior likability of the posts (Chambliss & Schutt, 2019).
Yet recent research which demonstrated fans with greater interest exhibited greater cognitive processing by way of selective attention to information graphics in broadcasts (Cummins, et al., 2016), may provide a firmer foundation for accepting a causal relationship. Additionally, some sports consumers may find increasing knowledge (Hahn & Cummins, 2018) enhances their fan identity or may encourage material for conversational fodder with other fans (Melnick, 1993). More pragmatic aims exist too in fantasy sport participation (Farquhar & Meeds, 2007) and gambling (Gantz & Wenner, 1995; Wann, 1995; Wann et al., 1999). In summary, it is yet to be demonstrated that statistics has an effect on sport consumers such that they like or enjoy the content more than when it is absent such information and whether level of fanship (below) varies this effect. Yet enjoyment is but one worthwhile framework for considering effect of statistics in sports media.
Credibility and Source in Sports Media
Statistics in media may serve another purpose according to van Dijk (1981). These numerals are often used as “signals of precision and hence of truthfulness” (p. 88; van Dijk, 1988), suggesting they serve as a rhetorical act as well. If statistics suggest greater precision and truthfulness in news media, it is reasonable that figures in sports contexts may well increase credibility through increases in trustworthiness and expertise, leading factors of credibility (Benoy, 1982; Davis & Krawczyk, 2010; Hong, 2006; Hovland et al., 1953; Patzer, 1983; Schlenker, 1980). Therefore their increased presence in sports media (Hahn et al., 2018) may be due to the simultaneous benefits to producers as source and fans as consumers.
Examination of source credibility has its roots as far back as antiquity (Benoit, 1984) and has in past decades received ample attention in media scholarship uncovering its dimensions in an effort to shed light on the positive effects of credibility (Hong, 2006; Hovland & Weiss, 1951; Hovland, et al., 1953; Infante et al., 1980; Miller, 1970; O’Keefe, 2002; Schlenker, 1980). Increased credibility can lead to greater viewership and loyalty (Hahn & Cummins, 2014). Despite the important nature of objectivity in journalism historically, some have questioned its presence in news media (Ryan, 2009) which may lead to declining perceptions of credibility. Therefore sports media sources offering more objective and credible information through such communication forms as statistics may ultimately benefit this source. In news media, Koetsenruijter (2011) demonstrated that articles with numbers were perceived to be more credible than those without such information, and sports media studies have repeatedly demonstrated the critical role credibility plays in consumption even affecting enjoyment (e.g., Keene & Cummins, 2009). Indeed, consumers appear more likely to associate messages with numbers with expertise than those messages without this data (Artz & Tybout, 1999). Similarly, Brosius and Bathelt (1994) suggested that contextualizing statistics were considered more “valid” as a communication form, an indication of a possible link to increased credibility. More recent research has observed these statistics coming in various presentation forms in traditional sports broadcasts (Hahn et al., 2018) and with differing placement in social media (Hahn, 2019).
Placement of information in social media for sport
While sports broadcast producers have been increasing statistics in America’s most profitable mediated sport (Hahn et al., 2018), their salience appears to persist in new media within college athletics (Hahn, 2019). However, though Hahn (2019) recognized that statistics appeared in more than 70% of posts and that these numbers appeared most often in on-screen visuals, the study could not determine the impact such placement (on-screen, in captions, or both) had on likability of the posts.
When examining the effect of statistics on sports consumers, a necessary step is not to just consider the presence of such communication forms but their placement within evolving media. Analyses of traditional broadcasts have examined a number of structural components, and eye-tracking has examined placement on-screen. More recently, Hahn (2019) measured the empirical effect of placement of these statistics in new media recognizing that statistics appear in various places within social media posts. Indeed statistics placed in the image were most liked while those placed in the description were least liked. In other words, while on-screen placement of information data graphics (e.g., Cummins, et al., 2016) and presentation type (aural and visual; Hahn, et al., 2018) have been tested and observed in multiple locations (Hahn, 2019), effects of such presentation variations through experimentation is yet unknown.
To test this association for a causal link, research questions are needed to query this relatively new observation. Since Hahn (2019) used content analysis to determine placement and source variations, and previous research has demonstrated the role of statistics in increasing credibility in news, the next step is to query the effect source and placement have together on perceived credibility in sports media.
Variations in Sports Consumers
The term “fan,” broadly applied, references a large and diverse audience. While research has demonstrated the positive response (or “likes”) of statistics in social media (Hahn, 2019), these results may be inconsistent for different viewers. For example, scholars have identified that fans with greater interest in the mediated sport are more affectively involved during the event and are more likely to seek out information before and after its conclusion (Gantz & Wenner, 1995; Gantz et al., 2006). Whether to increase knowledge as a measure of their fanship (Hahn & Cummins, 2018), for conversational fodder (Melnick, 1993), for fantasy sports use (Farquhar & Meeds, 2007), or to inform gambling decisions (Gantz & Wenner, 1995; Wann, 1995; Wann, et al., 1999), such sports consumers appear to have a greater cognitive and behavioral motivation for statistical information compared to other audiences.
Sports media scholars have been wielding uses and gratifications (Katz et al., 1974) to help identify motivations of information seeking, surveillance, and knowledge in addition to entertainment and social interaction in new media environments (Billings et al., 2017; Frederick et al., 2012; Gantz, 1981; Gantz & Wenner, 1995; Sheldon & Bryant, 2016; Spinda & Puckette, 2018; Wenner & Gantz, 1998). These motivations have likely been exacerbated with consumption motivations for fantasy sports users (Farquhar & Meeds, 2007) and for those participating in increasingly legalized sports gambling (Woltman, 2014) whose domain-specific interest may impact their perceptions (Hahn & Cummins, 2020). This may be particularly true as sports fans in social media often use the platform for social identity and self-esteem maintenance functions (Wang, 2013). Therefore, it stands to reason that, with so much at stake, sports consumers in social media may be motivated to consume this type of information in a unique way by comparison to audiences in other genres.
Hypotheses and Research Questions
Based on the above research indications regarding statistics in sports media and their potential effects on enjoyment and credibility for various sports audiences, the following hypotheses and research questions are proffered.
Enjoyment of statistics in sports Instagram posts
The first set of hypotheses and research question seek to uncover the effect statistics has on enjoyment of sports Instagram posts. H1: The presence of statistics in sports Instagram posts increases enjoyment. H2: Sports fans will enjoy sports Instagram posts with statistics more than nonfans. RQ1: Does placement of statistics in sports media impact enjoyment?
Credibility of statistics in sports Instagram posts
The next several hypotheses and research questions seek to identify the effect statistics in sports Instagram posts has on perceived credibility. H3: The presence of statistics in sports Instagram posts increases perceived credibility. H4: Perceived credibility of sports Instagram posts with statistics will be greater for sports fans than nonfans. RQ2: Does placement of statistics in sports Instagram posts impact credibility? RQ3a: Do sports Instagram posts’ source impact perceived credibility? RQ3b: Do sports Instagram posts’ source and presence of statistics together impact perceived credibility?
Method
Design
To address these hypotheses and research questions, an experiment was conducted examining the effects of statistics in Instagram posts from a major sporting event. The study utilized a 4 (statistics placement: no statistics, statistics in caption, statistics in image, or statistics in both caption and image; within-subjects) ×4 (source: ESPN, Fox Sports, CBS Sports, NBC Sports; between-subjects) × 2 (level of fanship: high or low; between-subjects) mixed factorial design while measuring their subsequent impact on enjoyment and credibility. Participants from a Power Five conference school were recruited under the guise of understanding sports fan responses to information in social media posts. A sample of 168 participants viewed four Instagram posts from the 2018 NCAA basketball tournament. Each participant was randomly assigned to a condition where they viewed posts from a single source while responding to questionnaire items for each post that varied presence and placement of statistics. Thus, there are four versions (each source) of each type of statistical placement (no statistics, statistics in caption, statistics in image, and statistics in both) viewed across all subjects which further minimizes the risk that findings could be the result of a different or confounding variable within a single post. Participants were later categorized via a median split (e.g., Gaylon & Wann, 2012) as sports fans or nonfans (high or low fanship respectively, see Independent Variables).
Stimuli
For ecological validity, the stimuli in this study utilized Instagram posts from the 2018 NCAA tournament. Posts were chosen through random selection of the population of Instagram posts during the NCAA tournament from the four sources used in this study. Posts were not included if they included videos or slides or were sponsored. The comments, likes, and date stamp were removed leaving the source name and logo, the image, the caption, a hyperlink to “Follow” the page, and the blank comment box [see Appendix]. No randomly selected posts included visual or written reference to the institution where the investigation was being conducted, minimizing potential team-specific bias rather than the broader sport fanship focus in this experiment.
Independent Variables
The use of numbers for purposes of context or precision may be helpful in nearly innumerable ways. As a yet early investigation into statistics in sports media, the broader operationalization is used to include any data containing simple calculations, and includes such examples as frequencies in appearances in title games or championships, rankings that demonstrate a Cinderella story, season record, years of a previous achievement, streaks of wins, and common player metrics including points, rebounds, and assists, all used to articulate an intended narrative similar to Hahn et al.’s (2018) application of statistics in NFL broadcasts.
Level of fanship was measured using an adaptation of Wann’s (2002) fandom questionnaire prepared for college basketball fans. Five item were used including “My friends see me as a college basketball fan” and “My life would be less enjoyable if I were not allowed to follow college basketball” measured on an 11-point Likert scale from 0 “strongly disagree” to 10 “strongly agree.” To test the validity of this scale, a correlation was conducted against measures assessing mediated college basketball consumption, probing hours per week watching college basketball, watching programs about college basketball, reading about college basketball, and reading about college basketball recruiting. Pearson’s correlation identified a strong, positive correlation between the college basketball fanship and consumption measures, r(166) = .71, p < .001. Having validated the measure, participants were categorized as college basketball fans (high fanship; n = 84) or nonfans (low fanship; n = 84).
To verify this split, a t-test comparing mean sport fanship as a function of group assignment was conducted. Levene’s Test for Equality of Variances unsurprisingly found that equal variances could not be assumed (F = 65.00, p < .001), therefore degrees of freedom were adjusted from 166 to 118.09. A t-test comparing mean sport fanship as a function of group assignment verified the split (t(118.09) = 19.77, p < .001). Those assigned to the lower fanship group had a significantly lower mean fanship score (nonfans; M = 1.34, SD = 1.04) than did those in the higher fanship group (fans; M = 6.61, SD = 2.21). Given the particularly low fanship scores, it is fair to conclude they are indeed not fans of college basketball.
Sources used in this study were four traditional sports broadcasting networks with relatively large Instagram followings. While other sources certainly exist, these four maintain large followings on Instagram with ESPN leading the group with over 16.5 million, while Fox Sports (1.1 million), CBS Sports (712,000) and NBC Sports (274,000) lag behind. It is important to note too that one of these more traditional networks, CBS Sports, produced this tournament.
Presence and placement of statistics was operationalized into one of four conditions: no statistics, statistics in caption, statistics in image, and statistics in both. This order was reversed in half of the conditions to combat potential order effects. In order to try to mitigate any potential order effects, the study systematically varied presentation order through random assignment to conditions. Participants either viewed the posts first with no statistics, then statistics in the caption, then statistics in the image, and then statistics in both the caption and the image, or viewed four posts in reverse order. While an independent samples t-test did not appear to reveal a significant impact of presentation order on perceived credibility of sports Instagram posts (t(166) = .81, p = .41), presentation order did appear to have an impact on enjoyment (t(166) = 2.33, p = .02) such that the second order (M = 6.47, SD = 1.55) was found to be more enjoyable than the first (M = 5.94, SD =1.38). This is addressed further in the Discussion. However, order was not included in further analysis. Lastly, some hypotheses only test the presence (not present, present: combining data from the three placements) and others test the placement (not at all, in the caption, in the image, or in both) when desired, as guided by the hypothesis or research question. So, RQ1 and RQ2 measure placement specifically, while all others measure presence broadly.
Dependent Variables
Enjoyment of mediated sport was assessed through an 11-point Likert scale rating agreement from 0 “not at all” to 10 “absolutely” to three items including “I like the content of the Instagram post I just viewed,” “I enjoy the content of the Instagram post I just viewed,” and “I appreciate the content of the Instagram post I just viewed.” Cronbach’s α yielded high reliability, α = .97 (M = 6.20, SD = 1.48).
Credibility was operationalized through ten items from Ohanian’s (1990) scale that utilize two relevant factors of trustworthiness and expertise with five items each. These items were joined to create a single dimension in Hahn and Cummin’s (2014) sports reporter credibility study utilizing this same scale. The measurement in this study utilizes an 11-point Likert scale from 0 “not at all” to 10 “very much” for each of the 10 items that describe the source of the post as “experienced,” “sincere,” “skilled,” “dependable,” “knowledgeable,” “honest,” “expert,” “qualified,” “reliable,” and “trustworthy,” all positively worded. Cronbach’s α for the entire measure again yielded very high reliability, α = .96 (M = 6.68, SD = 1.18).
Procedure
Following approval from the university’s Institutional Review Board, the study was created and distributed using the Qualtrics online questionnaire software, increasing ecological validity as participants could engage the stimuli on mobile devices similar to how they might view Instagram posts. Participation lasted about 15 minutes. After reading the informed consent page and agreeing to participate, individuals were randomly assigned via Qualtrics’ system to one of eight conditions, 2 (order) × 4 (source). Therefore each participant saw a total of four posts (each different statistical presentation placement) from a single source (ESPN, Fox Sports, CBS Sports, or NBC Sports) in one of the two orders. Participants initially responded to demographic questions before reading brief instructions asking the participants to view an Instagram post carefully to be followed by a series of related questions. After each statistics condition (no statistics, statistics in caption, statistics in image, or statistics in both), participants responded to three enjoyment items and ten credibility items. Following these four within-subjects conditions, participants would respond to a manipulation check requiring them to identify the sport played in the posts. The questionnaire concluded after final items about college basketball consumption and motivations.
Participants
As this study centers on collegiate athletics in social media, participants in the study were recruited from a Power Five university. However, to reduce the chance team identification played a part in such responses, data was collected from an institution that was athletically competitive but not in this tournament. Incentive for participation was offered in form of class credit or random drawing for an Amazon gift card. Initially, 186 responses were collected. However, 16 did not complete any portion of the experiment and opted not to consent to participation. One participant dropped out during the study, having missed a significant portion, and another failed the manipulation check. Both of these were dropped from study analysis leaving 168 mostly completed questionnaires. The participants’ mean age was 20.63. Most participants were college sophomores (n = 67, 39.9%) and identified as female (n = 92, 54.8%). The vast majority of participants identified as Caucasian (n = 141, 83.9%), followed by Hispanic (n = 14, 8.3%), African American (n = 6, 3.6%), Asian (n = 4, 2.4%), and those who identified as another ethnicity (n = 3, 1.8%).
Results
Enjoyment of Statistics in Sports Instagram Posts
H1 predicted that the presence of statistics in sports Instagram posts increases enjoyment. Because data were collected for one condition without statistics and three with statistics, the scores for the three statistics conditions were averaged before a paired samples t-test was conducted. The test revealed a significant difference, t(167) = 2.38, p = .018, such that Instagram posts with statistics (M = 6.32, SD = 1.68) were more enjoyable than Instagram posts without statistics (M = 5.83, SD = 2.41). Therefore, H1 was supported (see Figure 1).
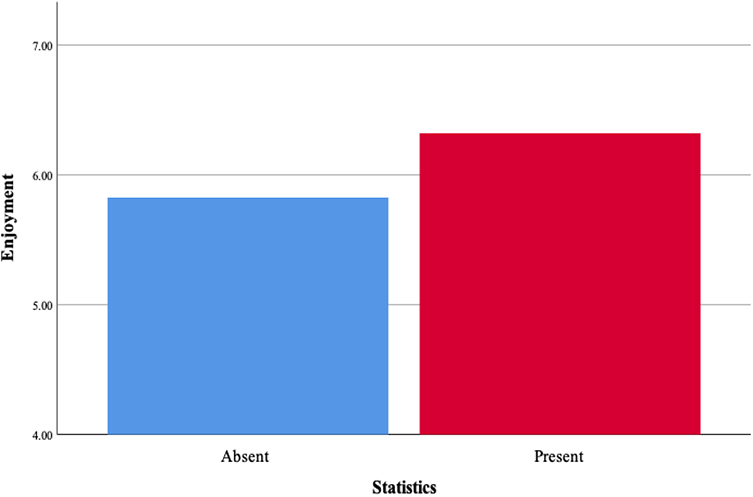
Enjoyment of statistics in Instagram posts.
H2 predicted sports fans will enjoy sports Instagram posts with statistics more than sports nonfans. Because statistical presence was within-subjects and level of fanship was between-subjects, a mixed measures, two-way ANOVA was conducted yielding no significant difference on enjoyment between sports fans and nonfans, F(1, 166) = .18, p = .672,
RQ1 queried whether the placement of statistics in sports Instagram posts impacts enjoyment. In order to test this research question, a repeated measures, one-way ANOVA was executed. Mauchly’s Test of Sphericity indicated the assumption of sphericity had been violated (χ2(5) = 96.39, p < .001), therefore Greenhouse-Geisser’s correction was used. Results indicated a significant difference in enjoyment due to placement of statistics, F(2.14, 356.73) = 3.76, p = .032,
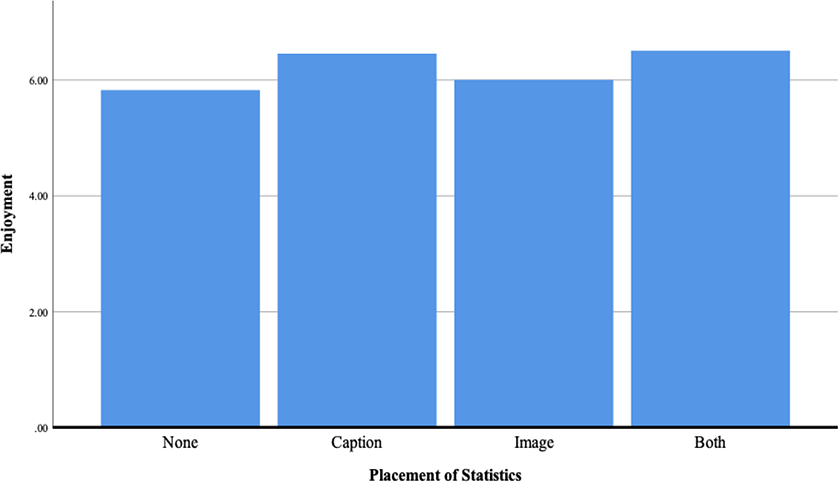
Enjoyment of statistics by placement in Instagram posts.
Credibility of Statistics in Sports Instagram Posts
H3 predicted the presence of statistics in sports Instagram posts would increase perceived credibility. As with H1, the scores for the three statistical conditions were averaged before a paired samples t-test was conducted. The test revealed a significant difference, t(167) = 3.875, p < .001, such that posts with statistics were significantly more credible (M = 6.86, SD = 1.38) than posts without statistics (M = 6.07, SD = 2.21). Therefore, H3 was supported (see Figure 3).
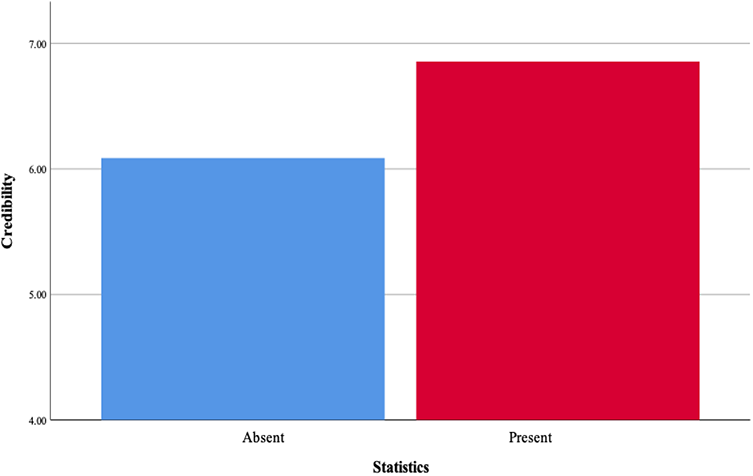
Credibility of statistics in Instagram posts.
H4 predicted that credibility of sports Instagram posts with statistics would be greater for sports fans than nonfans. A mixed measures, two-way ANOVA was performed revealing no significant difference in perceived credibility of statistics by level of fanship, F(1, 166) = .025, p = .874,
RQ2 probed the effect of statistics placement on credibility. A one-way, repeated measures ANOVA was conducted. Mauchly’s Test of Sphericity indicated the assumption of sphericity had been violated (χ2(5) = 81.24, p < .001), therefore Greenhouse-Geisser’s correction was used. The results indicated a significant difference on credibility by placement of statistics, F(2.23, 372.03) = 13.182, p < .001,
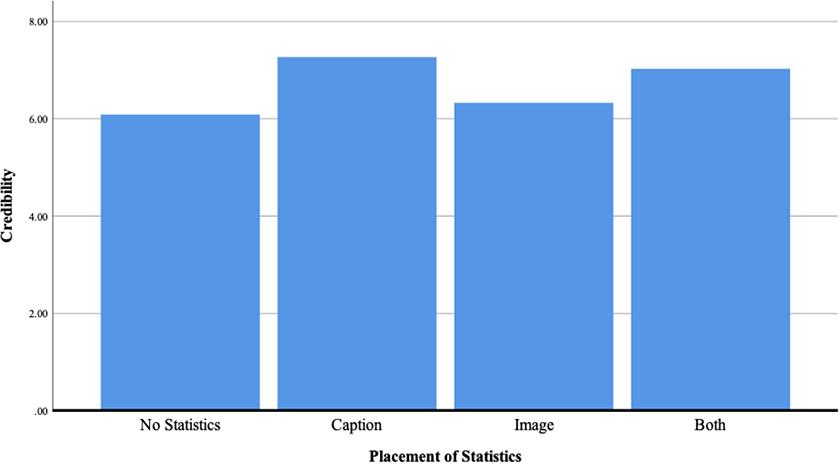
Credibility of statistics by placement in Instagram posts.
RQ3a questioned whether sports Instagram posts’ source impacts perceived credibility. To answer this question, a one-way, between-subjects ANOVA was consulted. Results indicated sports Instagram posts’ source does significantly impact perceived credibility, F(3, 164) = 3.526, p = .016,
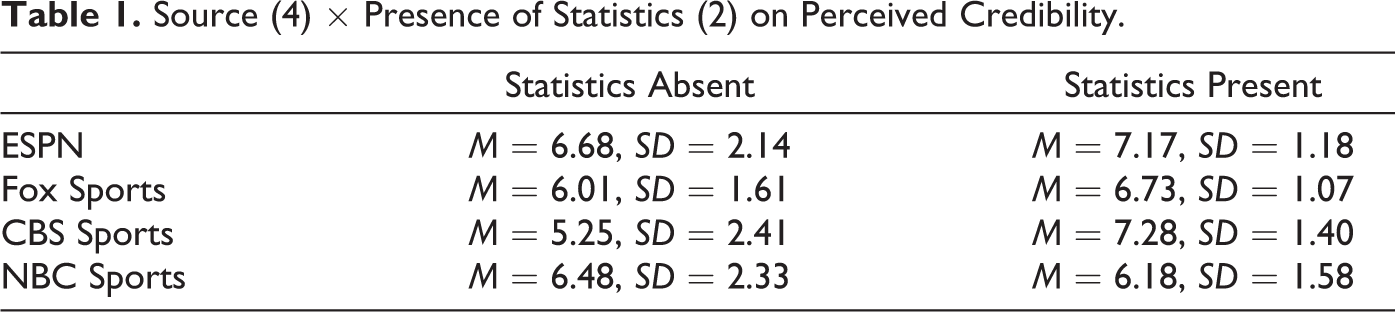
Finally, RQ3b queried whether the source of sports Instagram posts together with presence of statistics affected perceived credibility. Indeed, results of a mixed measures, two-way ANOVA yielded significant interaction effect among some group means, F(3, 164) = 6.719, p < .001,
Source (4) × Presence of Statistics (2) on Perceived Credibility.
Discussion
As has been clearly identified, sports statistics are rising in traditional broadcasting (Hahn, et al., 2018) and are salient in new media for sports (Hahn, 2019) with variations in both form (aural/visual) and placement (image/caption) and source despite having been thought of as pallid by nature (Brosius & Bathelt, 1994). This study tested for a causal link between presence of statistics and rise in enjoyment alluded to in Hahn’s (2019) content analysis. Given Koetsenruijter's (2011) observations that such numbers can increase credibility, this test set out to measure these two claims against additional observations about moderating effects associated with unique fanship, established source, and varying placement within mediated messages.
Effect of Statistics in Sports Instagram Posts
Despite the experiential observations and documented increases of statistics in sports Instagram posts (Hahn et al., 2018), these findings are the first to identify such audience effects as increased enjoyment and enhanced credibility due to this increasingly popular production element. The most likely explanation of this phenomenon is the recognition of the important role knowledge plays in a sports consumer’s experience. Interestingly, this appears to be the case for fans and nonfans alike. In sports, numbers are used to contextualize winners and losers, and these are central to the stories told. Whether time on the clock or score of the game, statistics may more centrally serve the narrative function in these productions in a way that they may not even in news and health communication.
Despite their importance in these latter domains, it is numbers on scoreboards, strokes on the card, runs counted at home plate, and more that have long served as the primary role in their storytelling forms. So while some fans may seek higher-level statistics to serve their needs as fantasy-sports users or gamblers or to tout their greater fanship, nonfans appear to equally enjoy these statistics as a way of understanding and appreciating entertaining and dramatic elements of game play in success and failure of participating players and teams. Knowing statistics increase enjoyment for both fanship groups should encourage rather than discourage the use of more statistics in communicating game play for sports event producers. Further, future research may benefit from further qualifying types of statistics used in broadcasts. It may be that more advanced metrics are reserved for other spaces than these more popular traditional and new media productions, and fans and nonfans may differ in their enjoyment of more complex information.
Extensive research attention has demonstrated the value that increased perceived credibility offers sources. Together with knowing exemplification’s emphasis on the validity of base-rate information, usually statistics, and Koetsenruijter's (2011) more direct observation of their influence on credibility in news, findings here may be less surprising. Fanship measures show that fans and nonfans appreciate equally the relative expertise required to research, prepare, and competently deliver relevant statistics in productions. Consumers appear to cognitively extend this association back to the source to the producer’s benefit. In an increasingly competitive sports media environment, this should further embolden producers to include statistics in productions, particularly when on-screen or in an image/graphic. Clear implications for both scholarship and industry due to the effect of statistics on enjoyment and credibility are offered in the final paragraphs.
Role of Placement of Statistics and Source on Enjoyment and Credibility
The study also investigated the role of placement of statistics on enjoyment and credibility of sports media with and without statistics. While traditional sports broadcasting content analyses (Hahn et al., 2018) observed varying differences in structural components and recent research (Hahn, 2019) has identified aural vs. visual and on-screen vs description comparisons, this study is the first to empirically demonstrate effects of statistics due to placement in sports productions. It may be that consumers appreciated the effort necessary to emphasize and prioritize statistics that are produced and included in on-screen graphics than statistics more easily included in complementary descriptions. This study also utilized popular, traditional sports sources even though the experiment utilized new media, and source differences were revealed. Longstanding experience with these producers likely played a critical role in these assessments, but it was clear that CBS Sports, the primary source for the NCAA coverage, benefitted most when including this type of information. It may be concluded then that expectations exist relating to enjoyment and credibility through storytelling narratives that include statistics to describe the event, not as a component that merely complements highlight media, but that may serve equally alongside them. Therefore, and as was demonstrated, sources particularly weaker in credibility without such elements should consider depending on them more heavily given their observed benefits.
Implications, Limitations, and Future Research
This experiment yields significant implications for sports media researchers and producers today. Scholars should reconsider the way they utilize statistics within productions as more than a contextualizing tool, but one that enhances enjoyment. Findings here cement in yet another domain the role of statistics in enhancing credibility, but investigators should query the effects of various types of quantitative information across individual differences. It may be that statistics used in this study from this ecologically valid sample utilized simpler metrics that were easier to appreciate and enjoy than advanced metrics. Such differences are also important for industry to consider as statistics become more salient in productions.
Practically, sports media producers, especially those in social media, should allow these findings to better inform their practices in these platforms by considering ways in which they can creatively introduce more statistics in on-screen elements. Rather than seen as complementing the exemplars, producers should consider increasing posts where statistics are the primary focus. Practitioners across all sports media will do well to consider how statistics may feed multiple consumer motivations depending on relevant psychographics.
Findings and implications should still be contextualized with the following limitations. First, most observed effect sizes and mean differences are relatively small. So while differences are observed, they may appear miniscule to the casual observer. Still, even small, significant differences can have important benefits when multiplied for large audiences such as these. This is perhaps especially true as group sizes were kept smaller and were less susceptible to overinflation. Although a manipulation check was used and participants eliminated who did not complete the study, future studies should also consider including duration measures for exclusion criteria for similar online experiments. Additionally, as with any experiment, generalizability is limited given the convenience population sampled. While causal effects identified in this population are not anticipated to differ for other groups, repetition in other contexts is necessary to confirm these expectations beyond college-age students.
Future studies should also seek to examine statistical effects with more narrow operationalization of the term by including more complex metrics. It is not altogether unlikely that the lack of significant differences observed between fans and nonfans may be due to the broader scope of data used, even if they were more common and used as ecologically valid in March Madness posts. Further, the next phase of research on the effects of statistics in sports media should investigate the motivations for consumptions by these consumers. While some suggestions are offered (relating to identity, gambling needs, social motivations, fantasy sports, etc.), empirical research would further our understanding of this audience.
Finally, this study identified order effects such that those who saw statistics in both the caption and image found the subsequent conditions more enjoyable than others who viewed these in the opposite order with the statistics absent condition first. Perhaps seeing statistics in both places initially elevated enjoyment that, akin to effects seen in excitation transfer (Zillmann, 1971), imparted residual enjoyment effects for later posts. Being perhaps more attitudinal or emotional than credibility assessments, this order could have affected enjoyment more readily than credibility alone. Future studies should also consider utilizing other media, other sources, and verify consistency across other individual differences including but not limited to level of fanship. While both dependent variables were measured independent of one another, future studies could consider systematically investigating the relationship of both variables as likability has been measured as a factor of credibility (Seiter et al., 2010) and credibility has been observed to influence enjoyment (e.g., Keene & Cummins, 2009).
To summarize, this study contributes substantially to current research in that it seeks to understand modern effects of sports media content on its consumers. It advances work investigating the effects of statistics, production placement, enjoyment, and source credibility, and these findings should be considered when producing future social media posts in our increasingly competitive sports media climate.
Footnotes
Appendix
Declaration of Conflicting Interests
The author(s) declared no potential conflicts of interest with respect to the research, authorship, and/or publication of this article.
Funding
The author(s) received no financial support for the research, authorship, and/or publication of this article.