
Abstract
Data in power grid digital operation exhibit multisource heterogeneous characteristics, resulting in low integration efficiency and slow anomaly detection response. To address this, this paper proposes a method for power grid digital operation data integration based on K-medoids clustering. The basic service layer utilizes an Field Programmable Gate Array parallel architecture. This enables millisecond-level synchronous acquisition and dynamic preprocessing of multisource data, such as mechanical vibration, partial discharge signals, and temperature. The implementation is based on the analysis of the power grid digital operation structure. The data are then fed back to the cloud service layer, which, through business integration services, data analysis, and data access services, performs data filtering and analysis. Subsequently, the data are input to the application layer via the database server. The application layer employs a K-medoids clustering method that introduces a density-weighted Euclidean distance metric and an adaptive centroid selection strategy, significantly enhancing the clustering performance of multisource data. In particular, the proposed architecture supports real-time data processing and can be extended to cross-modal scenarios, including integration with speech-to-text systems in power grid monitoring. By aligning with low-latency neural network principles, this method facilitates timely decision-making in intelligent operation environments. Experiments confirm the method’s efficacy. It acquires and integrates multisource heterogeneous power grid digital operation data effectively. The data throughput of different power grid digital operation data sources all exceed 110 MB/s. The silhouette coefficient of the integrated data sets is greater than 0.91, indicating that the integration of power grid digital operation data using this method exhibits good separability and reliability, enabling rapid detection of data anomalies within the power grid, thus laying a solid foundation for the operation and maintenance management of power grid digital operation.
Keywords
Introduction
The digital operation of the power grid covers multiple aspects such as power generation, transmission, distribution, and consumption, involving numerous systems and data sources. Through data integration, dispersed data sources can be consolidated into a unified view, eliminating data silos and ensuring data accuracy and consistency. The integrated data can provide a comprehensive perspective for power grid enterprises, facilitate in-depth analysis, quickly reveal potential problems, predict changes in electricity demand, optimize power generation and distribution strategies, and improve the overall efficiency of the power grid. 1 However, power grid data are related to energy security and user privacy, and data integration involves a large amount of data transmission and storage. The risk of data leakage has significantly increased, which may lead to serious consequences. Therefore, digital operation data integration of power grids is crucial. 2
Due to its importance, numerous scholars have conducted research on it. Komal et al. designed a multilayer perceptron neural network to train, learn, and classify islanding situations in response to the difficulty of detecting islanding in power grid data caused by high penetration rate of photovoltaic systems. By using grid-connected isolation of health systems and islanding situations, they achieved distributed integration. 3 However, the abnormal operation of the power grid exhibits time-varying and nonlinear characteristics, making it difficult to adjust the parameters of the static structure of the photovoltaic system in real time, which can lead to poor integration performance. Saxena et al. addressed the unstable impact of renewable energy on data integration by using data-driven and deep learning methods to predict grid data and renewable energy generation in real-time in the IEEE39 bus power system environment. They utilized an enhanced score extended state observer and feedback architecture to complete control and integration. 4 However, renewable energy generation is greatly affected by external factors, and short-term prediction errors may make it difficult for deep learning models to capture transient changes, resulting in unreliable integration effects. Boruah et al. collected consumer data from photovoltaic power plants using battery energy storage systems across multiple industries, analyzed voltage, load, and backflow conditions in different scenarios, determined the number and location of battery energy storage system integrations, and achieved efficient integration. 5 However, determining the number and location of integrations requires comprehensive consideration of multiple factors, making subsequent optimization difficult and the method’s adaptability poor. Eristi et al. proposed a residual neural network combined method to address the issue of the impact of the increasing penetration rate of renewable energy on data quality. The method utilizes wavelet decomposition and Stockwell transform to obtain the best feature image and improves the residual neural network to complete island detection and non island data integration. 6 However, excluding islanding events may affect critical data and lead to ineffective integration. In recent years, many valuable research achievements have emerged in the fields of microgrids and related energy management, communication, and data processing. Reference 7 was published in the 2025 IEEE Transactions on Industrial Applications, proposing a centralized control microgrid energy management strategy based on online reinforcement learning, providing a new approach for efficient management of microgrid energy; Reference 8 was also published in the International Journal of Power and Energy Systems in 2025. This study considers market fairness and utilizes blockchain technology to optimize the operation and transactions between multiple microgrids, which is of great significance for promoting fair and efficient collaboration among microgrids; Reference 9 was published in the IEEE Journal of Selected Fields of Communication in 2020, focusing on relay-assisted communication for smart grid demand response. Research was conducted on cost modeling, game strategies, and algorithms to improve the efficiency and reliability of smart grid communication; Reference 10 was published in the IEEE Transactions on Neural Networks and Learning Systems in 2025, introducing a learning self-growing graph for fast and accurate clustering of nonequilibrium flow data, providing a new technical approach for processing complex data in fields such as energy management. These studies have promoted the development of microgrids and related fields from different perspectives.
K-medoids clustering is a partition-based clustering algorithm that belongs to the category of unsupervised learning. It aims to divide a dataset into K clusters so that data points within the same cluster are similar to each other, while data points in different clusters have significant differences. Using K-medoids clustering to integrate digital operation data of the power grid can better handle non convex cluster structures, accurately identify abnormal data patterns, significantly improve the reliability and adaptability of data integration, and provide reasonable guidance for operation and management personnel of digital operation of the power grid. To overcome the shortcomings of existing methods, this paper proposes a digital operation data integration scheme for power grids that integrates advanced hardware acceleration and intelligent algorithms. Utilizing the powerful parallel processing capability of Field Programmable Gate Array (FPGA) to achieve precise and high-speed data acquisition and conducting deep clustering analysis based on an improved K-medoids clustering method. The improved algorithm introduces a dynamic weight adjustment mechanism, which can adaptively adjust clustering parameters based on the real-time characteristics of power grid data, more accurately divide data clusters, and complete intelligent integration. This method can refine the response time of power grid operation data to the millisecond level, significantly improving operation and maintenance efficiency, providing reliable data support for optimizing power generation and distribution, and laying a good foundation for digital operation and maintenance management of the power grid.
Power Grid Digital Operation Data Integration
Overall framework of power grid digital operation data integration
This paper proposes an integration scheme for power grid digital operation data. The scheme combines advanced hardware acceleration with intelligent algorithms. This optimization is crucial for efficient integration. This scheme first utilizes FPGA to achieve efficient data acquisition, then uses an improved K-medoids clustering method to complete data integration, and finally achieves full process management of data from acquisition to application through a hierarchical architecture.
First, by utilizing the powerful parallel processing capability of FPGA and combining it with customized data acquisition logic, precise and high-speed acquisition of data related to digital operation of the power grid can be achieved. Compared with traditional data acquisition methods, this method can fully utilize the hardware parallel characteristics of FPGA, greatly improving the real-time and accuracy of data acquisition. After the data are collected, a deep clustering analysis is performed on the data using an improved K-medoids clustering method. The improved K-medoids clustering method introduces a dynamic weight adjustment mechanism based on traditional algorithms, which can adaptively adjust clustering parameters according to the real-time characteristics of power grid data, thereby more accurately dividing data clusters and achieving intelligent integration of digital operation data of the power grid. This method can not only refine the response time of power grid operation data to the millisecond level but also significantly improve the efficiency of power grid operation and maintenance, providing solid and reliable data support for optimizing power grid generation and distribution. The overall framework of the power grid digital operation data integration method designed using the aforementioned approach is shown in Figure 1.

Overall framework of data integration method for digital operation of power grid.
As shown in Figure 1, the digital operation data integration framework of the power grid consists of a basic platform layer, a cloud service layer, and an application layer. Each layer achieves full lifecycle management of power grid data through data flow and functional collaboration. The basic platform layer consists of FPGA-based multisource heterogeneous power grid digital operation data acquisition, power grid digital operation structure analysis, and database access interfaces. This layer facilitates the acquisition of power grid digital operation data and linkage with the digital platform, providing a reliable data source for data analysis in the cloud service layer. The cloud service layer comprises business integration service, data analysis, and data access service, thereby enabling data filtering and analysis, which establishes a solid foundation for the integration of power grid digital operation data. The application layer primarily includes power grid system management, power grid digital operation data integration based on K-medoids clustering, and performance monitoring, utilizing these components to accomplish the integration of power grid digital operation data and to comprehensively manage the integrated data. In summary, the basic service layer acquires heterogeneous power grid digital operation data and transmits it to the database server. The server inputs the data into the cloud service layer for analysis and processing, then returns it to the database server. Subsequently, the server inputs the data into the application layer, which performs data integration operations, thereby establishing a solid foundation for real-time operation, maintenance, and optimization of the power grid. 11
Analysis of power grid digital operation structure
To ensure the pertinence and effectiveness of data collection, the basic platform layer needs to clarify the key data sources and collection targets for digital operation of the power grid through structural analysis before data acquisition.
To comprehensively understand data related to power grid digital operation and to avoid poor integration outcomes caused by indiscriminate collection of power grid digital operation data, the basic platform layer first analyzes the power grid digital operation structure under transient voltage conditions before collecting such data. 12 This method combines the physical characteristics and data flow laws of the power grid to construct a multidimensional structural analysis model, which can quickly clarify the data collection goals of digital operation of the power grid, effectively avoid collecting invalid data, and improve the rationality and accuracy of subsequent integration analysis of digital operation data of the power grid. The power grid digital operation structure is illustrated in Figure 2.
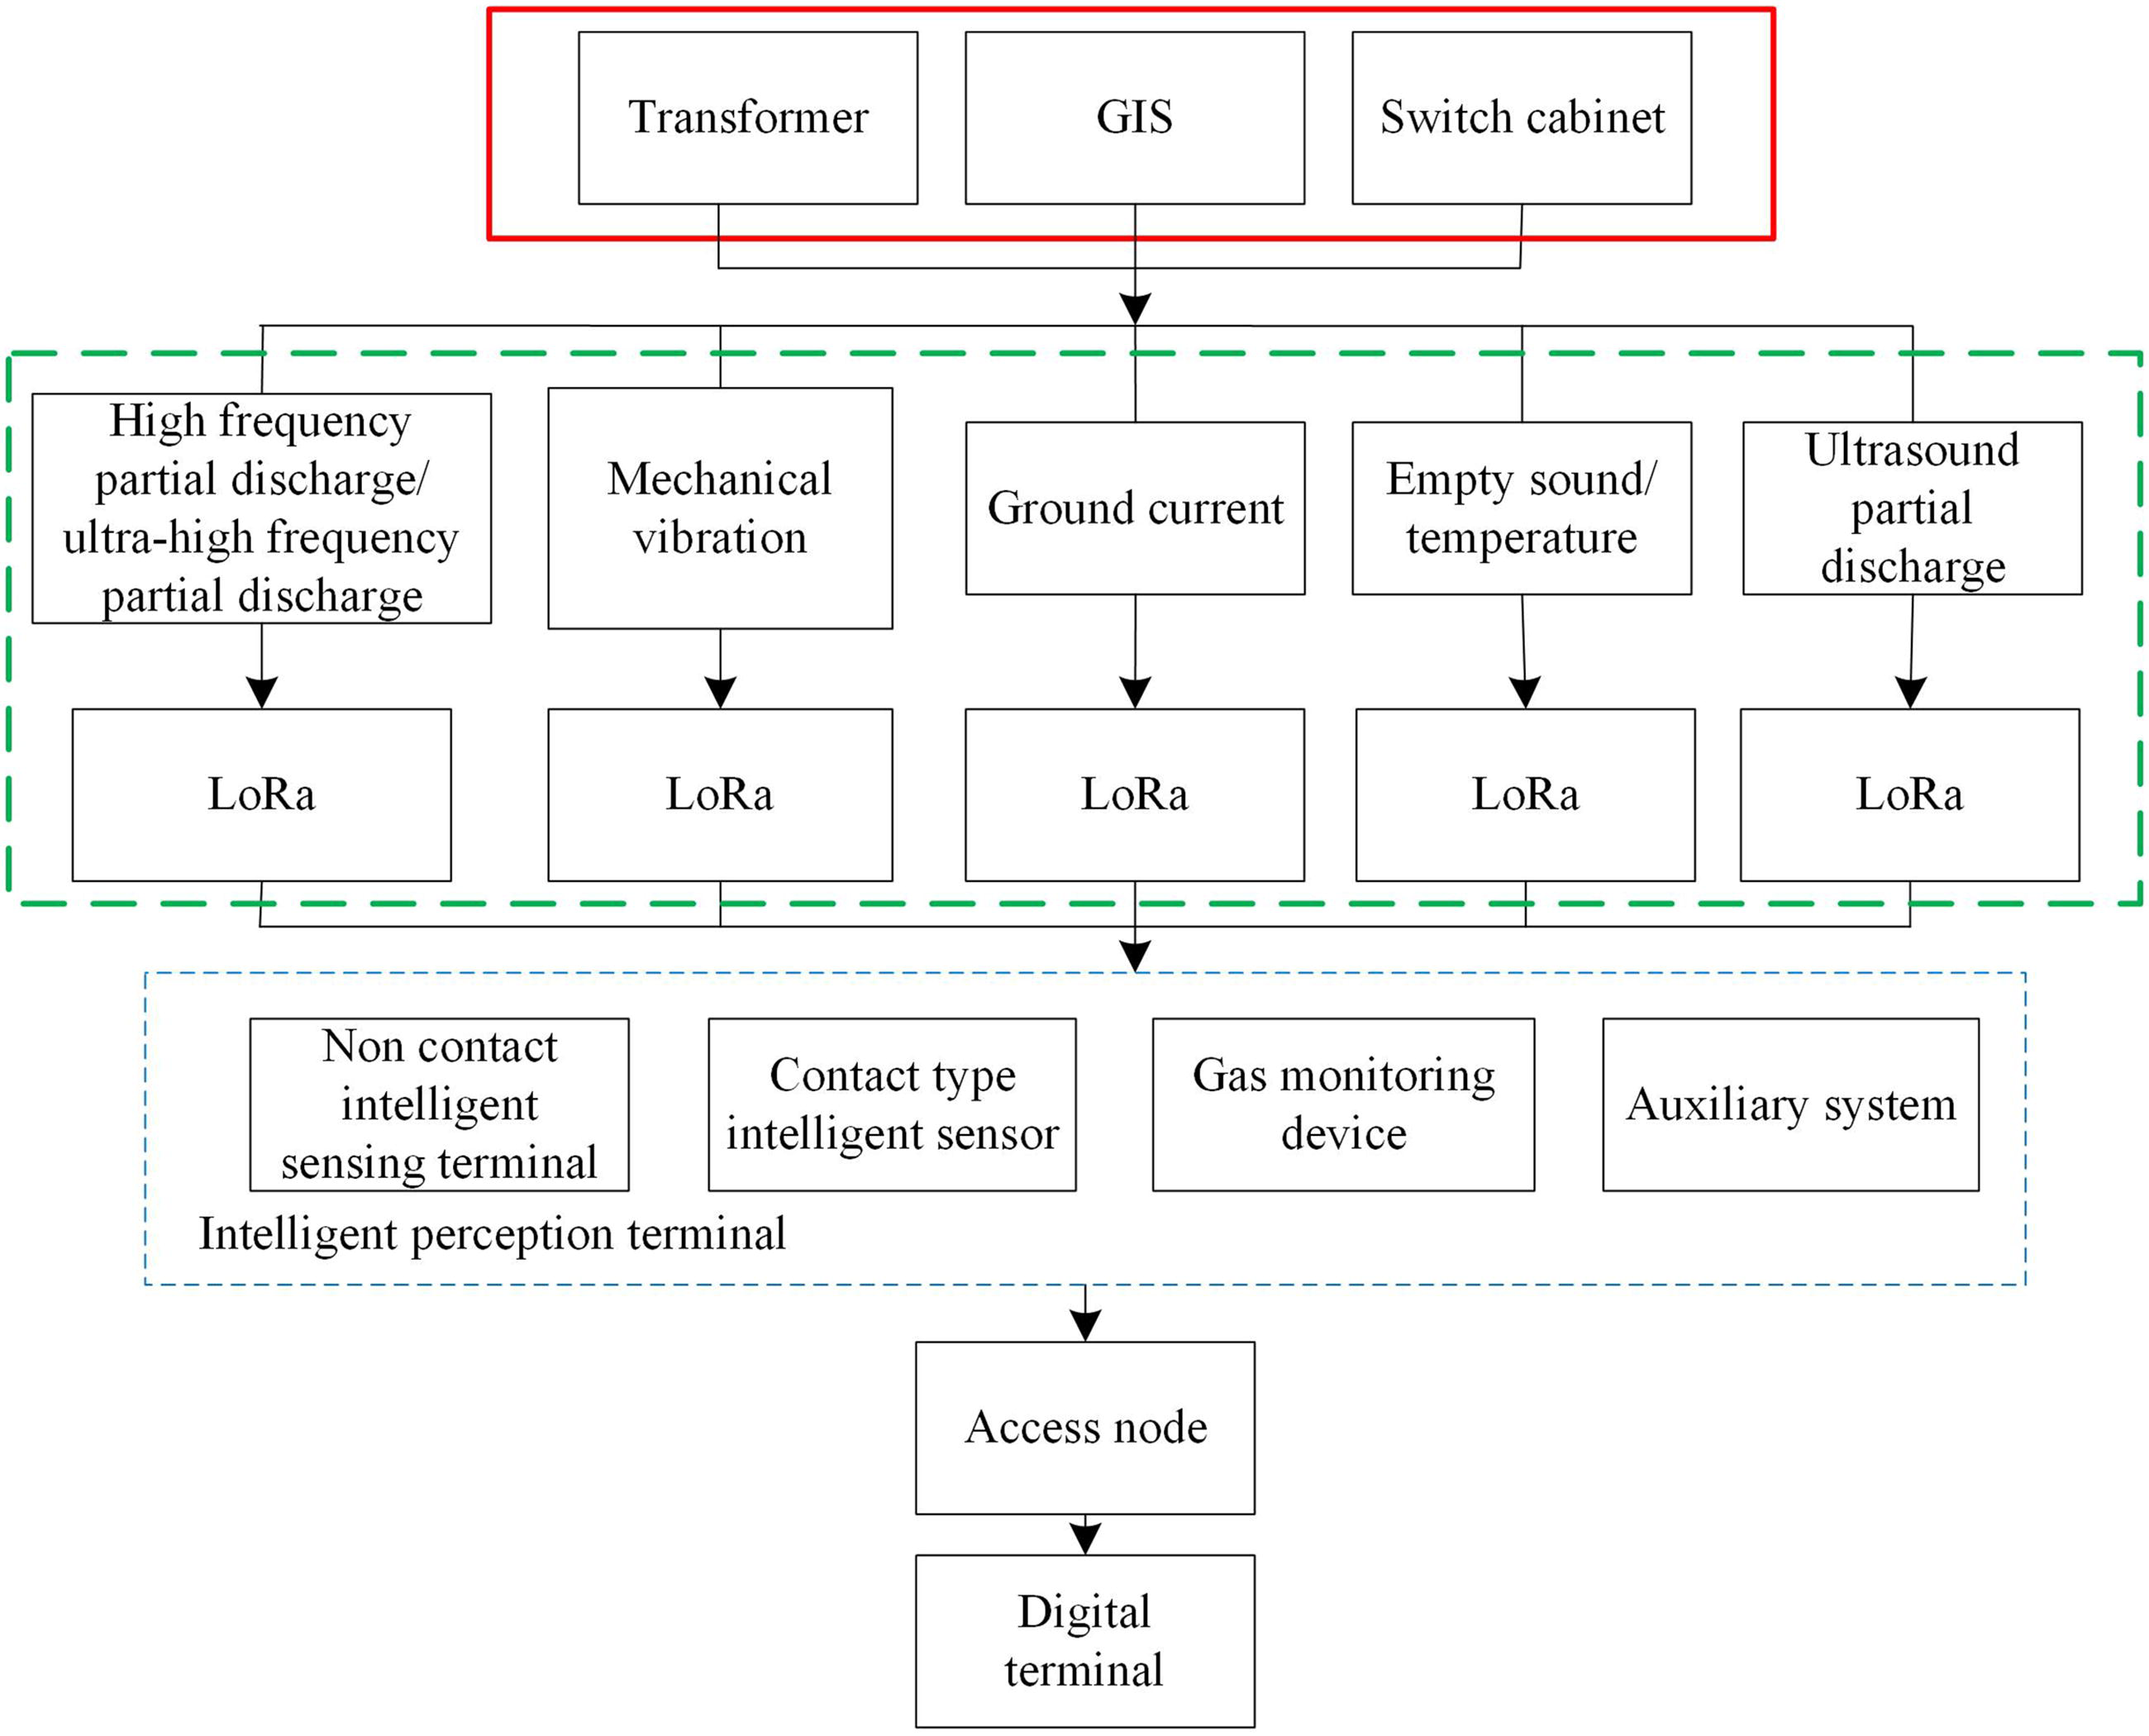
Digital operation structure of power grid.
As shown in Figure 2, the digital operation structure of the power grid is centered around intelligent sensing terminals, which achieve comprehensive monitoring of equipment status and operating environment through multiple types of sensors, providing basic support for data collection. The digital operation structure of the power grid shown in Figure 2 is based on sensing devices of various power grid components, among which the intelligent sensing terminals include noncontact intelligent sensing terminals, contact intelligent sensors, gas monitoring devices, and auxiliary systems. Specifically, noncontact intelligent sensing terminals sense ultrahigh frequency partial discharge signals from equipment in the power grid, while contact intelligent sensors sense signals such as high-frequency partial discharge, transient voltage, mechanical vibration, ultrasonic partial discharge, and grounding current. Gas monitoring devices are combined with auxiliary systems to sense changes in air and temperature of equipment such as transformers and switchgear in the digital operation of the power grid; therefore, the combination of the above four components constitutes an intelligent sensing terminal, which can comprehensively perceive the changes in air temperature, grounding current, ultrasonic partial discharge, and mechanical vibration of equipment such as transformers and switchgear in the digital operation of the power grid. The relevant data sensed can be connected to the digital terminal, and then the digital terminal can be used to analyze and operate the internal components of each power grid, thereby achieving the digital operation of the power grid.
FPGA-based multisource heterogeneous power grid digital operation data acquisition and processing
The data collection capability of the hardware architecture is derived from three main design features: multichannel synchronous collection, protocol dynamic adaptation, and edge data processing, which jointly support the efficient acquisition of heterogeneous data from multiple sources in the power grid.
From the above analysis of digital operation of the power grid, it can be seen that the data sources of digital operation of the power grid are extensive, covering various channels such as internal transformers and switchgear, and the data types are rich and diverse, including mechanical vibration, and gas. In order to comprehensively and in real time obtain multisource heterogeneous data of digital operation of the power grid, this paper proposes an innovative data acquisition and processing method based on FPGA.13,14 First, FPGA achieves multichannel synchronous acquisition through customized hardware logic design, utilizing the advantages of hardware parallelization to meet millisecond-level sampling frequency requirements; Second, by dynamically configuring the protocol parsing module to adapt to multiple communication protocols (such as IIC, 5G, and CAN), the system adaptability can be improved. Finally, integrate data preprocessing and compression functions at the collection end to reduce transmission bandwidth and storage pressure. This method fully utilizes the hardware parallelization advantage of FPGA, and achieves multichannel synchronous acquisition through customized hardware logic design, meeting the real-time acquisition requirements of multisource heterogeneous data. The data sampling frequency obtained by this method can reach up to milliseconds, greatly improving the real-time performance of data collection. At the same time, in response to the diverse communication protocols of power grid equipment, this method dynamically configures the protocol parsing module through hardware logic, which can flexibly adapt to different communication protocols, making the acquisition of multisource heterogeneous power grid digital operation data more convenient and efficient, significantly improving the adaptability of the system. In addition, the FPGA method also has powerful data processing capabilities, which can complete data preprocessing and compression operations at the multisource heterogeneous data acquisition end of the power grid. By introducing intelligent data compression algorithms, the data transmission bandwidth and storage requirements are significantly reduced while ensuring data quality, and the load on the data acquisition module is reduced. 15 The FPGA-based multisource heterogeneous power grid digital operation data acquisition framework is illustrated in Figure 3.
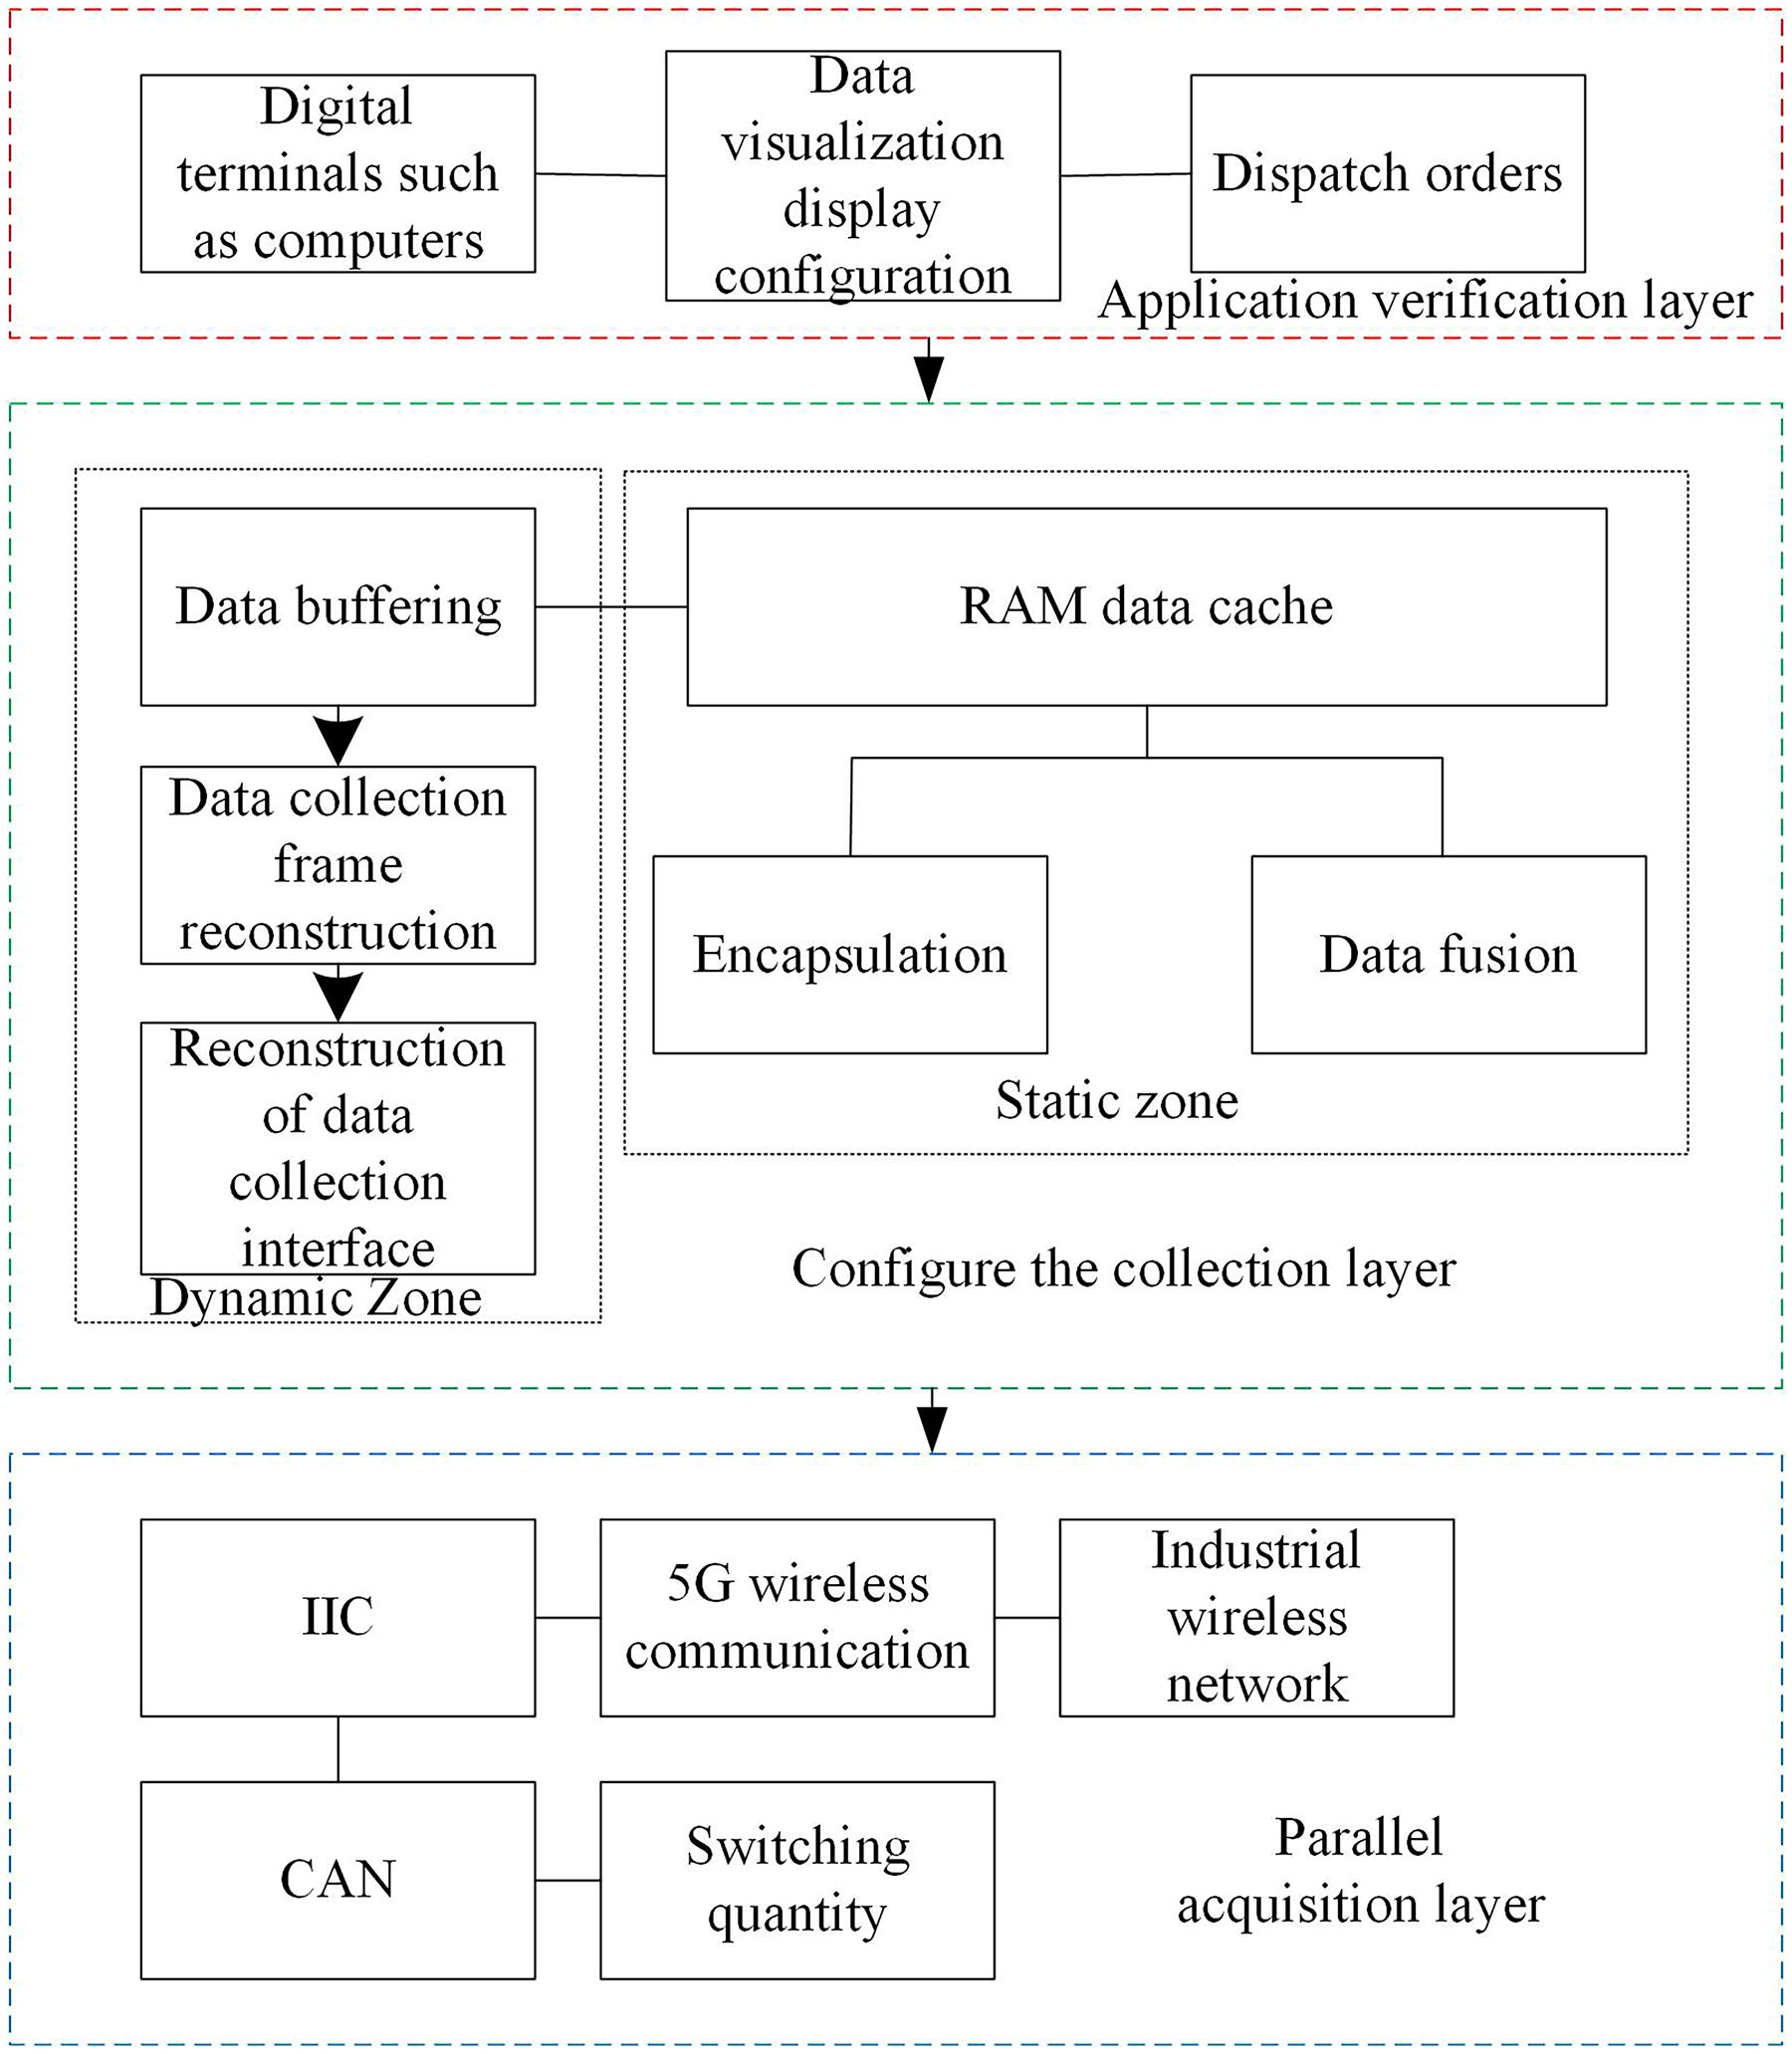
FPGA-based framework for digital operation data collection of multisource heterogeneous power grids.
As shown in Figure 3, the FPGA acquisition framework achieves functional decoupling through layered design: the parallel acquisition layer is responsible for multisource data access, the configuration acquisition layer completes data preprocessing, and the application verification layer supports real-time monitoring and instruction issuance. The FPGA-based multisource heterogeneous power grid digital operation data acquisition, as shown in Figure 3, consists of three modules: parallel acquisition layer, configuration acquisition layer, and application verification layer. There is a clear sequential dependency and functional complementarity between each module. Among them, in the parallel acquisition layer, different types of data transmission networks are set up, such as IIC, 5G wireless communication, industrial wireless network, and CAN, and different interface protocols and transmission networks are selected based on the different data types detected by various sensors in 2.2 in order to obtain digital operation data of heterogeneous power grids from multiple sources and complete the interaction and sharing of data between them 16 ; On this basis, the configuration acquisition layer is divided into dynamic and static areas, where the static area is composed of RAM data cache, data encapsulation, and data fusion to complete the basic data collection 17 ; The dynamic zone consists of data buffering, data collection frame reconstruction, and data collection interface reconstruction and has the dynamic reconfigurability function of heterogeneous multisource power grid digital operation data. The real-time configuration of data can be carried out through the reallocation method of FPGA; in addition, the application verification layer mainly consists of digital terminals such as computers, data visualization display configurations, and command sending. The terminals collect and organize real-time configured data and obtain different data in interface/frame formats. They also set details such as alarm thresholds or transmission schemes for the data, ultimately achieving controllable collection and fast preprocessing of digital operation data for the power grid. 18
Setting the acquisition range of FPGA dynamic region multisource heterogeneous power grid digital operation data
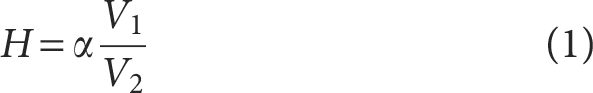
where
To reasonably allocate the RAM storage resources for the power grid digital operation data acquired by the FPGA, the minimum depth
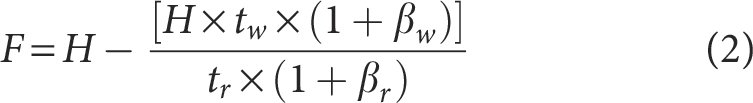
where
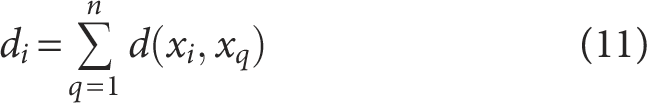
Based on the above formulas, the FPGA configuration is finalized. Using the configured FPGA, the acquisition of multisource heterogeneous power grid digital operation data is performed, denoting the acquired multisource heterogeneous power grid digital operation data as
Integration of multisource heterogeneous power grid digital operation data based on K-medoids clustering
The improved K-medoids clustering method solves the problem of uneven distribution and dynamic changes in multisource heterogeneous power grid data through dynamic weight adjustment and adaptive center selection mechanism, significantly improving the stability and interpretability of data integration.
To effectively integrate multisource heterogeneous power grid digital operation data, this paper adopts an improved K-medoids clustering method
19
to cluster the multisource heterogeneous power grid digital operation dataset
(1) Input the multisource heterogeneous power grid digital operation data


where
where
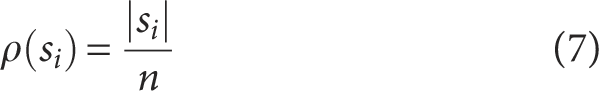
where
(2) Assume
where
(3) Calculate the distances between power grid digital operation data points within the cluster, arrange these distances in descending order, and select the top 10% of distances as the candidate set

(4) Select two initial centroids from the power grid digital operation data set

where
Among them,
(5) Select from the initial centroid candidate set the power grid digital operation data point farthest from the first initial centroid to ensure it belongs to a different clustering cluster, calculated by the following formula:

where
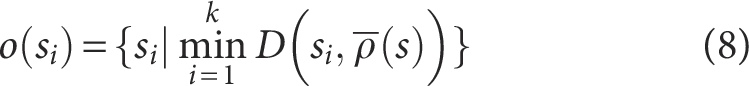
(6) In the adaptive center point selection, the principle of proximity is applied, where all digital operation data points from the power grid are grouped into clusters based on the nearest

where
(7) Select the remaining

where
(8) The digital operation data point of the power grid farthest from the center point

where
(9) Continuously iterate to update the centroids, gradually increasing the number of initial centroids, and the clustering stops until the number of centroids reaches
Test Analysis
This experiment is based on the digital operation scenario of a distribution network in a certain power enterprise, and a simulated experimental environment is constructed. The hardware equipment used in the experiment includes several high-performance servers, which are configured to meet the requirements of large-scale data processing and computing; the network switch has a bandwidth of 200 M to ensure the stability and efficiency of data transmission. The experimental distribution network system adopts the IEEE39 standard model, which includes a substation node and simulates three typical data sources: commercial electricity load, industrial electricity load, and residential electricity load. It can reflect the data characteristics and distribution situation in actual power grid operation more realistically. In terms of software, the Spark Version 1.0 experimental platform is used as the core tool for data processing and integration, and its powerful distributed computing capabilities provide strong guarantees for the smooth conduct of experiments. The topology of the experimental distribution network is shown in Figure 4, and other relevant experimental parameters are listed in Table 1.

Topology diagram of experimental distribution network.
Other relevant parameters of the experiment

The 500 sample data for this experiment are collected in real-time from the simulated experimental environment and generated through simulation. To ensure the richness and representativeness of the dataset, power grid operation data collection was implemented under different time and load conditions, covering key nodes such as wind turbines and solar photovoltaic power stations on the commercial power generation side, substations and high-voltage transmission lines on the industrial transmission side, distribution transformers and smart meters on the residential distribution side, as well as meteorological observation stations for industrial power environment monitoring and noncontact intelligent sensing terminals for industrial electrical equipment status monitoring. By setting different operating parameters and simulating various practical working conditions in the experimental environment, 500 sample data were generated, including adjusting the output power of commercial power generation equipment, the load level of industrial power equipment, and the peak and valley periods of residential electricity consumption, to simulate diverse power grid operation scenarios. At the same time, strict preprocessing was carried out on the collected raw data, including data cleaning, denoising, normalization, and other operations to eliminate outliers and noise interference, providing a high-quality data foundation for subsequent experimental analysis. The specific experimental process is as follows:
Step 1: Data Collection: Adopting an innovative data collection method based on FPGA, leveraging the hardware parallelization advantages of FPGA. By customizing hardware logic design, multichannel synchronous acquisition can be achieved to meet the real-time acquisition requirements of multisource heterogeneous data. In response to the diverse communication protocols of power grid equipment, the protocol parsing module is dynamically configured through hardware logic to flexibly adapt to different communication protocols, including Ethernet, optical fiber communication, industrial Ethernet, power line communication, 5G wireless communication, IIC, and CAN. To ensure the convenient and efficient acquisition of digital operation data for multisource heterogeneous power grids.
Step 2: Data processing: FPGA completes data preprocessing and compression operations at the data acquisition end. Introducing intelligent data compression algorithms significantly reduces data transmission bandwidth and storage requirements while ensuring data quality, and lowers the load on data acquisition modules. At the same time, different data processing modules are configured in the collection layer, such as data fusion module, data encapsulation module, data collection frame reconstruction module, and data buffering module, to finely process the collected data to meet the needs of different data sources and data types.
Step 3: Data Integration: Use an improved K-medoids clustering method to cluster and integrate the collected multisource heterogeneous power grid digital operation data. This method introduces a dynamic weight adjustment mechanism based on data density and an adaptive clustering center selection strategy on the basis of traditional algorithms and achieves accurate clustering of multisource heterogeneous data through density-weighted Euclidean distance measurement. At the same time, the clustering parameters can be dynamically adjusted to adapt to the drastic changes that may occur in the actual multisource heterogeneous power grid digital operation data points, improving the interpretability of the integrated results.
In the experimental preparation stage, various equipment and system parameters were carefully set and optimized. In terms of wind turbines, considering the actual operating power, energy consumption, wind resource distribution, and electricity demand, the power was set to 100 kW and the number was determined to be 10. During operation, the speed was dynamically adjusted through an intelligent control system to stabilize the power near the set value and control fluctuations within ±5%; In terms of server terminals, a maximum power of 600 W and a minimum power of 300 W are set, and dynamic power adjustment is achieved by intelligently adjusting CPU frequency and other parameters according to business load through management software. 1500 terminals are also grouped and managed, with each group equipped with an independent power management system; In terms of server air conditioning, it is equipped with 10 units, each with a power of 50 kW. The intelligent temperature control system is used to automatically adjust the cooling capacity according to the temperature of the computer room, strictly controlling the temperature within 20–25°C, and the fluctuation does not exceed ±1°C; In terms of basic parameters of the distribution network, the experimental distribution network has 39 nodes, with a rated voltage set at 12.66 kV, power factor adjusted to 0.9, DC conversion efficiency set at 0.9, and air heat capacity ratio set at 0.9 J/kg·°C; in terms of communication parameters, the signal transmission delay time is set to 500 ms. By optimizing the network topology, adopting high-speed protocols, and adding relay devices, the delay meets the requirements. Regular testing and maintenance of communication lines are also carried out to ensure accurate data transmission.
To verify whether the method proposed in this paper can acquire power grid digital operation-related data, the FPGA method presented herein was employed to select the corresponding interface protocols and data transmission modes for different power grid data sources. Using this approach, digital operation-related data from an experimental distribution network were collected. The data types, data source names, data names, and acquisition frequencies of the collected digital operation data from different experimental distribution networks are presented to analyze the feasibility of acquiring power grid digital operation-related data using the proposed method. Partial digital operation data collected from the experimental distribution network using the proposed method are shown in Table 2.
Collection results of digital operation related data

As shown in Table 2, after acquiring power grid digital operation data using the proposed method, it can be observed that the data have undergone refined processing by various modules within the configuration acquisition layer of the FPGA. Moreover, the data transmission method corresponds to different data transmission networks within the FPGA parallel acquisition layer. The transmitted data encompass various data source types, including industrial electricity transmission side, industrial electricity environment monitoring side, residential electricity distribution side, and commercial electricity generation side. Simultaneously, different data sources also include multiple data types such as electric quantity, voltage, partial discharge current, and temperature. Furthermore, the multisource data sampling frequency achieved by the method proposed in this paper can reach the millisecond level, indicating that this method can rapidly acquire power grid digital operation data from diverse sources and types, thereby establishing a solid foundation for power grid digital operation data integration.
By visualizing clustering analysis, the clustering results are presented in a visual graph (Fig. 5). According to the analysis in Figure 5, operation and maintenance personnel can clearly see the spatial distribution of various types of power grid data and clarify the power grid operation characteristic patterns represented by different clusters, such as being able to intuitively distinguish normal operation data clusters, potential fault data clusters, etc., thus providing intuitive basis for fault prediction and operation optimization.

Visualize clustering results.
To verify the reliability of the multisource heterogeneous power grid digital operation data collected using the FPGA method proposed in this paper, the experimental distribution network digital operation data obtained by this method were analyzed by calculating the data throughput of different data sources at various times. When the throughput reaches 100 MB/s, it demonstrates effective data acquisition and processing. This validates the processing capability and reliability of the proposed method for handling multisource heterogeneous power grid digital operation data. The data throughput calculation results for different data sources at different times during the acquisition process are presented in Figure 6.

Calculation results of data throughput for different data sources at different times.
As shown in Figure 6, after acquiring multisource heterogeneous digital operation data of the distribution network using the method proposed in this paper, the industrial data processed at different times exhibits the highest data throughput, followed by commercial data, and finally residential data, which corresponds to actual production and living conditions. Furthermore, the data throughput of all three data types exceeds 110 MB/s, significantly reducing the likelihood of data loss in power grid digital operation data. This indicates that the proposed method can process various data types rapidly and efficiently, further demonstrating its robust data acquisition and processing capabilities, thereby ensuring the real-time performance and reliability of power grid digital operation data. The focus of this experiment is to demonstrate the overall trend of data throughput changes from different data sources (industrial data, commercial data, and residential data) at different times, as well as the relative size relationship between various data throughput, in order to verify the reliability of the FPGA method used in this paper for collecting and processing multisource heterogeneous data in the digital operation of the power grid. The error bar is mainly used to reflect the uncertainty and fluctuation range of data. Under the verification objective of this experiment, adding an error bar does not provide additional effective information for the core purpose of verifying the reliability of the method. Instead, it may make the display of chart information more complex, which is not conducive to directly observing the trend and comparison of data throughput changes.
To verify the capability of the proposed method to integrate power grid digital operation data, it was applied to cluster and integrate important multisource heterogeneous digital operation data from different types of experimental distribution networks. The sources of the integrated multisource heterogeneous data, anomaly data names, detection dates, and specific load rate information of the experimental distribution network’s power grid digital operation data integration are presented to analyze the method’s effectiveness. The results of integrating multisource heterogeneous digital operation data from the experimental distribution network using the proposed method are shown in Table 3.
Integration results of multisource heterogeneous data for digital operation of power grid

As shown in Table 3, after integrating the digital operation data of the power grid using the K-medoids clustering method proposed in this paper, the data sources, names of abnormal data, acquisition dates, and load factors of the multisource heterogeneous power grid data can be integrated into a single dataset. Furthermore, by utilizing the different data obtained, the abnormal digital operation nodes of the power grid can be classified into different categories, such as commercial high-load data and residential high-load data. This enables a deeper and more comprehensive understanding of abnormal conditions in grid operations, further demonstrating that the method proposed in this paper can effectively integrate grid digital operation data. This facilitates the development of different dispatch strategies and equipment maintenance plans for nodes with abnormally high loads of various types, thereby enhancing grid stability and operational efficiency and laying a solid foundation for grid maintenance, precise dispatch, and other management tasks.
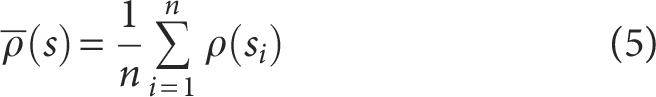
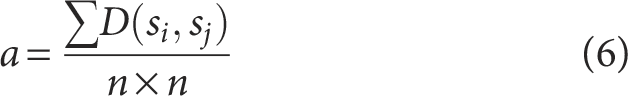
To verify the separability and reliability of the integrated power grid digital operation data using the method proposed in this paper, the overall silhouette coefficient metric 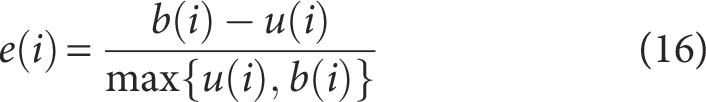
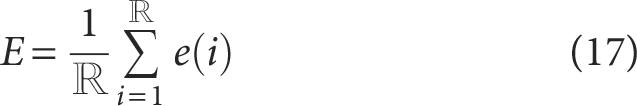
where
Integrate the experimental digital operation data of the distribution network using the data-driven deep learning method from reference, 4 the residual neural network combination method from reference, 6 and the method proposed in this paper. During the experiment, different sizes of data were selected for testing, ranging from 50 bits to 500 bits, to comprehensively evaluate the performance of each method at different data scales. For each data volume situation, the silhouette coefficient index of the integrated results of the three methods is calculated to verify the separability and reliability of the proposed method for the integration of digital operation data in the power grid. The calculation results of the silhouette coefficient metric for the integration results of the three methods are shown in Figure 7.

Calculation results of silhouette coefficient index for the integrated results of three methods.
From Figure 7, it can be seen that when using the method proposed in this paper to integrate digital operation data of the power grid, and the data volume is at various scales covered in this experiment (from 50 bits to 500 bits), the contour coefficients obtained from the integration results are all greater than 0.91, which is much higher than the contour coefficients obtained from the other two methods. This fully demonstrates that the integrated dataset obtained by using the method proposed in this article for the digital operation of the power grid has good separability and reliability. Each digital operation data of the power grid is accurately divided into data clusters with similar characteristics and has significant differences from other power grid data clusters. This result further proves that the method proposed in this paper can lay a solid foundation for digital operation and maintenance management of the power grid.
To comprehensively verify the performance advantages of the proposed method in the integration of digital operation data in the power grid, three methods were used to detect the dataset, and evaluation indicators such as sampling frequency, throughput, silhouette coefficient, anomaly detection accuracy, processing delay, and memory occupancy were cited. Meanwhile, a one-way analysis of variance (ANOVA) was conducted to examine the significant differences in silhouette coefficients among different methods. The experimental results are shown in Table 4.
Performance comparison of different methods

According to the analysis in Table 4, the method proposed in this paper demonstrates significant advantages in multiple evaluation indicators in the integrated detection of digital operation data in the power grid. In terms of sampling frequency, the method proposed in this article reaches 150 Hz, which is higher than the combination of data-driven deep learning methods and residual neural networks, and can obtain data more quickly; In terms of data throughput, our method leads with 120 MB/s and has stronger processing and transmission capabilities. The silhouette coefficient index, whether it is 50-bit or 500-bit data volume, is the highest in this paper’s method, indicating that the data clustering effect is better. According to one-way ANOVA, there are significant differences in silhouette coefficients among different methods (p-values are all less than 0.05). In terms of anomaly detection accuracy, this method achieves 95%, which is higher than the other two methods and has better detection performance. In terms of processing latency, our method only takes 30 ms, which is lower than the combination of data-driven deep learning methods and residual neural networks, and has a faster processing speed. In terms of server memory usage, the method proposed in this article has a higher resource utilization efficiency of 35%. In terms of data loss rate, the method proposed in this article has a minimum of 0.8%, making data transmission and storage more reliable. Overall, the method proposed in this article has significant performance advantages in the integration of digital operation data in the power grid.
To verify the effectiveness of the K-medoids clustering-based integration method for digital operation data of power grids in practical applications, real operation data from a large power grid enterprise was selected, which includes multisource heterogeneous data such as mechanical vibration, partial discharge signals, and temperature, and includes noise, missing values, and unexpected patterns. The experiment compares the method proposed in this paper with data-driven deep learning methods, residual neural network combination methods, improved spectral clustering algorithms, Kalman filter data fusion methods, and Transformer models. By evaluating the performance of different methods in indicators such as data integration efficiency, anomaly detection response time, and clustering accuracy, the advantages and disadvantages of this method can be comprehensively judged. The results are shown in Table 5.
Actual application performance of different methods

According to Table 5 analysis, the method proposed in this paper has a significant advantage in data integration efficiency when processing 1000 real running data, taking only 2.3 seconds. The data-driven deep learning method takes 7.8 seconds, the residual neural network combined method takes up to 9.2 seconds, and the Transformer model also takes 6.8 seconds. This is because our method uses FPGA parallelization architecture in the basic service layer to achieve millisecond-level synchronous acquisition and dynamic preprocessing of multisource data, greatly improving data processing speed. Although the improved spectral clustering algorithm is also relatively efficient, taking 3.8 seconds, it is still inferior to the method proposed in this paper; the Kalman filter data fusion method takes 6.3 seconds to process data and has relatively low efficiency. This fully demonstrates that the method proposed in this article can quickly integrate heterogeneous data from multiple sources in the data integration process, providing timely support for subsequent analysis. The method proposed in this article shows excellent performance in anomaly detection response time, requiring only 110 ms. Due to the complex model structure and large computational complexity, the data-driven deep learning method and Transformer model have response times of 340 ms and 310 ms, respectively. The residual neural network combined method has the longest response time, at 390 ms. The spectral clustering improvement algorithm has a response time of 190 ms, and the Kalman filter data fusion method has a response time of 270 ms, both slower than the method proposed in this article. The shorter response time for anomaly detection means that the method proposed in this article can more quickly detect abnormal situations in power grid operation, buying valuable processing time for operation and maintenance personnel and effectively ensuring the safe and stable operation of the power grid. The clustering accuracy of this method is as high as 93%, standing out among all compared methods. The data-driven deep learning method, residual neural network combination method, and Transformer model have certain interference in clustering performance when processing real data containing noise, missing values, and unexpected patterns, with accuracy rates of 86%, 84%, and 85%, respectively. The improved spectral clustering algorithm has a clustering accuracy of 89%, while the Kalman filter data fusion method has an accuracy of 87%, both lower than the method proposed in this paper. This is due to the density-weighted Euclidean distance metric and adaptive center point selection strategy introduced by the method in this article, which can better adapt to complex and diverse real data and significantly improve the clustering effect of multisource data. In summary, this method has significant advantages in key indicators such as data integration efficiency, anomaly detection response time, and clustering accuracy, and it can effectively improve the quality and efficiency of digital operation of the power grid in practical applications.
To verify the effectiveness of the proposed K-medoids clustering-based data integration method for power grid digital operation, a simulated power grid digital operation environment was set up for experimentation. At the basic service layer, FPGA parallelization architecture is used to simulate millisecond-level synchronous acquisition and dynamic preprocessing of multisource data such as mechanical vibration, partial discharge signals, and temperature. After filtering and analyzing the collected data, the cloud service layer inputs it into the application layer. The application layer adopts the K-medoids clustering method proposed in this article, introducing density-weighted Euclidean distance measurement and adaptive center point selection strategy to cluster the data. The experiment evaluates the performance advantages of our method and the feasibility of FPGA in practical applications by comparing the accuracy, recall, F1 value, and FPGA-related performance indicators of clustering under different methods. The results are shown in Table 6.
FPGA scalability

According to the analysis in Table 6, from the perspective of clustering effect, our method is significantly better than the traditional K-medoids method in terms of accuracy, recall, and F1 value. The accuracy is improved by 10.7 percentage points, the recall is improved by 11.4 percentage points, and the F1 value is improved by 0.111, indicating that the introduction of the new strategy can effectively improve the clustering effect of multisource data and facilitate subsequent analysis and detection. In terms of FPGA performance, its parallelization architecture results in a data acquisition delay of 2.3 ms and a preprocessing time of 1.8 ms, achieving millisecond-level synchronous acquisition and dynamic preprocessing, meeting real-time requirements. However, in large-scale power grid deployment, although FPGA has good scalability and can meet data processing needs by increasing the number of chips and adjusting hardware logic design, the expansion of scale will bring about difficulties in chip communication synchronization; In terms of hardware requirements, it is necessary to select suitable chips based on data requirements and consider peripheral circuit design, and the complexity and cost of hardware design increase with the expansion of the power grid scale; In terms of energy consumption, an increase in processing tasks and data volume will lead to an increase in energy consumption, requiring the adoption of low-power design technologies; the deployment cost covers hardware procurement, development, and maintenance costs. High-end chips are expensive, have long development cycles, and are difficult to maintain. Therefore, when deploying, it is necessary to comprehensively consider cost-effectiveness and choose a suitable solution.
In the integration method of digital operation data for power grid based on K-medoids clustering, in order to explore the influence of different K values on the clustering effect, multisource heterogeneous power grid operation data samples, including mechanical vibration, partial discharge signal, and temperature, were selected. Experiments were conducted with K = 2, K = 3, and K = 4, respectively. After completing millisecond-level synchronous data collection and dynamic preprocessing in the basic service layer, K-medoids clustering method (introducing density-weighted Euclidean distance measurement and adaptive center point selection strategy) was used in the application layer to cluster the data and evaluate indicators such as clustering tightness and interclass separation under different K values. The results are shown in Table 7.
Clustering performance under different K values

According to the analysis in Table 7, when K = 2, the clustering density index (mean intra class distance) is the smallest, at 2.3. This indicates that in the case of K = 2, the sample data within each cluster is more concentrated and has higher similarity. At the same time, the interclass separation index (mean interclass distance) is the highest, reaching 8.6, indicating that the differences between the two clusters are significant and can effectively distinguish data with different features. When K increases to 3 and 4, although the samples are further subdivided, the clustering density index increases, which means that the sample data within each cluster becomes relatively dispersed and the similarity decreases. Moreover, the decrease in the interclass separation index indicates a decrease in the discriminability between clusters, which may result in over segmentation leading to poorer clustering performance. Taking into account the two key indicators of cluster density and inter cluster separation, K = 2 can achieve a good balance between these two aspects, ensuring the similarity of data within each cluster and effectively distinguishing differences between different clusters. Therefore, choosing K = 2 as the number of clusters is more appropriate. Using different K values for experiments can help visually observe the trend of clustering effect changing with K values, thus determining the most suitable number of clusters.
Discussion
Although the power grid digital operation data integration scheme proposed in this article, which integrates advanced hardware acceleration and intelligent algorithms, has shown significant advantages in multiple aspects, there are still some limitations.
First, this method has a high dependence on FPGA hardware specifications. FPGA chips with different performance have differences in data processing capabilities, number of parallel channels, and storage capacity. If the FPGA hardware specifications used are insufficient, it may not be able to meet the requirements of large-scale, high-frequency power grid data acquisition and processing, thereby affecting the real-time and accuracy of data integration; choosing high-performance FPGA chips will significantly increase hardware procurement costs and require higher investment from enterprises.
Second, when applied to larger scale power grid networks, this method faces scalability challenges. With the expansion of the power grid, the number and volume of data sources are growing exponentially, requiring the deployment of more FPGA devices to meet data processing needs. However, the communication and collaborative work between a large number of FPGA devices have become complex, which may result in increased data transmission latency, synchronization difficulties, and a decrease in data integration efficiency. In addition, the complexity and cost of hardware design will significantly increase with the expansion of the power grid scale, including the selection and configuration of FPGA chips, the design of peripheral circuits, and system integration, which brings certain difficulties to practical deployment and application.
Finally, this method may be sensitive to data sampling rate. In the process of data collection, if the data sampling rate is set improperly, it may lead to problems such as data loss or duplicate collection. For example, when the data sampling rate is too low, it is difficult to accurately capture the rapid changes in power grid data, which affects the subsequent data analysis and clustering results; when the data sampling rate is too high, although more detailed data information can be obtained, it will increase the burden of data transmission and processing, which may lead to a decrease in system performance and even problems such as data congestion and delay. Therefore, in practical applications, it is necessary to set the data sampling rate reasonably according to the specific operating conditions and data characteristics of the power grid in order to balance the accuracy of data collection and system performance.
Conclusion
This study addresses the issues of low integration efficiency and slow anomaly detection response in multisource heterogeneous data integration for power grid digital operation by proposing an intelligent data integration method based on K-medoids clustering. Through systematic theoretical analysis and experimental validation, the following conclusions are drawn:
The method proposed in this paper utilizes FPGA hardware acceleration to significantly improve the efficiency of multisource heterogeneous data acquisition in the power grid, achieving millisecond-level synchronous acquisition with data throughput consistently exceeding 110 MB/s. An improved K-medoids clustering model for optimized data integration: by incorporating a density-weighted Euclidean distance metric and an adaptive medoid selection strategy, the clustering performance of multisource data is significantly enhanced. Experimental results demonstrate that the silhouette coefficient of the integrated dataset exceeds 0.91, outperforming traditional deep learning methods such as residual neural networks, thereby validating the model’s robustness and interpretability in high-dimensional heterogeneous data. Exceptional anomaly detection and fault early warning capabilities: This method efficiently identifies anomalous data during power grid operation and supports millisecond-level fault early warning, offering real-time decision support for power grid operation and maintenance, thereby significantly reducing operational risks caused by data latency or misjudgment.
In summary, this study presents a high real-time and high-reliability data integration and anomaly detection method for power grid digital operation. Its technical framework and empirical findings have significant theoretical and practical implications for the intelligent upgrading of power systems.
Footnotes
Author Disclosure Statement
The author(s) declared no potential conflicts of interest with respect to the research, authorship, and/or publication of this article.
Funding Information
The author(s) received no financial support for the research, authorship, and/or publication of this article.
Data Sharing Agreement
The datasets used and/or analyzed during the current study are available from the corresponding author on reasonable request.