
Abstract
Insomnia is a debilitating condition causing psychological distress and frequently comorbid with other mental health conditions. This study examined the effect of 8 weeks of treatment by broad spectrum micronutrients (vitamins and minerals) on insomnia using a multiple-baseline-across-participants open-label trial design. Seventeen adults were randomized to 1-, 2-, or 3-week baseline periods (14 completed). Self-report measures were the Consensus Sleep Diary–Morning (CSD-M), the Pittsburgh Insomnia Rating Scale (PIRS), and the Depression, Anxiety, Stress Scale (DASS). Baselines were generally stable. Treatment completers reported reliable and clinically significant change in insomnia severity (PIRS), in depression, stress, and anxiety (DASS), and on at least two aspects of sleep measured by the CDS-M. All completers were treatment-compliant, and side effects were minimal. Nutritional supplementation is shown to be a novel, beneficial treatment for insomnia in adults. Follow-up research using placebo-controlled designs as well as comparisons to cognitive-behavioral and other treatments is recommended.
Sleep is vital to human functioning and well-being; nevertheless, insomnia, the persistent inability to get sleep of sufficient length and quality, is a common problem among adults and one of the most prevalent contemporary health problems (Ancoli-Israel & Roth, 1999), estimated to affect 12% to 15% of the adult population and as many as 50% of clients in primary health care settings (Ohayon, 2002). Insomnia is comorbid with many physical (e.g., obesity, cardiovascular disease) and mental illnesses (including anxiety and depression; Pearson, Johnson, & Nahin, 2006), and individuals with insomnia are likely to take more medications, consume more health care resources, be absent from work due to illness more often, and have more work-related and motor vehicle accidents (Ancoli-Israel & Roth, 1999; O’Keeffe, Gander, Scott, & Scott, 2012), making insomnia an enormous health and economic burden worldwide (Taylor, 2008).
Current treatment options for insomnia include pharmacological therapies and cognitive behavioral therapy for insomnia (CBT-I). Pharmacological treatments are the most widely prescribed. Drugs in common use such as anxiolytic benzodiazepines and hypnotics (e.g., zopiclone) affect the GABA neurotransmitter (Sateia & Nowell, 2004). Limitations include daytime impairment and sedation due to slow drug metabolism that interferes with the consumer’s daily functioning, the risk of dependence/addiction and unpleasant side effects, and the production of rebound symptoms upon discontinuation (Sateia & Nowell, 2004). Furthermore, there is limited evidence showing that chronic use is effective long term (Krystal et al., 2010). Widespread concern about long-term effectiveness, habituation, tolerance, and the potential complications of insomnia medications (Krystal et al., 2010; Sateia & Nowell, 2004) has encouraged a search for alternative treatments (Kierlin, 2008). CBT-I targets appropriate sleep hygiene and those behaviors and cognitions that inhibit sleep (Blampied & Bootzin, 2013). Although established as effective (Belanger, Savard, & Morin, 2006; Morin, Culbert, & Schwartz, 1994; Morin et al., 2006), CBT-I relies heavily on the individual having access to a qualified therapist initially and then practicing CBT-I in a sustained way, a challenge for many insomnia suffers. Other complementary and alternative treatments are widely used (Pearson et al., 2006), but effectiveness is not yet clearly established for most (Kierlin, 2008).
Recently, the use of broad-spectrum micronutrients (vitamins and minerals) has emerged as an effective treatment for a range of mental health problems, including stress, anxiety, depression, and neurodevelopmental problems (Adams et al., 2011; Gosney, Hammond, Shenkin, & Allsup, 2008; Kaplan, Rucklidge, Romijn, & Dolph, 2015; Rucklidge & Kaplan, 2013; Schlebusch et al., 2000; Stough et al., 2011). In the course of demonstrating positive effects of micronutrient treatment for attention-deficit/hyperactivity disorder (ADHD) in adults (Rucklidge, Frampton, Gorman, & Boggis, 2014) and children (Gordon, Rucklidge, Blampied, & Johnstone, 2015) and for counteracting the psychological effects of a natural disaster (a major earthquake; Rucklidge et al., 2012; Rucklidge & Blampied, 2011), we encountered many anecdotal reports of a positive effect on insomnia, hence the research reported here.
The idea that micronutrient supplementation might benefit sleep is plausible and supported by a growing body of research. Kaplan and colleagues (Kaplan, Crawford, Field, & Simpson, 2007; Kaplan, Rucklidge, McLeod, & Romijn, 2015) have outlined several possible mechanisms that may explain how micronutrients improve psychological functioning and well-being in general, and possibly insomnia. Vitamins and minerals are well established as cofactors essential for the synthesis and metabolism of neurotransmitters: For example, niacinamide (B3) assists the conversion of tryptophan to serotonin, and pyridoxal 5 phosphate (B6) is a cofactor in the synthesis of dopamine, GABA, and serotonin (Head & Kelly, 2009; Kaplan et al., 2007). Furthermore, the link between insomnia and stress is well established (Bootzin & Epstein, 2011; Wuyts et al., 2012), and vitamin and minerals are strongly involved in regulation of the stress response (Head & Kelly, 2009). Supplementation with nutrients may result in reductions in stress (Rucklidge et al., 2012) and thereby reduce insomnia. This may be especially important at times of high stress because such circumstances impose high nutritional needs (McCann & Ames, 2009) potentially impairing the maintenance of regular circadian rhythms, thereby adversely affecting sleep. Maintenance or restoration of adequate nutrition may, therefore, be particularly important for circadian rhythm recovery following stressful life events—a risk period for insomnia—and nutrient supplementation may be an effective option for treating anxiety and stress associated with insomnia, given the strong evidence of the reciprocal link between them.
There is now considerable research supporting the efficacy of micronutrients in reducing stress in both stressed and nonstressed individuals (Carroll, Ring, Suter, & Willemsen, 2000; Kaplan, Rucklidge, Romijn, et al., 2015; Kennedy et al., 2010; Rucklidge et al., 2012; Rucklidge, Johnstone, Harrison, & Boggis, 2011; Schlebusch et al., 2000; Stough et al., 2011; see Head & Kelly, 2009, for a review). Thus, given the wide range of psychological symptoms that have benefitted from micronutrients and anecdotal reports of the benefit of micronutrients on sleep, it is plausible that insomnia may also resolve through the use of nutritional supplements. This study investigated the use of a commercial micronutrient formulation, Daily Self Defence (DSD), in a group of adults diagnosed with chronic insomnia using a single-case, multiple-baseline-across-participants design as an open-label trial. DSD is a broad-spectrum formula developed for use by the general population; however, the composition and doses represent a revision of EMPowerplus, the most studied nutrient combination for the treatment of psychiatric symptoms (Popper, 2014). DSD contains all the B vitamins identified as being important for stress reduction (Table S1 in the Supplemental Material available online provides a full list of ingredients). Data were analyzed with conventional single-case time-series graphs and also with the Reliable Change Index (RCI; Jacobson & Truax, 1991) and effect size estimates (Lakens, 2013), consistent with a new statistics approach (Cumming, 2012, 2014; Klein, 2013).
Method
Participants
Participants were recruited in Christchurch, New Zealand, between January and November 2013 using advertising on a university campus and Internet health forums and through community health services. Inclusion required participants to meet criteria for insomnia based on the Pittsburgh Insomnia Symptom Questionnaire (PISQ; see the discussion in the measures section), namely trouble either falling asleep or staying asleep at least three to four times per week; this difficulty having lasted at least 4 weeks; and the individual must have rated his or her sleep difficulty as affecting an area of his or her daily functioning at least “quite a bit.” In addition, severity of insomnia was measured using the PIRS (see the discussion in the measures section), and a cutoff score ≥ 98 was required for participation, thus identifying people with insomnia rated at least in the mild to moderate range. Participants had to have been free of psychiatric or sleep medications for at least 4 weeks. Additional exclusion factors (all assessed by self-report) were (a) sleep apnea, (b) pregnant/breastfeeding, (c) having a child under 2 years of age, (d) any neurological disorder involving brain or other central nervous system (CNS) function (e.g., multiple sclerosis, narcolepsy, epilepsy), (e) any serious medical condition for which major medical intervention was anticipated during the trial, (f) having taken an oral antibiotic in the previous 6 weeks, plus (g) judged clinically to be at serious risk for suicide or violence upon review by a senior clinical psychologist (JJR). Criterion g resulted in the exclusion of one participant during baseline. Participants were not otherwise excluded based on the presence of a current psychiatric condition.
Of 51 people who completed the online screening questionnaire, 31 did not meet the PISQ and PIRS cutoff scores for insomnia and 3, who did meet these criteria, declined to participate, leaving 17 adults (age ≥ 18; 15 female) with symptoms of insomnia as participants. A total of 14 completed the baseline phase and entered into the open-label treatment trial, and 12 (11 female) completed the entire trial (the flow of participants through the study is shown in Table S2 in the Supplemental Materials online). Mean age of the sample was 37.7 years (SD = 13.7), with the majority (86%) being of New Zealand European background. Two thirds were students; the other occupations listed were categorized as professional or semiprofessional. Three participants self-reported that they had a current anxiety disorder. No other psychiatric disorders were disclosed.
Following a complete description of the experimental nature of the trial, as well as a review of conventional treatments available, written informed consent was obtained from all participants. The study protocol was approved by the University of Canterbury Human Ethics Committee, and the trial was registered with the Australian New Zealand Clinical Trials Registry (ACTRN12613000364774).
Measures
At baseline and at various points thereafter the participants completed the following measures online using QUALTRICS (www.qualtrics.com).
PIRS
PIRS is a 65-item self-report instrument used to assess severity of insomnia (Moul, Hall, Pilkonis, & Buysse, 2004; Moul, Pilkonis, Miewald, Carey, & Buysse, 2002; Zubia, Ali, & Ejaz, 2014). Items ask about the past 7 days, for example, “In the past week how much were you bothered by one or more awakenings after getting to sleep,” and responses range from 0 (not at all bothered) to 3 (severely bothered). A total score ≥ 130 identifies someone with “moderate” insomnia, and a score of 65 to 130 identifies “mild” insomnia; the cutoff score of 98 is the midpoint between these two points. The RCI for the PIRS = 14.5 (calculated from data in Moul et al., 2004; Zubia et al., 2014). The correlation of the PIRS with the Pittsburgh Sleep Quality Index was reported as .73 (Moul et al., 2002), and Cronbach’s α was .93 (Zubia et al., 2014).
Depression Anxiety and Stress Scale (DASS)
DASS, a 42-item questionnaire consisting of three self-report scales, was used to measure negative emotional states of depression, anxiety, and stress (P. F. Lovibond & Lovibond, 1995). Items ask about functioning or symptoms over the past week, for example, “Over the past week I found myself getting upset by quite trivial things,” rated 0 (did not apply to me at all) to 3 (applied to me very much or most of the time; S. H. Lovibond & Lovibond, 1995). The RCI values were calculated as Depression = 4, Anxiety = 3, and Stress = 4, with clinical cutoff scores of 13, 9, and 18, respectively (from data in Crawford & Henry, 2003). The DASS Depression scale correlates with the Beck Depression Inventory in the range of .74 to .75 (Brown, Chorpita, Korotitsch, & Barlow, 1997; P. F. Lovibond & Lovibond, 1995), the DASS Anxiety scale correlates with the Beck Anxiety Inventory in the range of .81 to .83 (Brown et al., 1997; P. F. Lovibond & Lovibond, 1995), and the DASS Stress Scale correlates with the Penn State Worry Questionnaire at .60 (Brown et al., 1997). Cronbach’s α was .96, .89, and .93 for Depression, Anxiety, and Stress, respectively (Brown et al., 1997).
Expanded Consensus Sleep Diary for Morning (CSD-M)
The CSD-M (Carney et al., 2012) was completed daily in baseline and intervention. Sufficient hardcopies were provided to participants for the next phase at each laboratory visit. The CSD-M is an expanded version of the Consensus Sleep Diary and has 10 items reporting on the preceding night’s sleep (e.g., time in bed, sleep onset latency, duration of total sleep time) plus questions about alcohol, caffeine, and sleep medication intake (Carney et al., 2012). It has a reading difficulty rated at the third grade level (Carney et al., 2012). The CSD-M does not appear to have been validated against objective measures of sleep such as polysomonography, but sleep diaries generally have been so validated (Carney et al., 2012).
PISQ
The PISQ was completed once only, at initial screening. It is a 13-item self-report instrument designed to establish a clinically relevant case definition of insomnia, using insomnia criteria taken from both the Diagnostic and Statistical Manual of Mental Disorders (4th edition) and the International Classification of Sleep Disorders (Okun et al., 2009). The PISQ assesses the presence, frequency, and severity of symptoms, e.g., “During the past month, how many nights or days per week have you had difficulty falling asleep?” and was used to determine the presence of insomnia. For Items 1 to 5, response options range from never to always (5–7 times per week). For Items 6 to 13, a Likert-type scale is used from 0 (not at all) to 4 (extremely). Cronbach’s α was .89, and the scale has diagnostic specificity > 90% (Okun et al., 2009).
Procedure
Once eligibility and informed consent was established, participants were randomly assigned to a baseline phase of 1, 2, or 3 weeks’ duration, followed by an 8-week treatment phase. Participants began completion of the CSD-M daily at the beginning of baseline and throughout intervention. They took six capsules of DSD (the manufacturer’s recommended daily dose) daily during the intervention phase as two doses of three capsules twice a day. Participants completed the PIRS and the DASS online at the beginning and end of baseline and weekly during the treatment phases.
Participants met in the laboratory with the researcher (JL) at the beginning of baseline and at the end of baseline/beginning of intervention and then at intervention Weeks 4 and 8 and were given a $10 petrol voucher at each visit, the only financial incentive provided. At the intervention-phase visits, compliance was assessed and unused pills returned. Three months after completing the intervention phase, participants reported follow-up data by completing the DASS and PIRS online with reference to the preceding week and answering questions about whether they had chosen to continue taking the micronutrients.
Design and data analysis
The multiple-baseline design across participants (Kazdin, 2010) provided for baseline assessment of sleep and well-being for 7 to 21 days and then a staggered entry into the treatment phase. The baseline phase permitted the stability of the measures to be assessed, different baseline durations permitted the detection of any cumulative nonspecific effects of therapist attention and assessment and the assessment of the magnitude of any regression to the mean, and the staggered entry into treatment permitted the replicated detection of changes when and only when treatment began.
The primary outcome measures defined a priori were the CSD-M and the PIRS. The CSD-M provided measures of sleep onset latency, frequency of night waking, total sleep duration, sleep efficiency, and subjective sleep quality. Individual changes in these variables across baseline and intervention phases were analyzed using standard multiple-baseline time-series graphs. Percentage exceeding the median (PEM) was used as a single-case effect size (ES; Ma, 2006). For each variable, medians were calculated for each participant’s baseline phase and used to determine PEM in intervention, calculated as above or below the median to be consistent with the direction of therapeutic change (Ma, 2006; Parker, Vannest, & Davis, 2011). PEM was interpreted using the convention that 70% < PEM < 90% = a moderate ES and PEM > 90% = a large ES (Ma, 2009).
The PIRS provides information about the severity of a broad range of insomnia symptoms. Modified Brinley plots were used to analyze individual changes over time for the PIRS and for the secondary outcome measures of depression, anxiety, and stress (DASS). See Gordon et al. (2015), Jacobson and Truax (1991), and Rucklidge and Blampied (2011) for examples of these plots, termed modified Brinley plots because they show individual data rather than the group mean data presented by Brinley (1965) in his eponymously named plots. Modified Brinley plots show each individual participant’s score in any particular phase relative to another phase as a coordinate pair, with the earlier and later data points as the x-axis and y-axis values, respectively. When clinical cutoff lines and the boundaries of reliable change are displayed on the plot the direction (improvement or deterioration), magnitude and clinical significance of change over time can be classified as illustrated in Figure 1. A treatment effect is evident when scores deviate from the 45º diagonal line in the direction of positive change, that is, below the diagonal line for both the PIRS and DASS. Clinically significant change is shown when a participant’s data point lies outside the lower bound of both the RCI (reliable change set at p < .05; Jacobson & Truax, 1991) and below the clinical cutoff for the measure.

This template illustrates key features of a modified Brinley plot. In each plot the solid diagonal line marks the line of no effect. The dashed diagonal lines show the upper and lower boundaries of the Reliable Change Index (RCI). Vertical and horizontal lines mark the clinical cutoffs for each measure. Where the direction of clinical improvement is a reduction in the measure (indicated by the arrowhead on the vertical clinical cutoff line) the zones on the graph formed by the intersections of the line of no effect and the clinical cutoffs can be interpreted as shown. The upper and lower boundaries of the RCI can be used to determine if change is significantly (p < .05) larger than that expected by measurement error alone.
For the PIRS and DASS, outcome was also judged using the ES measures Cohen’s drm and the common language effect size (CLES; Lakens, 2013). For the within-subjects design, drm adjusts the ES for the correlation between scores at each measurement time, and the CLES gives the likelihood (expressed as a percentage) that after controlling for individual differences any participant will have an improved score at the second measurement.
Results
Of the 51 individuals who were initially assessed, 34 did not meet eligibility criteria for sufficiently severe insomnia (n = 31) or withdrew (n = 3). Of the remaining 17, 5 participants each were assigned 1- and 3-week baseline periods, and all 10 completed the baseline and intervention phases. Seven were assigned a 2-week baseline, but only 2 completed baseline and intervention, with exclusion (1) and drop-out (2) during baseline due to perceived suicide risk and life stress, respectively, and 2 dropping out during intervention due to headache and gastric side effects (1) and perceived lack of efficacy (1). Of the 12 participants who began the intervention, 9 completed the follow-up questionnaires. Reported side effects among completers included mostly gastric and headache symptoms and were mild and transitory. Compliance with the intervention was defined as consuming at least 80% of the total supplied capsules. Eight participants reported 100% capsule consumption, 2 missed three capsules, and 2 missed consuming 10% of their capsules.
At the end of the intervention phase, complete data sets for the CSD-M and the PIRS and DASS had been supplied by 12 and 10 participants, respectively. The diary data were plotted for each participant each night as separate multiple-baseline time series (Cooper, Heron, & Heward, 2007) for each CSD-M variable. PEM, used to judge the outcomes of the intervention, showed (Table 1) that 2 participants (P11 and P13) reported no substantive effect of the intervention for any sleep diary measure. Of the rest, moderate to large effects were reported on sleep onset latency for 5 participants and on night waking and sleep quality by 6 participants. Nine participants reported moderate to large effects for total sleep time and sleep efficiency [sleep efficiency percentage
Percentage Exceeding the Median (PEM) for Each Participant and Each Dependent Variable From the Consensus Sleep Diary–Morning
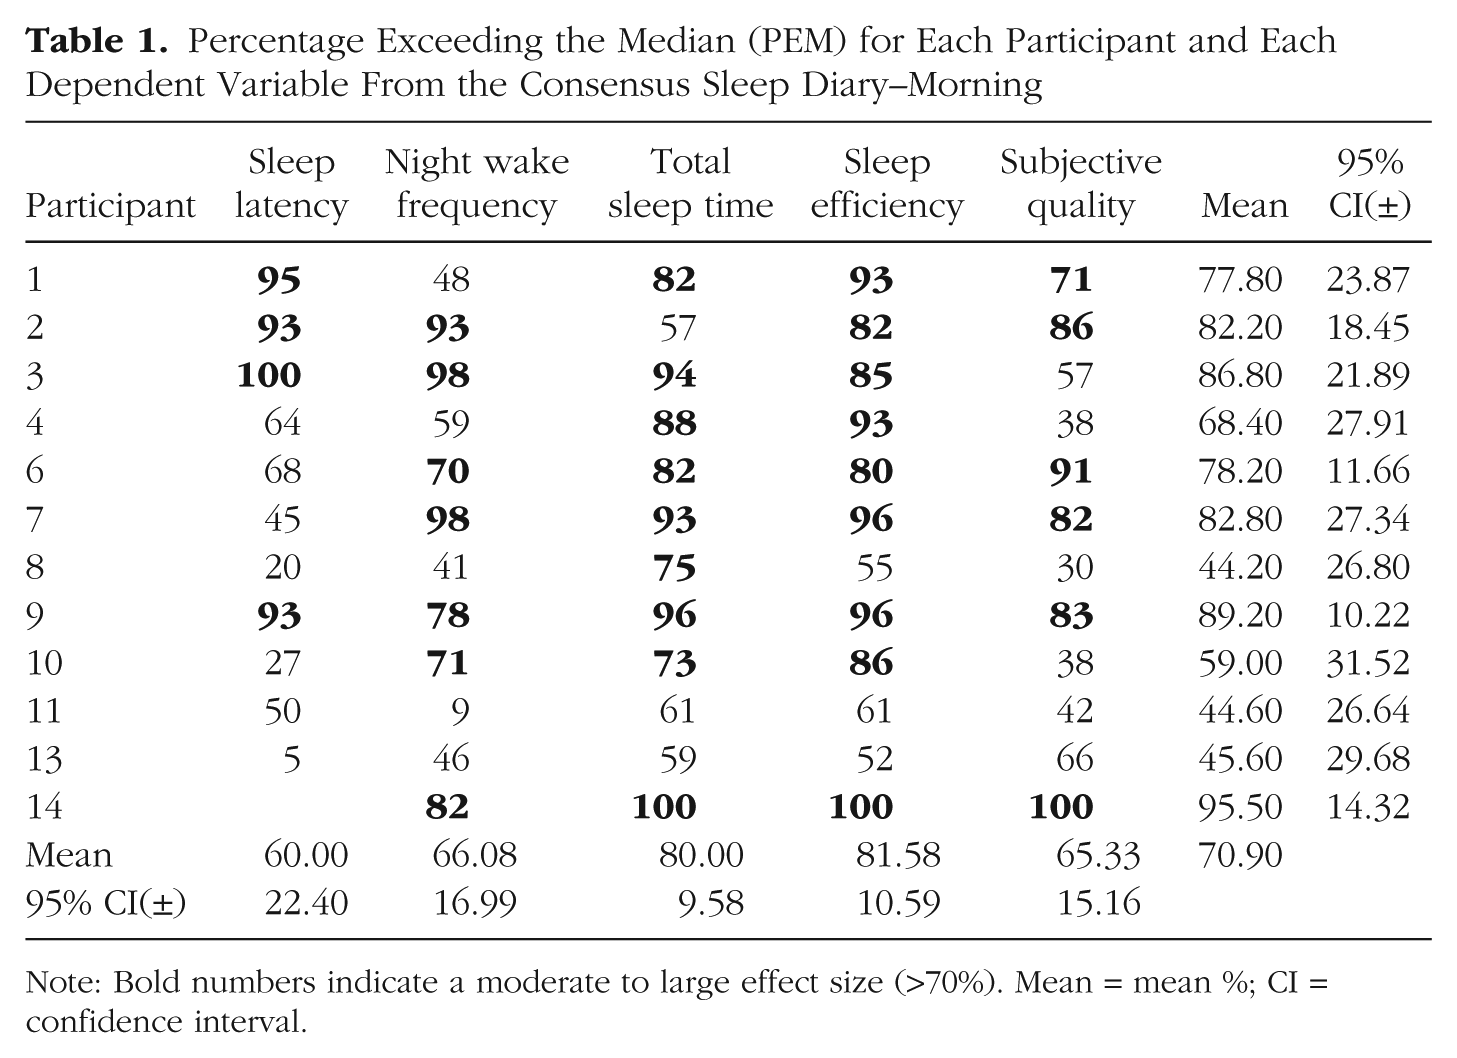
Note: Bold numbers indicate a moderate to large effect size (>70%). Mean = mean %; CI = confidence interval.

Time-series graphs of diary self-reported percentage sleep efficiency (Total time asleep/Total time in bed × 100) for each participant. The vertical line marks the transition from baseline to intervention condition at 1, 2, or 3 weeks in the multiple baseline. The horizontal line marks the 85% sleep efficiency criterion. The percentage reports the percentage exceeding the median (PEM) single-case effect size for each participant.
Conventionally, SE% < 85% is regarded as problematic (Spielman, Saskin, & Thorpy, 1987), and this threshold is shown in Figure 2 as a horizontal line. Only 3 participants (P1, P2, & P6) were at or above this criterion in baseline; these participants nevertheless showed a positive effect of intervention in that variability in SE% was reduced whereas high levels of SE% were maintained. Participants P3, P7, P9, and P14 showed positive changes in the level and trend of their data within the first 7 days of treatment, whereas P4 and P10 improved more gradually. Of the 3 who did not show substantive improvement overall, P8 had baseline SE% between 80% and 85% and maintained this in the intervention phase, and P11 often achieved SE% above 85% from about halfway through intervention; only P13 showed no beneficial effects of treatment on SE%. Taken together, the time-series data summarized in Table 1 and exemplified in Figure 2 show that 11 out of 12 participants (90%; 65% on an intent-to-treat basis) experienced positive effects on one or more aspects of nightly sleep following treatment with micronutrients.
Figure 3 summarizes the effects of micronutrient treatment on insomnia symptoms as measured by the PIRS and the DASS. Figure 3a addresses the question of the stability of insomnia symptoms in baseline, and shows that, relative to their initial PIRS score, participants showed little change when PIRS scores were remeasured after 1, 2, or 3 baseline weeks. Three participants, all from the 3-week baseline group, reduced their PIRS score to at or just below the clinical cutoff, but for one of these the change was not reliable (i.e., did not fall below the lower RCI limit). Given that the baseline was stable, each participant was assigned a mean baseline PIRS score for further analysis, shown in Figures 3b and 3c.
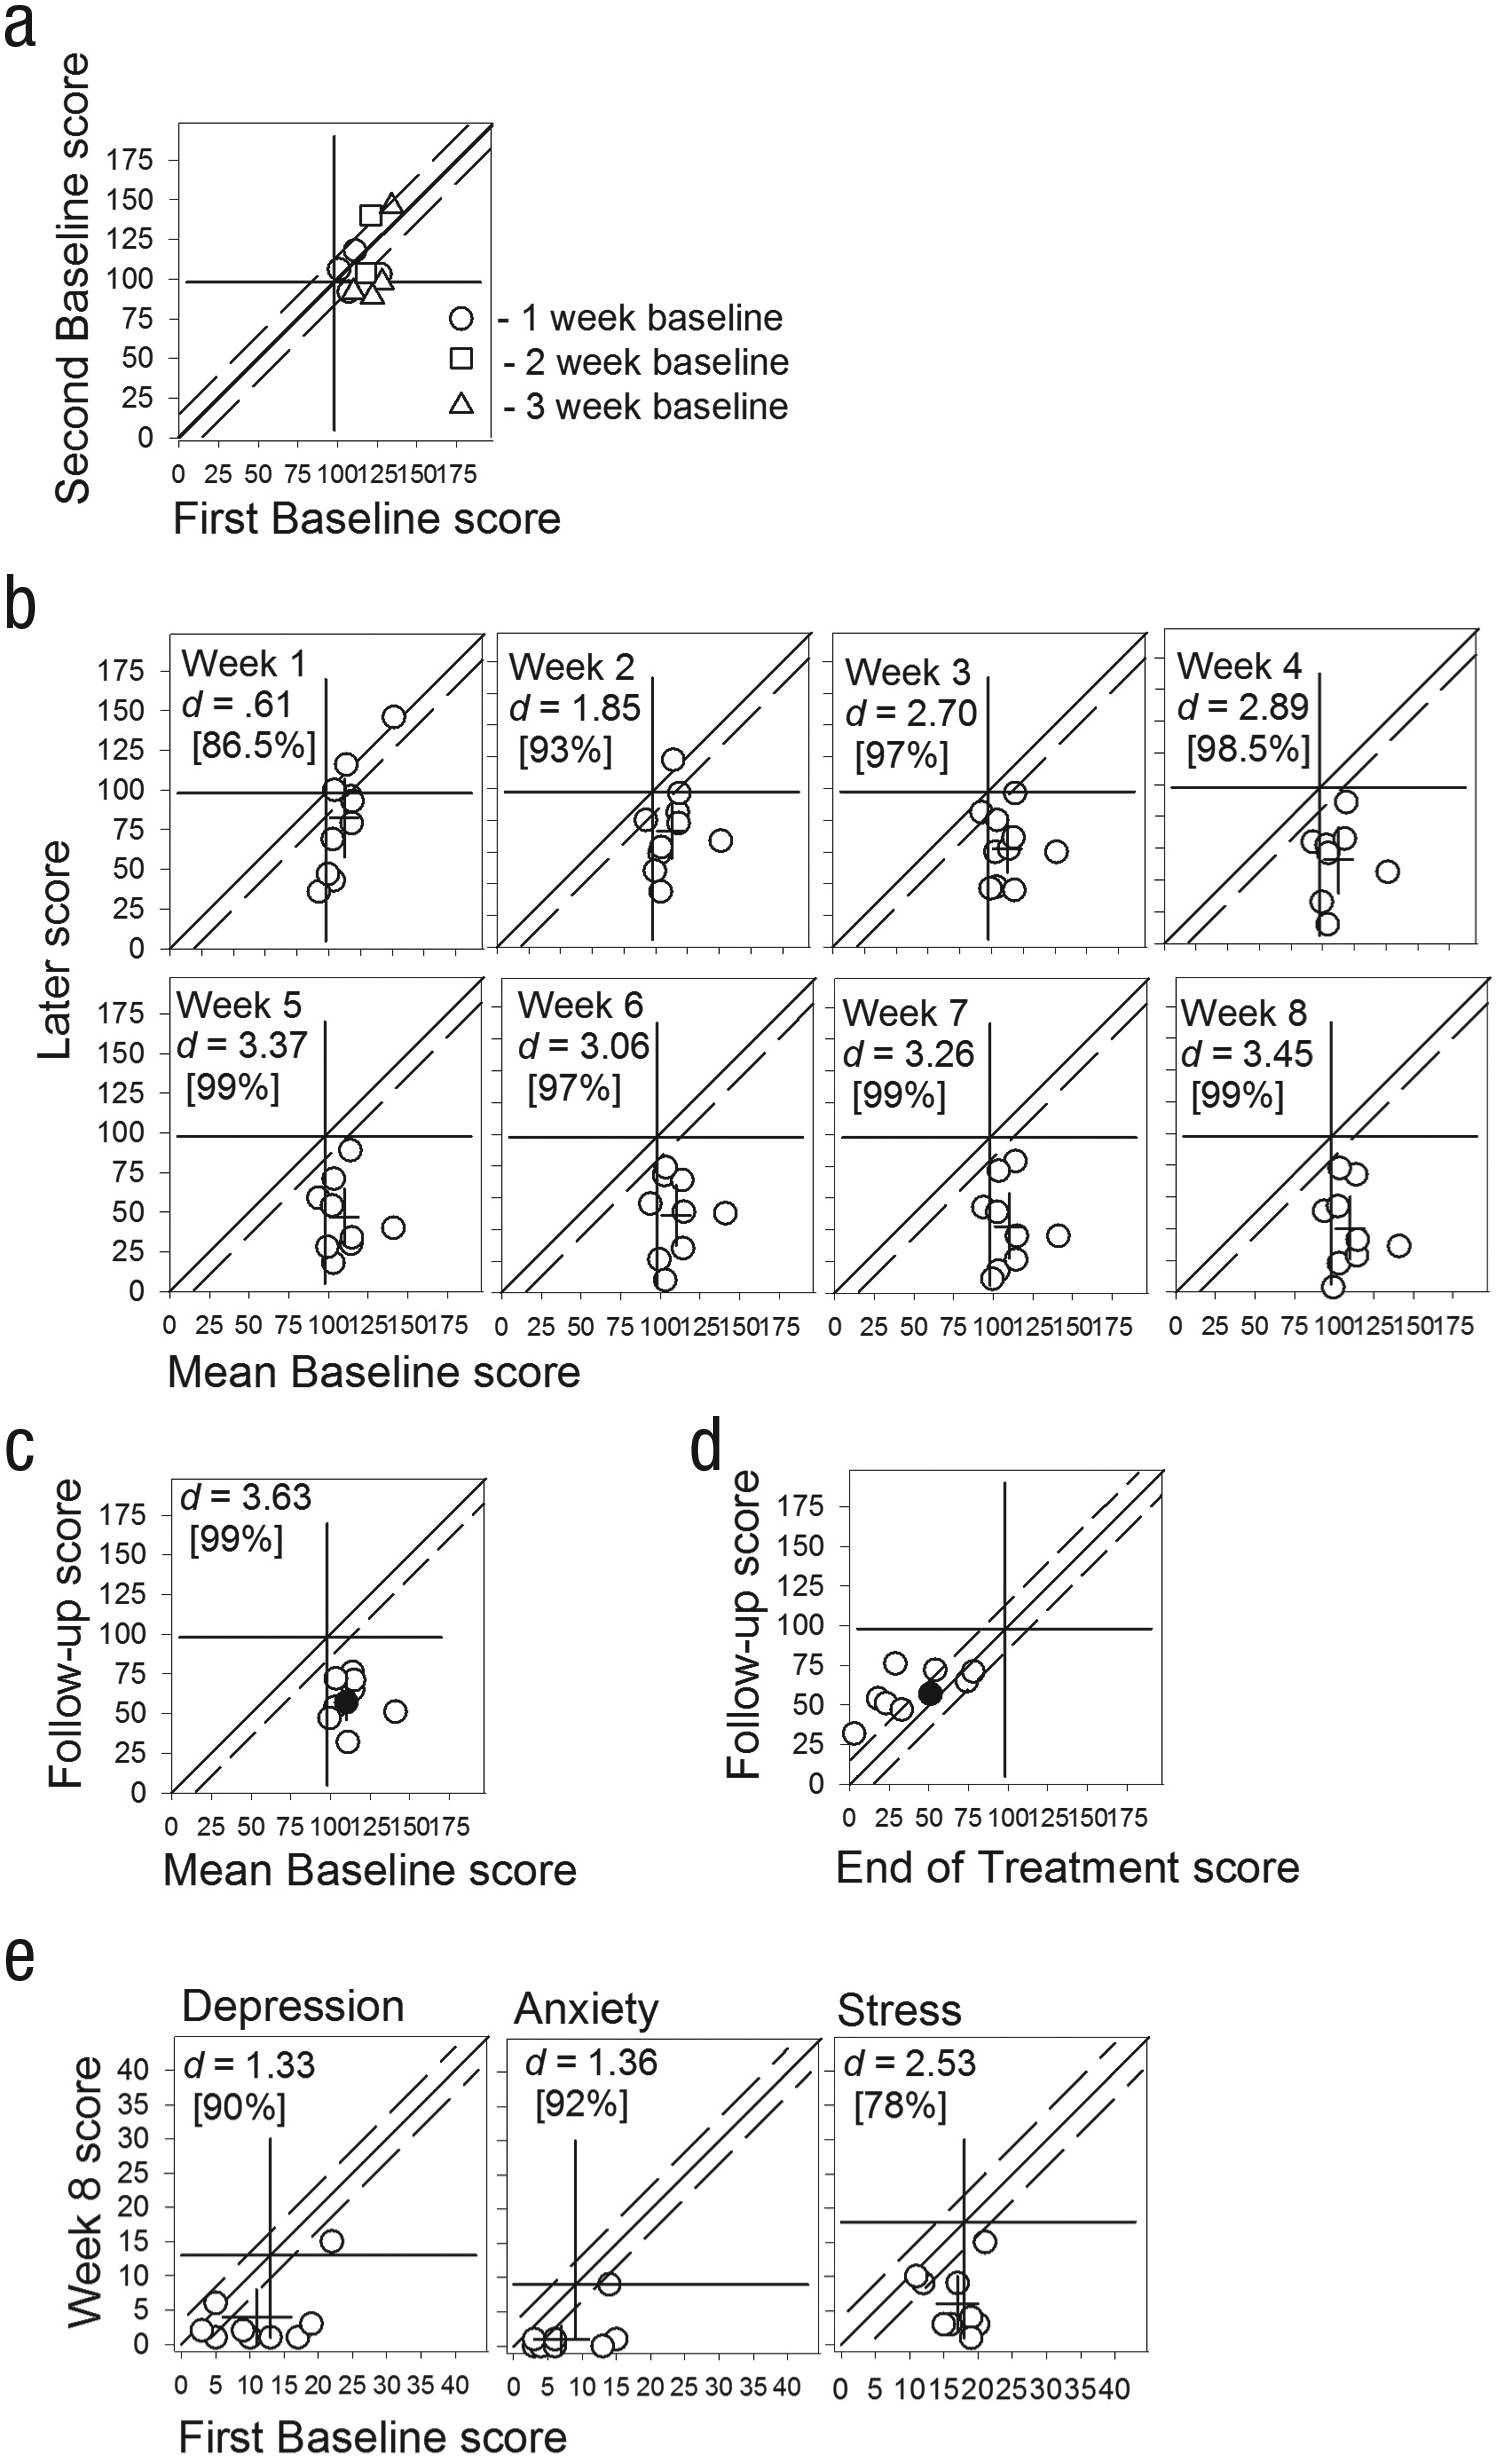
Data from the Pittsburgh Insomnia Rating Scale (PIRS; plots a–d) and the Depression, Anxiety, Stress Scale (DASS; plot e) as modified Brinley plots. Interpretation of the plots is as for Figure 1; note that in some plots only the lower boundary of the Reliable Change Index (dashed diagonal line) is shown parallel to the solid diagonal line of no effect. Each data point is an individual’s data at the time indicated by the x and y axis labels. (b), (c), and (e) also show the x and y axis means as the center of a cross, with the length of the cross arms = 95% confidence interval of the mean. (a) shows the stability of PIRS baseline scores over 1, 2, or 3 weeks of baseline. (b) shows changes in PIRS scores across Weeks 1 to 8. Also shown are the effect sizes (Cohen’s drm) and the common language effect size (in square brackets). (c) shows the PIRS scores at 3-month follow-up relative to the mean baseline scores, and (d) shows the PIRS follow-up scores relative to Week 8 (end of treatment). (e) shows changes in DASS Depression, Anxiety, and Stress at Week 8 relative to the initial baseline score, plus the effect sizes at Week 8.
Figure 3b tracks each individual’s change over time across each week of the intervention phase. Also shown for each week is Cohen’s drm and the CLES, indicating the percentage of improvement. Relative to the degree of change shown over up to 3 baseline weeks, the change evident after 1 week of treatment is substantial, with five participants showing reliable clinical change (i.e., below the clinical cutoff and outside the lower RCI limit). By Week 4 all participants showed reliable clinical change, with large ESs. From this week on the pattern of improvement remained relatively stable, with participants showing either moderate change or substantial change relative to their mean baseline score. Note also that from Week 3, the 95% CI on the y-axis mean does not cut either the lower bound of the RCI nor the clinical cutoff, meaning that from this point on the mean response was clearly in the nonclinical range. Figure 3c shows that this individual and group improvement was sustained at follow-up, even though at that point only one participant (shown as a filled circle in Fig. 3c) continued to take micronutrients; the others desisted largely due to cost and difficulties with supply. Figure 3d (after Stunkard & Penick, 1979) shows change at follow-up relative to status at the end of treatment, and reveals that most individuals deteriorated slightly during the follow-up period, although they all remained in the nonclinical range.
Changes in depression, anxiety, and stress symptoms are shown in Figure 3e. An analysis of changes over baseline (comparable to Fig. 3a; see Fig. S6 in the Supplemental Materials available online) showed that depression and anxiety were stable over baseline and that only three participants were above the clinical cutoff. Participants’ stress was also stable in baseline, but scores clustered closely about the cutoff (initial baseline stress M = 17, SD = 3.5). Figure 3e shows change at Week 8 relative to initial baseline assessment, where the variability was slightly higher and thus the individual data points are somewhat more dispersed on the x-axis, making the graph easier to interpret (the pattern of data shown would change very little if mean baseline scores had been used instead). Depression, anxiety, and stress all reduced to nonclinical levels by Week 8 of treatment, except for one participant whose depression was reliably improved but remained just above the clinical cutoff. These improvements were largely maintained at follow-up, except for three participants whose anxiety and stress had returned to clinical levels. Figures S5 and S6 in the Supplemental Material available online show respectively changes in insomnia severity (PIRS) as a function of the multiple-baseline design, and changes in depression, anxiety, and stress (DASS) over time.
Given that micronutrients had a large mean effect on stress (Cohen’s d = 2.53) and that there is a well-established link between insomnia and stress, is it possible that changes in insomnia were in response to the reduction in stress? This was examined by calculating for each individual each week an improvement score for both insomnia symptoms and stress and taking the average improvement each week. The improvement score is the difference between the weekly score and the mean baseline standardized by the standard deviation in baseline. At Week 1 the mean scores for insomnia and stress were equal, respectively 3.14 and 3.07. Thereafter, improvement in insomnia always outpaced stress, so that by Week 4 the mean scores were respectively 6.16 and 4.12, and 9.46 and 5.27 at Week 8. This does not support the idea that changes in insomnia were a consequence of stress reduction because if that were the case we would expect stress to have improved first, with insomnia improvement being delayed until later in treatment. Figure S7 in the Supplemental Material available online shows changes in individual and weekly mean improvement scores over the 8 weeks of treatment.
Discussion
This study investigated an innovative intervention for the treatment of insomnia in adults over an 8-week period by having participants consume a broad-spectrum micronutrient formula. No psychological therapy was provided. This was associated with improvements in insomnia symptoms, mood, stress, and anxiety during the trial. Specifically, the group mean insomnia severity rating (as measured by the PIRS) dropped from 109.8 at baseline to 40.33 with large ES (Cohen’s d = 3.45, CLES 99%). The reliability of this result was further supported by 100% of completing participants showing reliable positive change (Jacobson & Truax, 1991), indicating that this treatment effect is unlikely to be due to measurement error.
Improvement in insomnia symptoms was also observed based on the daily sleep diaries in that 5 out of 12 (42%) participants who completed treatment showed a moderate or large treatment effect on measures of sleep onset latency, 6 (50%) showed a moderate or large treatment effect on frequency of night waking, and 9 (75%) showed a moderate or large treatment effect on total sleep duration. Daily sleep diary data also confirmed that 9 (75%) treatment completers also showed a moderate or large treatment effect on sleep efficiency and 6 (50%) showed a moderate or large treatment effect on subjective sleep quality. Micronutrient consumption was also associated with reduction in levels of stress, anxiety, and depression, with effects sizes all being classified as large (>.8), and the CLES all >50%. These findings are consistent with other research trials showing that micronutrients improve psychological functioning such as mood and anxiety (Gosney et al., 2008; Harris et al., 2011).
Intervention with the micronutrient supplement was associated with generally mild side effects, showing that micronutrients have a minimal side effect profile when compared with pharmacological treatments, which is consistent with other adult studies (Rucklidge et al., 2012; Rucklidge et al., 2014). Of the 12 completing participants, all were compliant with the treatment protocol.
Although the exact causes of an individual’s insomnia undoubtedly vary, the majority of research identifies heightened arousal, anxiety, worry, and rumination as being leading factors in sleep disruption (Bootzin & Epstein, 2011). Events that are emotionally stressful have been found to impact sleep quality and well-being, and are believed to do so through triggering cortical and emotional arousal (Wuyts et al., 2012). Anxious-ruminative personality traits, life stressors, homeostasis-weakening mechanisms, and CNS hyperarousal have all been identified as additional factors (Basta, Chrousos, Vela-Bueno, & Vgontzas, 2007). It is therefore plausible that through enhancement of the synthesis and activity of neurotransmitters and the continuous availability of an abundance of micronutrients, CNS hyperarousal may be reduced and the individual’s ability to process emotional stress may be enhanced (Kaplan & Leung, 2011; McCann & Ames, 2009). It is notable that the most consistent effect of micronutrients on the DASS measures was on reported levels of stress, which fits with the known reciprocal link between stress and insomnia (Bootzin & Epstein, 2011; Wuyts et al., 2012). Reduction in stress, however, did not directly mediate the improvement in sleep, as sleep improved more rapidly than did stress after the first treatment week.
The open-label nature of the trial and the lack of placebo control are both limitations to this study, although the multiple-baseline design controlled for nonspecific therapy effects, such as regular therapeutic input, contact with the therapist, and repeated assessment of symptoms, and the stability of symptoms in baseline precludes an explanation in terms of regression-to-the-mean effects. Both the participant and researcher were aware that they were in active intervention, and this can make both parties susceptible to expectancy effects, although most participants showed some delay in treatment response after beginning the nutrient intervention, and even those who showed an initial improvement mostly showed only a small effect, which increased in size the longer the individual was taking the micronutrients. Furthermore, the ESs observed were substantially larger than those reported for placebo conditions in a meta-analysis (Grissom, 1996). Multiple-baseline designs can incorporate placebo control and blinding of participants and researchers (France, Blampied, & Wilkinson, 1999), and this should be done in future research.
Spontaneous remission of symptoms must also be considered; however, given that a majority of participants experienced a therapeutic effect despite experiencing chronic insomnia, it is unlikely that spontaneous remission is responsible for the positive effect observed. Also, the pattern of change observed, that is, generally stable baselines with improvements evident only during the intervention phase, makes spontaneous remission of symptoms an unlikely explanation for the benefits observed.
As many people seek alternative treatments for insomnia and other mental health difficulties because of the limited availability and financial costs of psychotherapy and the side effects and long-term impact of conventional pharmacotherapy, further options for treating these difficulties deserve exploration (Rucklidge & Kaplan, 2013). This study was designed to detect an intervention effect (Haig, 2014) rather than test hypotheses about potential mechanisms of action of micronutrients, hence metabolic levels of vitamins and minerals were not measured, although it would be desirable to do so in any future studies. Further research should initially attempt a direct replication with placebo control to establish the reliability and replicability of the research findings. Randomized controlled trials, reversal trials, and effectiveness trials (where the intervention is tested in a clinical environment) could all be used to systematically establish the replicability of the effect found in the study. Generality should be explored through systematic replication, where various attributes of the participants (e.g., age, gender) or of the treatment (e.g., formulation, dosage, length of intervention) are systematically varied, and the effect on the treatment outcome is examined. Also, because the participants were primarily women, we cannot confidently determine whether the results would apply equally to men.
Only one individual stayed on the micronutrients for the follow-up period, and therefore we could not establish if there was any long-term benefit of continuing with micronutrients. Reasons stated for not continuing taking micronutrients included cost, access, and life stress. The follow-up period, therefore, became a natural reversal design and showed that the majority of participants demonstrated some deterioration back toward baseline, although this was still only moderate after 3 months. As with pharmacotherapy, the current research of micronutrients has not yet systematically documented their long-term safety over years and decades (Rucklidge & Kaplan, 2013) although there are naturalistic reports of continued benefit over years with no adverse effects (Simpson et al., 2011). That the formula provided nutrients above the recommended daily allowance (RDA) may be of concern for some; however, although the RDA is well established as identifying levels required to prevent a frank nutritional deficiency, it may not be applicable for the treatment of psychological symptoms or for ensuring optimal functioning (Benton, 2013). The specified upper limit of consumption for a nutrient is the more important marker than the RDA for ensuring safety. Trialing longer intervention phases and varying doses would be useful to investigate under which conditions the therapeutic effect plateaus and to determine the dose-response relationship. It is certainly plausible that the optimum therapeutic dose varies between individuals, and perhaps some would respond better at a higher dose than used in the current study.
Supplemental Material
BlampiedFigS1 – Supplemental material for Effect of Micronutrients on Insomnia in Adults
Supplemental material, BlampiedFigS1 for Effect of Micronutrients on Insomnia in Adults by Joanna Lothian, Neville M. Blampied and Julia J. Rucklidge in Clinical Psychological Science
Supplemental Material
BlampiedFigS2 – Supplemental material for Effect of Micronutrients on Insomnia in Adults
Supplemental material, BlampiedFigS2 for Effect of Micronutrients on Insomnia in Adults by Joanna Lothian, Neville M. Blampied and Julia J. Rucklidge in Clinical Psychological Science
Supplemental Material
BlampiedFigS3 – Supplemental material for Effect of Micronutrients on Insomnia in Adults
Supplemental material, BlampiedFigS3 for Effect of Micronutrients on Insomnia in Adults by Joanna Lothian, Neville M. Blampied and Julia J. Rucklidge in Clinical Psychological Science
Supplemental Material
BlampiedFigS4 – Supplemental material for Effect of Micronutrients on Insomnia in Adults
Supplemental material, BlampiedFigS4 for Effect of Micronutrients on Insomnia in Adults by Joanna Lothian, Neville M. Blampied and Julia J. Rucklidge in Clinical Psychological Science
Supplemental Material
BlampiedFigS5 – Supplemental material for Effect of Micronutrients on Insomnia in Adults
Supplemental material, BlampiedFigS5 for Effect of Micronutrients on Insomnia in Adults by Joanna Lothian, Neville M. Blampied and Julia J. Rucklidge in Clinical Psychological Science
Supplemental Material
BlampiedFigS6 – Supplemental material for Effect of Micronutrients on Insomnia in Adults
Supplemental material, BlampiedFigS6 for Effect of Micronutrients on Insomnia in Adults by Joanna Lothian, Neville M. Blampied and Julia J. Rucklidge in Clinical Psychological Science
Supplemental Material
BlampiedFigS7 – Supplemental material for Effect of Micronutrients on Insomnia in Adults
Supplemental material, BlampiedFigS7 for Effect of Micronutrients on Insomnia in Adults by Joanna Lothian, Neville M. Blampied and Julia J. Rucklidge in Clinical Psychological Science
Footnotes
Acknowledgements
The authors thank the participants for their careful daily monitoring of their sleep and their willingness to consume substantial numbers of capsules daily. Joanna Lothian is now at Psychological Services, Department of Corrections, Christchurch, New Zealand.
Declaration of Conflicting Interests
The authors declared that they had no conflicts of interest with respect to their authorship or the publication of this article.
Funding
The authors thank Nutratek, Raymond, Alberta, Canada, for donation of the micronutrients. The University of Canterbury provided financial support for the research.
References
Supplementary Material
Please find the following supplemental material available below.
For Open Access articles published under a Creative Commons License, all supplemental material carries the same license as the article it is associated with.
For non-Open Access articles published, all supplemental material carries a non-exclusive license, and permission requests for re-use of supplemental material or any part of supplemental material shall be sent directly to the copyright owner as specified in the copyright notice associated with the article.