




Abstract
Major depression is a heritable disorder that is commonly treated with selective serotonin reuptake inhibitors. However, no study has quantified the overlap in genetic effects between pretreatment depression severity and treatment response and the extent to which genetic effects could be attributed to variation in the dopaminergic and serotonergic systems (DA/5-HT). Data (N=1618) from the clinician-rated Hamilton Rating Scale of Depression and the clinician-rated Quick Inventory of Depressive Symptomatology were obtained from participants of European ancestry in the Sequenced Treatment Alternatives to Relieve Depression clinical trial. Genetic variants explained 31%–64% of the variance across assessments of pretreatment depression severity and treatment response. However, effects from the DA/5-HT systems genes were negligible. There was also limited evidence for genetic overlap for pretreatment depression severity and treatment response. Despite the clear genetic contributions to these depression phenotypes, different genetic factors may contribute to depression severity and treatment response.
Major Depressive Disorder (MDD) is a pervasive disorder (Kessler et al., 2012; Kessler & Bromet, 2013) with substantial economic costs (Kessler, 2012). Treatment of MDD with antidepressant medication is very common, with selective serotonin reuptake inhibitors (SSRIs) being the most prescribed class of medication (Olfson et al., 2002). Approximately 50% of depressed adults will respond to antidepressant treatment, and only one third will achieve symptomatic remission (Trivedi et al., 2006). Thus, there is significant variability in response to antidepressant treatment among people diagnosed with MDD.
Genetic variation likely contributes to baseline depression severity and the change in severity observed during the course of treatment. There is familial aggregation of MDD (Klein, Lewinsohn, Seeley, & Rohde, 2001), and familial concordance to citalopram treatment response has also been observed (Franchini, Serretti, Gasperini, & Smeraldi, 1998; Serretti, Franchini, Gasperini, Rampoldi, & Smeraldi, 1998). Genome-wide association studies (GWASs) have identified single nucleotide polymorphisms (SNPs) that putatively contribute to depression symptoms (Wray et al., 2012) and antidepressant treatment response (Laje & McMahon, 2011). However, these identified SNPs, when considered in isolation, explain a very small proportion of the variance in these phenotypes (less than 1% of variance).
A recently developed bioinformatics technique, Genomic-Relatedness-Matrix Restricted Maximum Likelihood (GREML; implemented in genome-wide complex trait analysis, GCTA), allows for the estimation of genetic effects accounted for by the aggregate of SNPs (Yang, Lee, Goddard, & Visscher, 2011). Univariate GREML uses genetic relatedness among individuals to estimate variance in a phenotype. Bivariate GREML estimates the genetic variance of each phenotype as well as the genetic covariance among phenotypes that can be captured by all SNPs. Because it estimates the aggregated effects of the SNPs, GREML does not tell us which of the individual genotyped SNPs contribute to the phenotype. However, subsets of SNPs (e.g., candidate SNPs based on candidate gene lists, genomic regions, or chromosomes) can be examined to identify relative contributions.
To date, a number of studies have utilized GREML to study the genetic etiology of MDD. Variation in common genetic polymorphisms explained 32% of the variance in the presence versus absence of MDD (Lubke et al., 2012) and 51% of the variance in age at onset of MDD (Power et al., 2012). Understanding genetic contributions to depression from an etiological standpoint may also shed light on differences in treatment responsiveness. For example, other studies (Lee, DeCandia et al., 2012; Tansey et al., 2013) have used GREML to attribute 42% of the variance in antidepressant treatment response (adjusted for initial severity) to common SNPs.
Given that genetic variability appears to contribute to depression pathology and antidepressant treatment response, an important question that remains unanswered is the extent to which genetic contributions to symptom change and initial depression severity overlap. Likewise, it is necessary to determine whether candidate systems—in particular, the dopaminergic and serotonergic systems (DA/5-HT), which are major components of the monoamine system (Fournier et al., 2010; Ruhe, Mason, & Schene, 2007)—play a significant role in depression severity and treatment response.
Participants from the Sequenced Treatment Alternatives to Relieve Depression (STAR*D) present a unique opportunity to explore the sharing of genetic influences across depression severity and change in symptoms. The current study builds on previously reported STAR*D analyses (Hunter et al., 2013; Tansey et al., 2013; Uher et al., 2013) by (a) examining the relative contribution of a subset of genes within the dopaminergic and serotonergic systems across established indices of depression severity (i.e., the Hamilton Rating Scale for Depression, HRSD; Hamilton, 1960; and the clinician-rated Quick Inventory for Depression Symptomatology, QIDS-C; Rush et al., 2003) and (b) determining whether common genetic factors influence initial depression severity and change in depression following antidepressant treatment. Further, we examine if these effects are consistent across the HRSD and QIDS-C. We hypothesized that there would be some overlap in the genetic liability to initial depression and response to citalopram, which has been shown to modulate monoamine levels (Marsteller, Barbarich-Marsteller, Patel, & Dewey, 2007).
Materials and Methods
Participants
The current study utilized a large sample of unrelated participants selected from Level 1 of the completed STAR*D study (Rush et al., 2004; Rush et al., 2006). Analyses were limited to a subset of the 1,948 individuals (out of the original 4,041 treatment-seeking individuals) who provided DNA samples. Genetic data were obtained from the Center for Collaborative Genomic Studies on Mental Disorders (http://www.nimhgenetics.org). Genotyping for 500,453 markers on the 1,948 subjects was conducted on two platforms. Nine hundred and sixty-nine subjects were genotyped at Affymetrix on the Human Mapping 500K Array Set. The remaining 979 samples were genotyped using the Affymetrix Genome-Wide Human SNP Array 5.0. Validation using 12 samples genotyped on both the 500K and 5.0 Arrays showed greater than 99% concordance in genotyped markers across the platforms (Garriock et al., 2010).
Genotyping quality control (QC) and population stratification control
QC was done using SNP & Variation Suite v7.7.3 (Golden Helix, Inc., Bozeman, MT; www.goldenhelix.com). Genotyping QC criteria for retaining markers were as follows: minor allele frequency > 1%, hardy Weinberg equilibrium p value > 1E-4, and genotyping call rate ≥ 98%.
Analyses focused on a subset of individuals of European ancestry identified via genomic principal component analyses (PCAs). Participants who were more than 2 SDs away from the mean on the first ancestral principal component (APC) that distinguished subjects of European and African ancestry were excluded from the current analysis. PCA reduced the sample from a mixed population of 1,948 individuals to a more homogeneous population of 1,618 subjects of European ancestry. Application of the genotyping QC criteria to the 1,618 subjects identified 357,589 markers (350,037 autosomal SNPs) from 1,617 individuals (one individual was removed due to a low genotyping rate). The sex-check option in Plink (Purcell et al., 2007) was used to confirm gender based on heterozygosity rates using X chromosome data. Twenty-nine gender reports in the phenotype file did not match the gender identified by Plink. Information for these subjects was corrected based on the genetic observations.
To assess the additive genetic contribution of the DA/5-HT systems, we identified 83 genes that putatively influence serotonin and dopaminergic function to explain variance in the study phenotypes (see Table S1 in the Supplemental Material available online for a list of all 83 genes and references supporting the dopamine and serotonin pathways; see also Rubino et al., 2015). A total of 1,573 autosomal SNPs (i.e., on chromosomes 1–22) were within 20 Kb of 80 autosomal genes on the candidate gene list (i.e., not located on the X chromosome; variants in proximity to the three genes on the X chromosome were not included in our analyses). GREML analyses were conducted using all genotyped autosomal SNPs (350,037) simultaneously and subsets of SNPs (markers not in the dopaminergic and serotonergic systems gene set are referred to as “All Others”).
Depression phenotypes
The primary study outcomes were as follows: (a) depression severity prior to treatment (measured using the HRSD and QIDS-C), (b) change in severity over the course of treatment (reflecting proportional improvement from enrollment until the last observation taken over the course of treatment [i.e., last observation carried forward]), and (c) remission/response (i.e., a categorical variable based on clinical definitions of remission [posttreatment HRSD ≤ 7] and response [50% or greater change in QIDS-C]) (Trivedi et al., 2006).
Estimation of variance and covariance explained by genome-wide SNPs
GREML was used to conduct univariate and bivariate analyses of the phenotypic variances and covariances, respectively. GREML uses chance genetic similarity across numerous SNPs to predict phenotypic similarity across individuals and produces a variance estimate that serves as a low-bound estimate of the genetic variance of a phenotype. The GREML approach consisted of two steps in which the genetic similarity between all pairs of individuals was obtained via a pairwise genetic relationship matrix (GRM; based on the genome-wide SNPs), followed by construction of a mixed-effects model using genetic similarity as a random effect to predict the variance in each phenotype and the covariance among phenotypes. To limit the possibility of genetic effects that are confounded by common environmental factors, analyses were further restricted to 1,361 unrelated individuals (i.e., one of each pair of persons who were no more related than second cousins were systematically removed to maximize sample size; GRM cutoff of 0.05). Analyses were executed in the full (N = 1,617) and unrelated (N = 1,361) set of subjects to assess any bias that could be attributed to cryptic relatedness.
Univariate models were fitted to each phenotype to derive the SNP heritability (h2SNP) using (1) all autosomal SNPs, (2) the set of SNPs in and around the dopamine/serotonin systems gene set (versus All Other SNPs), and (3) SNPs across individual chromosomes (with confidence intervals [CIs] around R2 for chromosomal effects computed using R2; Steiger & Fouladi, 1997). Results from the univariate models determined whether it was worth examining stratified effects (i.e., by gene set) in the bivariate models. The correlation of additive genetic effects between initial severity, change in severity, and remission/response was determined using bivariate GREML (Lee, Yang, Goddard, Visscher, & Wray, 2012). Six models were fitted to the full and unrelated samples to demonstrate the effects of the following covariates (i.e., Model I, with no covariates; Model II, controlling for number of weeks in treatment [log-transformed (log[number of weeks in treatment + 1])]; Model III, controlling for age; Model IV, controlling for gender; Model V, controlling for APCs [to account for residual population stratification and/or batch effects]; and Model VI, controlling for all covariates). Number of weeks in treatment was included as a log-transformed covariate to account for individual differences in treatment course. In general, longer participation in the STAR*D study resulted in a greater reduction in depression severity (e.g., rHRSD change in severity-weeks in treatment = 0.35; 95% CI = [0.30, 0.40]); a majority of the sample used in the analyses (89%; n = 1,438) participated in the studies for 6 or more weeks, 5% (n = 85) for 4 to 6 weeks, 4% (n = 59) for 2 to 4 weeks, and 2% (n = 33) for 0 to 2 weeks, with similar rates observed in the subset of unrelated individuals. None of the APCs were phenotypically related to the outcomes.
Results
Confirmation of the phenotypic correlations between initial severity, change in severity, and remission/response for both the HRSD and QIDS-C scales revealed that initial severity was modestly related to remission (e.g., rHRSD-initial severity = −0.21; 95% CI = [−0.26, −0.15]) and weakly related to response (rQIDS-initial severity = −0.08; 95% CI = [−0.13, −0.03]) but not change in severity (see Table S2 in the Supplemental Material). This suggested that participants who met criteria for remission had lower severity at enrollment. Change in severity and remission/response were highly correlated across both scales (e.g., rHRSD-change in severity:HRSD-remission = 0.80, 95% CI = [0.78, 0.82]; rQIDS-change in severity:QIDS-remission = 0.85, 95% CI = [0.83, 0.86]).
Table 1 presents the h2SNP estimates for all phenotypes. Notably, effects were largely consistent across the full and unrelated samples, suggesting limited confounding due to cryptic relatedness. SNP-heritability estimates using all autosomal genome-wide SNPs were consistent across assessment scales for the models that included no covariates and the models with covariates (see Table S3 in the Supplemental Material). Additive genetic effects on initial severity were greater for the HRSD scale than the QIDS-C scale; however, large standard errors preclude strong conclusions. Additive genetic effects on change in severity and remission/response indices were consistent across the HRSD and QIDS-C scales, although there was a tendency for higher point estimates on QIDS-C response measures.
Additive Genetic Effects on HRSD and QIDS Phenotypes
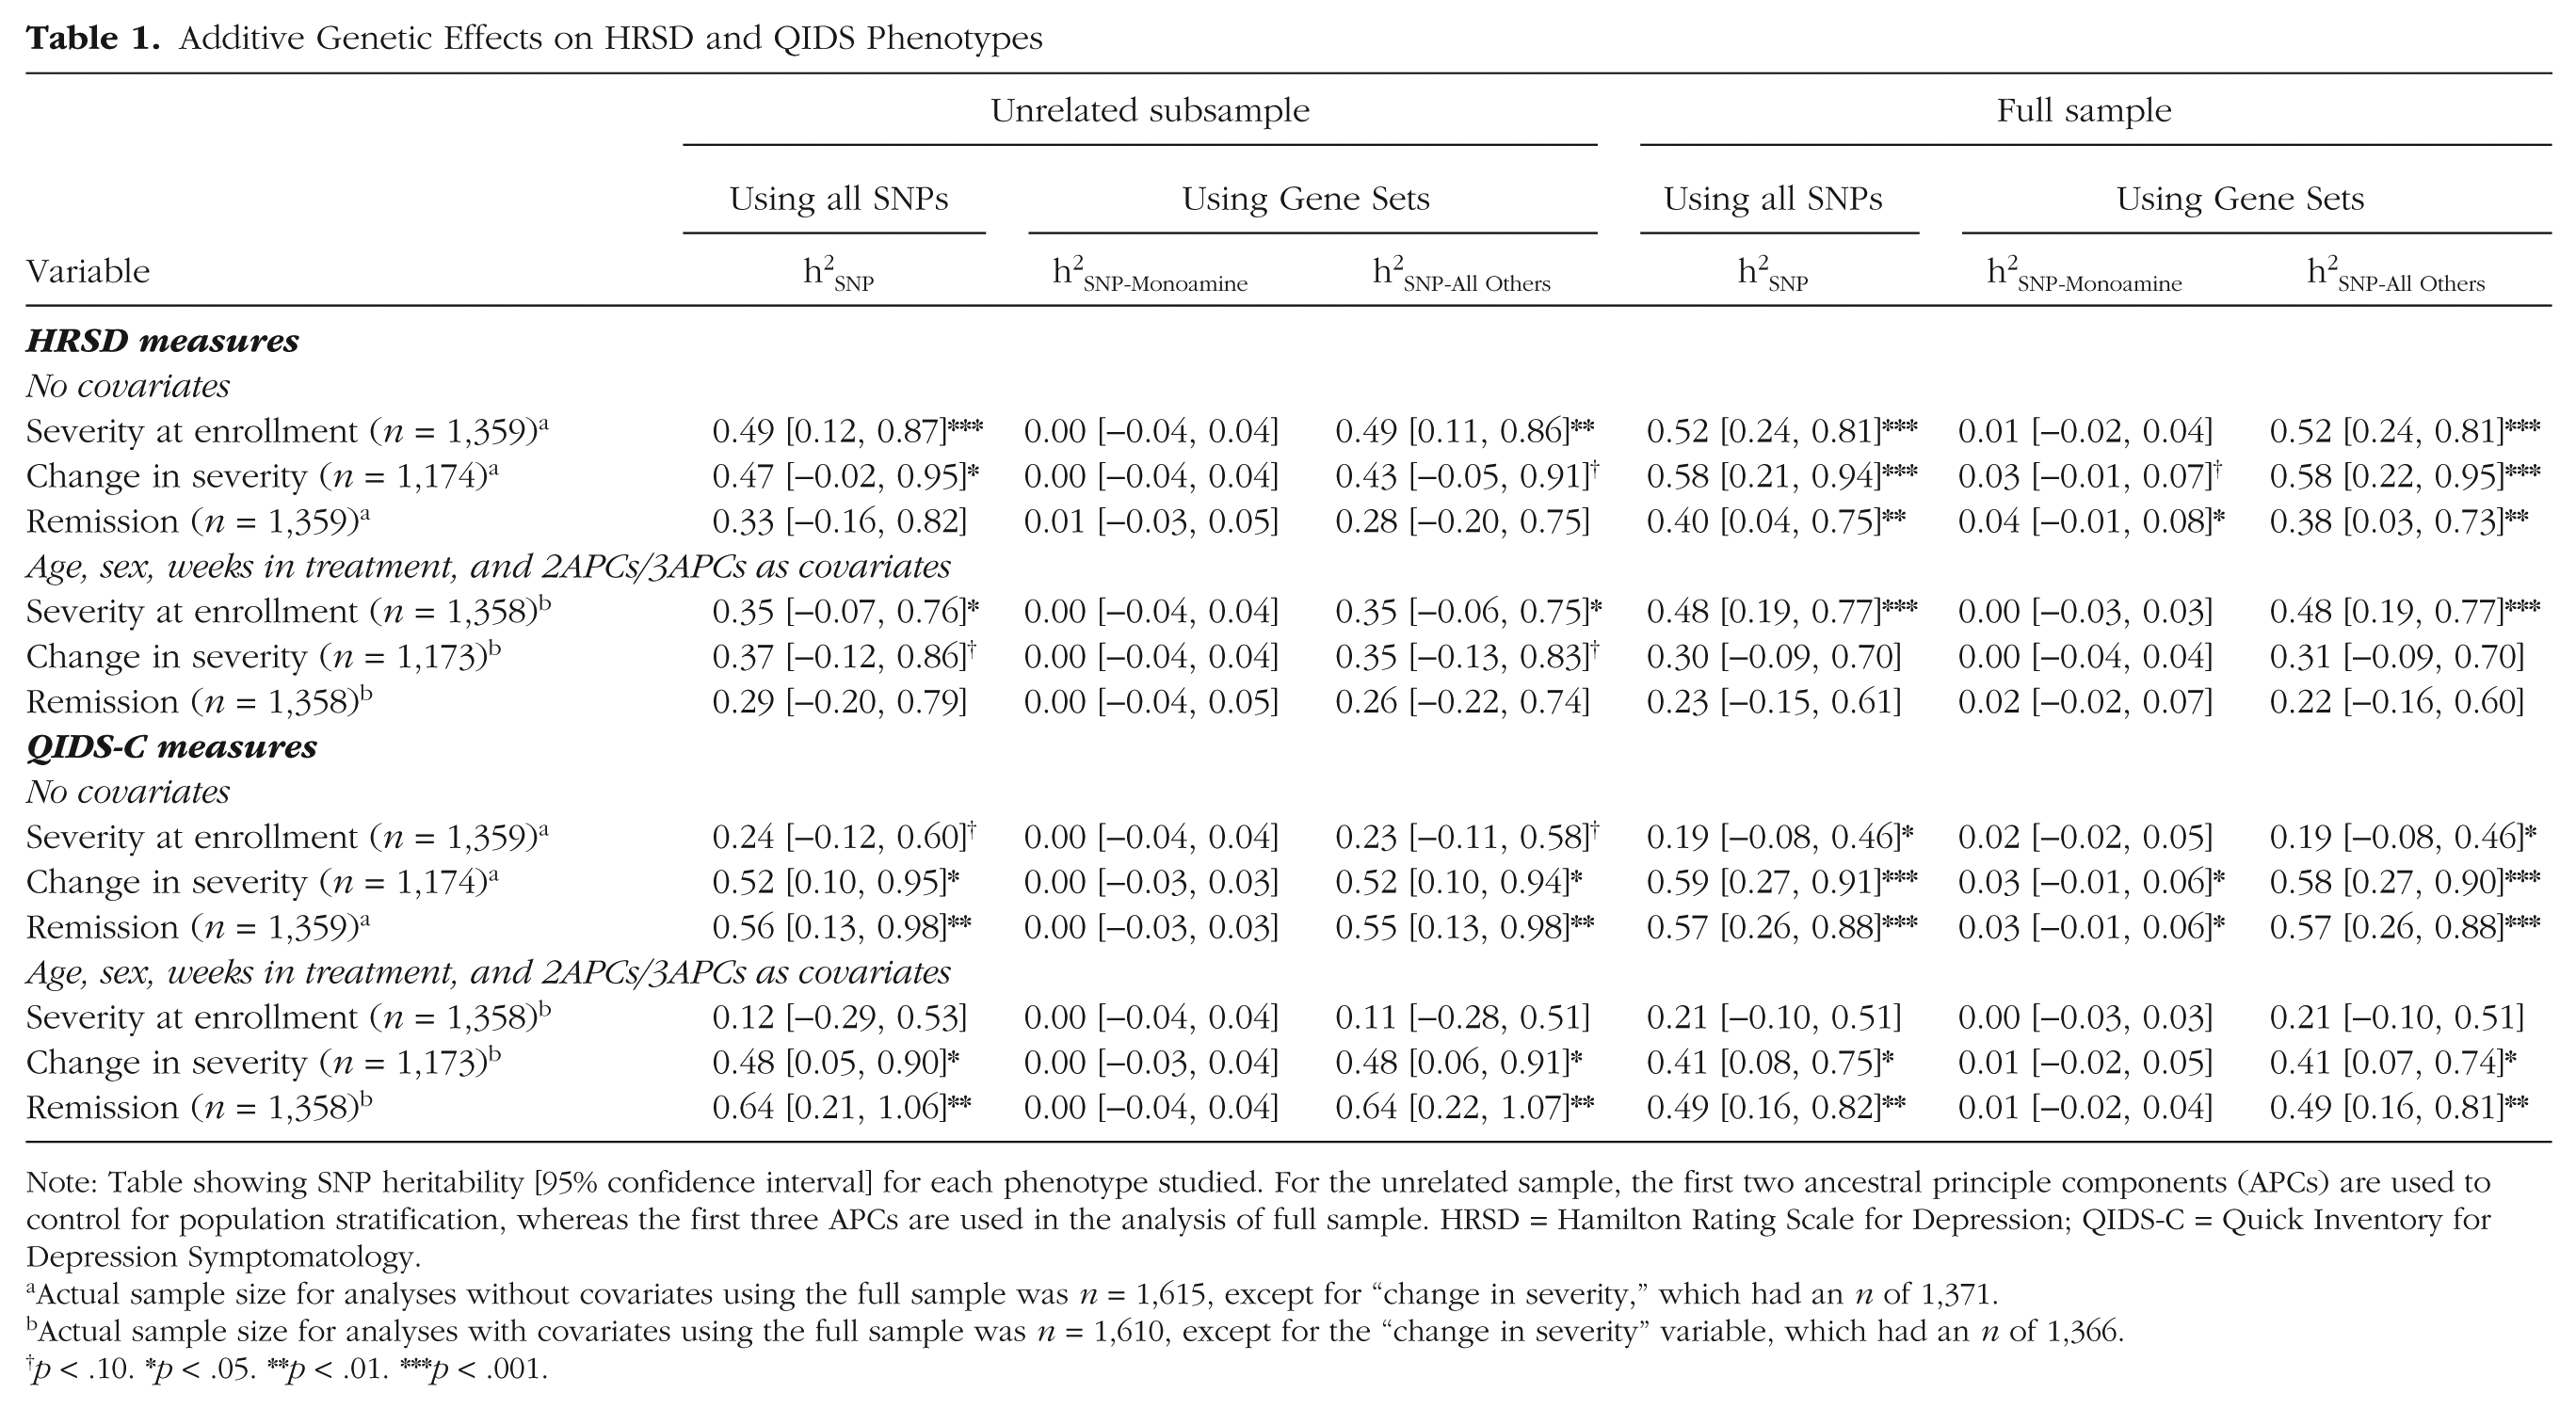
Note: Table showing SNP heritability [95% confidence interval] for each phenotype studied. For the unrelated sample, the first two ancestral principle components (APCs) are used to control for population stratification, whereas the first three APCs are used in the analysis of full sample. HRSD = Hamilton Rating Scale for Depression; QIDS-C = Quick Inventory for Depression Symptomatology.
Actual sample size for analyses without covariates using the full sample was n = 1,615, except for “change in severity,” which had an n of 1,371.
Actual sample size for analyses with covariates using the full sample was n = 1,610, except for the “change in severity” variable, which had an n of 1,366.
p < .10. *p < .05. **p < .01. ***p < .001.
Table S4 (in the Supplemental Material) describes the observed additive genetic effect on all phenotypes stratified by chromosome (i.e., 1–22). Regression of the observed effects on chromosomal length indicated that longer chromosomes did not account for more variance in phenotypes from either scale (e.g., for HRSD severity at enrollment, R2 = 0.00; 95% CI = [0.00, 0.18]). Although no one chromosome accounted for the majority of the observed effects on initial severity, chromosomes 4 and 18 accounted for roughly 10% of the variation in change in severity and remission.
Stratification of the univariate additive genetic effects into variance due to similarity across the markers proximal to the 83 DA/5-HT systems genes (versus the remainder of the genome) revealed that these DA/5-HT–related variants by themselves account for a relatively small proportion of the additive genetic variance in all phenotypes (i.e., ≤1%; see Table 1). This pattern of effect was generally consistent across the full and unrelated samples, as well as across depression scales, with the exception of genetic effects on change in severity and remission (as measured by the HRSD), which suggested that up to 3% of the variance could be explained by additive genetic factors. However, the interval for the effects in the full sample completely overlapped with those in the unrelated sample, suggesting that the change in the estimate could be due to sampling variance, as it is unlikely that shared environmental factors would impact only markers related to the dopaminergic and serotonergic systems.
Bivariate results were consistent across the full and unrelated samples (see Table 2). Based on the analyses conducted within unrelated subjects using all covariates, the estimated genetic correlation between HRSD severity at enrollment and HRSD change in severity was limited (rG-SNP= −0.38; 95% CI = [−1.00, 0.24]). Likewise, rG-SNP using HRSD-remission was also nonsignificant (rG-SNP= −0.65; 95% CI = [−1.00, 0.18]). Genetic correlations between QIDS-C severity at pretreatment and QIDS-C change in severity and response followed a similar pattern. Overall, point estimates from the bivariate analyses suggest that genetic factors for depression severity at enrollment and treatment response measures may be modest at best. Table S5 (in the Supplemental Material) provides a breakdown of rG-SNP across models comprising different sets of covariates.
Bivariate Genetic Correlations (rG-SNP [95% CI]) of Severity at Enrollment of HRSD and QIDS-C Depression Measures With Change in Severity and Remission Measures Using Log-Transformed Treatment Duration Variable
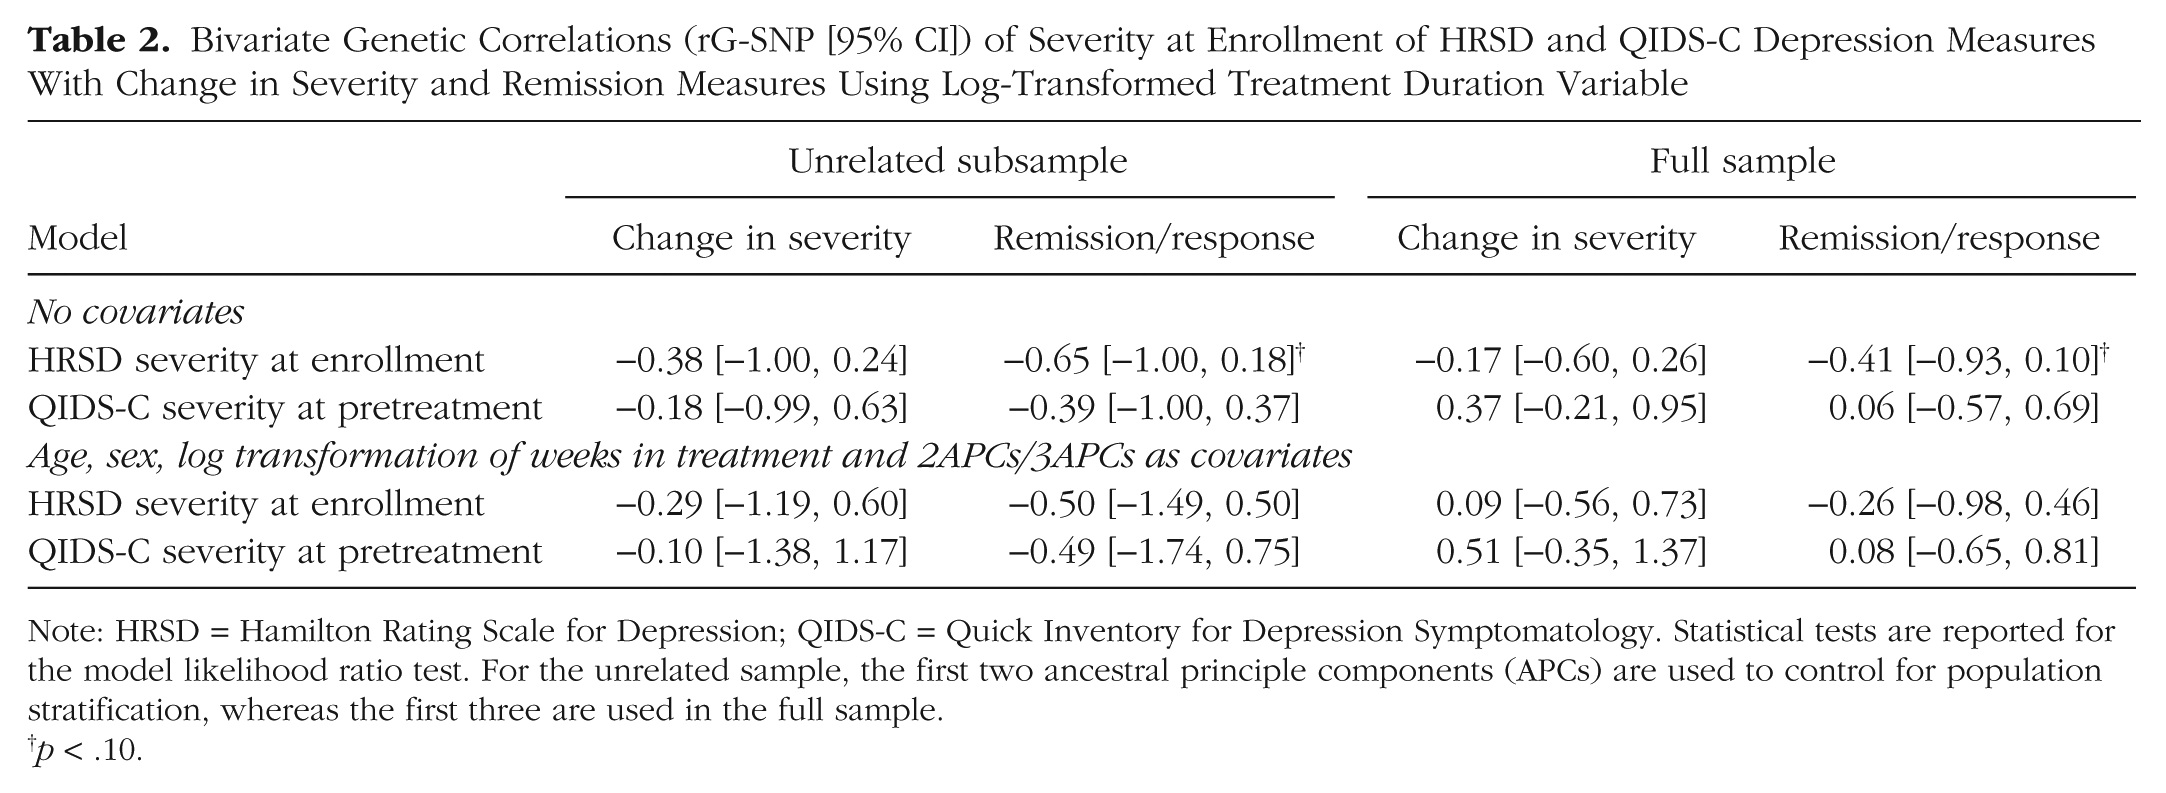
Note: HRSD = Hamilton Rating Scale for Depression; QIDS-C = Quick Inventory for Depression Symptomatology. Statistical tests are reported for the model likelihood ratio test. For the unrelated sample, the first two ancestral principle components (APCs) are used to control for population stratification, whereas the first three are used in the full sample.
p < .10.
Discussion
GREML was used to examine genome-wide genetic effects on initial depression severity and citalopram response using two measurement scales. Bivariate GREML also provided an indication of the genetic correlation between phenotypes, within each measurement scale. In addition to determining overall SNP-based heritability, we examined whether common variants in 80 autosomal genes that putatively influence serotonergic and dopaminergic function were associated with depression-related phenotypes. Much of the observed total genetic effects were largely attributable to genetic variation outside the set of DA/5-HT systems genes. Further, genetic variation that could be attributed to variation outside of the DA/5-HT systems does not appear to have common influences on initial depression severity and change in severity during treatment. However, it should be noted that only common genetic variation was measured. Our analyses do not include any genetic effects that may be attributable to fragment length polymorphisms, rare variants, copy number variants (CNV), or other noncommon forms of genetic autosomal variation. There is growing evidence that rare variants have important biological and medical consequences (Tennessen et al., 2012) and should be measured in future studies.
To complement the above-mentioned findings, we also explored whether the variation along specific chromosomes might account for the majority of the genome-wide h2SNP. Although most effects were modest, chromosome 18 had relatively large effects for change in severity and remission/response (across the HRSD and QIDS-C scale). Other noteworthy chromosomes of similar effect size were chromosomes 4 and 5. Interestingly, prior GWASs from this sample have identified genetic variants that predict treatment response and reside in a gene-rich region of chromosome 18 (including histamine receptor H4 and pseudogene RAC1P1) (Adkins et al., 2010), although other GWAS studies have identified variants that reside elsewhere (Garriock et al., 2010). Additional work, perhaps using GREML methods, could further partition variation with these chromosomes to better narrow the regions of influence with the goal of understanding what is strongly contributing to the changes in depression severity during antidepressant-related treatment.
In an effort to identify sources of genetic variation that might substantially contribute to h2SNP, we utilized a gene set that included 80 autosomal genes (1,573 polymorphisms) that putatively influence serotonergic and dopaminergic function. We selected these genes based on the monoamine hypothesis: the idea that deficiencies in monoaminergic neurotransmission are a central cause of depression (Hirschfeld, 2000). Further, SSRIs have been shown to modulate dopamine and serotonin levels (Gessa et al., 2000; Witkin, Tzavara, Davis, Li, & Nomikos, 2005). Despite long-standing interest in this idea, there was scant evidence (across both measures of depression) to suggest that genetic differences in serotonergic or dopaminergic neurotransmission (as best reflected by the variants identified in and around these genes) are strongly implicated in the pathophysiology of depression (Krishnan & Nestler, 2010) in this sample. Like many other genetic association studies that have examined components of the monoamine hypothesis in depression, we also found relatively little supportive evidence (Flint & Kendler, 2014). Thus, to identify genetic factors that substantially contribute to depression severity, research may need to move beyond the “usual suspects” involved in monoamine neurotransmission. It is also the case that our lack of findings could be explained by incomplete characterization of genetic variation in the 80 autosomal genes that is not well represented by SNPs on a GWAS array (e.g., rare variants). Consequently, it remains unclear what role common genetic variation in monoaminergic systems may have in depression.
Strengths and limitations
The current study had a number of strengths and limitations that should be taken into consideration. Compared to other clinical trials, STAR*D’s GWAS platform allows for the quantification of SNP effects across the entire genome. By capitalizing on the depth of genomic coverage and large sample size, we were able to use this whole genome approach to examine the liability to depression. A notable limitation for the current study is that STAR*D did not include a comparison group for the initial stage (i.e., Level 1) of the antidepressant trial. Due to the large sample size requirements of GCTA analyses, our analyses focused on these initial data, which limits our ability to attribute change in depression symptoms to antidepressant treatment per se. Notably, this limitation applies to all prior GWAS research with STAR*D. Future work would benefit from having a comparison condition (e.g., waitlist, placebo, or alternative treatment control) to identify the genetic contribution to symptom change specifically due to antidepressant treatment and a larger sample size to increase statistical power. It is also important to note that the current study was limited to autosomal markers, and as such, markers in the dopamine and serotonin pathway gene list, such as MAOA and MAOB, that are located on the X chromosome were not included in our analysis. Given the current challenges (Melis et al., 2004) in working with sex chromosome data from mixed sex samples, we elected to focus on autosomal SNPs. Given that roughly 5% of genes in the human genome reside on the X chromosome, it is likely that the effects presented here do not reflect all of the potential sources of genetic variation. Likewise, these analyses provide no indication of the magnitude of effect from rare variants (i.e., minor allele frequency < 1%) and nonadditive genetic effects. Last, but not least, it should also be noted that these results are preliminary and require external validation to confirm whether the observed additive genetic effects and genetic correlations are specific to STAR*D or might also exist in other independent samples. Recent machine learning studies of depression (Chekroud et al., 2016; Kessler et al., 2016) underscore the need for validation because findings in a single study may be biased. Specifically, a mathematical model may fit data well in one population but perform poorly in another. In the case of current analyses in STAR*D, the observed genetic effects may be biased and as such may not generalize to nontreatment populations or treatment populations that might not share clinical, etiological (e.g., alleles), or demographic similarities with STAR*D. In short, additional studies are needed to replicate and validate these findings and provide insight into the role of rare variants and sex-determining chromosome variants.
Conclusion
Our findings provide much-needed insight into whether pharmacologic interventions can be leveraged to help identify disease etiology. Although tentative and in need of replication, initial depression severity and change in severity during treatment appear to have limited overlapping genetic effects. Furthermore, observed genetic effects on depression severity and treatment response do not appear to be primarily attributable to selected genetic variation in the dopamine and serotonin systems. The additive effect of SNPs across the genome and the presence of relatively strong effects in certain chromosomes suggest that pathway and epistatic approaches that capture the combinatorial effects of the genome may help to shed further light on the etiology of both depression and response to depression treatment. Our findings using only a subset of common variants suggest that exploring the role of only dopamine and serotonin pathways in depression may have limited utility. As such, additional studies of alternative candidate pathways and rare variants in the entire monoamine system are needed. Nevertheless, results from the current study highlight the potential contribution of common genetic variation and simultaneously provide a novel way of utilizing clinical data to facilitate a comprehensive understanding of the etiology of depression and treatment response.
Footnotes
Acknowledgements
Data and biomaterials were obtained from the limited-access datasets distributed from the National Institutes of Health–supported STAR*D. STAR*D was supported by National Institute of Mental Health Contract N01MH90003 to the University of Texas Southwestern Medical Center. The  identifier is NCT00021528. Genotyping of STAR*D was supported by an NIMH grant to SPH (MH072802) and made possible by the laboratory of Pui Kwok (UCSF) and the UCSF Institute for Human Genetics. The authors appreciate the efforts of the STAR*D Investigator Team for acquiring, compiling, and sharing the STAR*D clinical dataset.
Declaration of Conflicting Interests
The authors declared that they had no conflicts of interest with respect to their authorship or the publication of this article.
Funding
Preparation of the current article was supported by National Institute on Alcohol Abuse and Alcoholism Grant AA021113 (to R. H. C. Palmer) and National Institute on Drug Abuse Grants DA032457 (C. G. Beevers) and DA023134 (V. S. Knopik).
References
Supplementary Material
Please find the following supplemental material available below.
For Open Access articles published under a Creative Commons License, all supplemental material carries the same license as the article it is associated with.
For non-Open Access articles published, all supplemental material carries a non-exclusive license, and permission requests for re-use of supplemental material or any part of supplemental material shall be sent directly to the copyright owner as specified in the copyright notice associated with the article.
