
Abstract
Converging lines of evidence suggest that personality pathology comprises shared and unique impairments. We leveraged a large clinical sample (N = 505) and a person-centered statistical approach, ipsative change analysis, to decompose individuals’ multidimensional profiles at two time points into a metric that captures change in the elevation of the profile (i.e., impairment severity) and change in configuration of the dimensions in the profile (i.e., stylistic symptom presentation). Results demonstrated that both severity and style change were associated with overall pathology change, although the relative importance of these metrics was influenced by assessment method. Specifically, structured interview showed strong effects of severity change relative to style change, whereas self-report was less definitive. In addition, severity change was more strongly associated with change in psychosocial functioning. Results support earlier evidence of shared and unique factors in personality pathology while highlighting the influence of assessment method on models of pathology structure.
The current taxonomic system of personality disorders (PDs) in the United States as instantiated in the fifth edition of the Diagnostic and Statistical Manual of Mental Disorders (DSM–5; American Psychiatric Association, 2013) features 10 discrete diagnoses. 1 Yet, few researchers or clinicians believe that categorical diagnoses represent ontologically valid or distinct disorders (e.g., Aslinger, Manuck, Pilkonis, Simms, & Wright, 2018; Haslam, Holland, & Kuppens, 2012; Hopwood et al., 2018; Kernberg & Caligor, 2005; Sharp et al., 2015; Wright, Hopwood, Skodol, & Morey, 2016). Instead, both clinical theory and empirical evidence point to substantial overlap and shared impairments across diagnoses even as specific features are unique to each disorder (e.g., attention seeking for histrionic PD). This suggests the potential value of a multidimensional profile perspective in which variation in PD features are understood as reflecting multiple correlated dimensions that can be decomposed into their shared and unique elements. Exemplifying the interest in such an approach, the Alternative Model for Personality Disorders included in Section III of the DSM–5 (e.g., Skodol et al., 2011) sought to articulate both shared and specific dimensions of personality problems in an effort to reconceptualize PD taxonomy.
Using a multidimensional profile perspective motivates ipsative analyses in which an individual’s profile at one point in time is compared with the same individual’s profile at other points in time with respect to both global change as well as changes in specific features. Such analyses allow a parsing of information about how individuals are changing as a function of development, treatment, or other factors that occur over time. For instance, global symptom reduction would suggest a general improvement in functioning, whereas improvements in some features coupled with deterioration in others would reflect a more qualitative pattern of change in personality that might not be evident when considering a global aggregate. A recent study taking an ipsative-change approach found significant average changes and individual differences in both severity and style in a nonclinical sample (Woods, Edershile, Wright, & Lenzenweger, 2019). The current study is an attempt to replicate these previous findings in a clinical sample and extend these initial results by linking changes in severity and style to functional outcomes.
Personality Disorder Impairment Level and Configuration
Disparate clinical theories of PD all point to common factors in the etiology of personality pathology (e.g., Beck, Davis, & Freeman, 2004; Kernberg & Caligor, 2005; Linehan, 1993; Pincus, 2005; Young, Klosko, & Weishaar, 2003). For example, psychodynamic models of PD development posit a toxic blend of dispositional affective disturbance (i.e., too high or too low activation) and early experiences with important others that inhibit identity consolidation (Kernberg & Caligor, 2005). Kernberg’s psychodynamic and highly influential nosological model of PDs uses two dimensions for classification: a dimension of impairment level, ranging from psychotic to neurotic, as well as the degree of extraversion, which determines the stylistic presentation of the pathology. Although sometimes viewed as incongruent with psychodynamic models, the cognitive approach to understanding PD etiology also points to a dynamic relationship between early temperament and early experience such that temperament may predispose particular coping strategies such as avoidance and chronically accessible strategies cyclically reinforcing maladaptive beliefs about the self, others, or the world (Beck et al., 2004). Beck and colleagues (2004) distinguished between PDs based on specific maladaptive core beliefs and coping strategies; however, they did not hypothesize distinct developmental pathways for each disorder. Thus, both psychodynamic and cognitive approaches to understanding personality pathology would predict shared developmental trajectories among PDs and unique configurations of features resulting from idiosyncratic dispositional and environmental interactions. This transtheoretical emphasis on shared pathways in PD development via a shared severity pathway would have treatment implications if empirically supported, such as identifying interventions that target the shared impairment across PDs rather than the specific manifestations unique to the extant categories.
Cross-sectional research offers compelling evidence for shared variance in personality pathology. A series of factor analytic studies reported a significant general factor in personality pathology (Hopwood et al., 2011; Jahng et al., 2011; Oltmanns, Smith, Oltmanns, & Widiger, 2018; Ringwald, Beeney, Pilkonsi, & Wright, 2019; Sharp et al., 2015; Williams, Scalco, & Simms, 2018; Wright et al., 2016). Hopwood et al. (2011) extracted the first unrotated component from the 10 DSM PDs that they interpreted as a severity dimension and that was predictive of overall dysfunction. Following this work, Wright and colleagues (2016) interpreted their extracted general factor as a marker of severity and was more closely linked with overall functioning than any of the secondary stylistic factors. Williams and colleagues (2018) reported a general factor that was strongly linked to each of the 10 PDs and related to a host of psychopathological constructs, such as internalizing symptoms and interpersonal behavior problems. Jahng et al. (2011) also reported a strong general PD factor that was linked to each of the 10 PDs and also linked to substance abuse. Although this general factor has been interpreted in different ways, such as severity (Hopwood et al., 2011; Wright et al., 2016), interpersonal dysfunction (Jahng et al., 2011), and neuroticism (Livesley & Jang, 2000), there is clear evidence of substantial shared variance among the 10 PDs. In acknowledgment that the interpretation of this general factor is a point of debate, for the purposes of the current study, we will refer to this factor most neutrally as level.
Longitudinal Changes in Personality Disorder Level and Configuration
Although there has been substantial theoretical and empirical work on the structure of personality pathology, less is known about its longitudinal trajectory. Like basic personality traits, dimensional ratings of each of the PDs tend to be quite stable in the short term and somewhat less so in the long term (Clark, 2007). However, PD symptoms have been shown to be relatively less stable than basic personality traits in the short term (Morey et al., 2007) and over longer periods (Hopwood et al., 2013). Stability estimates of PD symptoms appear to be influenced by assessment method (Samuel et al., 2011); yet, converging evidence points to sizable change in PD symptoms over time. Of particular note, each of the 10 PDs tends to decrease in severity over time at similar rates (Lenzenweger, 1999). In addition, shared variance across PDs has been shown to predict future functioning to a substantially greater degree than variance associated with particular PDs (Hopwood et al., 2011) and to show reciprocal change with functioning such that reduction in shared PD variance is associated with better functioning (Wright et al., 2016), which point toward an important common pathway underlying personality pathology.
Evidence for substantial shared variance and common longitudinal trajectories supports a moving away from viewing PDs as separate entities toward a model that can account for both shared and specific variation in the expression of personality problems across people. Cronbach and Gleser (1953) decomposed multidimensional profiles into metrics that approximate the general (i.e., severity) and specific (i.e., stylistic features) distinction discussed above. In their approach, severity is reflected in the overall mean of a multidimensional profile, whereas stylistic features are reflected in the configuration of the profile.
For example, imagine an elderly individual who is being assessed for the first time because of concerns about cognitive decline. He is tested using the Wechsler Adult Intelligence Scale (Wechsler, 2008), and his full-scale composite IQ (FSIQ) score is in the average range, with each of the index scores (i.e., verbal comprehension, perceptual reasoning, working memory, and processing speed) that make up the FSIQ also being in the average range. In Scenario A, this same individual is reassessed and now has an FSIQ at 80 (i.e., low average), with all of the respective index scores also in the low average range. One would say that this individual’s multidimensional profile of index scores reduced in overall mean but not in their relationship to each other. In other words, the overall magnitude of the multidimensional profile decreased. In Scenario B, the patient is reassessed following a focal stroke in the right parietal lobe. As a consequence, the patient’s perceptual reasoning index is in the low average range, whereas the other index scores remain in the average range. Here, the primary change in the multidimensional profile of index scores reflects a shift in the relationship between the perceptual reasoning index and the other index scores. This scenario illustrates a change in the patient’s cognitive configuration—average in most areas but deficient in perceptual reasoning.
When paired with longitudinal data, this type of decomposition permits analyses that distinguish between changes in level and configuration within an individual’s profile. An example of pure level change would be an individual who met one criterion for each PD at baseline and no criteria for any PD at follow-up. Here, only the total number of criteria changed; the relationships between stylistic features of the multidimensional profile across the various disorders remained the same. A different individual who met four dependent PD criteria and no other criteria at baseline but four avoidant criteria and no other criteria at follow-up has no change in total number of criteria (i.e., impairment level) but does have changes in the configural features of the multidimensional profile, reflecting a shift in symptom presentation from social dependency to social withdrawal.
A recent study of ipsative change in personality pathology suggested that multidimensional profile change over time in personality pathology was explained by both severity (i.e., level) and style (i.e., configural) change (Woods et al., 2019). That is, total change in personality pathology was accounted for by significant shifts in mean-level pathology declines (i.e., level) as well as changes in the manifestation of the pathology (i.e., configural; e.g., shifting from dependent to avoidant presentation). However, the relative importance of severity and style in accounting for total change showed strong method effects: Interviewer-rated multidimensional PD change was due mostly to shifts in impairment level, whereas self-reported PD change was somewhat more due to shifts in profile configuration. Moreover, whereas level and configural change were correlated in self-reported PD, they were unrelated in interviewer-rated PD. This finding suggests that impairment level and configuration are less sharply differentiated in self-report, which has previously been attributed to content differences between interview and self-report questions and the focus on specific behavioral manifestations of pathology in interviews, among other hypotheses (e.g., Hopwood et al., 2013; Morey & Hopwood, 2013; Samuel et al., 2011). In addition, although both level and configuration change were related to baseline Axis 1 diagnosis in interviewer-rated PD, only configuration change was related to Axis 1 diagnosis for self-reported PD. This finding may be due to the method effects described above or sample characteristics, which were reflective of general (i.e., nonclinical) population levels of PD (Lenzenweger, 1999). It is possible that a clinical sample with greater baseline pathology (and consequently greater room for change) may help further clarify level and configuration change more generally as well as the links between these components of change and clinical outcomes.
The strong method effects reported by Woods and colleagues (2019) and Samuel and colleagues (2011) may have important implications for future longitudinal research on personality pathology and therefore merit replication. If self-report and clinical interview provide discrepant information regarding how personality pathology changes over time, it would be important for future researchers to be aware of the potential method effects and the impact they may have on their results. In addition to replicating the method effects reported in the prior work, it is also important to explore whether changes in level and shifts in profile configuration have differential links to important outcomes. In particular, finding discrepancies in associations between level and configuration change with clinical outcomes would underscore the usefulness of the severity/style framework in understanding PDs. Woods and colleagues obtained only baseline Axis 1 diagnosis and reported mental health treatment; thus, this preliminary work should be extended to capture a broader picture of psychosocial functioning. Finally, the prior work was conducted using an undergraduate sample. Although this sample was oversampled for personality pathology and mirrored population estimates of PD (Lenzenweger, 1999), replication in a clinical sample is needed. Thus, the primary aims of the current study are to (a) test whether the significant impacts of level and configuration change on total personality pathology change replicate, with an eye toward method effects, in a clinical sample and (b) extend our understanding of the importance of level and configuration change in predicting patient functioning. Specifically, on the basis of previous work, we hypothesized:
Hypothesis 1: Both impairment level and configuration change would be significant predictors of total multidimensional change in personality pathology.
Hypothesis 2: The overall proportion of total change explained by level and configuration would vary by method such that impairment level would be stronger for interview but roughly equivalent with style for self-report.
The examination of associations between level and configuration change and clinical outcomes was exploratory.
In addition to ipsative change in personality pathology, Woods and colleagues (2019) applied the same procedure to study changes in nonpathological, normal-range, basic personality traits (i.e., individuals’ affective, cognitive, and behavioral tendencies across situations). It is important to examine basic personality and personality pathology together for several reasons. First, both show systematic change even if changes tend to be greater for PDs than basic personality traits (Hopwood et al., 2013; Morey et al., 2007). Basic personality tends to follow a normative trajectory of development such that individuals become more conscientious, agreeable, and emotionally stable over time, referred to as the maturity principle (i.e., Roberts, Caspi, & Moffitt, 2001; Roberts & Mroczek, 2008). A combination of high neuroticism, low extraversion, low agreeableness, and low conscientiousness also tends to be linked to personality pathology (e.g., Morey et al., 2002), suggesting that maturational changes in basic personality may be linked with reductions in personality pathology (Wright, Pincus, & Lenzenweger, 2013). Indeed, there is evidence that declines in symptoms of borderline PD are associated with changes in neuroticism, extraversion, agreeableness, and conscientiousness (Wright, Hopwood, & Zanarini, 2015) and more recently that declines in narcissism are associated with declines in neuroticism and increases in conscientiousness (Dowgwillo, Pincus, & Lenzenweger, 2019). Further research has shown similar relationships between rates of change in avoidant PD symptoms and change in neuroticism, dominance, and affiliation (Wright, Pincus, & Lenzenweger, 2013).
These findings together suggest that both personality pathology and basic personality show systemic change that may reflect a shared underlying process. Woods et al. reported that basic personality total change was reflected by both overall profile level and profile configuration change; however, profile level and configuration changes explained much less of the variance in total change than did their pathological analogues. Therefore, the current study will also test whether previous findings that both profile level and configuration changes predict total change in basic personality replicate, albeit less so than for PDs, and extend this work to determine whether level and configuration change in basic personality predict clinical outcomes, as would be predicted if personality pathology can be reflected in the basic personality traits.
Method
Sample
The current study used participants in the Collaborative Longitudinal Personality Disorder Study (CLPS; Gunderson et al., 2000) who provided data at baseline as well as at 2-year (range = 244–505) and 4-year (range = 231–481) follow-ups. Extensive demographic and psychodiagnostic information is available elsewhere (e.g., Gunderson et al., 2000), but it is important to note that PD comorbidities in this data set have been shown to be similar to those reported elsewhere (McGlashan et al., 2000). Available sample size varied as a function of missing follow-up data. Analysis of only those with complete data did not change the interpretation of results, and consequently we report analyses with the highest available power. Although previous studies using CLPS data have examined associations between the variables examined in the present study (e.g., Hopwood et al., 2011; Morey et al., 2007), this is the first to use a multidimensional profile approach to decomposing changes in personality and PDs. It is also the first to use these data to extract these elements of the multidimensional profile to predict clinical outcomes. Thus, the current study takes a distinct approach from the traditional, variable-centered approach.
Measures
Personality pathology was assessed via both interview and self-report. Participants were interviewed about personality pathology using the Diagnostic Interview for DSM–IV Personality Disorders (DIPD-IV; Zanarini, Frankenburg, Sickel, & Yong, 1996), a semistructured interview assessing DSM–IV Axis II criteria (identical to those presented in DSM–5 Section II definitions of PD) manifesting over the previous 2 years.
Self-reported personality pathology was obtained using the Schedule for Nonadaptive and Adaptive Personality (SNAP; Clark, 1993). This questionnaire assesses a range of personality traits across the normal to abnormal spectrum. The SNAP can be scored both in terms of diagnostic dimensions and maladaptive traits. For the present study, only the 12 pathological traits were used to avoid overlapping items and constructs. Profile level and configuration change for both diagnostic-based dimensions and maladaptive traits was considered in the current study.
Basic personality was assessed using the NEO Personality Inventory, Revised (NEO-PI-R; Costa & McCrae, 1992). This inventory was designed to capture the five major personality factors: extraversion, neuroticism, agreeableness, conscientiousness, and openness. Neuroticism was reverse-coded (i.e., emotional stability) so that all factors were keyed in the same direction.
Overall functioning was assessed using the Global Assessment of Functioning (GAF), which is a single-item measure, ranging from 1 to 100, indicating symptom severity and level of functioning. Participants were assessed using the GAF at baseline and follow-up years 2 and 4.
Specific domains of functioning were assessed using both self-report and interview-derived measures. Participants were interviewed about their occupational, social, and recreational functioning using the Longitudinal Interval Follow-up Evaluation (LIFE; Keller et al., 1987). Participants were assessed using the LIFE at baseline as well as 2- and 4-year follow-up. In addition, participants reported on their own functioning using the occupational, social, and recreational subscales of the Social Adjustment Scale–Self-Report (SAS-SR; Weissman & Bothwell, 1976). Participants were assessed using the SAS-SR at baseline and at the 2-year follow-up but not at the 4-year follow-up.
Analytic strategy
Each dimension of each measure was standardized on the means and standard deviations of the first wave after computing descriptive statistics and before ipsative change analysis. Ipsative change in multidimensional profiles was estimated using the method described by Cronbach and Gleser (1953). Total change, D2, is the sum of squared differences between dimensions (i.e., PDs and personality factors) in the profile. D2 is nondirectional and represents a conglomeration of three forms of change: elevation, scatter, and shape. Overall profile level and configuration change were calculated using the equations for elevation and shape change, respectively. Elevation change is the difference in the means of an individual’s profiles at two time points. Elevation change was squared to make it nondirectional for the purposes of predicting total change, paralleling D2. Scatter (D′2) is the standard deviation from the profile’s mean divided by the square root of the number of dimensions in the profile. This metric is not of theoretical interest and was therefore ignored for our subsequent analyses. Profile shape change is calculated by removing elevation and scatter from D2. Consequently, shape (i.e., profile configuration) change, D″2, is the difference in an individual’s profile at two time points after removing each profile’s mean and standard deviation.
Associations between metrics of change and clinical outcomes were estimated using multiple regression, controlling for baseline levels of the outcome. A priori significance level was set to p < .01.
Results
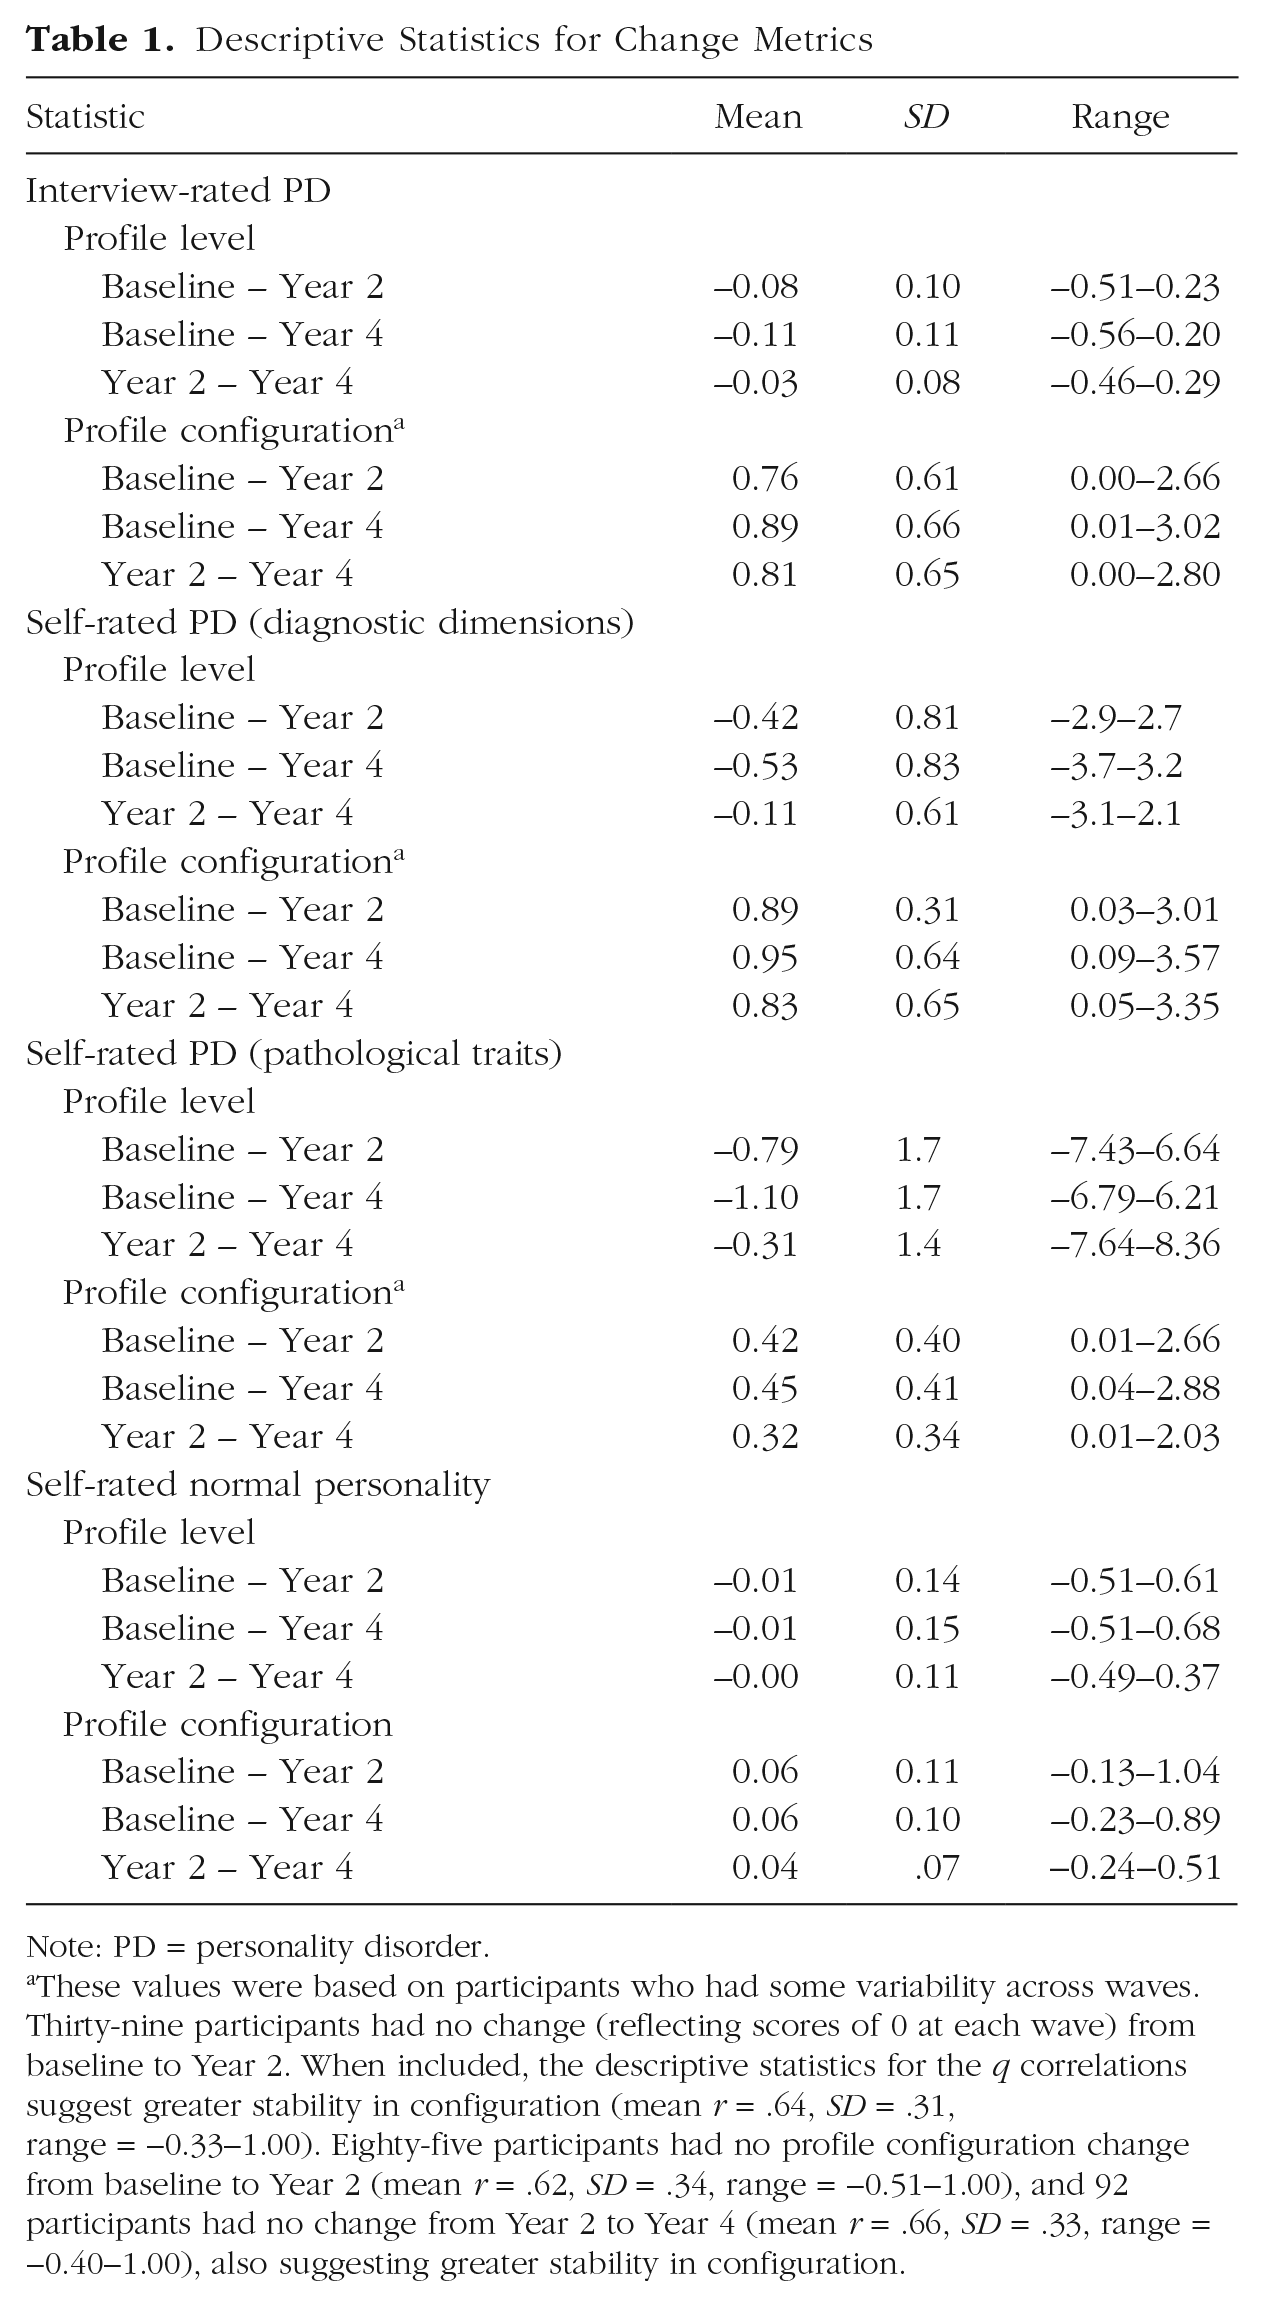
Table 1 shows the descriptive statistics for level and configuration change across each of the PD measures as well as the normal personality measure before standardization. Level for the personality disorder measures refers to mean change across all dimensions within the measure (e.g., 10 diagnostic dimensions for interviewer-rated personality pathology) from one wave to another. Level for normal personality refers to mean changes across the five basic personality dimensions from one wave to another. Configuration change for both the PD and normal personality measures refers to shifts in the relationships between the respective dimensions of each measure after severity and scatter (see above) are removed. On average, profile level decreased for all measures of PD while staying static for normal personality (note, however, that severity is elevation squared for explaining total change). Impairment level change tended to be greater from baseline to Years 2 and 4 than between Years 2 and 4 across all PD measures.
Descriptive Statistics for Change Metrics
Note: PD = personality disorder.
These values were based on participants who had some variability across waves. Thirty-nine participants had no change (reflecting scores of 0 at each wave) from baseline to Year 2. When included, the descriptive statistics for the q correlations suggest greater stability in configuration (mean r = .64, SD = .31, range = −0.33−1.00). Eighty-five participants had no profile configuration change from baseline to Year 2 (mean r = .62, SD = .34, range = −0.51−1.00), and 92 participants had no change from Year 2 to Year 4 (mean r = .66, SD = .33, range = −0.40−1.00), also suggesting greater stability in configuration.
Parsing total change
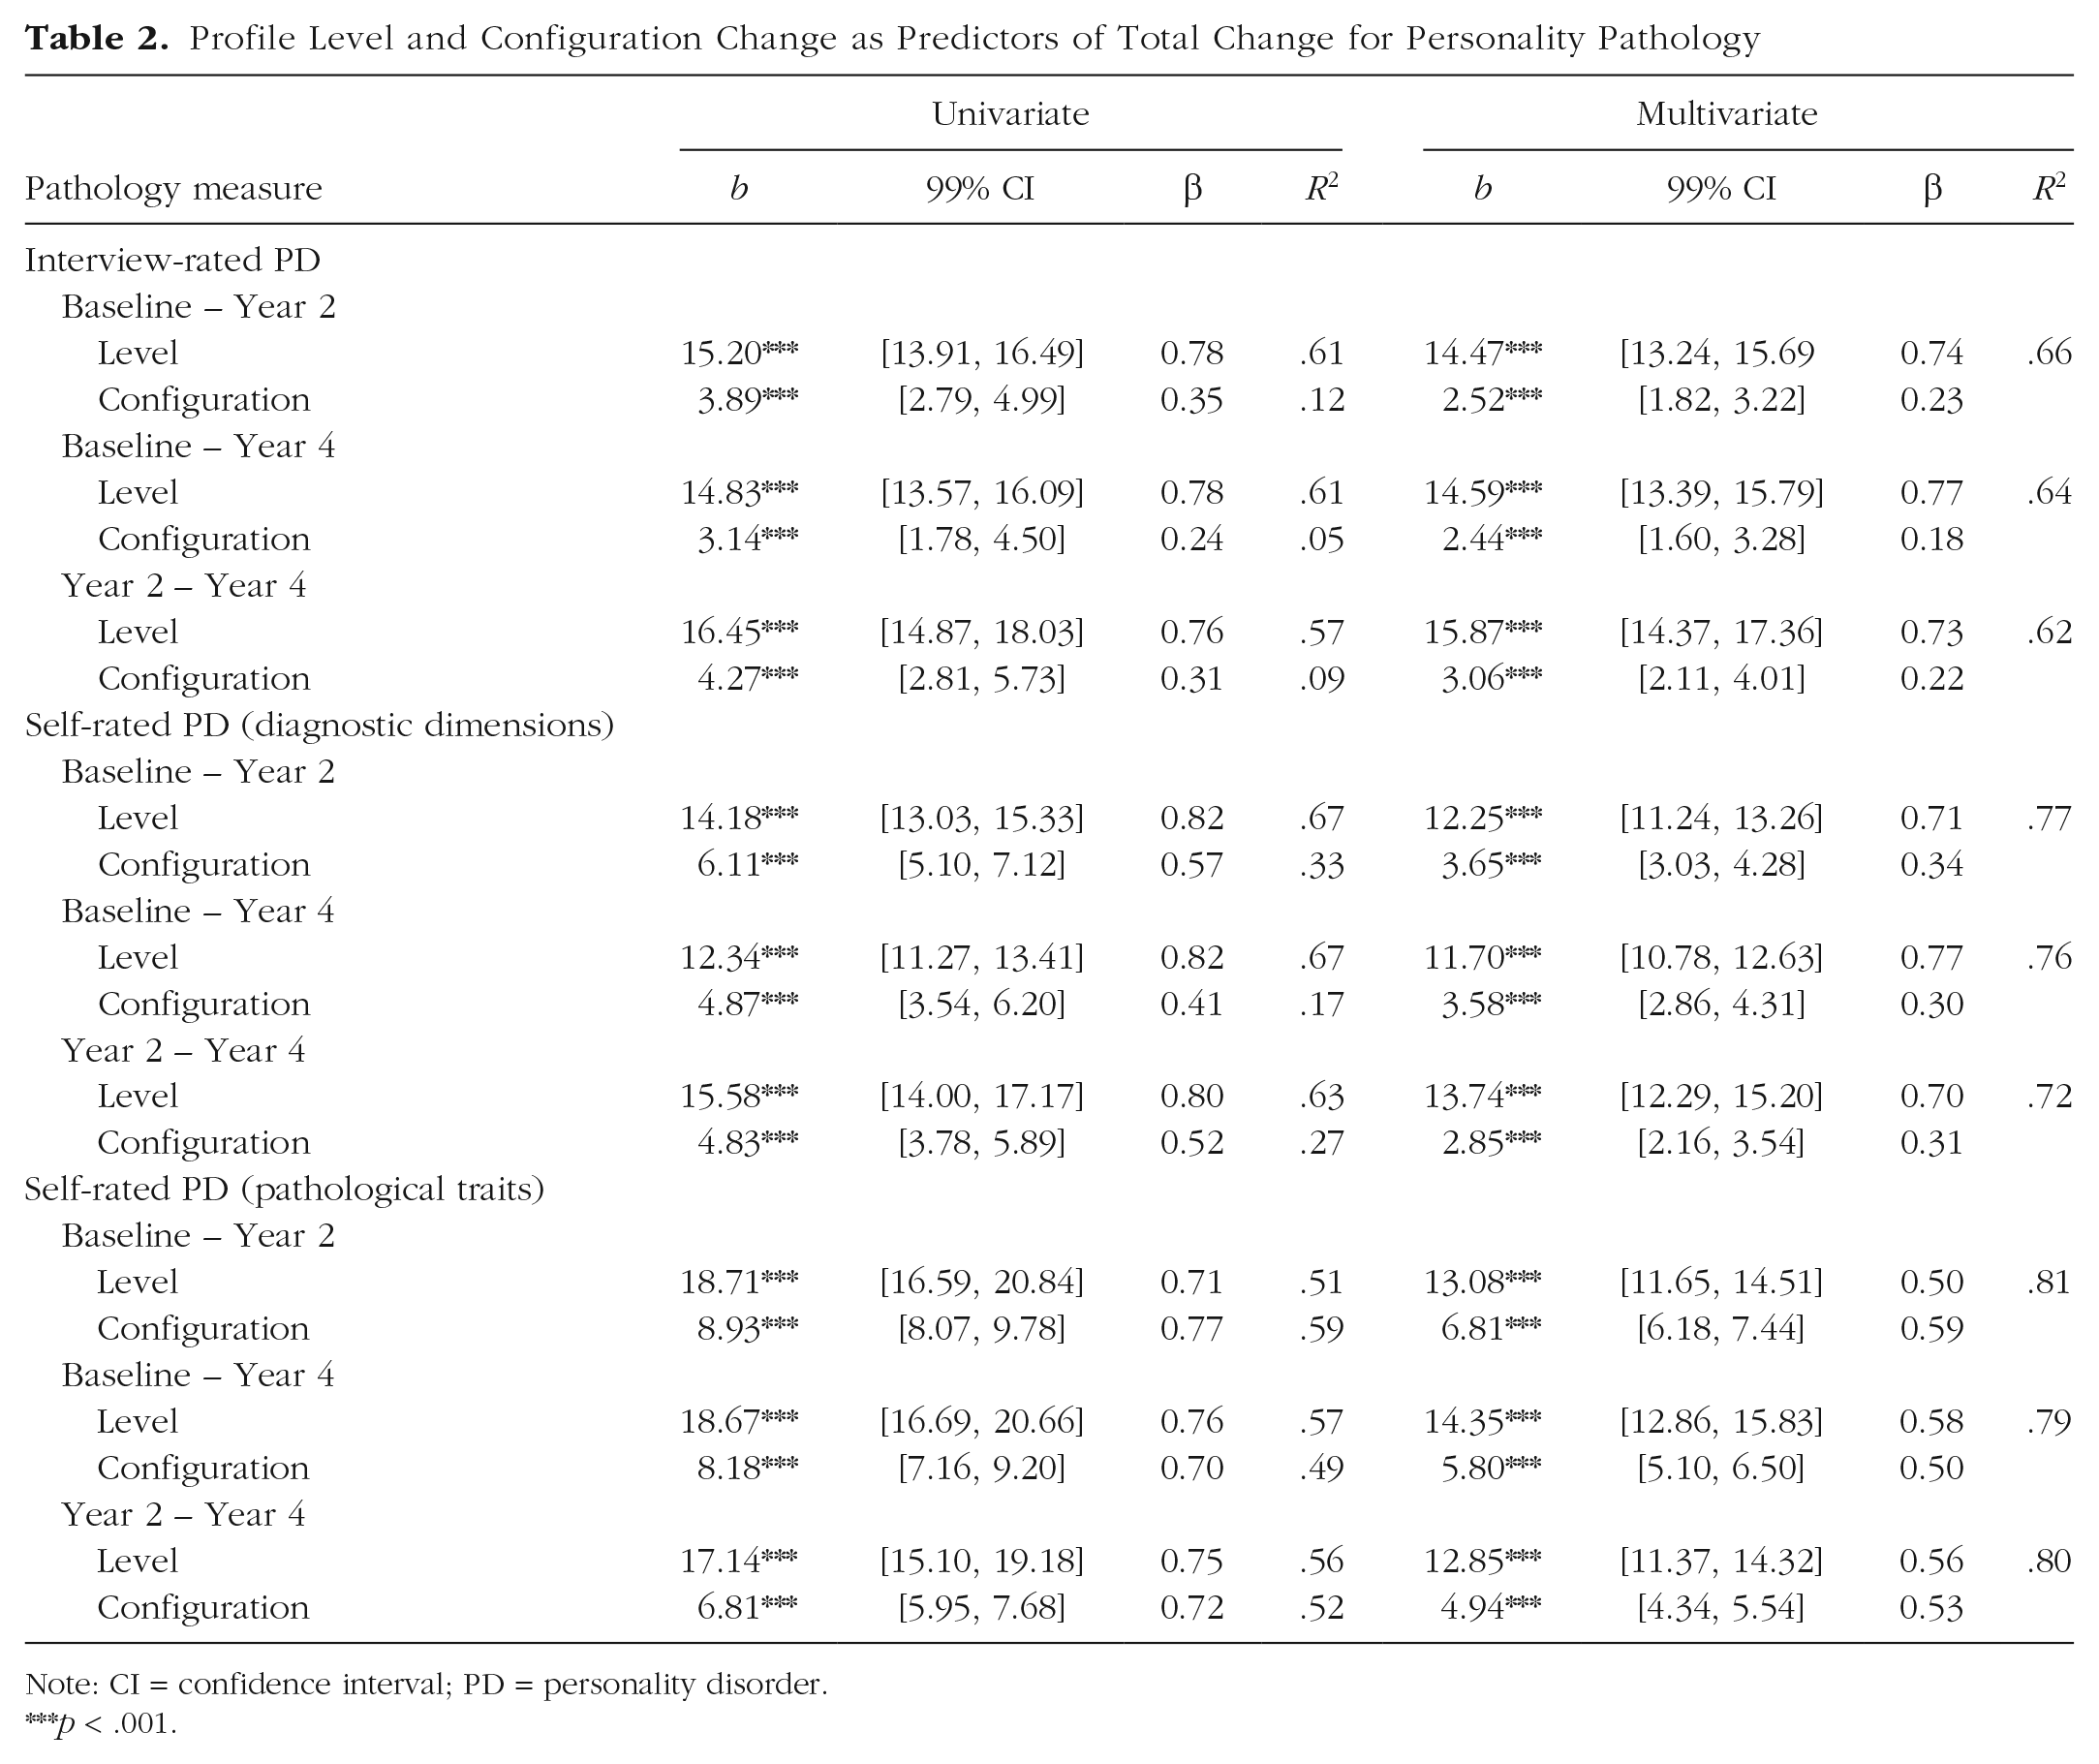
For interviewer-rated PD, both severity and style significantly and independently (i.e., when adjusting for each) explained total change (i.e., D2) between all waves (Table 2). R2 values suggest that total change in interviewer-rated PD predominantly reflected changes in the overall number of personality pathology criteria met (i.e., impairment change) rather than changes in which type of criteria were being met (i.e., configuration change).
Profile Level and Configuration Change as Predictors of Total Change for Personality Pathology
Note: CI = confidence interval; PD = personality disorder.
p < .001.
For self-reported PD scored in the DSM PD diagnoses, both level and configuration change significantly and independently explained total change between all waves (Table 2). As with interviewer-rated PD, R2 values suggest that total change was explained predominantly by changes in the overall number of items endorsed (i.e., impairment level change) rather than which specific items were endorsed (i.e., profile configuration change).
The same self-report measure was rescored as pathological traits. Here again, both impairment level and profile configuration significantly and independently related to total change between all waves for self-reported maladaptive personality traits (Table 2). Examination of the R2 values suggests that total change was attributable to changes in both the types of items that were endorsed (i.e., configuration change) and overall mean changes (i.e., level change).
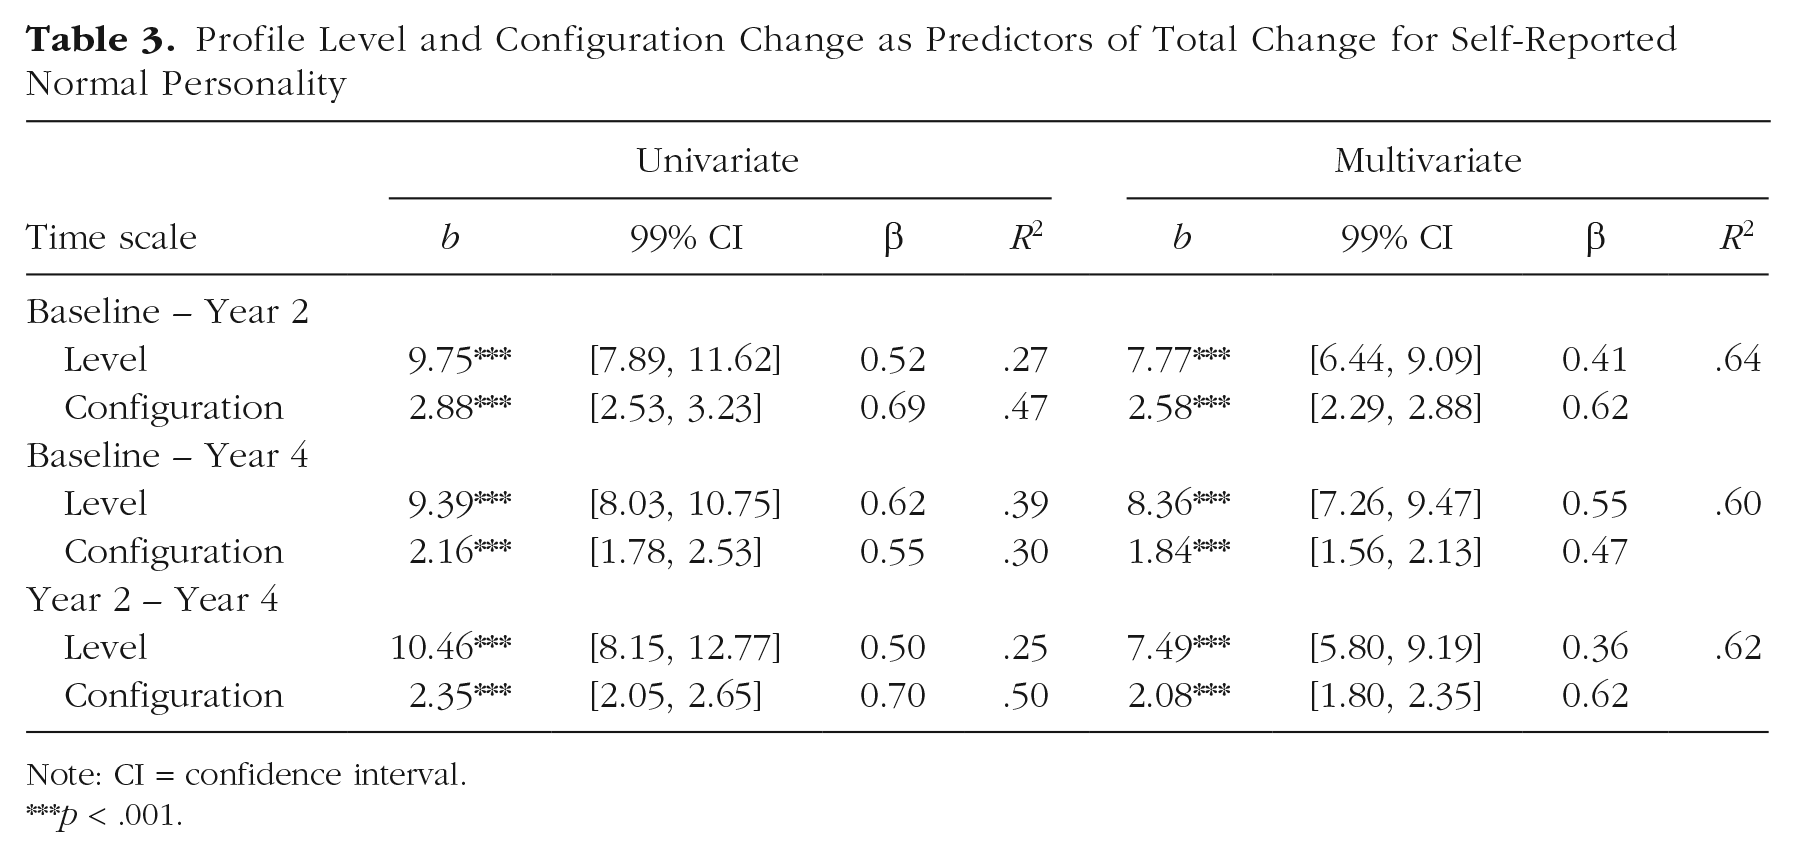
For self-reported basic personality traits, both profile level and configuration were significantly related to total change between all waves separately as well as together (Table 3). R2 values for change from baseline to Year 2 and Years 2 to 4 favored configuration change; profile level and configuration were approximately equal for change from baseline to Year 4. It is notable that R2 in total change for basic personality is generally lower than R2 values for personality pathology using the same self-report methodology regardless of whether pathology was scored as traits or diagnoses.
Profile Level and Configuration Change as Predictors of Total Change for Self-Reported Normal Personality
Note: CI = confidence interval.
p < .001.
Prediction of clinical outcomes
Next, we estimated which of the change metrics significantly predicted clinically important outcome measures at Years 2 and 4. Table 4 shows R2 values for the change metric after removing variance explained by the baseline level covariate. Overall, there were a large number of significant effects across level and configuration change, although effect sizes were generally small, ranging from 0 to .8 of variance explained. For context, Table 4 also shows the proportion of variance in outcome change explained by the baseline value of the outcome measure, ranging from .9 to .54. As expected (e.g., Morey et al., 2007), interviewer-rated PD and both trait- and PD-scored self-reported PD had more significant associations with outcomes than did normal personality, which showed only one significant association. However, whereas interviewer-rated PD’s associations to outcome variables were generally significant for both profile level and configuration change, self-reported PD in both scoring methods tended to have significant links only through level change. Across both waves, R2 values were strongest for change indices predicting GAF scores as well as social functioning on the LIFE. Basic personality profile level and configuration change were poor predictors of psychosocial outcomes.
Profile Level and Configuration as Predictors of Clinical Outcomes at Years 2 and 4

Note: All values are R2 values adjusting for baseline values of the outcome. For multivariate regressions, significance for severity is indicated before the slash and significance for style is indicated after. PD = personality disorder; GAF = global assessment of functioning; LIFE Soc = longitudinal interval follow-up examination social subscale; LIFE Wrk = longitudinal interval follow-up examination occupational/work subscale; LIFE Rec = longitudinal interval follow-up examination recreation subscale; SAS Soc = social adjustment scale social subscale; SAS Wrk = social adjustment scale occupational/work subscale; SAS Rec = social adjustment scale recreation subscale; n.s. = nonsignificant.
R2 values for outcome at baseline change because we used the full sample for which data were available in each analysis. Available participant data varied by outcome measure and collection wave. For multivariate regressions, significance for severity is indicated before the slash and style after.
p < .01. ***p < .001.
Discussion
Both empirical evidence (e.g., Hopwood et al., 2011; Wright et al., 2016) and clinical theory (e.g., Bornstein, 1998; Kernberg & Caligor, 2005; Pincus, 2005) support the distinction between the level of overall impairment of personality pathology (i.e., profile level) and the manner in which PD manifests (i.e., profile configuration). One interpretation of this study is that it demonstrates that ipsative profile change metrics provide a compelling method for disentangling impairment level from stylistic shifts in longitudinal data. Woods and colleagues (2019) recently investigated PD and personality profile change and found support for significant changes in severity (i.e., level) and style (i.e., configuration) in both basic traits and PDs among undergraduates oversampled for personality pathology. Assessment method affected estimates of the overall magnitude of change explained by severity and style in that study such that interviewer-rated PD change was driven primarily by severity change, whereas self-reported PD change showed slightly stronger style change. The goal of the current study was to replicate these analyses in a clinical sample and expand this work to examine how changes in profile level and configuration are linked to important outcomes.
Overall, our findings replicate those of Woods et al. (2019) in showing the importance of decomposing profile level and configuration to understand PD symptom remission and personality change over time. Both changes in the overall level of pathology profile across PDs and shifts in the configuration of prominent PD features in the profile were important for understanding total profile change across both interview and self-report assessment methods. This finding lends further support for the distinction between the overall level of impairment and style of expression in personality pathology, as has been hypothesized by others (e.g., Bornstein, 1998; Kernberg & Caligor, 2005).
Our results also partially replicate those of Woods et al. (2019) with respect to method effects. As in the previous study, interviewer-rated PD change was overwhelmingly driven by profile level change, although configuration change was still significant. Two studies in clinically diverse samples now suggest that the main influence on changes in PD symptoms assessed by interview has more to do with shifts in overall profile level across PDs than particular PDs. Using the SNAP as our self-reported PD measure allowed us to calculate self-reported personality pathology in two ways: as PD diagnostic dimensions and pathological traits. The relative R2 values for level and configuration change when the SNAP was scored as PD diagnostic dimensions largely favored level change, which was discrepant from earlier findings. However, when the SNAP was scored as pathological traits, configuration and level explained similar proportions of the variance in total change. These findings together suggest two influences on the degree to which changes are due to profile level or configuration. First, self-report appears to be somewhat more sensitive to configuration change, whereas changes in interview seems to primarily relate to changes in level. Second, syndrome-based models appear to be more affected by changes in level, probably because putative syndromes tend to mix empirically distinct traits. In contrast, evidence-based trait models, which distill personality pathology into more homogeneous domains, may be more capable of picking up stylistic changes in how an individual’s personality profile is configured.
The discrepancy in findings regarding the relative importance of level and configuration change for self-reported PD between the current study and Woods and colleagues’ (2019) previous findings is noteworthy. One possible explanation is that the previous study used a nonclinical sample, whereas the current study used a clinical sample. It should be noted, however, that the sample used in the previous study has been shown to have a distribution of personality pathology reflective of population estimates (Lenzenweger, 1999). Another possibility is that the discrepancy comes from differences in scale construction. The Millon Clinical Multiaxial Inventory–II (MCMI-II; Millon, 1987) has, as a part of its construction, overlap in items across scales (ranging from 9% to 18% of items across scales), and many of its items are scored positively for one PD subscale and reverse-scored for another. Item overlap could drive the importance in change in profile configuration because change in overlapping items would shift one dimension score down while driving another up. Whether the discrepancy in results is due to differences in samples, scales, or some other factor is an open question; however, the correspondence in findings between this study and the previous study in the interviewer-rated PD and normal personality change estimates suggests that it is likely due to differences between the measures rather than the samples. This hypothesis is also supported by the contrast in R2 values for profile level and configuration when the SNAP was scored as pathological traits rather than diagnostic dimensions. Note that the pattern of results when using the former scoring method mirrored those of the previous study.
The discrepancy between scoring methods for self-reported personality pathology is itself worthy of discussion. The finding that configuration change is much more prominent for pathological traits than diagnostic dimensions may be explained by the relative heterogeneity of presentations within PD diagnostic groups (Skodol, 2012; Widiger & Trull, 2007) and the more homogeneous nature of trait dimensions relative to PD constructs. In other words, trait dimension scales are designed to isolate unique constructs that span traditional diagnostic categories, whereas diagnostic categories, even when treated as dimensions, combine several constructs (e.g., the borderline diagnosis combines affective dysregulation, interpersonal dysfunction, and impulsivity). From a conceptual standpoint, this finding largely reflects the difference in purposes between pathological trait measures and diagnostic constructs. The former is designed explicitly to parse between presentations of pathology (i.e., profile configuration/pathological style), whereas the latter is chiefly concerned with estimating whether an individual has clinically significant distress or impairment (i.e., profile level) in some relevant domain but which for any given diagnoses can be ambiguous. It is also worth noting that personality pathology reflected as pathological traits is more in line conceptually with what is traditionally meant by style than shifts within diagnostic dimensions. These findings can also be understood from the perspective of the different psychometrics of the scales in question. Because of trait dimensions’ higher internal consistency and narrower bandwidth, they offer more sensitivity than the PD constructs, specifically to test issues related to stability and changes in configuration. Thus, these findings again point to critical methodological issues in the assessment and measurement of PD and underscore the fact that our substantive conclusions necessarily are constrained by our measurement methods.
In addition to examining the extent to which profile metric changes were associated with total profile change, we also examined links between profile level and configuration change and change in important clinical outcomes. Our results showed relatively small but significant links to changes in clinical outcomes across 2 years and 4 years. Across the PD assessment methods used, level change was most consistently linked to functioning. Relative to the 2-year outcomes in which we saw relatively consistent configuration change associations, these links dissipated in the Year 4 outcome analyses. Although the overall strength of the associations was small, finding significant links across severity and style across assessment methods supports the notion that these are distinct metrics of personality pathology and are both useful for understanding psychosocial functioning. Nevertheless, the relatively small effect sizes suggest that the ipsative approach may not be ideal for examining associations between shared and general variance in PD longitudinal change with clinical outcome measures. Instead, the ipsative approach may be most useful for parsing shifts in clinical severity (i.e., level) from stylistic presentation (i.e., configuration) in longitudinal data.
Our study adds to a relatively small literature using ipsative methods to understand PD change longitudinally using ipsative approaches. Woods and colleagues’ (2019) recent work has been summarized above. An earlier study by Samuel and colleagues (2011) also found method effects in ipsative change such that self-reported PD showed less change over time than PD rated by their psychotherapists. Although the authors did not differentiate between profile level and configuration change, they did note that those with greater personality pathology at baseline tended to show more total ipsative change, perhaps because of floor effects on the level of the profile. This possible explanation fits with our finding a prominent role of profile-level change in explaining overall profile shifts.
A series of studies of normal personality used Cronbach and Gleser’s (1953) ipsative change scoring to understand development in children. Here the authors used Cronbach and Gleser’s original three ipsative change metrics—elevation (i.e., level), scatter, and shape (i.e., configuration). The first of these studies found that a significant proportion of the sample changed in terms of elevation and scatter but not shape (De Fruyt, Bartles, et al., 2006). This finding was replicated in two child and adolescent patient samples (De Bolle et al., 2009; De Fruyt, Van Leeuwen, Bagby, Rolland, & Rouillon, 2006). The apparent incongruity in lack of significant configuration change between these studies and the current study’s approach likely reflects differences in approach to modeling ipsative change. The previous studies of normal personality compared the proportion of their sample that showed significant change in each of Cronbach and Gleser’s metrics. Recall that in Cronbach and Gleser’s method, total change (D2) is first estimated, then elevation change is removed by subtracting the mean, leaving a mixture of scatter and shape change (D′2). Finally, scatter can be removed to isolate shape change (D″2). The underlying logic was that if a greater proportion of the sample showed significant change in total change (D2) before removing elevation (D′2), then at least some portion of ipsative change in personality must be attributable to elevation change. Because of our focus on distinguishing profile level and configuration change, as in Woods et al.’s (2019) recent work, we isolated elevation change by calculating differences in mean profile scores over time (i.e., elevation) to predict total change. This approach gave us a quantitatively pure estimate of elevation change and allowed us to estimate the proportion of total change due to elevation and style changes, in line with our research question, whereas the previous work calculated the frequency of significant change across the change metrics.
In summary, this study has both substantive and methodological implications. Substantively, it adds to the growing empirical literature that documents the value of parsing clinical severity and symptom presentation style in personality pathology (Hopwood et al., 2011; Jahng et al., 2011; Oltmanns et al., 2018; Ringwald et al., 2019; Sharp et al., 2015; Williams et al., 2018; Woods et al., 2019; Wright et al., 2016). However, these previous studies relied on similar factor analytic method; indeed, one of the advantages of ipsative profile analysis as used in the current study is that we were able to conceptually replicate prior work using an entirely different statistical approach using a clinical sample. Across both factor analytic and ipsative analyses, generally speaking, the shared aspects of PD explain a relatively larger proportion of the variation in PD features, suggesting that shared variance is the driving factor behind PD change over time. These findings support the utility of an overall severity index for personality pathology, which has been suggested in both the DSM’s alternate model of PDs (American Psychiatric Association, 2013) and the psychoanalytic tradition (Kernberg & Caligor, 2005). The distinct features of PD, which might be represented by syndromes or traits, depict how individuals with PD diagnoses differ from one another in symptom presentation. These features might provide clinically useful information about how individuals with PDs differ from one another, a topic that merits further research. This distinction corresponds somewhat to the move to distinguish general and specific features in the diagnostic manuals and points to a number of areas for further investigation, including the development of valid approaches to distinguishing severity and symptom presentation.
Beyond emphasizing the need for severity-based assessments of personality pathology, the current study also has potential treatment implications. If PDs do reflect an underlying general factor and if change in this factor predicts overall change in pathology, future interventions may benefit from targeting those features that these diagnoses share rather than, or at least in addition to, developing interventions for each PD separately. Such a strategy would likely improve availability of treatment because clinicians would need to be trained in a single intervention rather than 10 distinct approaches. Indeed, despite being included largely unchanged in the diagnostic manual for over 30 years, only borderline PD has generated strong interest in treatment development and empirically supported treatments. Moving forward, one might envision that treatment paradigms that first target the general factor to reduce overall impairment followed by modules to address the specific manifestation of personality pathology should be top priority. Arguably, some available treatments have already adopted this approach (e.g., transference-focused psychotherapy; Clarkin, Yeomans, & Kernberg, 2006), whereas others have targeted those features that are most reflective of general pathology (e.g., borderline features and dialectical behavior therapy; Linehan, 1993).
There are two main methodological implications of this study. First, the results complement the Woods et al. (2019) study by using an ipsative change approach to break profile change into distinct metrics representing change across the profile (i.e., general change) and change within the constituent components of the profile (i.e., specific change). An advantage of this approach is that it leverages longitudinal data to cleanly distinguish clinical distress and impairment from symptom presentation. Furthermore, as has been demonstrated in the current study, ipsative profile analysis can be used to compare different assessment methods and scoring approaches. Indeed, the current study showed that detected shifts in personality pathology profile level and configuration may depend on the type of assessment method used; self-report measures with PD variation scored as evidence-based dimensions perhaps may provide a relatively more powerful approach to detecting configuration change than PD syndrome-based scoring methods. These findings present important considerations for both clinical researchers and practitioners. Those who wish to focus on description of their patients’ pathological presentation may be better served by self-report measures, which appear to emphasize detection of change in the patterns of symptom presentation. On the other hand, those who wish to focus on identification of distress reduction may be best served by use of structured clinical interview. Regardless of the choice, it is important for all end users to be aware of the strengths and weaknesses of different methodological approaches, and the current study provides further evidence of differences among self-report and structured interview.
Despite the novel contributions of the current study, it is worth noting some potential limitations of it. Because ipsative profile analysis compresses change across profile dimensions into three indicators, configuration and potentially elevation change are vulnerable to shifts in an especially influential dimension (i.e., a dimension with unusually strong links to many or all of the other dimensions). Individuals who show more change on this dimension would consequently show more total and configuration change than someone who changed on a less correlated dimension. All of the correlated dimensions changing in the same direction would also affect level change. On the other hand, large change on a relatively isolated dimension would result in larger total and level change but would have less of an impact on configuration change. In addition, total change is nondirectional, which makes correlating it with outcomes impractical. This limitation precluded us from comparing the effects of total change relative to the subordinate level and configuration change indicators.
A separate potential limitation is that the recruitment strategy used for the clinical sample in the present study was designed to separate those with avoidant, borderline, obsessive-compulsive, and schizotypal PDs into relatively distinct groups. This strategy could potentially influence the change patterns found in the present study. However, as has been previously noted, these data showed the same patterns of PD comorbidities found in other samples (McGlashan et al., 2000). In addition, the patterns of findings broadly replicate those of a previous study using the same method and using a sample whose PD rates mirror the broader population (Lenzenweger, 2006). Furthermore, our findings conceptually replicate a larger body of work interested in parsing clinical severity from symptom presentation (e.g., Hopwood et al., 2011; Oltmanns et al., 2018; Ringwald et al., 2019).
There is mounting empirical evidence that personality pathology should be conceptualized in terms of two components, one reflecting clinical severity and the other reflecting the behavioral manifestation of the pathology. Much of this research has relied on factor analytic approaches to parsing shared variance, interpreted as severity, from stylistic features. To complement this approach, in the current study, we used ipsative analysis to separate longitudinal change due to clinical distress (i.e., pathology profile level) from change due to change in symptom presentation (i.e., pathology profile configuration). Our analyses in a clinical sample replicated those using a student sample (Woods et al., 2019). Results demonstrated that the extent to which level and configuration shifts each played a role in explaining total change varied by data-collection method (i.e., interview or self-report), replicating previous findings, and, within the same method, by scoring method (i.e., traits or diagnoses). The current study also demonstrated that these different change metrics have small but significant associations with clinically relevant psychosocial outcomes. This study once again highlights the utility of a dimensional approach to understanding personality pathology with a shared core of pathological severity and distinct stylistic features.
Footnotes
Action Editor
Scott O. Lilienfeld served as action editor for this article.
Author Contributions
W. C. Woods and A. G. C. Wright developed the study concept. Testing and data collection were performed by A. E. Skodol, L. C. Morey, and C. J. Hopwood. W. C. Woods performed the data analysis and interpretation under the supervision of A. G. C. Wright and in consultation with C. J. Hopwood. W. C. Woods and A. G. C. Wright drafted the manuscript. A. E. Skodol, L. C. Morey, and C. J. Hopwood provided critical revisions. All of the authors approved the final manuscript for submission.
Declaration of Conflicting Interests
The author(s) declared that there were no conflicts of interest with respect to the authorship or the publication of this article.