
Abstract
Social anxiety disorder (SAD) is characterized by negative self-beliefs and altered brain activation in the default-mode network (DMN). However, the extent to which there is neurocognitive heterogeneity in SAD remains unclear. We had two independent samples of patients perform a self-referential encoding task and complete self-reports of childhood maltreatment, subjective well-being, and emotion regulation. In the replication sample, we also measured DMN activation using functional MRI. We used k-means clustering, which revealed two distinct subgroups of patients with SAD in the discovery sample. Cluster 1 demonstrated higher levels of negative self-referential trait endorsement, lower levels of positive self-referential trait endorsement, and significantly higher levels of childhood emotional maltreatment, lower subjective well-being, and altered emotion-regulation-strategy use. A similar pattern was observed in the replication sample, which further demonstrated higher DMN activation during negative trait judgments in Cluster 1. Participants in the SAD clusters, from both the discovery and replication samples, were significantly distinct from samples of control participants. These findings reveal neurocognitive heterogeneity in SAD and its relationship to emotional maltreatment.
Keywords
Substantial heterogeneity exists within patient populations that receive a particular clinical diagnosis. This heterogeneity may reflect variation in etiology and have implications for current well-being, prognosis, and treatment. This has fueled interest in defining neurocognitive subtypes that capture some of this heterogeneity. Studies have increasingly turned to unsupervised (data-driven) clustering approaches to identify potential subgroups within particular disorders (Feczko et al., 2019; Kaczkurkin et al., 2020; Marquand et al., 2016).
One potentially promising target is social anxiety disorder (SAD). SAD is the most common anxiety disorder, with a 12.1% lifetime prevalence (Stein & Stein, 2008), and it is characterized by an intense, persistent fear of being evaluated in social situations (Heimberg et al., 2014). Heterogeneity within patients with SAD has not been explored in detail, although it has been suggested that patients may vary in the types of self-related thoughts and beliefs they exhibit (Gregory & Peters, 2017) and in self-definition, with a specific emphasis on self-criticism and dependency (Kopala-Sibley et al., 2014). Low remission rates following therapy (Steinert et al., 2013) also point to possible heterogeneity.
One of the core attributes of this disorder is negative self-beliefs (Clark & Wells, 1995; Hofmann, 2007; Moscovitch, 2009; Rapee & Heimberg, 1997). Although control participants generally show a positivity bias, patients with SAD generally show a negativity bias (Goldin, Manber-Ball, et al., 2009). Indeed, previous studies demonstrated that negative self-referential processing is a major component of patients’ phenotype (Abraham et al., 2013; Button et al., 2012; Dixon et al., 2020; Goldin et al., 2012; Goldin, Ramel, & Gross, 2009) and has implications for treatment response (e.g., increasing positive self-views through treatment was found to predict decreases in social anxiety symptoms; Thurston et al., 2017). Self-referential processing is commonly associated with engagement of the default-mode network (DMN; Andrews-Hanna et al., 2014; Buckner et al., 2008; Northoff et al., 2006), a system that shows aberrant activation patterns in SAD (Bruehl et al., 2014; Dixon et al., 2020). Although patients with SAD may show excessive negative self-beliefs and altered DMN recruitment on average, we hypothesized that there might be important individual variability, and some patients exhibit more extreme negative bias than other patients.
If it is possible to identify neurocognitive subgroups of patients with SAD, a critical question concerns the possible relationship between such groups and life events. One possibility is that clinical heterogeneity within SAD may relate to differences across the life span in exposure to traumatic events, such as childhood maltreatment. Prior work has demonstrated that childhood maltreatment is associated with anxiety and depression (Iffland et al., 2012; Simon et al., 2009; Vachon et al., 2015), later identity diffusion (i.e., when a person’s identity remains unresolved and not fully formed), altered self-perception (Scott et al., 2014), and negative self-referential processing (Penner et al., 2019; Toth et al., 2000). Given the known relationships between childhood maltreatment, psychopathology, and altered self-referential processing, we hypothesized that heterogeneity in SAD, in the form of more extreme negative self-beliefs and altered DMN activation, might be associated with greater exposure to childhood maltreatment.
In the current study, we combined theoretically informed hypotheses with an unsupervised clustering approach to investigate potential heterogeneity within SAD. We used large discovery (N = 95) and replication (N = 97) samples from independent sets of patients to validate our findings. We first clustered patients on the basis of behavioral data in a self-referential task and then subsequently clustered them on the basis of behavioral and brain data (DMN activation) to assess the added value of neuroimaging data beyond behavioral data alone. After identifying two clusters (subgroups), we investigated the potential role of childhood maltreatment in differentiating the subgroups and compared subgroups on measures of general well-being and adaptive functioning.
Method
Participants
Two independent samples of patients with SAD and demographically matched control participants with no history of psychiatric disorders according to the diagnostic criteria in the fourth edition of the Diagnostic and Statistical Manual of Mental Disorders (DSM-IV; American Psychiatric Association, 1994) were included in data analysis (Dixon et al., 2020; Goldin, Manber-Ball, et al., 2009; Goldin, Ramel, & Gross, 2009). The discovery sample included 95 patients with SAD (mean age = 33.53 years, SD = 8.56; 46 women, 48.4%) and 43 control participants, and the replication sample included 97 patients with SAD (mean age = 32.94 years, SD = 8.08; 51 women, 53.1%) and 34 control participants. Patients provided informed consent in accordance with the Institutional Review Board at Stanford University, passed MRI safety screening, were 22 to 55 years of age, were fluent in English, and were right-handed. Patients with SAD met criteria for a primary diagnosis of generalized SAD based on the Anxiety Disorders Interview Schedule for DSM-IV: Lifetime version (Di Nardo et al., 1994; for additional details and screening criteria, see Supplemental Method in the Supplemental Material available online). Severity of social anxiety and avoidance was measured with the Liebowitz Social Anxiety Scale Self-Report (LSAS-SR; Liebowitz, 1987).
Self-referential encoding task
Participants performed a self-referential encoding task (Derry & Kuiper, 1981; for details, see the Supplemental Material). Stimuli were 25 positive and 25 negative social trait adjectives from the Affective Norms for English Words database (Bradley & Lang, 1999). Participants viewed the trait words and made a yes/no judgment indicating whether the trait was self-descriptive (self-judgment condition) or a yes/no judgment indicating whether the trait was written in all uppercase letters (case-judgment condition). There were five blocks of each of the four trial types. Each block started with a question screen (either “Describes ME?” or “UPPER case?”) for 1.5 s, and then five positive or five negative adjectives were presented one at a time for 3 s each. Participants made a yes/no response using a button pad during presentation of each of the five stimuli. In total, participants made 25 judgments for each of the four trial types. At the end of the run, there was a 3-s fixation cross and a 3-s blank screen. Stimulus order was pseudorandomized in terms of block sequence, and no more than two blocks of the same condition were presented sequentially. The sequence of words and whether they were uppercase or lowercase were randomized within each block. For each participant, we calculated the percentage of positive and negative trait words that were endorsed during the self-judgment conditions and mean accuracy during the case-judgment conditions.
Only behavioral data were collected for the discovery sample. Behavioral and functional MRI (fMRI) data were collected for the replication sample. Only participants who scored 70% correct or higher on the case-judgment trials were included in further analyses to ensure that they understood the task and were paying attention. This criterion led to the exclusion of nine patients in the discovery sample (8.7% of sample) and 17 patients in the replication sample (14.9% of sample), resulting in final samples of 95 and 97, respectively.
Measure of childhood maltreatment
Childhood maltreatment was assessed with the Childhood Trauma Questionnaire (Bernstein et al., 2003), which consists of 28 items reflecting five forms of childhood maltreatment: physical abuse, sexual abuse, emotional abuse, physical neglect, and emotional neglect. Ratings were made on a 5-point scale ranging from 1 (never true) to 5 (very often true). Sum scores were used, and higher scores represented greater levels of childhood maltreatment. Internal consistencies of this scale were adequate (Bernstein et al., 2003; Bernstein & Fink, 1998). Because emotional abuse and emotional neglect were highly correlated (r = .69), we calculated a mean score representing emotional trauma. We did the same for physical abuse and neglect (r = .49).
Measures of well-being and adaptive functioning
The Satisfaction with Life Scale (SWLS; Diener et al., 1985) consists of five items that assess a person’s satisfaction with life in general (e.g., “In most ways my life is close to ideal”), rated on a 7-point Likert-type scale ranging from 1 (very much opposed) to 7 (strongly agree). Reported internal consistency and 2-month test-retest reliability for scores on the SWLS were .87 and .82, respectively (Diener et al., 1985).
The Perceived Stress Scale (Cohen et al., 1983) consists of 14 items that assess the degree to which situations in a person’s life are appraised as stressful (e.g., “In the past month, how often have you felt nervous and ‘stressed out’?”), rated on a 5-point Likert-type scale ranging from 1 (never) to 5 (very often). Internal consistency and construct validity of this scale were previously supported (Roberti et al., 2006).
The Emotion Regulation Questionnaire (Gross & John, 2003) consists of 10 items that assess both suppression (e.g., “I keep my emotions to myself”) and reappraisal (e.g., “When I want to feel less negative emotion [such as sadness or anger], I change what I’m thinking about”) strategies, rated on a 7-point Likert-type scale ranging from 1 (strongly disagree) to 7 (strongly agree) on the basis of frequency of using each strategy. Convergent and discriminant validity of this scale were previously supported (Gross & John, 2003).
The Emotion Regulation Questionnaire–Self-Efficacy (Goldin, Manber, et al., 2009) assesses how capable participants believe they are of using reappraisal and/or suppression when they really want to and uses the same item set described above. Participants rated their agreement or disagreement with each item on a scale from 1 (strongly disagree) to 7 (strongly agree). This scale has good reliability and construct validity (Gross & John, 2003).
Functional MRI data analysis
Acquisition
In the replication sample only, fMRI data were collected using a 3T magnet (Signa; GE Healthcare, Chicago, IL) with a T2*-weighted gradient-echo spiral-in/out pulse sequence (Glover & Law, 2001). Twenty-four ascending interleaved axial slices were acquired (slice thickness = 4.5 mm; single shot; repetition time = 1.5 s; echo time = 28.5 ms; flip angle = 65°; field of view = 220 mm; matrix size = 64 × 64; voxel resolution = 3.438 mm2 × 4.5 mm). Each patient completed one functional run during which 230 functional volumes were acquired. Data collected during the first four pulses were discarded to allow for equilibration effects. Before functional imaging, a high-resolution T1-weighted structural image was acquired using fast spin-echo spoiled gradient recall (132 slices; repetition time = 3 s; echo time = 68 ms; field of view = 220 mm; matrix size: 256 × 256; voxel size = 1 × 1 × 1.2 mm). Head movement was restricted using a bite-bar and foam padding.
Preprocessing
Using SPM12, we corrected the data for motion via realignment to the first volume (using a six-parameter rigid body transformation) and slice-time corrected (to the middle slice). Each participant’s T1 image was bias corrected and segmented using a nonlinear deformation field to map it onto template (ICBM) tissue probability maps for gray/white matter and cerebrospinal fluid. Parameters obtained from this step were subsequently applied to the functional data (resampled to 3 mm3 voxels) during normalization to the Montreal Neurological Institute (MNI) space. The data were spatially smoothed using an 8-mm3 full-width at half-maximum Gaussian kernel to reduce the impact of interparticipant variability in brain anatomy.
First-level analysis
Multiple regression analyses were conducted at the first level using the following regressors convolved with a canonical hemodynamic response function: (a) instruction (question) cue, (b) negative self-judgment, (c) positive self-judgment, (d) negative case judgment, and (e) positive case judgment. To account for residual noise, the model also included six motion parameters from realignment and framewise displacement time course. The model included a high-pass filter (128-s cutoff) to remove low-frequency drifts.
We focused on DMN activation given its theoretical relevance to self-referential processing and SAD. We extracted and averaged mean β values from two regions identified as core nodes of the DMN (Andrews-Hanna et al., 2010) using coordinates from a meta-analysis of self-referential processing (Northoff et al., 2006). These regions were the medial prefrontal cortex (10-mm sphere centered on the coordinates x = −2, y = 49, z = 7) and posterior cingulate cortex (10-mm sphere centered on the coordinates x = −3, y = −61, z = 31; see Fig. S1 in the Supplemental Material). We extracted mean β values separately for the positive self-judgment > case judgment contrast and negative self-judgment > case judgment contrast.
Clustering analysis
We used k-means clustering, implemented in MATLAB (Version 9.3; The MathWorks, Natick, MA), to identify subgroups of patients with SAD. Given our sample size and the fact that specifying a higher number of clusters would have resulted in clusters with low participant numbers and run the risk of overfitting, we restricted the analysis to a two-cluster solution. The initial input features to the clustering algorithm were the percentage of positive and negative trait words endorsed by each participant. Subsequently, we added mean activation within the DMN during positive and negative judgments as additional input features. To ensure that all input features had equal weight, data were z-scored before clustering. By using a small number of input features and testing the clustering approach in independent samples, we maximized the likelihood of discerning replicable subgroups.
Statistical analyses
The two clusters were compared on relevant outcome variables using independent samples t tests using two-tailed p values. For the discovery sample, p values for the comparison of clusters in relation to childhood maltreatment were Bonferroni corrected for the three tests performed. The p values for the comparison of clusters in relation to well-being measures were corrected using the false-discovery rate (FDR). Replication findings were considered significant at p = .05 (two-tailed).
Results
Preliminary analyses
For a description of demographics for the two samples and correlations among study variables, see Tables S1 and S2 in the Supplemental Material.
Discovery sample
patients with SAD were divided into two clusters according to their profile of trait-endorsement scores from the self-referential encoding task. We classified 55.8% (n = 53) of the participants as belonging to Cluster 1 and 44.2% (n = 42) as belonging to Cluster 2 (Fig. 1a). Compared with those in Cluster 2 (positive self), participants in Cluster 1 (negative self) endorsed fewer positive traits (Cluster 1: M = 24.62%; Cluster 2: M = 61.33%) and more negative traits (Cluster 1: M = 69.53%; Cluster 2: M = 34.34%). This clustering pattern reveals substantial heterogeneity within the SAD sample, given that subgroups demonstrated marked differences in self-beliefs. Although SAD is thought to be associated with primarily negative self-beliefs, here we discover a subgroup with overall positive self-beliefs. Note that the two clusters did not differ on demographic characteristics: years of education: t(89) = −1.61, p = .11; age: t(93) = −0.65, p = .52; sex: χ2(1, N = 95) = 0.02, p = .89.
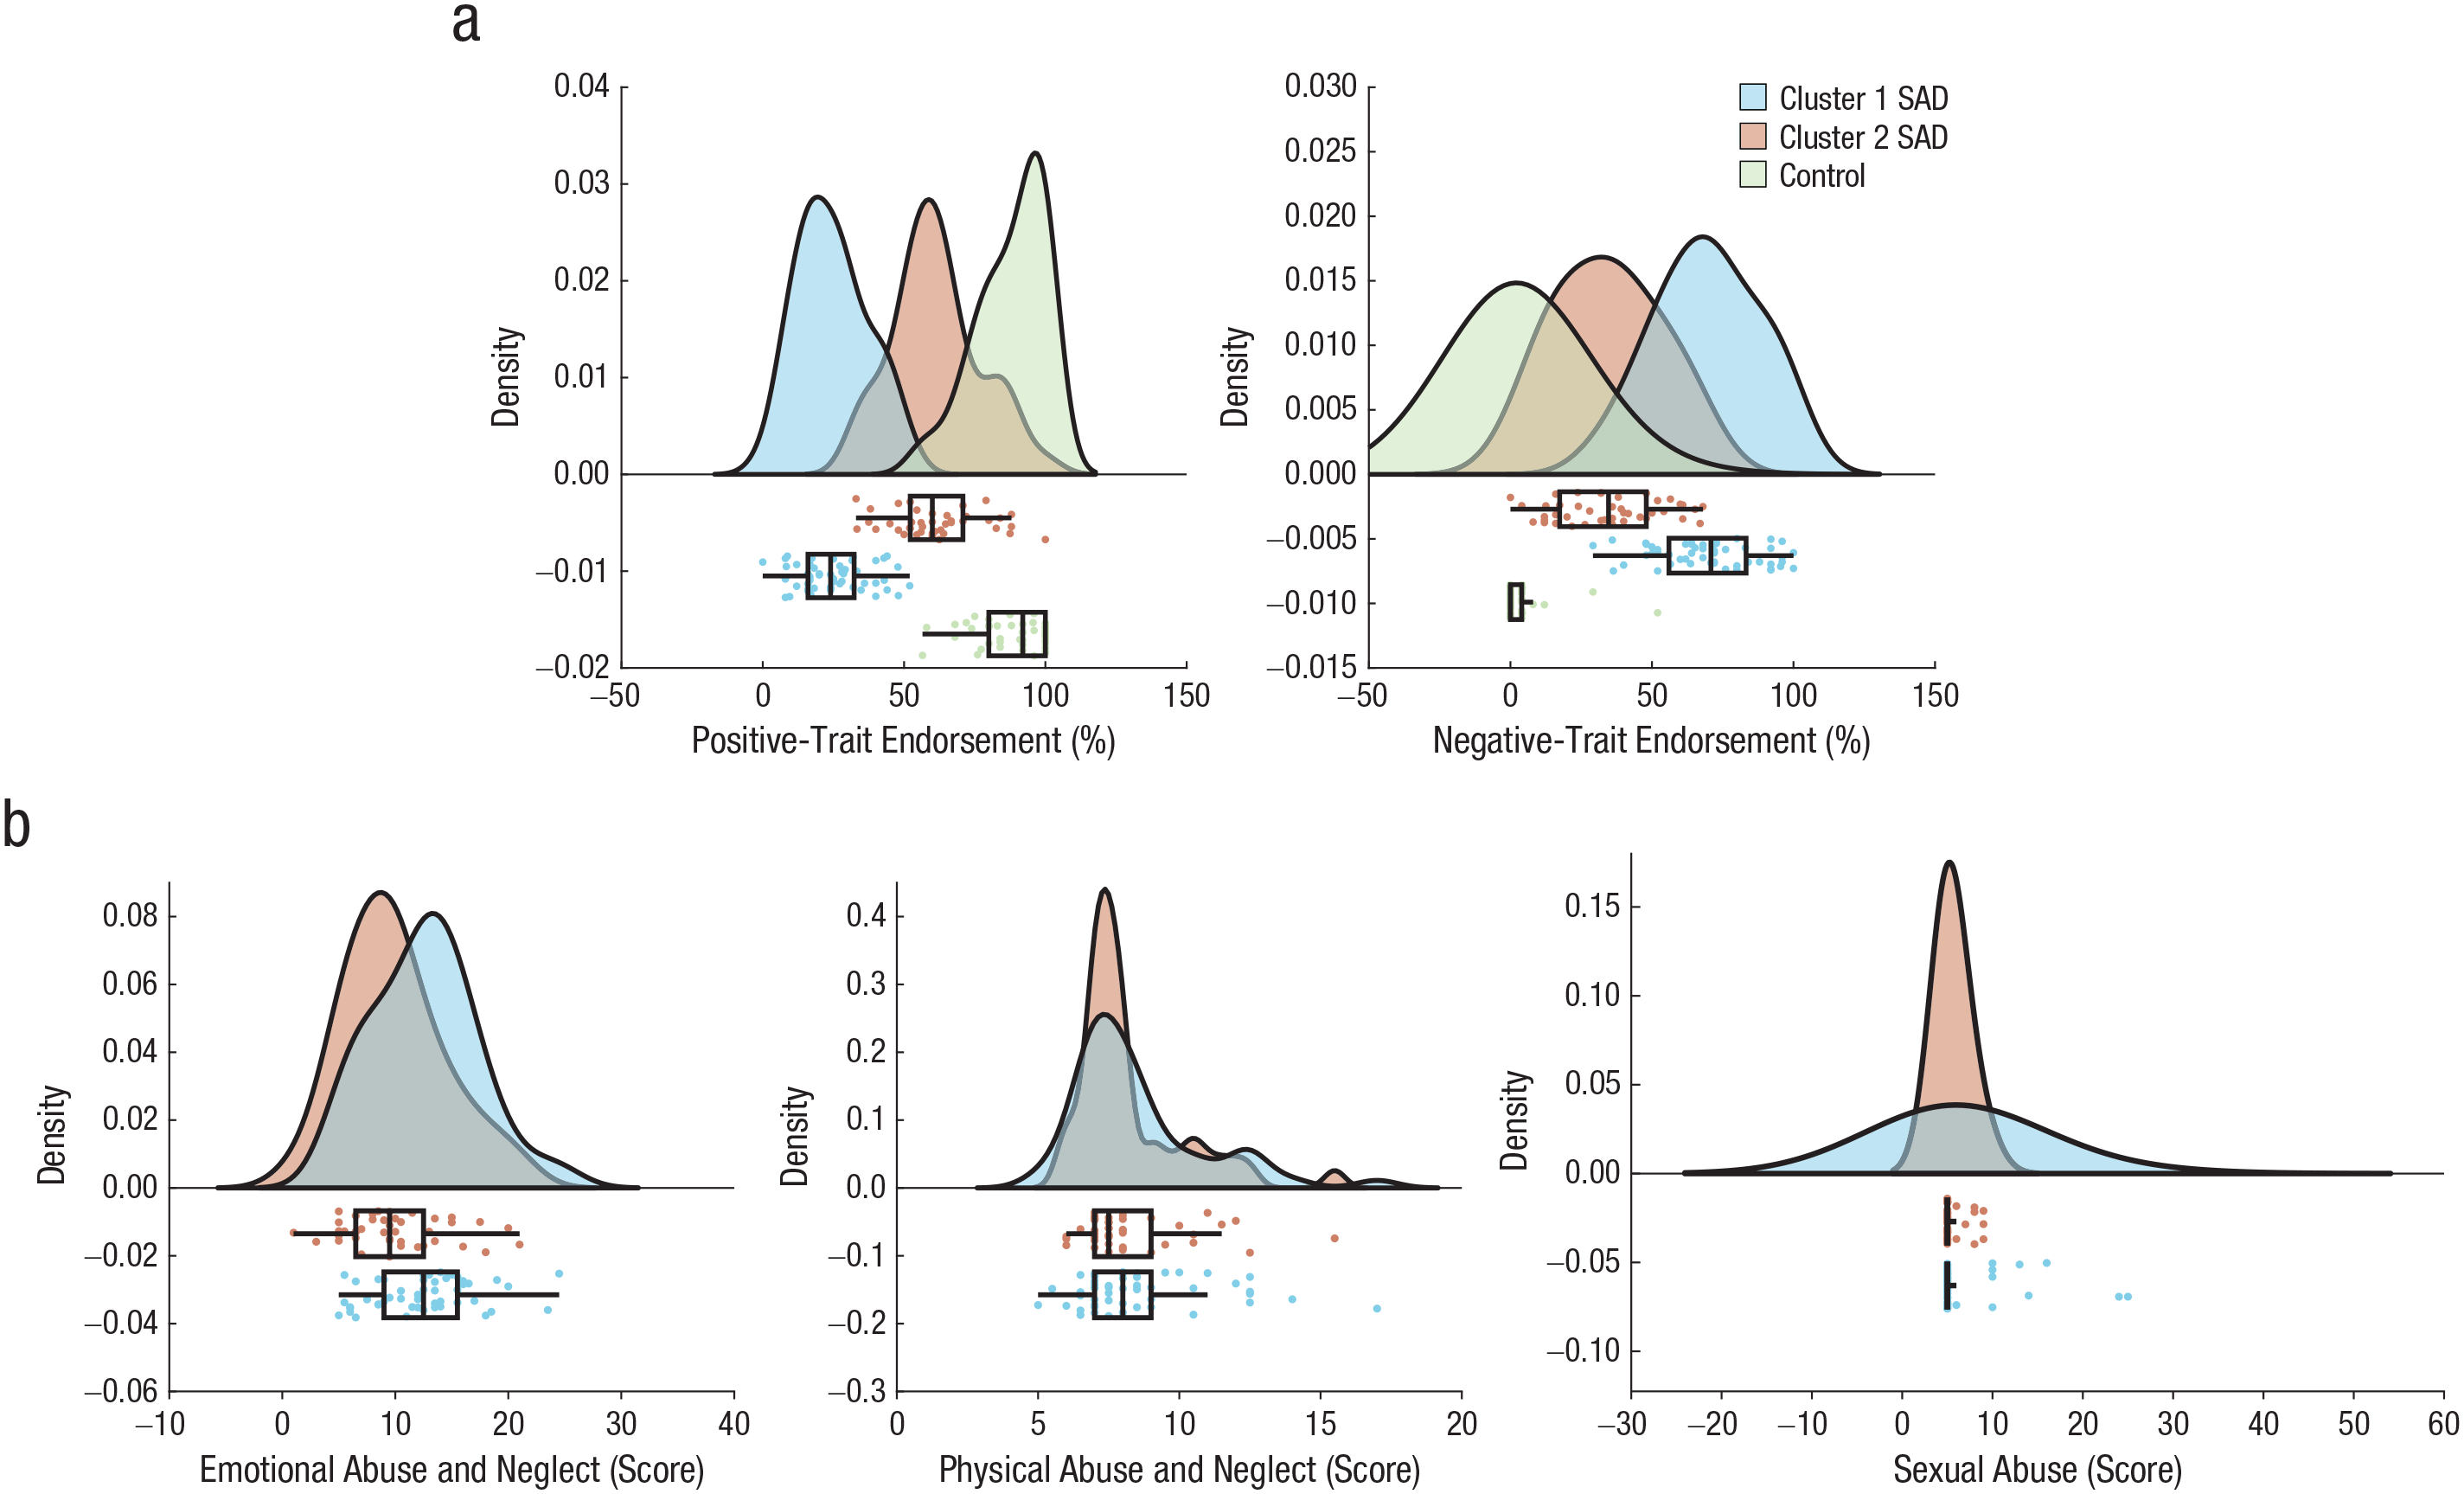
Distinct profiles of positive and negative self-referential trait endorsement in discovery sample social anxiety disorder (SAD) clusters. (a) Compared with Cluster 2 patients, Cluster 1 patients were less likely to endorse positive traits and more likely to endorse negative traits. (b) The clusters also differed in exposure to emotional abuse and neglect but not physical abuse and neglect or sexual abuse. In the top part of each plot, the curves indicate the probability density. In the lower part of each plot, the boxes indicate the interquartile range (IQR), and the vertical line inside the boxes indicates the median. The “Tukey” whiskers span 1.5× the IQR. The Raincloud plots were generated using open-source code (Allen et al., 2019).
Note that despite showing relatively more positive self-beliefs, participants in Cluster 2 were largely distinct from a sample of control participants (n = 43) on both positive self-beliefs, t(83) = 8.77, p < .001, and negative self-beliefs, t(83) = 9.82, p < .001 (Fig. 1a). This highlights the fact that we have identified disorder-relevant neurocognitive heterogeneity rather than a more general form of heterogeneity that might be present across individuals regardless of group (disorder status).
We next compared the clusters with respect to self-reported levels of exposure to three types of childhood maltreatment (Fig. 1b). These analyses revealed that the two clusters differed in self-reported emotional maltreatment, t(90) = 2.81, p = .02 (Bonferroni corrected); Cluster 1 (negative self) reported higher levels of emotional maltreatment (M = 12.54, SD = 4.57) than Cluster 2 (positive self; M = 9.87, SD = 4.50). Breaking down emotional maltreatment, we found that the clusters differed in both emotional abuse, t(90) = 2.01, p = .048, and emotional neglect, t(86) = 2.54, p = .01. Note that the two clusters did not differ in levels of self-reported exposure to physical maltreatment, t(90) = 0.59, p > .99 (Bonferroni corrected), or exposure to sexual abuse, t(90) = 1.77, p = .25 (Bonferroni corrected). This reveals a potentially selective relationship between the SAD groups we identified and early-life exposure to emotional trauma.
The clusters differed in self-reported social anxiety severity (see Fig. S2a in the Supplemental Material). Cluster 1 (negative self) reported greater severity (M = 89.16, SD = 20.46) than Cluster 2 (positive self; M = 78.76, SD = 16.29), t(92) = 2.68, p = .01.
To illuminate the functional significance of the identified clusters, we performed exploratory analyses comparing the clusters on subjective well-being and emotion regulation (Fig. 2). Compared with Cluster 2 (positive self), Cluster 1 (negative self) reported lower satisfaction with life, t(92) = 5.85, p < .001 (FDR corrected), and higher stress, t(92) = 3.75, p < .001 (FDR corrected). Cluster 2 (positive self) reported more use of reappraisal to regulate emotion in daily life than Cluster 1 (negative self), t(85) = 2.99, p < .001 (FDR corrected). The clusters did not differ in perceived self-efficacy of using reappraisal, t(29) = 1.01, p = .39; frequency of using suppression, t(85) = 1.05, p = .39 (FDR corrected); or self-efficacy of using suppression as an emotion-regulation strategy, t(85) = 0.09, p = .93 (FDR corrected). These results reveal that the clusters defined on the basis of self-referential processing also differ in some aspects of subjective well-being and emotion-regulation-strategy use.
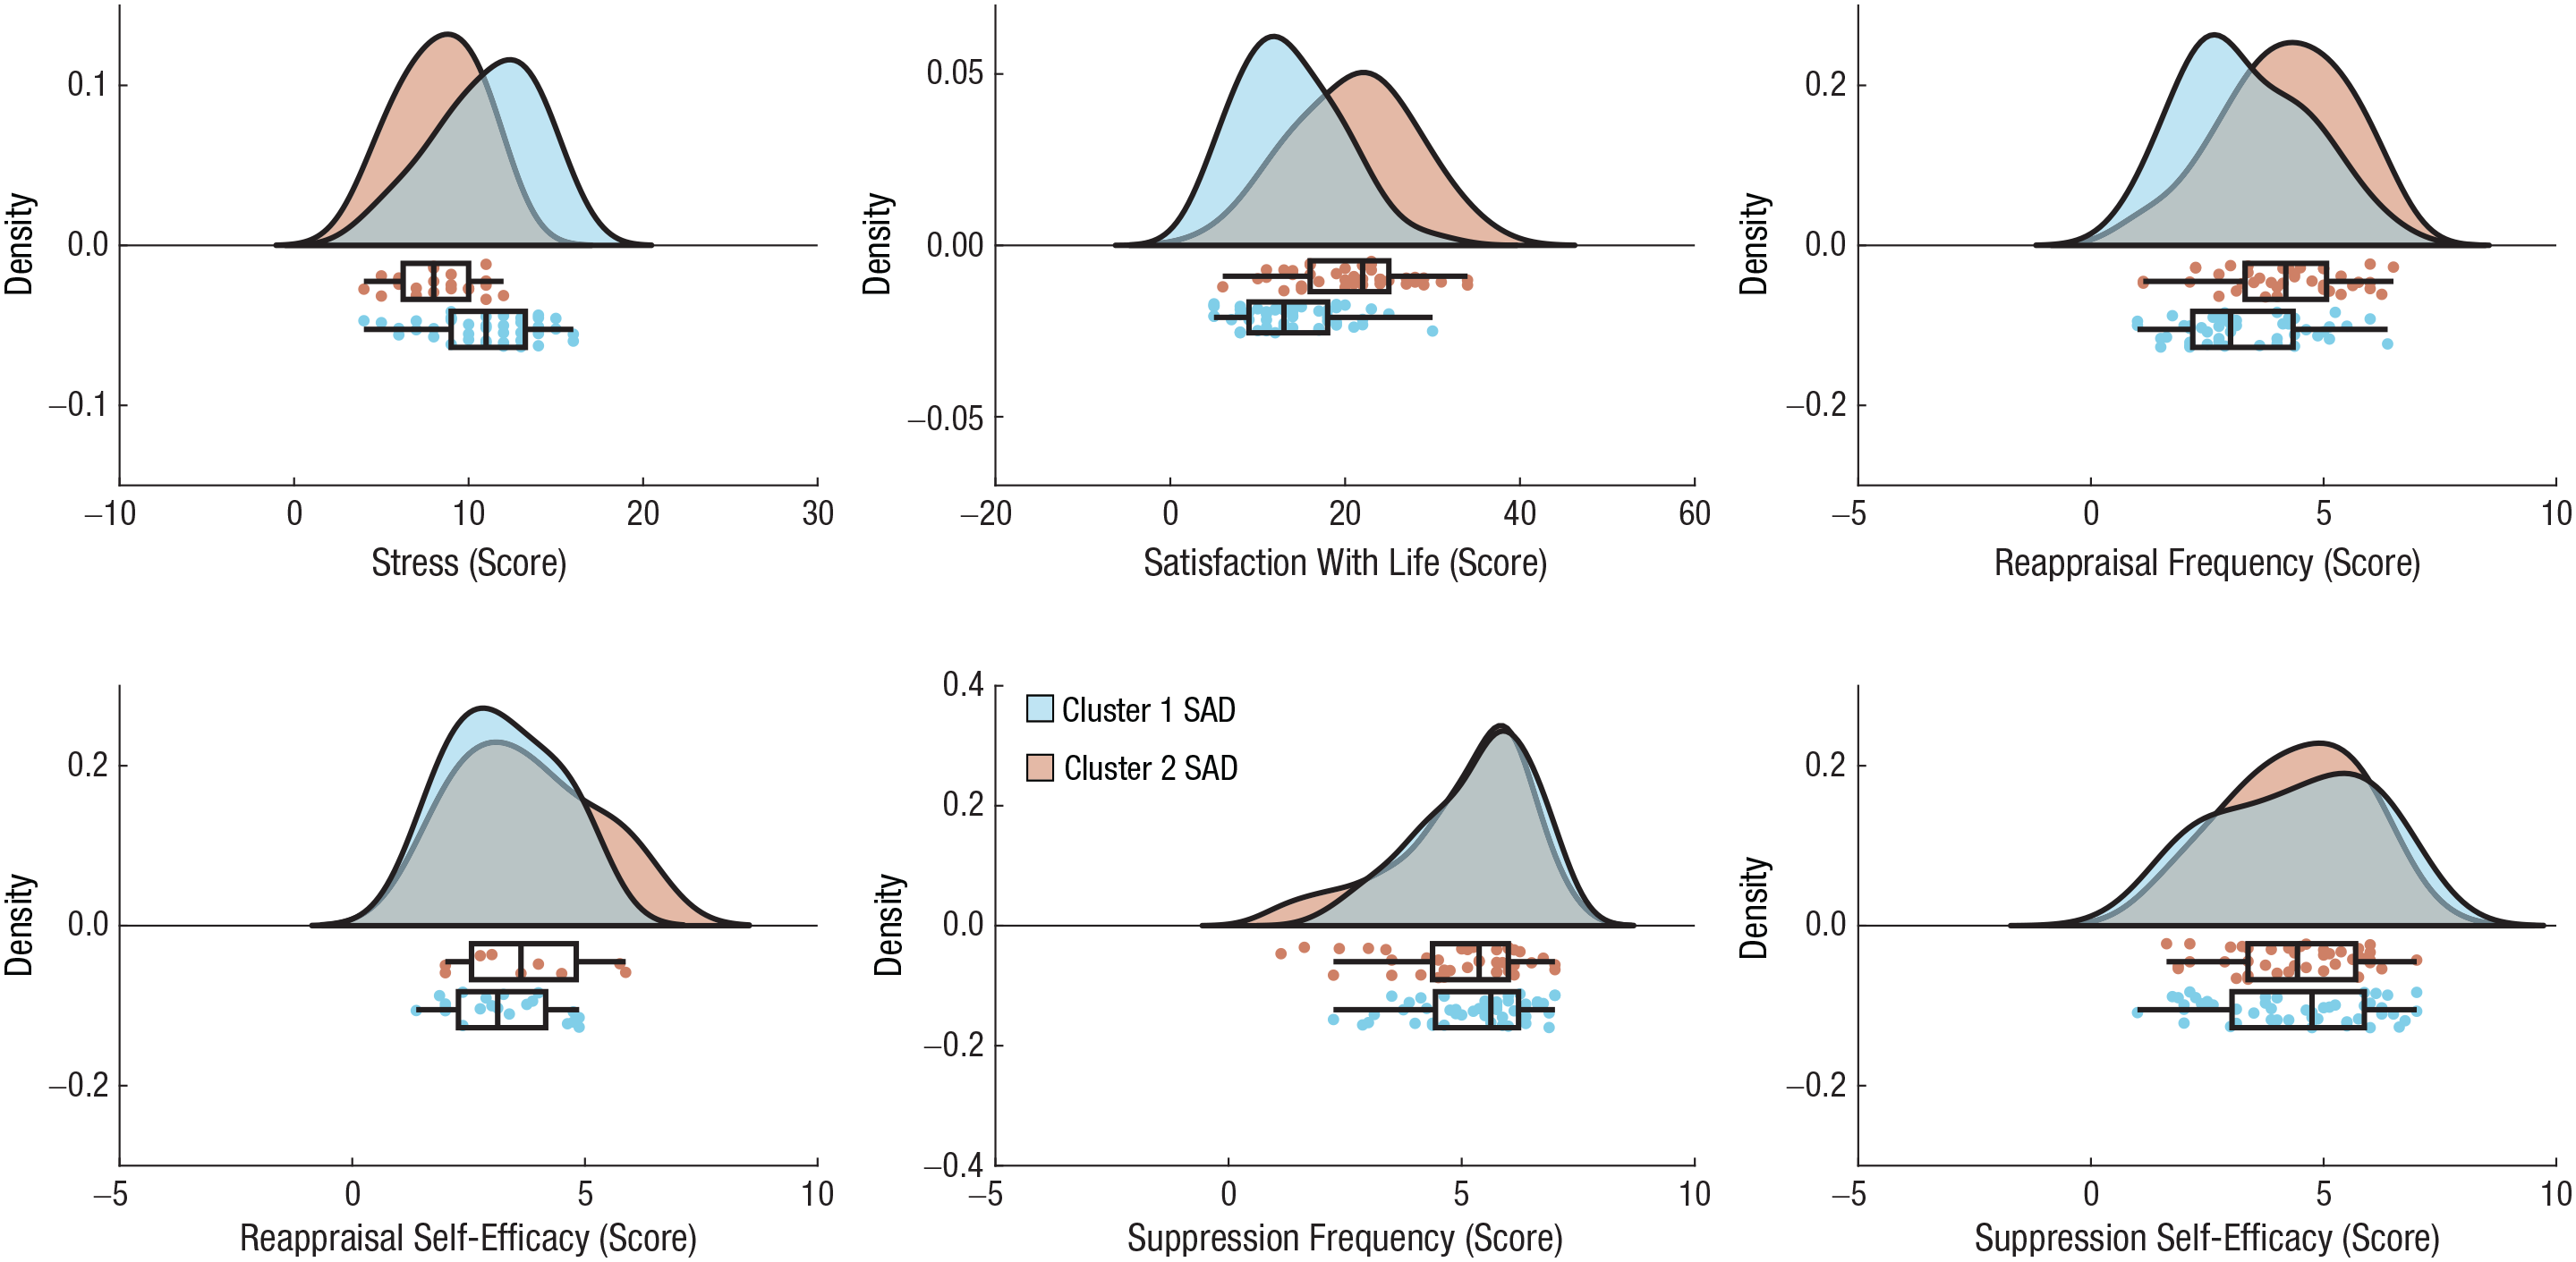
Subjective well-being and emotion-regulation-strategy use as a function of social anxiety disorder (SAD) cluster in the discovery sample. In the top part of each plot, the curves indicate the probability density. In the lower part of each plot, the boxes indicate the interquartile range (IQR), and the vertical line inside the boxes indicates the median. The “Tukey” whiskers span 1.5× the IQR. The Raincloud plots were generated using open-source code (Allen et al., 2019).
Replication sample
Results from the replication sample supported the major findings from the discovery sample. In this case, 73.2% (n = 71) of participants were classified as belonging to Cluster 1 (negative self), and 26.8% (n = 26) were classified as belonging to Cluster 2 (positive self), again revealing subgroups with marked differences in self-beliefs (see Fig. S3A in the Supplemental Material). In the replication sample, we again found that Cluster 2 was largely distinct from a sample of control participants (n = 34) on both positive self-beliefs, t(58) = 4.46, p < .001, and negative self-beliefs, t(58) = 5.05, p < .001 (see Fig. S3A in the Supplemental Material).
As in the discovery-sample results, the clusters differed in emotional maltreatment, t(95) = −2.24, p = .03, but not physical maltreatment, t(95) = 0.90, p = .40, or sexual abuse, t(95) = 0.18, p = .45 (see Fig. S3B in the Supplemental Material).
There was also a replication of group differences in well-being variables (see Fig. S4 in the Supplemental Material), with Cluster 1 (negative self), compared with Cluster 2 (positive self), reporting lower satisfaction with life, t(95) = 6.27, p < .001, and more stress, t(95) = −3.88, p < .001. There was no difference between clusters in the frequency or self-efficacy of using reappraisal or suppression (all ps > .2). There was no difference between clusters in social anxiety severity (see Fig. S2B in the Supplemental Material), t(95) = −0.95, p = .34, or demographic characteristics: years of education: t(93) = 0.11, p = .91; age: t(94) = 0.92, p = .36; gender: χ2(1, N = 96) = 0.11, p = .74.
Replication sample with brain data
Clustering participants on the basis of behavioral and brain data (DMN activation) resulted in slightly more balanced subgroups (in terms of sample size) than without the inclusion of brain data; 63.8% (n = 60) of participants belonged to Cluster 1 (negative self) and 36.2% (n = 34) belonged to Cluster 2 (positive self; see Fig. 3a). Beyond the differences in trait endorsement, Compared with Cluster 2, Cluster 1 exhibited higher DMN activation during negative trait judgments (Fig. 3b). We again found that Cluster 2 was largely distinct from a sample of control participants on both positive self-beliefs, t(69) = 6.24, p < .001, and negative self-beliefs, t(69) = 6.69, p < .001. Cluster 2 did not differ from control participants in DMN activation during positive self-belief judgments (t < 1) but significantly differed in DMN activation during negative self-belief judgments, t(69) = 2.09, p = .04. Cluster 2 also differed from Cluster 1 in DMN activation during negative self-belief judgments, t(95) = 3.01, p = .003, highlighting the contribution of brain data in distinguishing SAD subgroups.
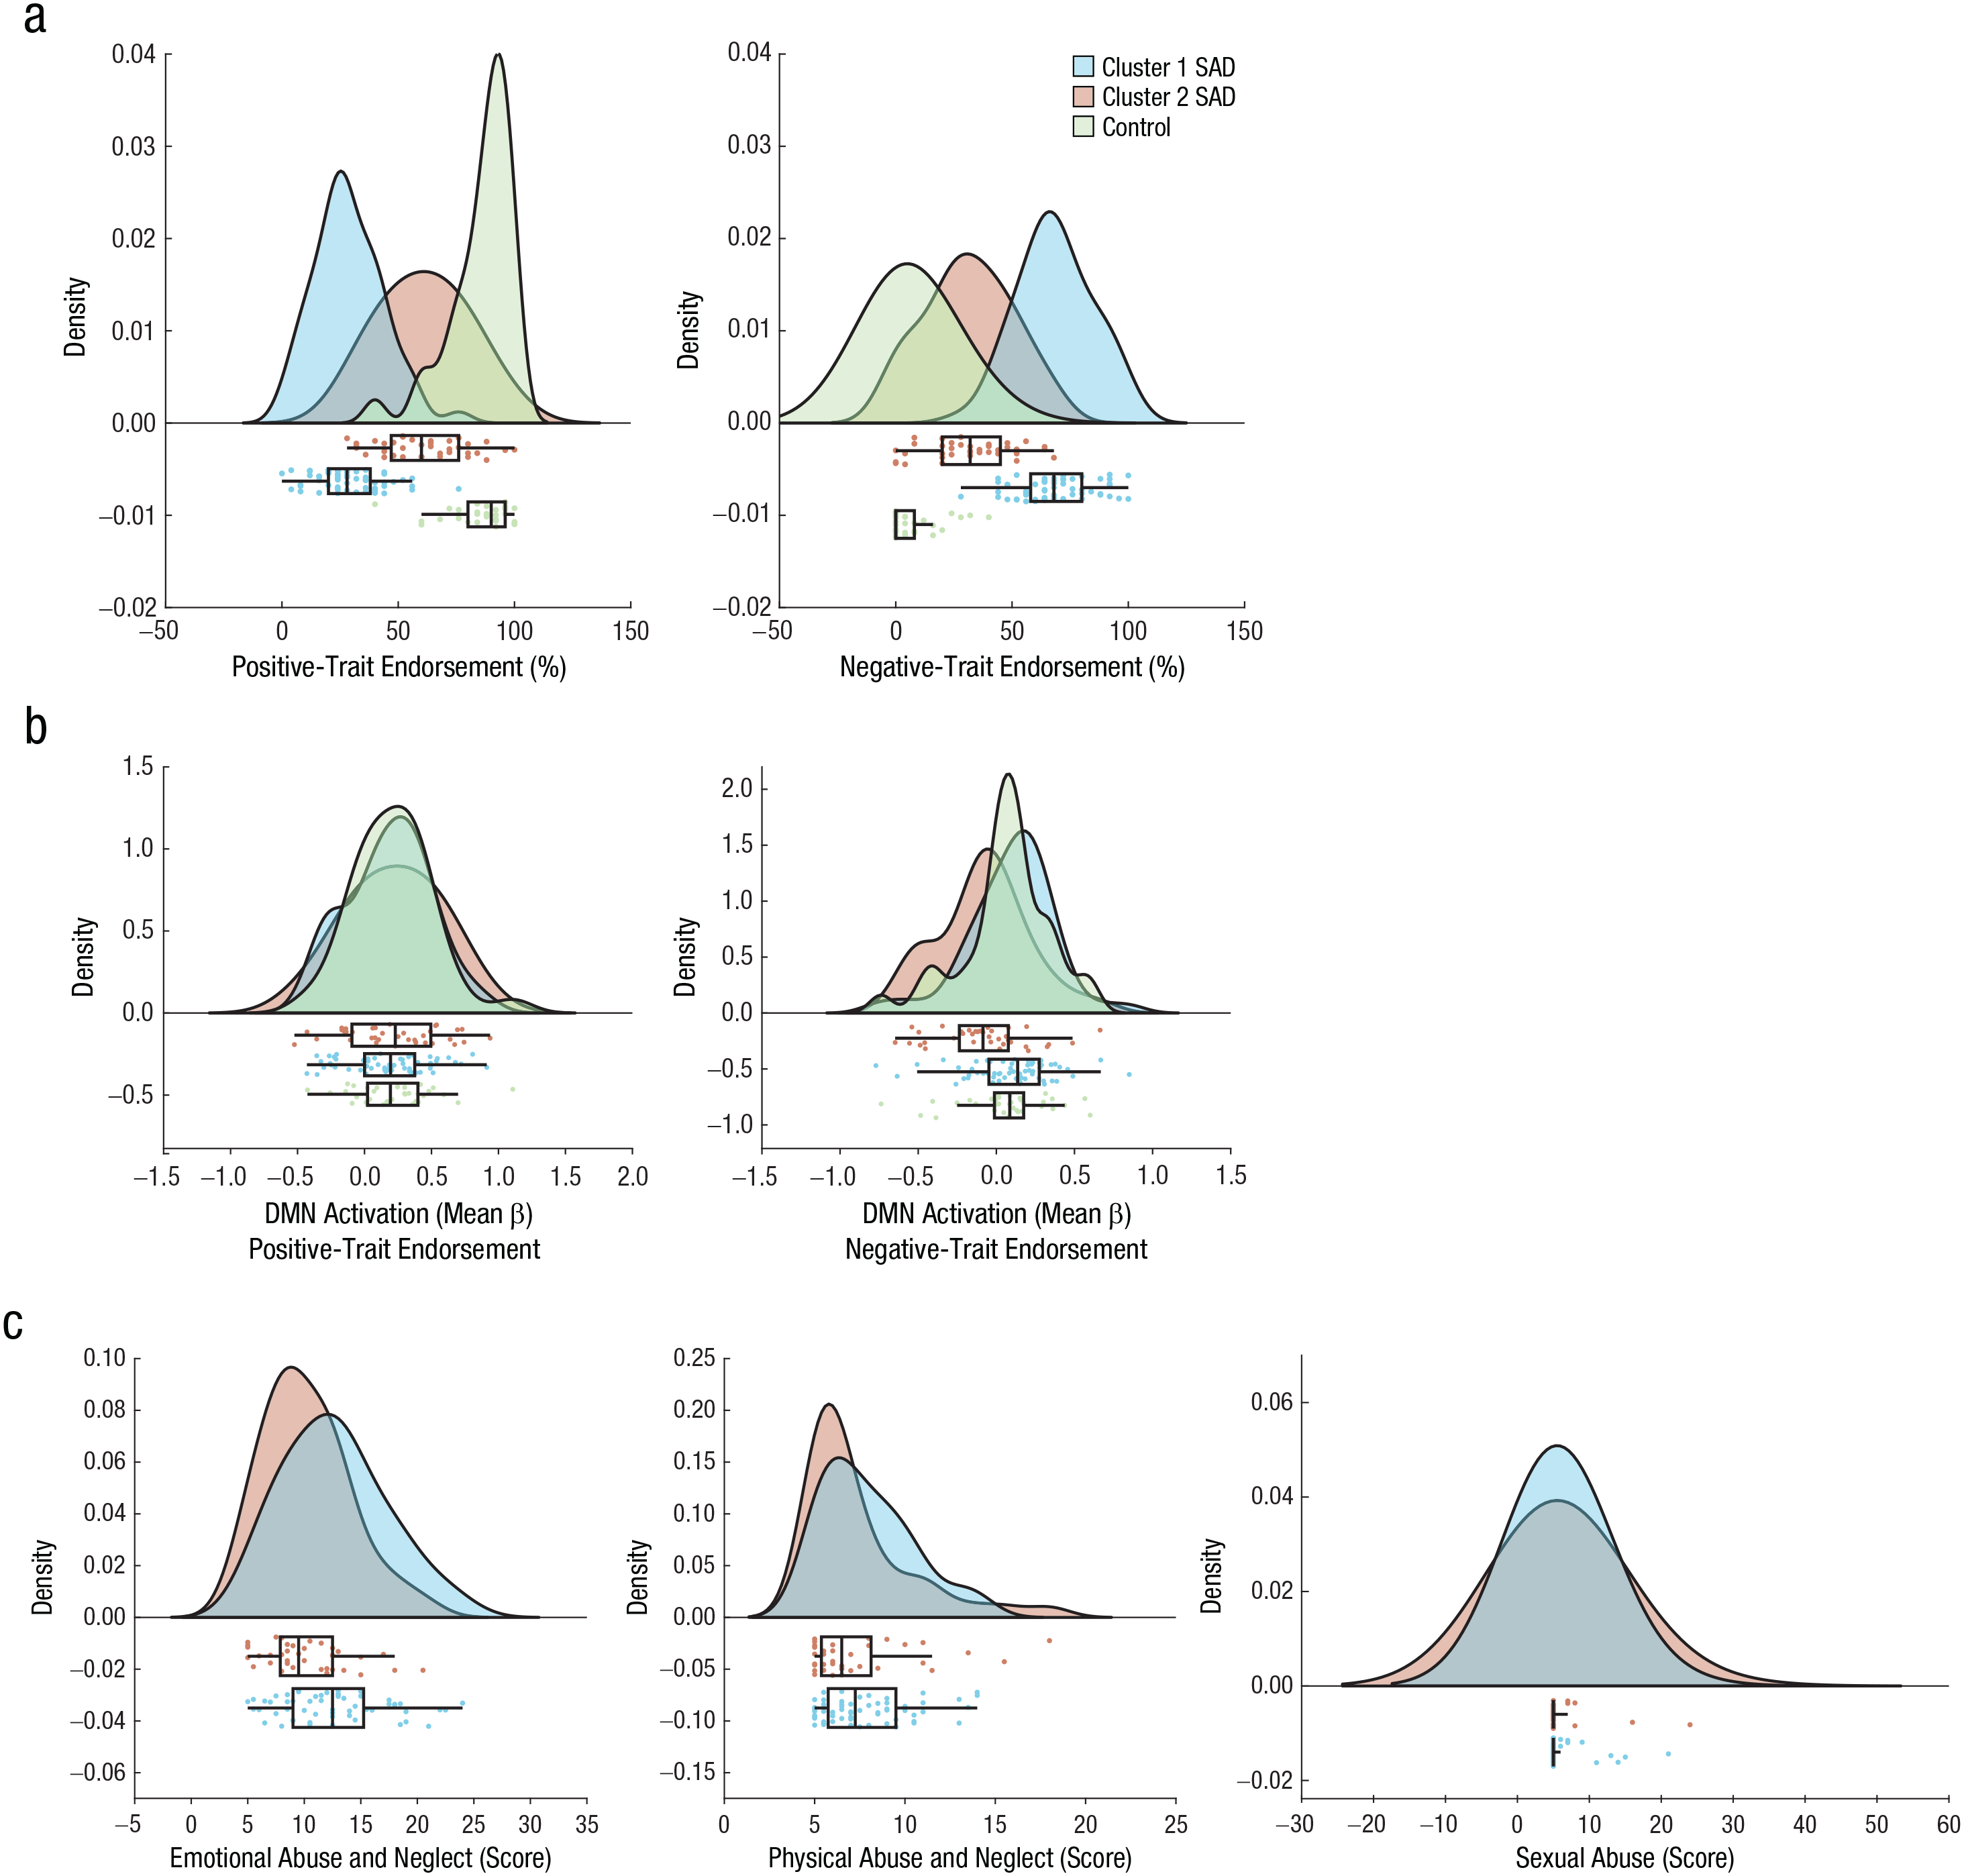
Distinct profiles of positive and negative self-referential trait endorsement in replication-sample social anxiety disorder (SAD) clusters. (a) Compared with Cluster 2 patients, Cluster 1 patients were less likely to endorse positive traits and more likely to endorse negative traits. (b) Compared with Cluster 2 patients, Cluster 1 patients demonstrated greater default-mode network (DMN) activation during negative trait judgments. (c) The clusters also differed in exposure to emotional abuse and neglect but not physical abuse and neglect or sexual abuse. In the top part of each plot, the curves indicate the probability density. In the lower part of each plot, the boxes indicate the interquartile range (IQR), and the vertical line inside the boxes indicates the median. The “Tukey” whiskers span 1.5× the IQR. The Raincloud plots were generated using open-source code (Allen et al., 2019).
The two clusters differed in self-reported emotional maltreatment, t(92) = −2.66, p = .01, but not physical maltreatment, t(92) = −0.45, p = .75, or sexual abuse, t(92) = 0.28, p = .78 (Fig. 3c).
The pattern of findings for the well-being measures was similar to those previously reported (Fig. 4). However, in this case, the clusters did significantly differ in the frequency of using reappraisal, t(92) = 2.79, p = .01 (similar to the discovery sample). The clusters did not differ in social anxiety severity (see Fig. S2C in the Supplemental Material), t(92) = −0.93, p = .36, or demographic characteristic: years of education: t(90) = 1.41, p = .16; age: t(90) = 0.83, p = .41; gender: χ2(1, N = 92) = 1.02, p = .31.
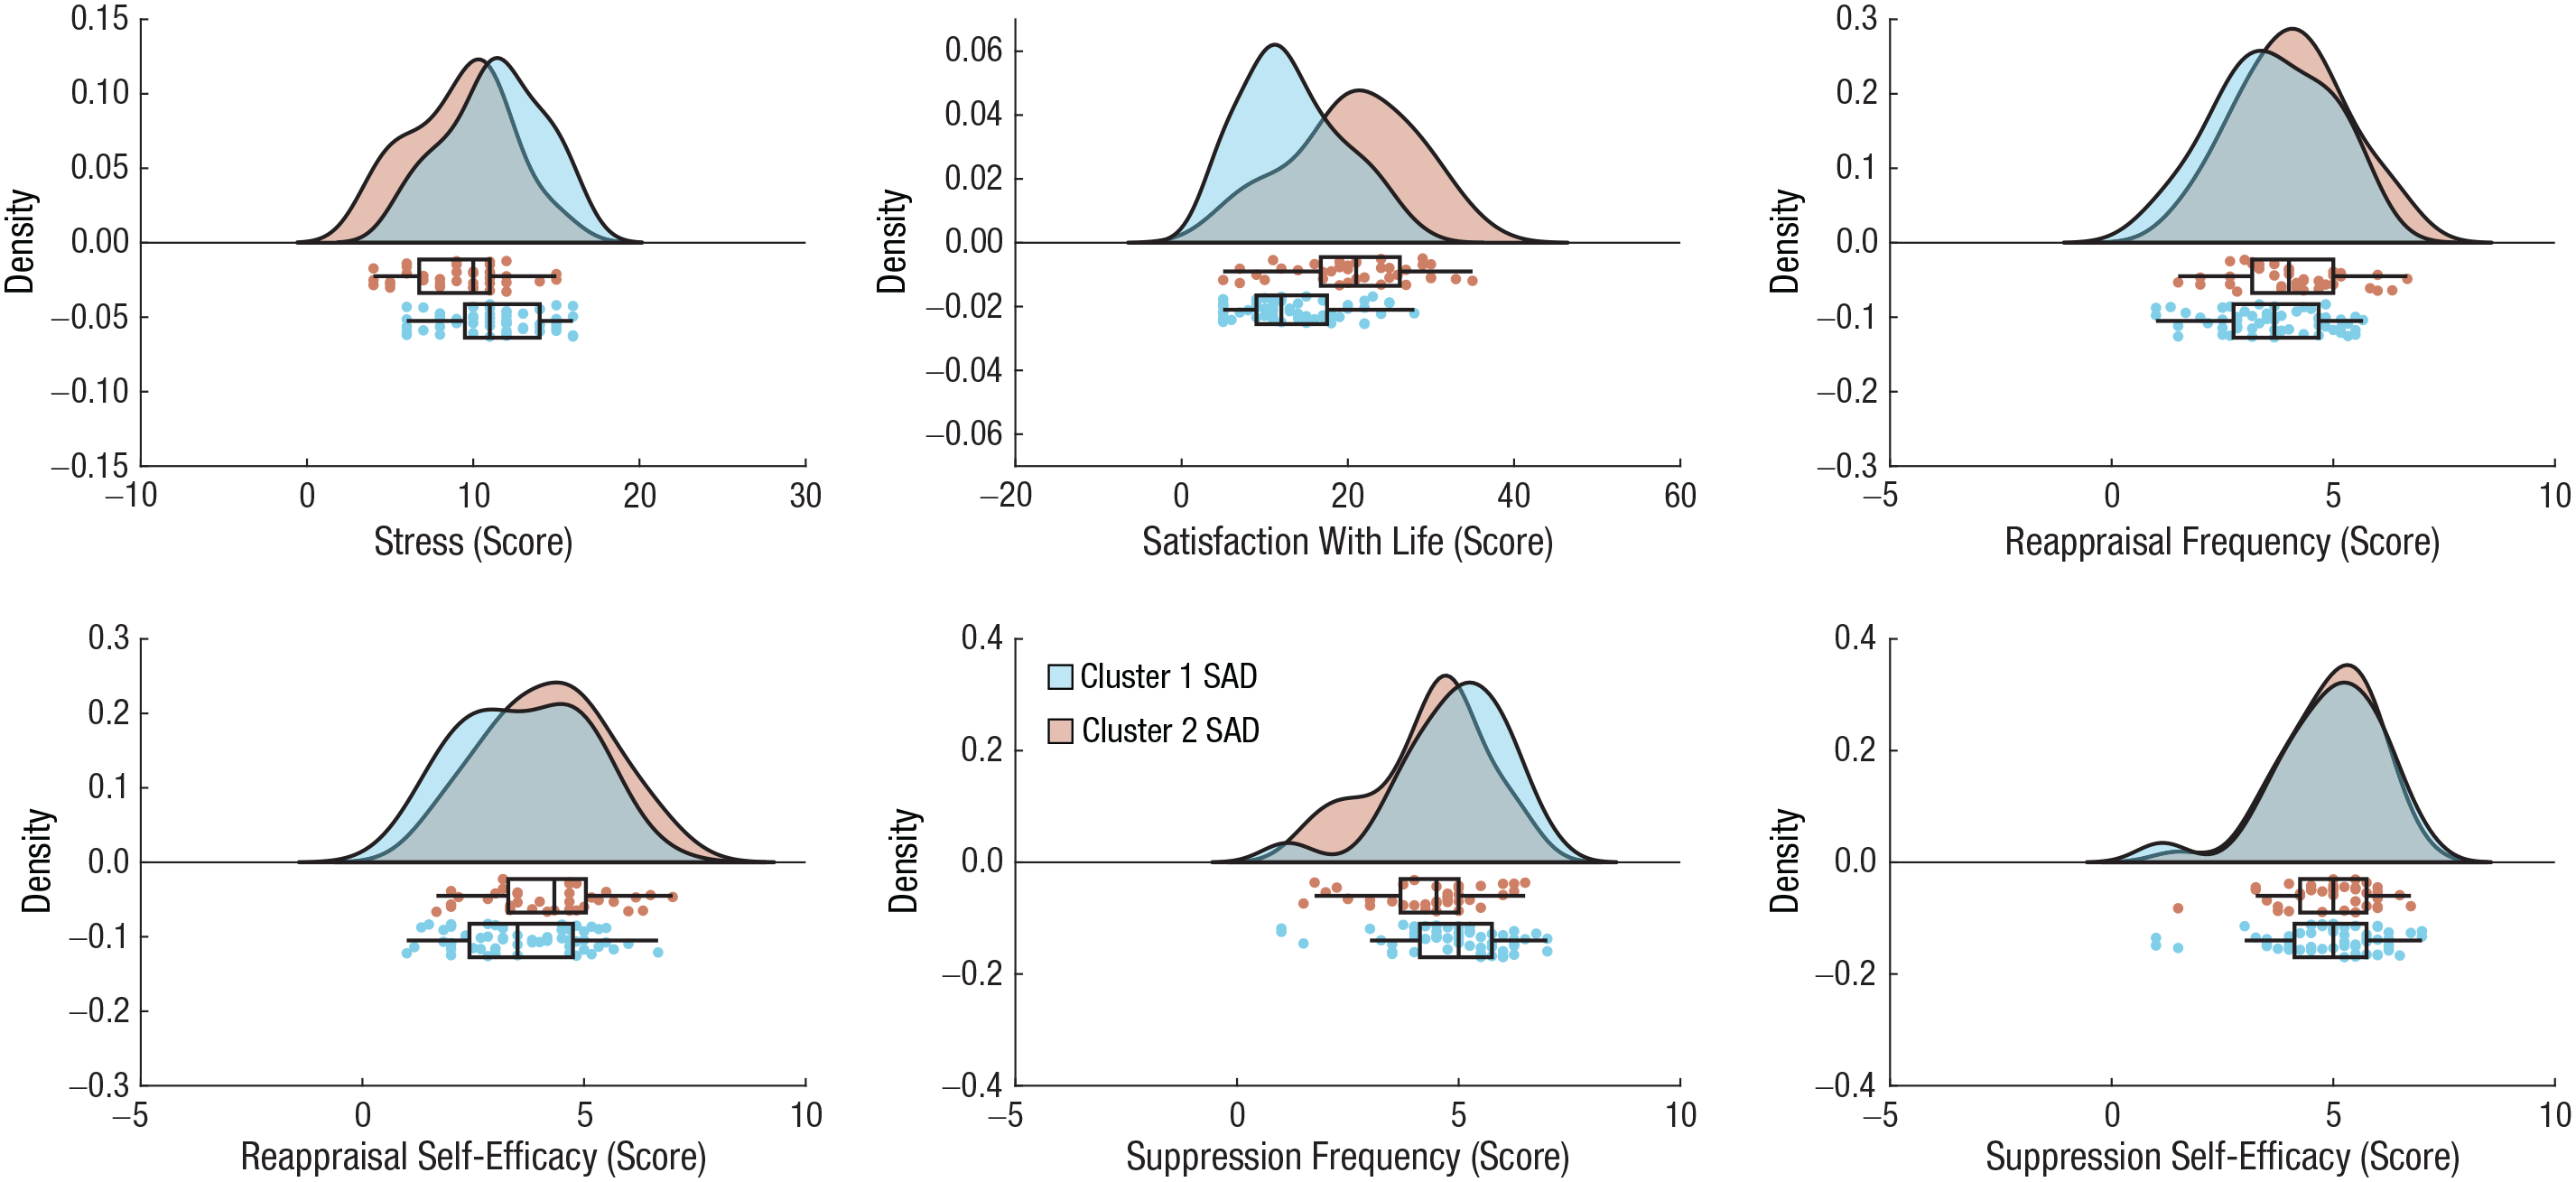
Subjective well-being and emotion-regulation-strategy use as a function of social anxiety disorder (SAD) cluster in the replication sample. In the top part of each plot, the curves indicate the probability density. In the lower part of each plot, the boxes indicate the interquartile range (IQR), and the vertical line inside the boxes indicates the median. The “Tukey” whiskers span 1.5× the IQR. The Raincloud plots were generated using open-source code (Allen et al., 2019).
Discussion
In the current study, we combined a data-driven approach with a constrained set of theoretically relevant input features (positive and negative self-beliefs and DMN activation) to reveal significant heterogeneity within a population of clinically diagnosed patients with SAD. Although patients with SAD demonstrate predominantly negative self-beliefs on average (Goldin, Manber-Ball, et al., 2009), we identified two distinct clusters of patients. One cluster demonstrated the expected pattern of predominantly negative self-beliefs, whereas the other cluster demonstrated more positive self-beliefs than negative self-beliefs. The clusters also differed in DMN activation strength during negative self-trait judgments. Critically, although SAD Cluster 2 demonstrated more positive self-beliefs than negative self-beliefs, they still formed a distinct group from a sample of control participants. This indicates that the heterogeneity that we observed in self-referential processing is capturing meaningful subpopulations within the SAD group itself rather than more general neurocognitive variation spanning the entire population (independent of disorder status).
In the discovery sample—but not the replication sample—we found that the clusters differed in the severity of social anxiety symptoms. This raises the possibility that SAD heterogeneity is simply a function of symptom burden and not directly tied to self-referential processing. However, we do not think this interpretation is consistent with the data given that the difference between clusters was large and consistent (replicable) with respect to patterns of self-beliefs and was small and inconsistent (nonreplicable) with respect to symptom severity. Thus, although we cannot fully rule out overall symptom burden as being relevant to describing SAD heterogeneity, our findings strongly suggest that variation in self-referential processing has a stronger and more consistent relationship with SAD heterogeneity and therefore more explanatory value. Self-referential processing is known to affect attention (Zhao et al., 2015), valuation (Berkman et al., 2017; Dixon et al., 2017), and decision-making (Johnson et al., 2005; Sui & Humphreys, 2015) and may therefore serve as a critical process that mediates interactions between individuals and their environment.
We found a replicable relationship between the identified clusters and reports of childhood maltreatment. The clusters significantly differed in level of exposure to childhood emotional abuse and neglect but did not differ in level of exposure to physical or sexual trauma. This reveals a selective relationship between SAD subgroups and emotional trauma and suggests that early life experiences may play a role in driving heterogeneity within SAD. We believe that this evidence has theoretical and practical value. First, it demonstrates that early life adversity is associated with the specific presentation of SAD later in life. Prior work has linked emotional maltreatment to the degree of dysfunction in patients with SAD (Bruce et al., 2012). We further show that it is also linked to meaningful subgroups of patients with SAD defined using self-referential processing. Childhood emotional trauma may significantly affect an individual’s emerging self-concept (Davis et al., 2001; Frewen et al., 2011) and may bias learning such that negative feedback from others becomes more salient than positive feedback—a pattern observed in SAD (Koban et al., 2017). This may create a perpetuating effect, leading to a predominantly negative self-concept.
Second, there are clinical implications of these findings. Although both cognitive behavioral therapy (CBT) and mindfulness/acceptance-based approaches are effective in reducing SAD symptoms and improving quality of life (Goldin et al., 2016; Goldin & Gross, 2010; Koszycki et al., 2007), it is also possible that different patients may benefit more from one treatment or the other. Patients with SAD with more positive than negative self-beliefs and who experienced less childhood maltreatment may benefit from CBT and focusing on harnessing positive self-beliefs and challenging negative self-beliefs. On the other hand, patients with predominantly negative self-beliefs and a history of emotional maltreatment may benefit from combining CBT with mindfulness/acceptance-based approaches and possibly relational therapy to facilitate the process of confronting deeply ingrained patterns of emotional trauma and reactivity. More broadly, our findings suggest that considering the patterns of self-referential processing and childhood experiences may be informative about the type of treatment that could be most beneficial for different people who share the same clinical diagnosis on the basis of their classically defined symptoms. In fact, changes in maladaptive self-beliefs during CBT have shown to serve as predictors for change in social anxiety reports at posttreatment (Gregory et al., 2018; Thurston et al., 2017). Therefore, including a brief measure of self-beliefs may be useful in guiding treatment and predicting patients’ ability to benefit from therapy. This is a key topic to address in future research.
Several aspects of our study design are noteworthy. First, we took advantage of the simplicity of probing self-referential processing using a widely used task that is easy to administer. This may provide an alternative to DSM-defined symptoms for grouping patients into meaningful subgroups. Moreover, given that negative self-beliefs are common to other disorders (e.g., depression; Nejad et al., 2013), it may provide a transdiagnostic feature for discerning neurocognitive subtypes. Second, we used two large samples of independently acquired patients with SAD and used a theoretically informed clustering approach based on a small number of input features. This methodology allowed us to identify easily interpretable and generalizable clustering patterns.
Several limitations should be noted. First, we divided patients with SAD into clusters on the basis of a simple set of features. Although this has noted advantages, there may be a multitude of features that may be informative about SAD subgroups and could potentially provide even more detail about how such heterogeneity relates to measures of well-being and treatment response. Second, we used a limited number of well-being outcome variables. Future research could investigate other domains of well-being to provide a more comprehensive picture. Third, additional insight could be gleaned by including patients with a variety of disorders to look for transdiagnostic subgroups that differ in self-referential processing. Finally, the use of a cross-sectional design rather than longitudinal design and retrospective measure of childhood maltreatment precludes causal interpretations about its relationship with SAD heterogeneity.
Supplemental Material
sj-pdf-1-cpx-10.1177_21677026211004452 – Supplemental material for Neurocognitive Heterogeneity in Social Anxiety Disorder: The Role of Self-Referential Processing and Childhood Maltreatment
Supplemental material, sj-pdf-1-cpx-10.1177_21677026211004452 for Neurocognitive Heterogeneity in Social Anxiety Disorder: The Role of Self-Referential Processing and Childhood Maltreatment by Anat Talmon, Matthew Luke Dixon, Philippe R. Goldin, Richard G. Heimberg and James J. Gross in Clinical Psychological Science
Footnotes
Transparency
Action Editor: Erin B. Tone
Editor: Kenneth J. Sher
Author Contributions
P. R. Goldin, R. G. Heimberg, and J. J. Gross developed the study concept and the study design. M. L. Dixon and A. Talmon performed the data analysis and interpretation and outlined and drafted the manuscript. J. J. Gross, P. R. Goldin, and R. G. Heimberg provided critical revisions. All of the authors approved the final manuscript for submission.
References
Supplementary Material
Please find the following supplemental material available below.
For Open Access articles published under a Creative Commons License, all supplemental material carries the same license as the article it is associated with.
For non-Open Access articles published, all supplemental material carries a non-exclusive license, and permission requests for re-use of supplemental material or any part of supplemental material shall be sent directly to the copyright owner as specified in the copyright notice associated with the article.