
Abstract
In aviation security, on-person screening quality is dependent on security screeners accurately translating the location of a digital 2D alarm to a 3D passenger using mental spatial scaling. Currently, security screeners are shown an alarm on a generic human figure (avatar) designed to protect passenger privacy. The problem is that the avatar may be overly generic and it can be challenging for security screeners to quickly and confidently locate the threat. To compensate, security screeners may increase their search area to guarantee that the threat is found. In prior work, an avatar design with relevant landmarks improved location accuracy. For this study, we compared the redesigned avatar to three other avatar designs that are used by on-person screening vendors. The results of the study showed that screeners had significantly smaller search areas (30% smaller) and were closer to the true target location (15% closer) when using the redesigned avatar.
Keywords
Introduction
Passengers flying through U.S. domestic airports are required to have their person and property searched before boarding an aircraft. In many cases, part of the screening process includes passengers walking through systems that use millimeter wave technology to detect prohibited items being carried by the passenger.
Should the system detect a threat, the system displays the alarm location on a generic representative human figure. This generic avatar was mandated by the FAA Modernization and Reform Act of 2012 to protect passenger privacy (U.S. House of Representatives, 2012). The avatar, commonly referred to as the “Gingerbread Man” (Nosowitz, 2011), is the outline of a person (e.g., head, body, arms, legs, hands, feet) which is used to display the general location of a possible threat without any features unique to the individual.
While the Gingerbread Man excels at protecting privacy, the lack of landmarks common to both the avatar and the passenger can make it challenging for security screeners to determine where to start their search. For example, suppose an alarm (e.g., rectangle) is present on the leg of the avatar (Figure 1). Because the leg is represented by a single unbroken block, it can be difficult to determine if the alarm is above or below the knee.

A cartoon example of what a Gingerbread Man avatar could look like.
To compensate for the lack of landmarks, security screeners may need to increase their search area to guarantee that the threat is found. While the increased search area makes threat detection more likely, the expanded search increases the time to screen each passenger, causing lower throughput, longer lines, and more frustration or discomfort for travelers and screeners.
As demonstrated by research in spatial scaling, the addition of landmarks can increase location accuracy and decrease the time to map a target to a referent (Frick & Newcombe, 2012; Gilligan et al., 2018; Huttenlocher et al., 1991, 1999; Möhring et al., 2016; Vasilyeva & Huttenlocher, 2004). To test whether the addition of landmarks would improve the performance of security screeners, a study by Zish et al. (2021) designed 6 new avatars for a simulated on-person screening task. Each design added landmarks in the form of additional detail in the outline of the avatar (e.g., Gingerbread Man, Joints, Passenger Outline) and/or the gridlines between body segments (e.g., Gridlines at Body Segments or No Gridlines). The results of Zish et al. (2021) showed that the addition of landmarks improved location accuracy. An avatar with an outline that showed the joint locations of the passenger and had gridlines increased location accuracy by 20% compared to a design similar to the Gingerbread Man. Critically, the joints and gridlines design improved location accuracy while preserving passenger privacy.
In this study, we compared the performance of the redesigned avatar from Zish et al. (2021) with three other avatars produced by on-person screening equipment vendors. Because there are few regulatory constraints on avatar design, vendors are free to develop an avatar with any number of landmarks or body detail so long as the avatar displays locations accurately and anonymously. While organizations may certify equipment based on technical standards such as alarm location accuracy and privacy, this study measures how each design influences human performance for locating and searching for alarms.
Method
Design
This is a between-subjects design with a single factor called Design. Design had 4 levels:
1.) An avatar from an on-person screening vendor with gridlines (21 segments on the front and 20 on the back);
2.) An avatar from the same on-person screening vendor with no gridlines;
3.) An avatar from a different on-person screening vendor with no gridlines;
4.) The redesigned avatar from Zish et al. (2021).
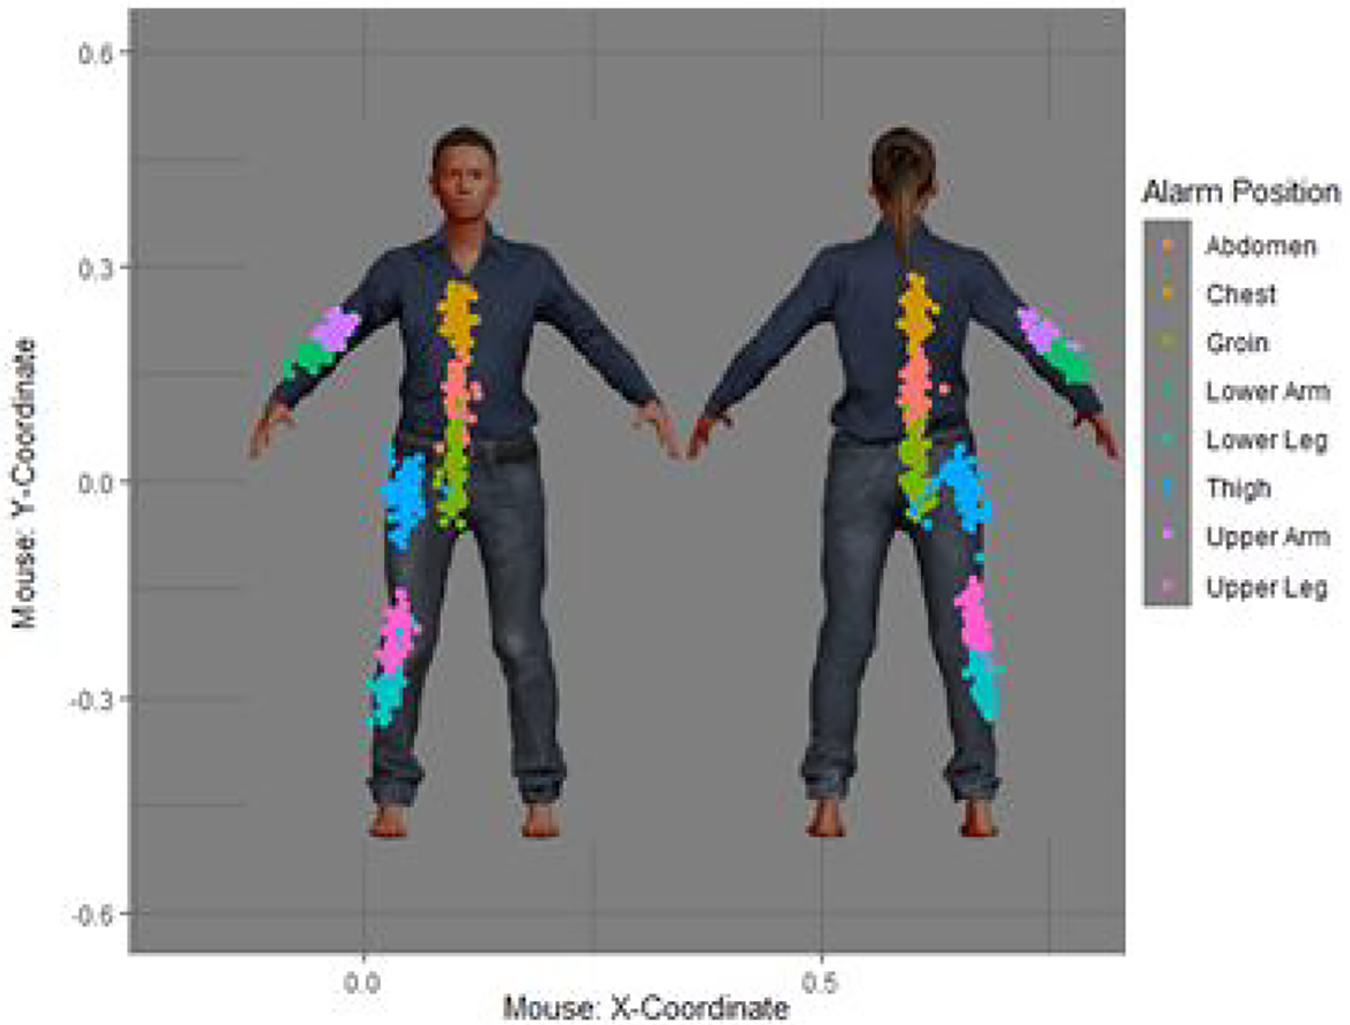
Designs 1 through 3 are from legacy on-person screening vendors. We intentionally do not display or identify the vendors or their designs. However, Figure 2 shows an example of Design 4 which was based on the recommendations of Zish et al. (2021). Figure 2 includes a front and back image of the avatar. The avatar has an outline that identifies joints by narrowing the limbs that correspond with their locations (e.g., ankles, knees, hips, wrists, elbows, shoulders, and neck). The trunk of the body is divided into the chest, abdomen, and hips by widening the avatar at the chest and the hips. Joint locations and the division between chest, abdomen, and hips are made explicit using gridlines.
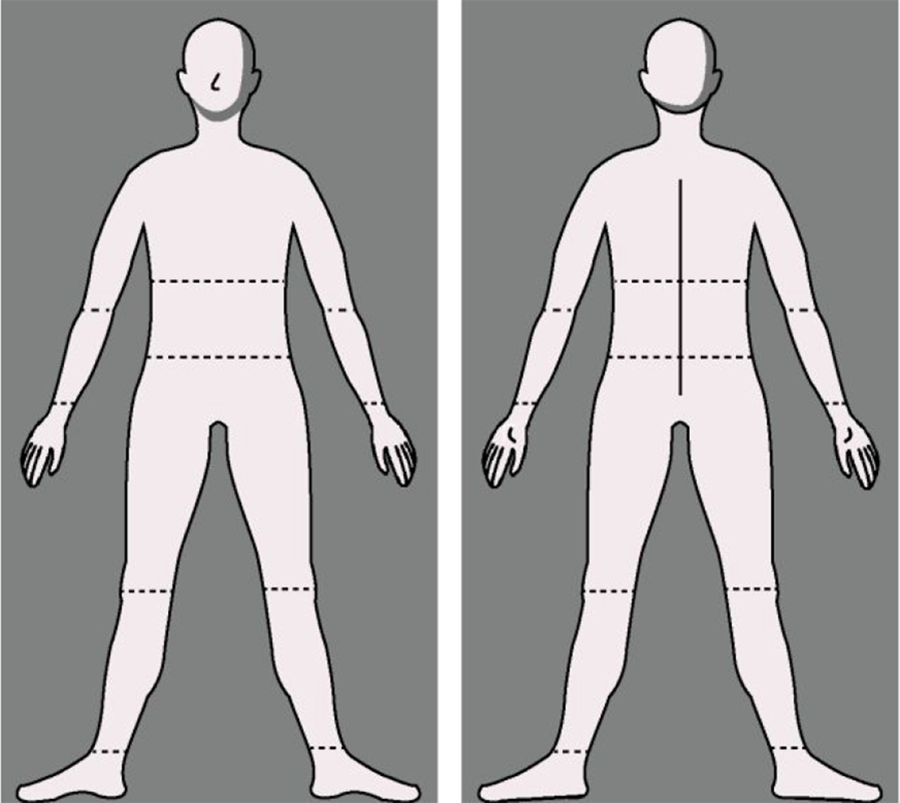
A redesigned avatar based on the recommendations of Zish et al. (2021).
To reduce front and back confusions, we added visual cues that should be independent of a passenger’s unique body features. This included a nose and ankle arches for the front, shading to the right of the face for both the front and the back to suggest a common light source, and a spine and palms for the back. Finally, we used a dark background with an off-white avatar to reduce visual fatigue.
Participants
121 airport security screeners at one domestic airport participated in the study. All screeners provided demographic information about their certifications and experience.
Procedure
Training
The experiment was run using PsychoPy, which is an experimental design builder powered by Python (Peirce et al., 2019).
To familiarize screeners with the task and to confirm that the participants understood the instructions, screeners completed 4 practice trials each with a simulated passenger. Screeners indicated where the alarm was located on each passenger using a mouse to outline where they would search for the threat.
Test
Immediately following completion of the training, participants began the experimental trials. On the left side of the screen, participants were presented with the graphical user interface (GUI) of one of the simulated systems. The GUI presented buttons associated with beginning a passenger scan.
On the right side of the screen, participants were presented with an image of the front and back of a simulated passenger. The passenger was a three-dimensional model developed in Make Human (Make Human, 2020). Eight different passenger models were created by manipulating three features: gender (male vs. female), body shape (thin vs. wide), and clothing fit (loose vs. tight). This resulted in a total of 128 experimental trials. An example simulated passenger is shown in Figure 3.
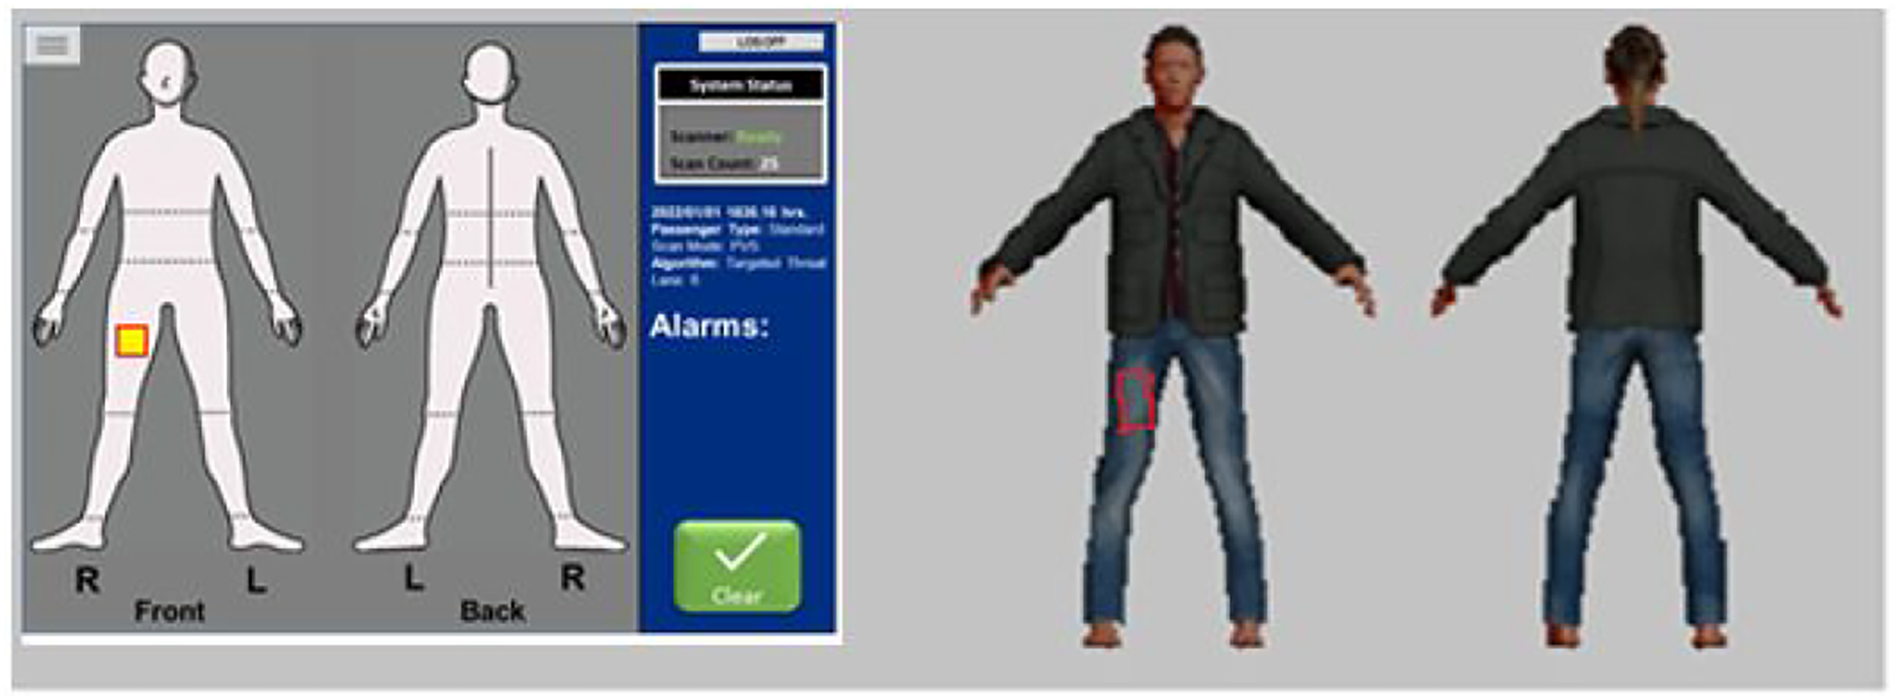
A screenshot of the task showing the use of the brush feature. The alarm (left) is located on the front of the right leg of the passenger. The general location of the alarm is highlighted. The participant has drawn a red box around the location of the threat (right).
To begin, participants initiated a scan by pressing a scan button on the GUI. After initiating a scan, a single alarm was presented on the front or back of the avatar. Participants were told to “draw a box on the area of the passenger where you would perform a targeted pat-down.” They were also asked to stay within or near the boundary of the passenger figure.
Drawing was performed using the brush feature in PsychoPy and mouse movements were tracked. Figure 2 shows an example of a trial where the brush feature was used to draw a box on the simulated passenger (right) to indicate the location of the alarm (left). After participants drew their search area, they clicked a button to “Clear Passenger” and were presented with a new passenger image.
To increase stimulus complexity, alarm locations appeared in 1 of 16 places on the avatar. Half of the alarms appeared on the front and half of the alarms appeared on the back. On the front, alarms were placed above and below joints for one arm and one leg, above and below the center of the chest, and at the groin and the thigh. On the back, alarms were placed in the same areas and on the same limbs. Size, shape, and orientation of the alarms were identical across all systems. Figure 4 shows the location of each alarm.
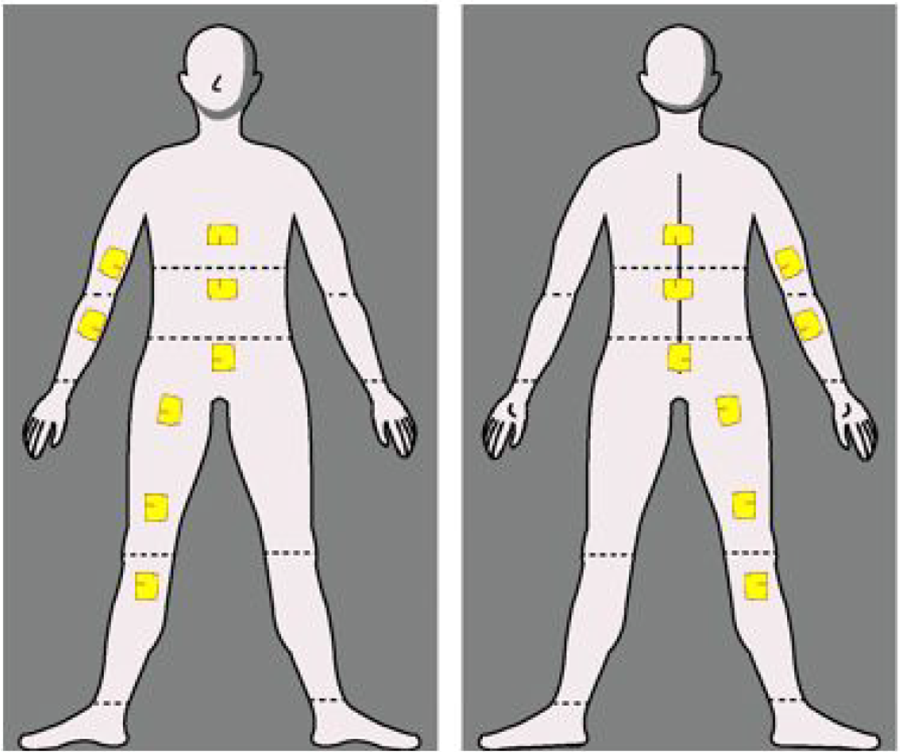
The location for each of the 16 alarms.
Measures
The measures of importance for this study were the size of the search area and distance to the target (i.e., the true alarm location).
We used the absolute height of the search area to simulate the range (minimum to maximum) participants would search for a threat on a passenger. Measuring absolute height minimizes the influence of trials where participants drew their search box outside of the passenger image. Drawing beyond the passenger image occurred due to challenges using the mouse as a drawing tool. Y-height of the search area was calculated as follows: 1) The maximum and minimum y-value were stored for each search area; 2) The minimum y-value was subtracted from the maximum y-value.
Distance-to-target measures how close a participant’s search area was to the target. Distance to the target was calculated as follows: 1) One former screener and subject matter expert (SME) completed a single condition of the study; 2) The SME was instructed to perform a targeted search for each alarm; 3) Each search drawn by the SME was an irregular polygon. The centroid of that irregular polygon was calculated in height units using the poly_center function in the pracma package in R (v2.3.3: Borchers, 2021); 4) The centroid location was calculated for the irregular polygon for each matching trial (i.e., same sex, alarm, width, and clothing) for each participant; 5) The distance to the target was defined as the algebraic distance between the centroid of the SME’s search area and the centroid of the participants search area.
After the experimental trials, participants were given a free-response section to provide additional feedback about the test, the system, or their data.
Results
A total of 121 screeners participated in the study. To investigate how screeners were performing their search, we produced a graphic of each trial for each screener showing the alarm location and the search area. A review of each trial revealed that screeners used several different search strategies. In this paper, we report on the 34 screeners who performed a targeted search as specified in the task instructions which included the target area as well as several inches around the alarm.
Because only a subset of screeners used a search strategy in line with our instructions, it was necessary to use a resampling method to simulate a larger dataset. Using the sample function in the base version of R Statistical Software (v2.3.3; R Core Team, 2021), we randomly sampled, with replacement, the original data from 34 participants 10,000 times balanced across each design, alarm side (front or back), alarm location, sex, width, and clothes. This process resulted in a new resampled dataset of 34 participants. We then tripled our dataset to 102 participants by repeating our random sampling three times. As a consistency check, we ran the resampling process 10 times and performed Analysis of Variance (ANOVA) after each run. The results were consistent among resampled datasets. All results for resampled datasets reported below are for the final resampling run.
When reviewing the analyses, it is important to remember that the y-values for each figure are in height units in PsychoPy. The benefit of using height units is that all images have the same proportions across screen sizes. Controlling for screen size is critical because a variety of test monitors were used based on equipment availability. Most importantly, height units allow for a comparison between monitors. For example, we can represent how much smaller the average search area was for one monitor compared to another as a percentage (e.g., search area was 10% smaller for system A compared to system B). One challenge of using height units is that they are uninterpretable on their own because they do not represent a unit of measurement like pixels or inches. Nevertheless, relative comparisons among height and distance values are valid.
Vertical Search Distance - Resampled Dataset
Figure 5 shows the average minimum and maximum vertical search distance at each alarm position for each system using the dataset of 34 screeners. Search distances are drawn over a picture of a simulated passenger. Figure 5 demonstrates that the search heights for a targeted search were focused on the expected location of the target. Each shape corresponds with a different design.
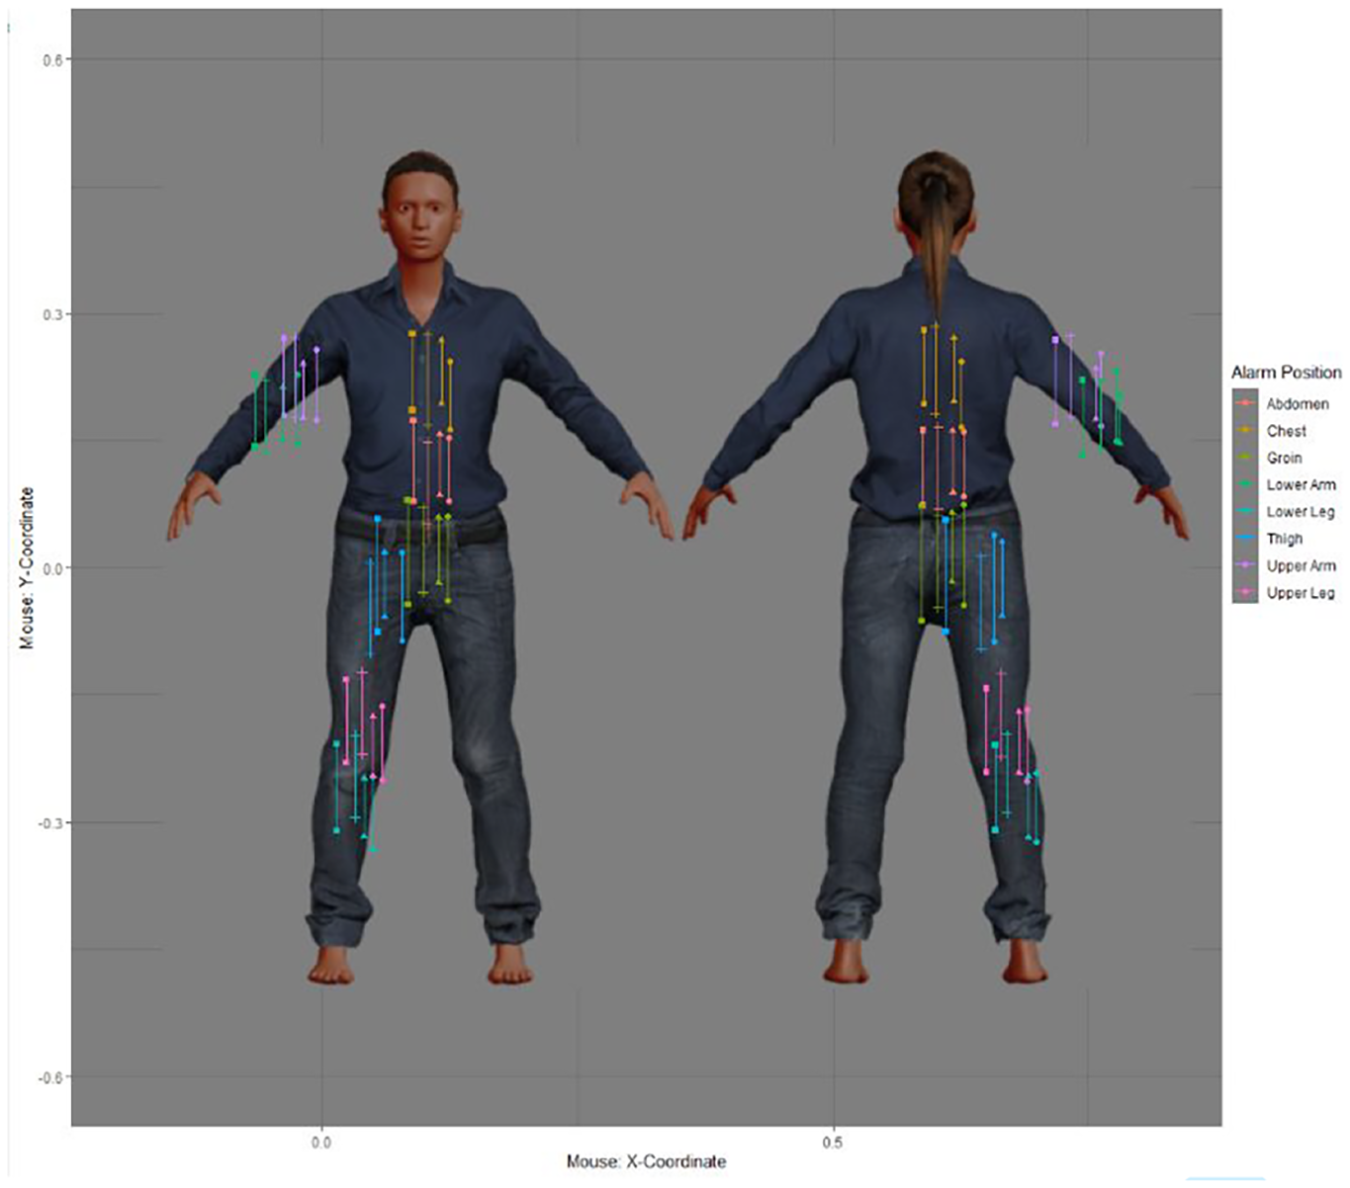
Vertical search distance results by alarm location overlaid on simulated passenger (original sample, N=34).
Figure 6 shows the results for vertical search distance with resampled data. A one-way between-subjects ANOVA revealed a significant difference between the designs: F(3,98) = 7.17, MSE = .005, p = .0002, ηp2 = .18). The redesigned avatar (Design 4) had a 30.49% smaller vertical search distance than Design 1. Pairwise comparisons (holm correction) revealed that the main effect is attributable to the lower vertical search distance for Design 4 when compared to the other three designs.
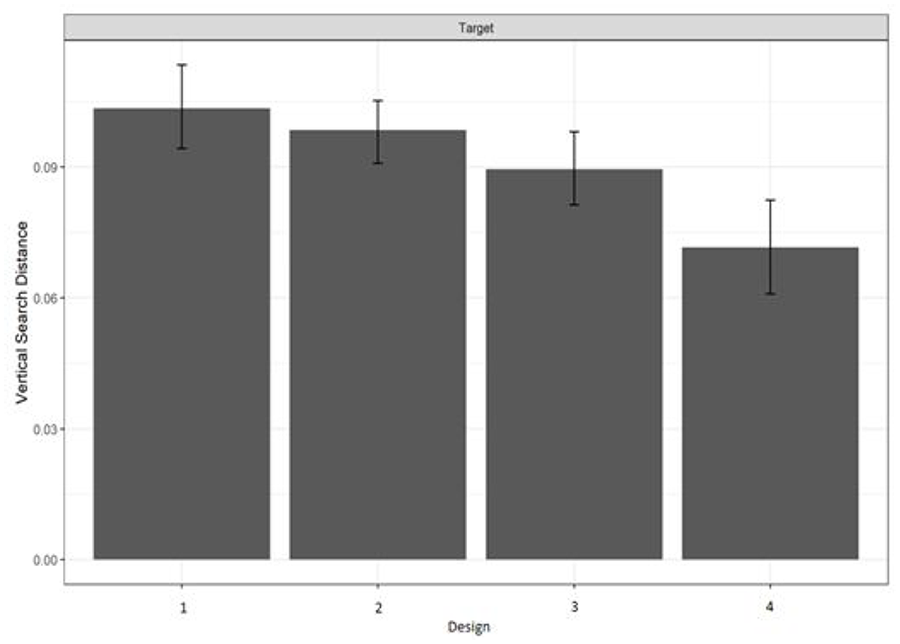
Vertical search distance using resampled data (N=102). Error bars are 95% confidence intervals.
Distance-to-target – Resampled Dataset
Distance-to-target measures how close the center of a participant’s search area was to the potential threat on the passenger. Distance was calculated using the center of a participant’s search area and the center of one SME’s search area.
Figure 7 shows the center of every search area at each alarm position by system for the 34 screeners. Figure 7 demonstrates that the center of each search area is positioned near the expected location of the target and that these screeners were performing the task as intended.
Distance-to-target results by alarm location overlaid on simulated passenger. Each quadrant shows the results for a different design (original N = 34).
Figure 8 shows the distance-to-target results using the resampled dataset. A one-way between-subjects ANOVA revealed a statistically significant main effect of design: F(3,98) = 8.26, MSE = .0002, p < .0001, ηp2 = .20). A pairwise comparison (holm correction) showed that distance to the target was significantly different between Design 2 and 4 only where Design 4 was 14.97% closer to the target than Design 2.

Distance-to-target by design using resampled data (N=102). Error bars are 95% confidence intervals.
Discussion
In this study, the data from 34 participants were analyzed in a between-subjects study to compare human performance in a simulated on-person screening task with four avatar designs.
Three of the avatars were from on-person screening vendor systems. A fourth avatar was a redesign based on recommendations from Zish et al. (2021). Centroids of the search areas suggest that security screeners were able to estimate the location of a possible threat and could accurately complete the task. To our knowledge, this is the first study that contrasts human performance data for the avatars of four on-person screening systems.
Because the final sample size retained for analyses was smaller than a power analysis would have predicted, we used a resampling method to simulate additional data. The results of that simulation revealed that when security screeners were using the redesigned avatar, their vertical search areas were smaller than all other systems. Furthermore, distance to the target was closer for the redesigned avatar than at least one other avatar.
These improvements in human performance have several possible benefits for on-person screening:
Improved estimation of the target location may increase the likelihood that targets would be found.
A smaller search area height may result in less contact with the passenger which makes the screening process more comfortable and efficient for passengers and screeners.
A smaller search area may increase checkpoint throughput as screeners are spending less time performing pat-downs on passengers.
The results are being used to inform a design guide that will encourage vendors to use better designs in the future.
When asked for additional comments, security screeners said that they liked the segments or gridlines on two of the avatar designs, stating that they help “pin-point an area of interest” and determine “where [they] should pat-down the passenger.” Quotes similar to these suggest that, when provided with landmark information, security screeners will use the information available to narrow their search.
If security screeners were using landmarks, should the legacy system that included 21 segments have outperformed the redesigned avatar which had 11 segments? After all, security screeners stated that they would use landmark information that they were given. One explanation for why the additional segments may have resulted in a larger search area is that the segments crossed and were close enough to create boxes. The impression of boxes can lead security screeners to search the entire area of the box, even when it is unnecessary.
Converging evidence for this behavior comes from one screener who stated: “I think the [segments] were helpful in that they served to remind you of searching the whole area that the alarmed threat area encompasses.” This quote suggests that some security screeners may interpret the boxes as a reminder, in principle or in expectation, to check an entire zone in which the alarm was found. Therefore, additional segments may start acting more as search area boxes and less like landmarks used for orientation—especially when an alarm is split between multiple boxes as is shown in Figure 9.

An example of an avatar with additional segments that form boxes.