
Abstract
This study examined the impact of experience on individuals’ dependence behavior and response strategies when interacting with imperfect automation. 41 participants used an automated aid to complete a dual-task scenario comprising of a compensatory tracking task and a threat detection task. The entire experiment was divided into four quarters and multi-level models (MLM) were built to investigate the relationship between experience and the dependent variables. Results show that compliance and reliance behaviors and perfor- mance scores significantly increased as participants gained more experience with automation. In addition, as the experiment progressed, a significant number of participants adapted to the automation and resorted to an extreme use response strategy. The findings of this study suggest that automation response strategies are not static and most individual operators eventually follow or discard the automation. Understanding individual response strategies can support the development of individualized automation systems and improve operator training.
Introduction
Automated/autonomous technology has become an integral part of our daily lives, from self-driving cars and drones to intelligent personal assistants and robots. If used properly, they offer many benefits such as improved safety (Gombolay et al., 2018; Luo et al., 2021) and performance (Luo, Du, & Yang, 2022; Wickens & Dixon, 2007), and reduced operator workload (Lu, Zhang, Ersal, & Yang, 2019; Luo et al., 2021).
Since the seminal paper by Parasuraman and Riley (1997), research has extensively explored aspects of automation use and the impacts on human-automation team performance. These as- pects range from general, such as synthesizing the literature to estimate when automation performs well enough for the benefits to outweigh the costs (Wickens & Dixon, 2007), to the specific, by conducting a laboratory experiment to examine how automation error types affect performance (Dixon, Wickens, & McCarley, 2007). In the former, they found that performance is sensitive to the automation imperfections and estimated that automation performing correctly less than 70% of the time may not be worth using. In the latter, they found that human-automation team performance deteriorates differently based on the automa- tion error type; false-alarm prone automation has been consid- ered more damaging to performance than miss-prone automation. Others mentioned that this performance detriment is furthered when operators place undue trust and dependence on the automation (Lee & See, 2004; Parasuraman & Riley, 1997). Individual traits and task specific factors have also been explored, such as the effects of workload and age on automation dependence (McBride, Rogers, & Fisk, 2011). They found that the performance and compliance of younger adults was affected by the workload, while older adults did not change as the workload increased.
However, there is a gap regarding how automation use changes as operators repeatedly use automation. To address this gap, we conducted a laboratory experiment investigating how human operators change their decision-making and response strategies with increased use of imperfect diagnostic automa- tion.
Dealing with uncertainty
Human interaction with diagnostic automation, a form of automation that analyzes raw information and infers the status of the world (Wickens & Dixon, 2007), is considered decision- making under uncertainty (Manzey, Gérard, & Wiczorek, 2014; Meyer, 2004; Sorkin & Woods, 1985; Wang & Yang, 2022; Yang, Unhelkar, Li, & Shah, 2017). As the most basic form of diagnostic automation, binary diagnostic automation categorizes the world into ‘signal present’ and ‘signal absent’ and alerts the human (often in the form of an alarm) once a signal is detected. The human operator is typically responsible for the final decision concerning if a signal is actually present.
Compliance and reliance refer to how an operator responds to automation alarms/non-alarms (Meyer, 2001, 2004). Compliance quantifies the human’s response during an automation alarm and reliance quantifies the human’s response when the automation is silent (i.e., non-alarm). The availability of alarm validity information (AVI) adds complexity to the operator’s decision-making process (Allendoerfer, Pai, & Friedman-Berg, 2008; Sorkin & Woods, 1985). AVI is defined as information that can be used to validate the alarm or non-alarm; it reduces uncertainty in the operator’s decision-making by informing about the ground truth. Compliance and reliance can be further divided, based on availability of AVI, into blind compliance and reliance, and verified compliance and reliance. The blind responses are categorized by when the operator blindly follows the automation’s alarms/non-alarms. Verified responses are categorized by when the operator verifies the automation’s alarms/non-alarms with additional information, such as AVI. For example, if a smoke detector started ringing, someone could comply with the alarm and evacuate immediately (i.e., blind compliance) while others could search the area for fire or smoke before deciding to exit (i.e., verified compliance).
Extreme response strategy
Prior research analyzed the occurrence of blind compliance and reliance and identified the use of the extreme response strategy. An extreme response strategy occurs when the operator either uses or discards the automated aid (Bliss, Gilson, & Deaton, 1995). Theoretically, the rational operator could use information about automation performance and situational specific consequences (costs and benefits) to model the outcome. They could then calculate a threshold and decide to always use or ignore the alarm to maximize their performance. This strategy was noted in the findings of Bliss (1993), where a small number of participants (just under 10%) resorted to an extreme response strategy. The participants appeared to be sensitive to alarm performance: they applied an extreme disuse strategy to automation that was 25% correct and an extreme use strategy to automation that was 75% correct. In a subsequent review, Bliss (2003), compared extreme response strategies of groups informed about collective alarm performance to groups that could access AVI (trial specific information to validate the alarm). They found that the participants who could not vali- date alarms were much more likely to resort to an extreme use response strategy. Building upon the findings of those studies, Manzey et al. (2014) did a controlled laboratory study with 4 experiments and examined the effects of having AVI, effort to validate alarms, and workload on response strategies. In addition to finding that AVI directly impacted operator response strategies, there was a reduced amount of cry wolf effect (coined from Breznitz (1984)) and AVI access increased operator sensitivity to non-alarms.
Our study differs from previous work by examining how people adapt their strategies to the automation throughout the experiment. We hypothesized that participants would adapt to the automation and adjust their strategies as they increase their experience with the automated aid.
Methods
Participants
A total of 41 (25 males, 15 females, and 1 person who did not disclose gender information) university students (mean age = 24.05 years old, SD = 3.49) with normal or corrected to nor- mal vision participated in the experiment. Upon completion of the experiment, the participant received US$20 with an oppor- tunity to earn a performance bonus ranging from $1 to $5.
Apparatus and stimuli
The experimental displays were presented on a HP 24 in. monitor, with a 1920 x 1200 resolution. Participants used a Logitech Extreme 3D Pro joystick to interact with a simulated surveillance drone. Each participant performed 100 trials (each lasting 10 seconds) of a dual task scenario, which consisted of two simultaneous tasks: a compensatory tracking task and a threat detection task (Du, Huang, & Yang, 2020; Yang et al., 2017). Participants could only see one task display at a time and every trial began on the tracking task display. During the trial, participants could choose to toggle between task displays; this would occur a 0.5 second delay. An imperfect diagnostic automated aid would provide a binary recommendation about status of threats. Both displays can be seen below in Figure 1.
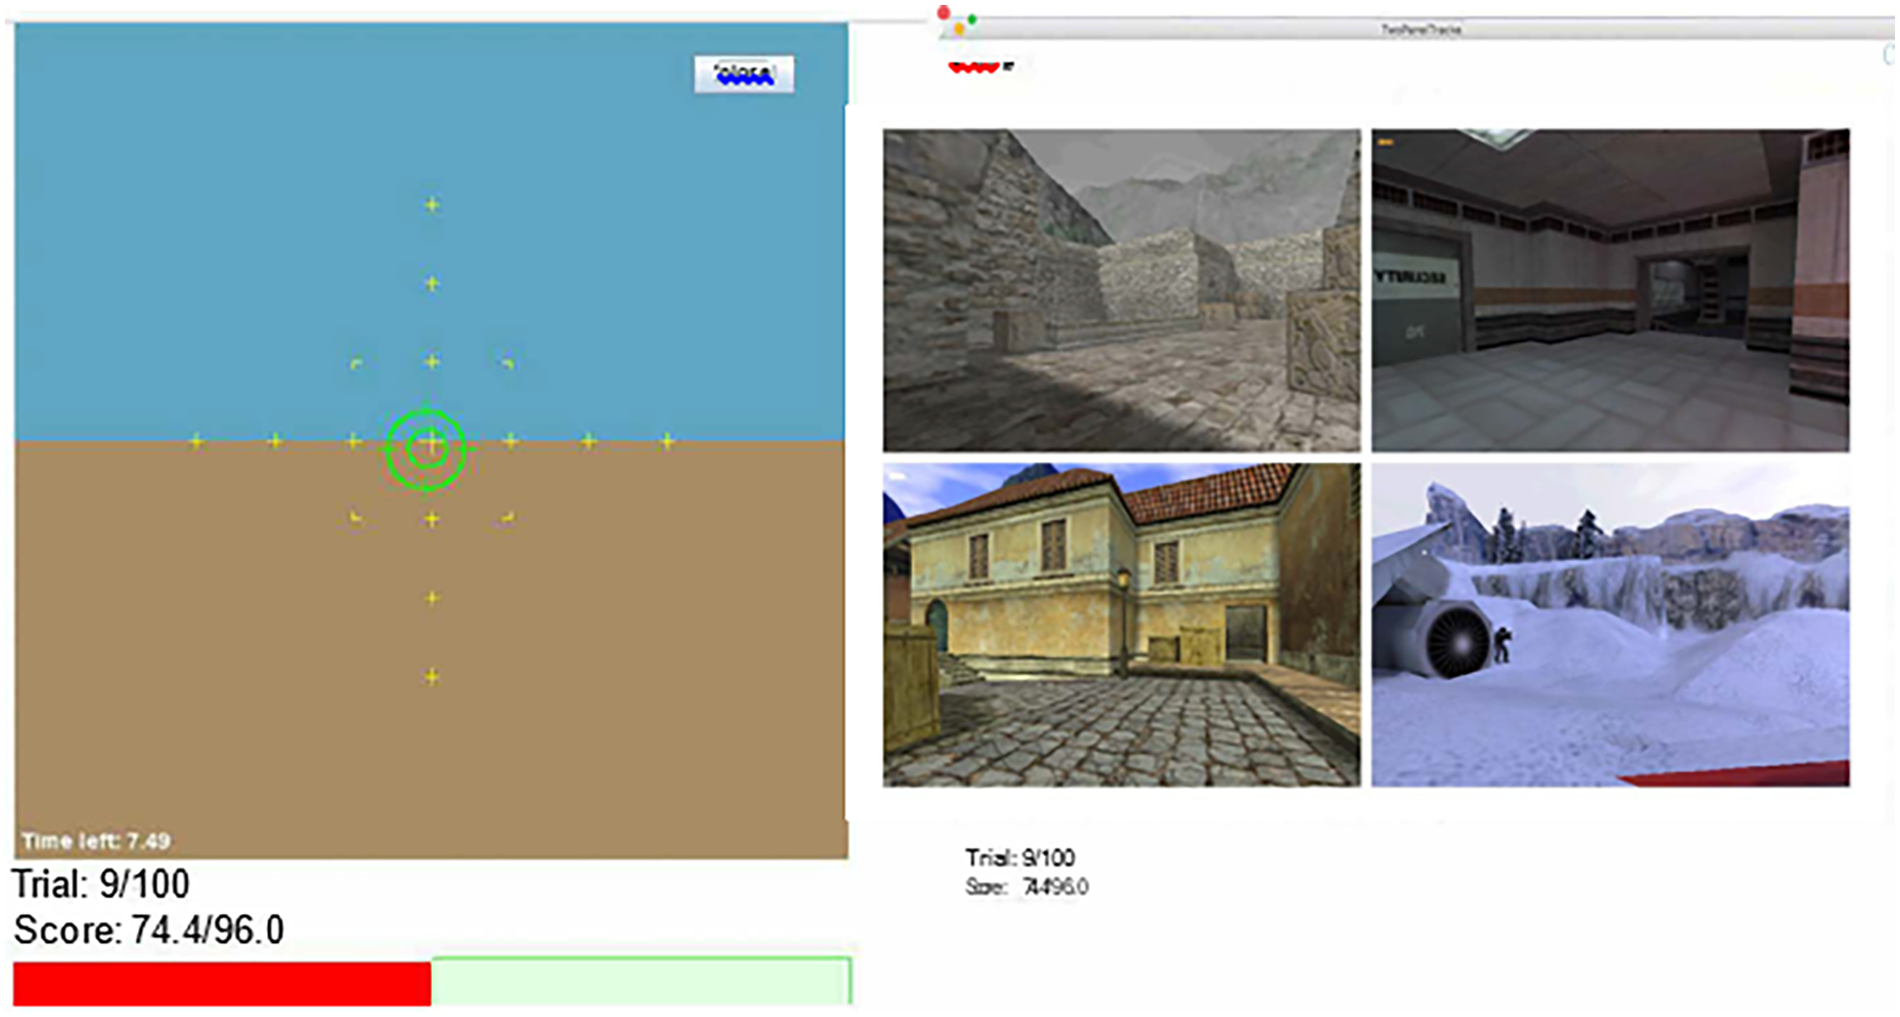
The tracking task is on the left and 4 static photos are on the right, only one display could be seen at a time.
Tracking Task
The tracking task was programmed based on the Psychology Experiment Building Language (PEBL) (Mueller & Piper, 2014). Participants used a joystick to center a randomly drifting green circle over a static, central cross-hair. During each trial, 10 points could be earned based on tracking task performance. Tracking error was defined as the pixel distance between the cross-hair and circle and it was collected at a frequency of 20 Hz. We calculated the RMSE from each trial’s tracking error. The RMSE distribution from a previous study (Yang et al., 2017) was used to calculate a 10-bin histogram and determined the corresponding tracking score (out of 10).
Threat Detection Task
During each trial, participants were provided with a new set of 4 static photos, which could potentially display threats. Threats were presented as human figures and only 1 threat was shown at a time. There were no distraction stimuli and participants were instructed to treat every human figure as a threat. Threats were uniformly distributed across the four images. Participants could earn up to 5 points for each threat detection task, with a linear time penalty for threat de- tection time. An participant’s incorrect detection (false alarm or miss) would result in a threat detection score of 0 for that trial. If participants correctly determined no threat, it would result in 5 detection task points - as no action was required. The following calculation was used during hits: Detection Score = 5- 5*(detection time/ total trial time).
Automated Aid
For the threat detection task, participants were supported by an imperfect automated aid, which would make a binary recommendation on the status of status of threats (“safe” or “danger”) through audio and visual alarms. However, the participants were ultimately responsible for choosing to re- port a perceived threat, which was done via the joystick’s trigger. We set the base rate to 30% (i.e., the amount of true signals) after bench-marking prior literature (Du et al., 2020; McBride et al., 2011; Wiczorek & Manzey, 2014; Yang et al., 2017). Of the 100 trials, there were 21 hits, 59 correct rejections, 11 misses, and 9 false alarms.
Procedure
Participants were recruited via email and invited to the lab. Upon arrival, they completed an informed con- sent form and begin training to become familiar with the scenario. During training, participants completed 30 practice trials of only the tracking task, followed by 8 practice trials of the dual task scenario. No automation likelihood information was disclosed to participants. A 3-second countdown preceded each trial and performance feedback was provided immediately after each trial. A required 5-minute break was given after the 50th trial.
Independent and dependent variables
This study focused on the effects of repeated automation use on operators’ compliance and reliance behaviors. Therefore, we divided the experimental session (100 trials) into 4 quarters (Q): Q1 = trials 1-25, Q2 = trials 26-50, Q3 = trials 51-75, and Q4 = trials 76-100.
The first set of dependent variables were dual task performance scores and the operator’s compliance and reliance rates. In particular, we were interested in the operator’s blind com- pliance and blind reliance behaviors, defined as the probability that the human follows the automation’s recommendation with- out cross-checking the raw information and calculated using the following equations.
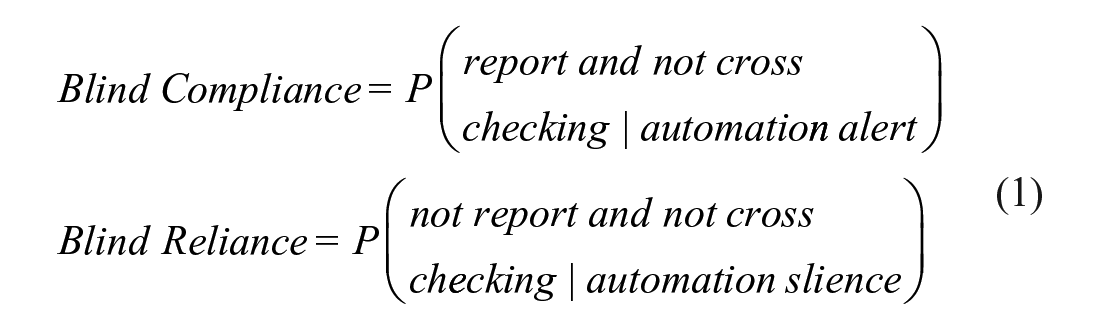
An additional dependent variable of interest was the operator’s extreme automation use/disuse behaviors. According to prior research (Manzey et al., 2014), the participant applied an extreme strategy when he/she blindly complied with or relied on automation more than 90% or less than 10% of the time. In this study, the term extreme use refers to extreme high blind compliance and extreme high blind reliance (>90%), the term extreme disuse refers to extreme low blind compliance and extreme low blind reliance (>10%). Finally, we examined the proportion of time spent on the tracking task display (tracking task time/ total trial time) for each quarter.
Data Analysis
We used multi-level modeling (MLM) to analyze the relationship between the independent variable and dependent variables, using the ‘nlme’ package in R (version 4.2.2). Following the standard procedure for MLM building (Hofmann, Griffin, & Gavin, 2000), we started simple and grad- ually added complexity to our models. Next, we used the Analysis of Variance (ANOVA) test to compare the Akaike information criterion (AIC) scores between the simpler and more complex model, which determined whether the latter model was needed. Quarters of experiment were nested within par- ticipants, as this was a repeated measures design. In addition to the MLMs, the McNemar’s test (Eliasziw & Donner, 1991) was performed to determine whether the proportions of extreme use/disuse strategy users was equal in the beginning (Q1) com- pared to the end (Q4) and a continuity correction was applied. The alpha for all statistical tests was set to 0.05.
Results
Performance
The experimental quarter had a significant effect on the total performance score, t (122) = 8.14, p<0.001. The random-slope random-intercept model was used and β1 = 14.75. When separating performance scores by task, the threat detection scores remained stable throughout the experiment while tracking task scores improved (details in Table 1).
Mean and SD values for performance scores, reliance and compliance rates.

Blind Compliance
There was a significant effect of experimental quarter on operators’ blind compliance rates t(122) = 3.99, p<0.001. The random-slope random-intercept model was used and β1 = 0.09. As the experiment progressed, the blind compliance rates increased from 0.29 to 0.54, while the SD in- creased from 0.36 to 0.46. Box-plots with compliance rates in each quarter can be seen below in Figure 2.
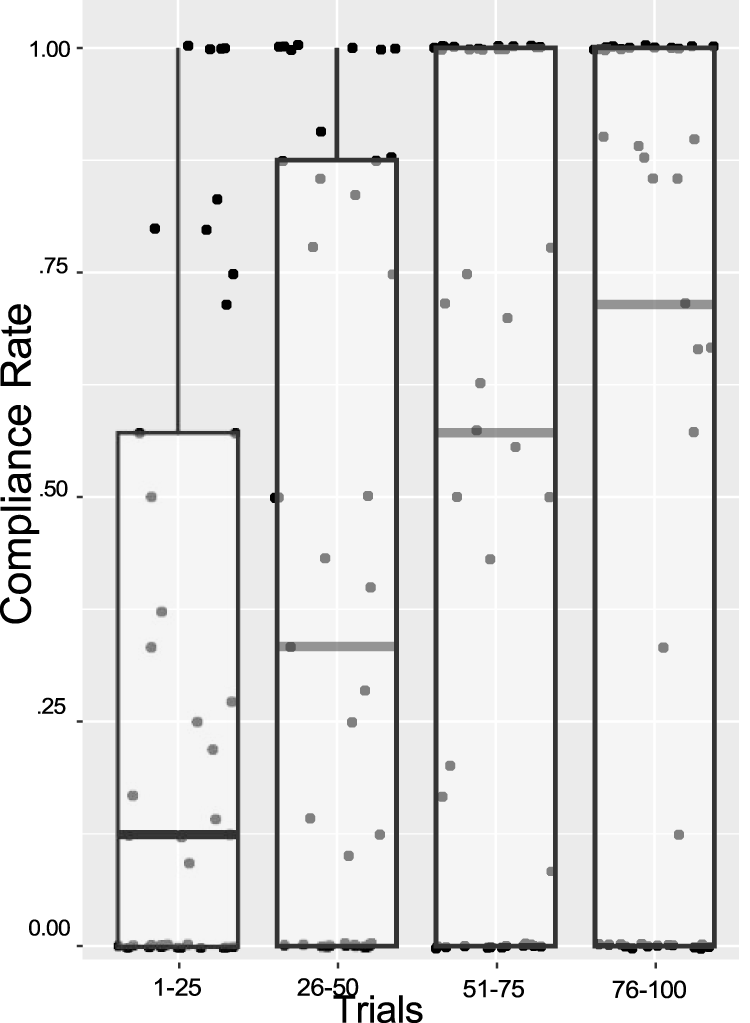
Box-plots illustrating operators’ blind compliance rates (Y axis), divided into quarters of the experiment.
Blind Reliance
There was a significant effect of experimental quarter on operators’ blind reliance rates t (122) = 3.76, p<0.001. The random-slope random-intercept model was used and β1 = 0.07. As the experiment progressed, the mean blind reliance rates increased from 0.44 to 0.65, while the SD remained fairly stable (it shifted from 0.36 to 0.39). Box-plots with reliance rates in each quarter can be seen below in Figure 3.
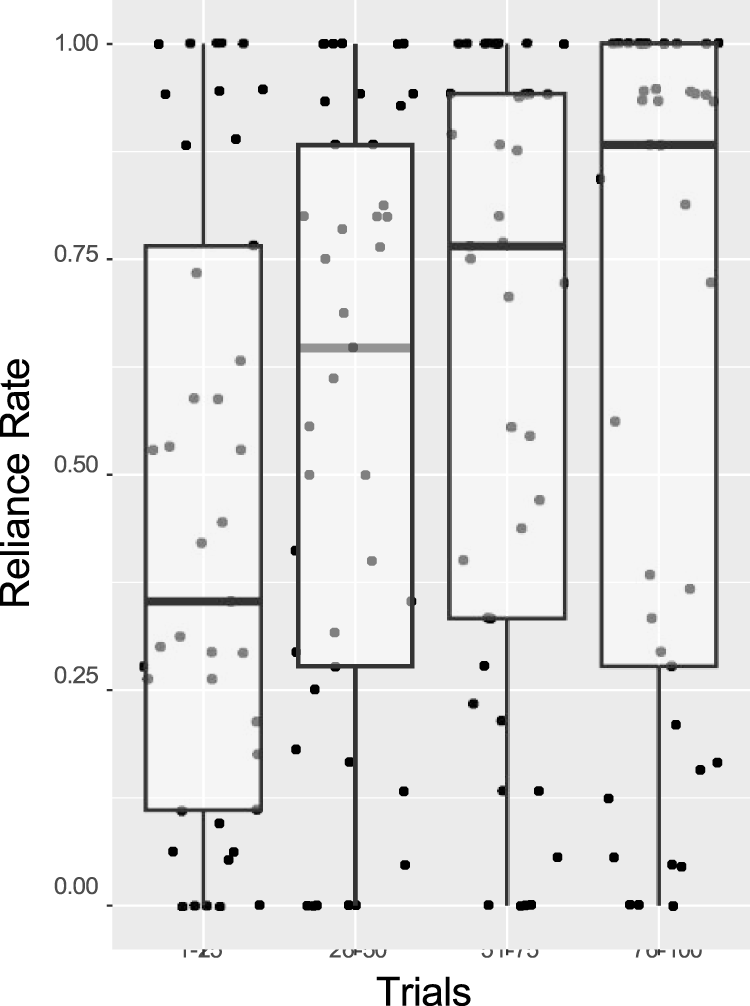
Box-plots illustrating operators’ blind reliance rates (Y axis), divided into quarters of the experiment.
Extreme Use/Disuse
As the experiment progressed, the count of participants applying an extreme use strategy increased while the count for extreme disuse decreased (see Table 2). A significant difference in extreme high blind compliance counts was found between the beginning and end of the experiment χ~ (1) =7.56, p= 0.01. A significant difference was found in extreme high blind reliance counts between the beginning and end of the experiment χ~ (1) =10.08, p <0.01. No significant differences were found for the extreme low blind compliance (p=0.39) or low blind reliance (p=0.51).
Counts of participants with extreme automation use/disuse in response to alarm or non-alarm states.

The largest shift of participants (n = 7) to an extreme high compliance strategy occurred during Q3. Participants steadily shifted to an extreme high reliance strategy (n = 5) during Q2, Q3 and Q4. By quarter 4, the number of participants resorting to an extreme high compliance (n = 15) and extreme low compliance (n = 16) strategy were roughly equal. The number of participants applying an extreme high reliance strategy more than doubled from the beginning (quarter 1 = 8) to the end (quarter 4 = 20) of the experiment. Participants could resort to an extreme strategy during only alarms, only non-alarms, or they could have applied the extreme strategy to both; which is why the Q4 counts in Table 2 sum up to 57 for the 41 participants. The box-plots (Figures 2 and 3) display the group’s increasing median compliance and reliance rates. Proportion of time spent on the tracking task also illustrated the group’s eventual collective extreme use/disuse strategy. Participants increased the proportion of time spent on the tracking during the first half of the experiment: 89% in Q1, 92% in Q2, 94% in Q3, 94% in Q4.
Discussion
We predicted that participants would adjust their automation response strategy throughout the experiment. To test this, we examined operators’ performance, compliance, and reliance across the 4 quarters of the experiment. Our results showed that compliance and reliance significantly increased and per-Trials formance significantly improved. When specifically examining the performance score by task, the tracking task performance improved throughout the experiment while the threat detection task performance remained the same. The tracking improvement likely stems from participants spending more time focusing on that task. This is similar to other research Du et al. (2020), they noted how automation was used as an attention management tool instead of a tool that directly improved the task associated with the automated aid.
When examining compliance and reliance rates for the group, we see that operators generally increased their compliance and reliance rates throughout the experiment. Similar to prior results (Du et al., 2020; Manzey et al., 2014; Schuler & Yang, 2022; Wickens & Dixon, 2007), the changes in com- pliance and reliance behaviors were not random and appear to be systematic responses to alarm characteristics. In this study, the average blind compliance and blind reliance rates gradually became closer to the automation alarm and non-alarm performance as the experiment went on; the group appeared to use what has been referred to as a probabilistic matching strategy. The probabilistic matching strategy is a heuristic where the human’s blind compliance and reliance rates roughly mirror the automation alarm/non-alarm performance (Bliss, 2003; Bliss et al., 1995; Dorfman, 1969).
When examining individual operator strategies, we see that the majority of individuals were not using a probabilistic matching strategy, but instead adapted an extreme response strategy. Our results show a significant change in the counts of extreme use strategy, people were increasing the amount of extreme high compliance and reliance. The extreme automation use strategy seems logical since the automation’s performance was above the threshold calculated by Wickens and Dixon (2007), where automation benefits outweigh the costs of errors. Our results also show that participants using the extreme disuse strategy did not significantly change during the experiment. During non- alarms, extreme use (n=20) was eventually preferred over extreme disuse (n=6). The number of participants using a extreme alarm use and disuse strategy was roughly equal by the last quarter. The differences in alarm and non-alarm response strategies are likely due to the differences in automation’s alarm and non-alarm performances. More people adapted an extreme use strategy when the automation was clearly performing well (during non-alarms it was 84% correct) than when it was un- clear (during alarms it performed 70% correctly). The shift to extreme strategies appears to vary between alarm and non-alarm states and more research is warranted to explore this further. For extreme alarm responses, there was one fairly large shift of 7 participants to extreme alarm use in the third quarter. We can see a more gradual shift in participants who eventually chose an extreme non-alarm use strategy, with about 5 people changing to extreme non-alarm use in each of the last 3 quarters. Participants eventually may have found that extreme response strategy removed the burden of using AVI to validate automation’s recommendation, allowing participants to maximize their attention resources and performance in dual task scenarios (Bliss, 1993; Du et al., 2020; Wiczorek & Manzey, 2014).
This study has the following limitations: first, no automation likelihood information was provided to participants, each participant was required to estimate how well the automation performed. Second, we only examined the decision-making and response strategies for one automation performance level. Future research studies should manipulate the automation’s perfor- mance during alarms and non-alarms to examine how operators adjust their strategies.
Conclusion
Our study aim was to examine how decision-making and response strategies change as operators increase their experience with imperfect diagnostic automation. Our results show that mean performance, compliance, and reliance significantly increased during the experiment. Individual operators shifted their strategies and the majority eventually resorted to extreme automation use or disuse. Future work should expand to ex- amine how automation performance affects individual decision- making and response strategies. Understanding the individual’s strategy supports the development of individualized automation systems and can improve operator training.